Abstract
Tropical dry forests (TDFs) support biodiversity and ecosystem services but are increasingly exposed to anthropogenic and climatic pressures. Interbasin water transfers (IBWTs) reconfigure hydrology and can promote land-use/land-cover (LULC) change, yet their effects on Neotropical TDFs remain poorly quantified, particularly in Ecuador. This study characterizes LULC dynamics and drivers of forest loss in tropical dry forests within the area influenced by the Chongón–El Azúcar IBWT system (Ecuador) between 2019 and 2025. Cloud-free Sentinel-2 Level-2A mosaics were compiled for both years, and five LULC classes were mapped using seven optical bands and five spectral indices (NDVI, SAVI, MNDWI, NDCI, and NDBI) as predictors in a Random Forest (RF) classifier. The classifications showed very high performance (overall accuracy 97.89–100%; κ = 0.94–0.99). A transition matrix quantified gross and net LULC changes, and a pixel-based LASSO-penalized logistic regression related TDF loss to distance from the IBWT canal and spectral predictors (AUC = 0.9599). Between 2019 and 2025, TDF experienced a net loss of 1,223.77 ha, while agricultural land expanded by 756.21 ha, largely at the expense of forest, with most conversions concentrated within 0.15–0.30 km of the Chongón–Sube y Baja canal and around the El Azúcar reservoir. The turbid-water class in the reservoir increased by 145%, consistent with higher aquatic biomass and eutrophic conditions. Distance to the canal, low vegetation indices (NDVI and SAVI), and high water- and built-up–related indices (MNDWI, NDBI) significantly increased the probability of TDF loss, providing empirical support for 0.15–0.30 km ecological buffers and operational spectral thresholds to flag high-risk areas. We recommend redirecting agricultural expansion to already transformed soils, establishing riparian buffer strips along canals and reservoirs, strengthening nutrient management and aquatic macrophyte control, and implementing an operational satellite-based monitoring programme to inform land-use planning and the conservation of Neotropical TDFs affected by IBWT projects.
1 Introduction
Tropical dry forests (TDFs) provide ecosystem services at global and local scales, including carbon sequestration that contributes to climate change mitigation, biodiversity conservation by providing habitat for endangered species, and regulation of soil quality and the water cycle through enhanced infiltration and reduced erosion (Tabarelli et al., 2024). In addition, they supply resources such as timber, fodder, and fuelwood, supporting rural livelihoods and providing cultural benefits (Ray and Mukherjee, 2023). TDFs are mainly distributed across the tropical and subtropical belts of Latin America, Africa, and Asia, in regions where rainfall is concentrated in a short wet season, followed by prolonged dry periods of up to 8 months, with a predominance of deciduous vegetation and high rates of endemism (Tabarelli et al., 2024). Despite their ecological and socioeconomic importance, tropical dry forests remain underrepresented in conservation planning and are less studied than other tropical forest types (Schröder et al., 2021).
However, the services and values provided by TDFs are increasingly at risk due to the combined influence of anthropogenic and climatic factors (Tabarelli et al., 2024). Urban expansion, livestock farming, selective logging, and agricultural conversion fragment forests, leading to degradation and deforestation (Rivas and Navarro-Cerrillo, 2024). In parallel, prolonged drought associated with global warming increases wildfire occurrence and tree mortality and alters canopy structure (Ogaya et al., 2015; Hasnat, 2022). As a result, habitat loss, reduced biological connectivity, and biotic homogenization erode biodiversity and ecosystem services (Moura et al., 2023a,b; Shahzad et al., 2024; Tabarelli et al., 2024). Several examples illustrate the magnitude of this problem. In the Caatinga, a Brazilian tropical dry forest biome, nearly half of the original extent has been deforested (dos Santos et al., 2019); in the Chiquitano dry forest of Bolivia, nearly 1.4 million hectares were affected by a large-scale wildfire in 2019 (Romero-Muñoz et al., 2019); and the Menabe-Antimena TDFs in Madagascar, which harbor threatened and endangered species, have reported annual deforestation rates between 0.67 and 2.55% (Zinner et al., 2014). These trends indicate that TDFs are approaching critical thresholds in many regions, where additional land-use pressures may trigger irreversible losses of structural and functional integrity and endemic biodiversity.
Ecuador’s TDFs are distributed along the coast from southern Esmeraldas to the Gulf of Guayaquil, with clusters in Manabí, Santa Elena, Guayas, El Oro, and Loja (Schipper, 2020). These ecosystems are highly biodiverse but severely threatened, home to approximately 900 species, of which 18% are endemic, while only 13% of their area is under protection (Escribano-Avila et al., 2017; Rivas et al., 2020). Deforestation between 1990 and 2018 resulted in a 27.04% loss of the original extent (Rivas et al., 2021). In the Inter-Andean Dry Forest, a 45% loss was recorded between 1991 and 2017, mainly due to agricultural expansion (Rodríguez-Echeverry, 2023). Fragmentation has generated a landscape of small, isolated patches that increase edge effects, reduce connectivity and gene flow, and negatively affect biodiversity (Rivas et al., 2021; Rodríguez-Echeverry and Leiton, 2021). An estimated 62 endemic woody species are threatened, and 69% of them are not found in protected areas, while human activities such as grazing and selective logging further alter forest structure and biodiversity (Romero-Saritama, 2018; Benítez et al., 2024). In addition, soil degradation has impaired soil functionality, reducing the ecosystem’s capacity to support essential ecological processes (de Sosa et al., 2024). These impacts interact with climate change, contributing to the decline of suitable habitat for several tree species (Aguirre et al., 2017). In this context, any new driver of land-use change, such as large-scale Inter Basin Water Transfer (IBWT) schemes, may further erode the remaining TDF remnants and compromise their long-term persistence in Ecuador.
Anthropogenic pressure on dry forests is not limited to direct land occupation; large hydraulic infrastructures, particularly IBWT projects, alter flow regimes and ecological connectivity in arid and semi-arid regions (Pittock et al., 2009). Over the last decade, remote sensing has become a key approach for assessing these impacts, as it provides consistent time series and synoptic coverage across extensive, often remote areas (Abbaszadeh Tehrani et al., 2022). Several studies combining Landsat, Sentinel-2, or Unmanned Aerial Vehicle (UAV) imagery with spectral indices such as the Enhanced Vegetation Index (EVI), Normalized Difference Vegetation Index (NDVI), or Remote Sensing Ecological Index (RSEI) have quantified vegetation loss, erosion, and changes in water quality associated with large-scale water-transfer projects such as the South-to-North Water Transfer Project in China, the All-American Canal in the United States, and the São Francisco interbasin transfer in Brazil (De C. Teixeira et al., 2013; Mattson et al., 2024; Wang et al., 2024). Although these studies demonstrate the capacity of remote sensing to detect riparian deforestation, aquifer subsidence, and post-transfer eutrophication, most published applications focus on Asia and the United States, leaving significant gaps in the Neotropics, including Ecuador, where TDFs are already highly vulnerable (Rivas et al., 2020; Wang et al., 2025).
In the Chongón–El Azúcar system, which forms part of the Daule–Santa Elena IBWT scheme on Ecuador’s central coast, increased surface-water availability has promoted agricultural and urban expansion in the surrounding area (Troya, 2014). This expansion has led to the replacement of native vegetation by monocultures and to reductions in TDF extent, habitat availability for endemic species, and plant diversity (Zemp et al., 2019). Moreover, recent assessments of the Daule–Santa Elena system have documented governance and management deficiencies and the need to improve the efficiency and equity of irrigation-water distribution, prompting reforms to strengthen public management of the scheme (Baque Narda and Merchán Ponce, 2024). This lack of regional evidence highlights the need for multi-temporal remote-sensing studies that integrate LULC-change analysis to understand how IBWT projects such as Chongón–El Azúcar can amplify land-use pressures on TDF through water-enabled agricultural and urban expansion (Dong et al., 2016). Therefore, it is essential to identify and quantify land-cover changes in TDF and to determine which anthropogenic land uses are replacing TDF within the area influenced by the Chongón–El Azúcar water-transfer system in Ecuador.
In this context, this study aims to characterize land-use and land-cover dynamics in the tropical dry forests influenced by the Chongón–El Azúcar water-transfer system. Specifically, we (i) map LULC classes for 2019 and 2025 using Sentinel-2 time series, spatial analysis, and supervised classification with the Random Forest (RF) algorithm; (ii) quantify net and gross land-cover transitions, with emphasis on TDF losses and gains; and (iii) identify which anthropogenic land uses, particularly agriculture and built-up areas, are replacing TDF and where these changes are concentrated within the canal and reservoir influence zone, where irrigation water availability is highest. The resulting LULC products and change analyses provide local decision-makers with an operational basis for monitoring the conservation status of tropical dry forests, regulating the expansion of water-dependent agricultural and industrial activities, and supporting land-use planning, including the designation of priority areas for the conservation of endemic-rich TDF remnants and the sustainable development of their ecotourism potential.
2 Materials and methods
2.1 Study area
The area of interest (AOI) corresponds to the area of influence of the Chongón–El Azúcar transfer system, located between the provinces of Guayas and Santa Elena and forming part of the Santa Elena Hydraulic Project (PHASE), which began construction in 1978 to bring water from the Daule River to the Chongón Reservoir and distribute it to Santa Elena [Empresa Pública del Agua (EPA-EP), 2015] (Figure 1). Between 1995 and 1997, the Chongón–Sube y Baja canal, approximately 20 km long, was built to connect with the Cauchí/Bejuco (Cachul) River and distribute water from the Chongón Reservoir to the El Azúcar Reservoir (Troya, 2014). Subsequently, in 2014, the San Vicente Reservoir was supplied with water through the Chongón–Sube y Baja canal [Empresa Pública del Agua (EPA-EP), 2015]. To delineate the area potentially influenced by the transfer on TDF, we defined a 7 km buffer around the Chongón–Sube y Baja canal and the Cauchí/Bejuco (Cachul) River section connecting the Chongón and El Azúcar reservoirs. This distance was selected after visual inspection of multi-temporal Sentinel-2 mosaics and high-resolution imagery, which showed that irrigated plots, access roads, and the main clusters of forest-to-agriculture conversion are concentrated within a few kilometers of the canal–reservoir system, whereas beyond approximately 7 km the landscape is dominated by more continuous TDF and land-use patterns that are only weakly connected to the transfer. The 7 km buffer, therefore, provides an operational approximation of the IBWT influence zone rather than an administrative or hydrological boundary.
Figure 1
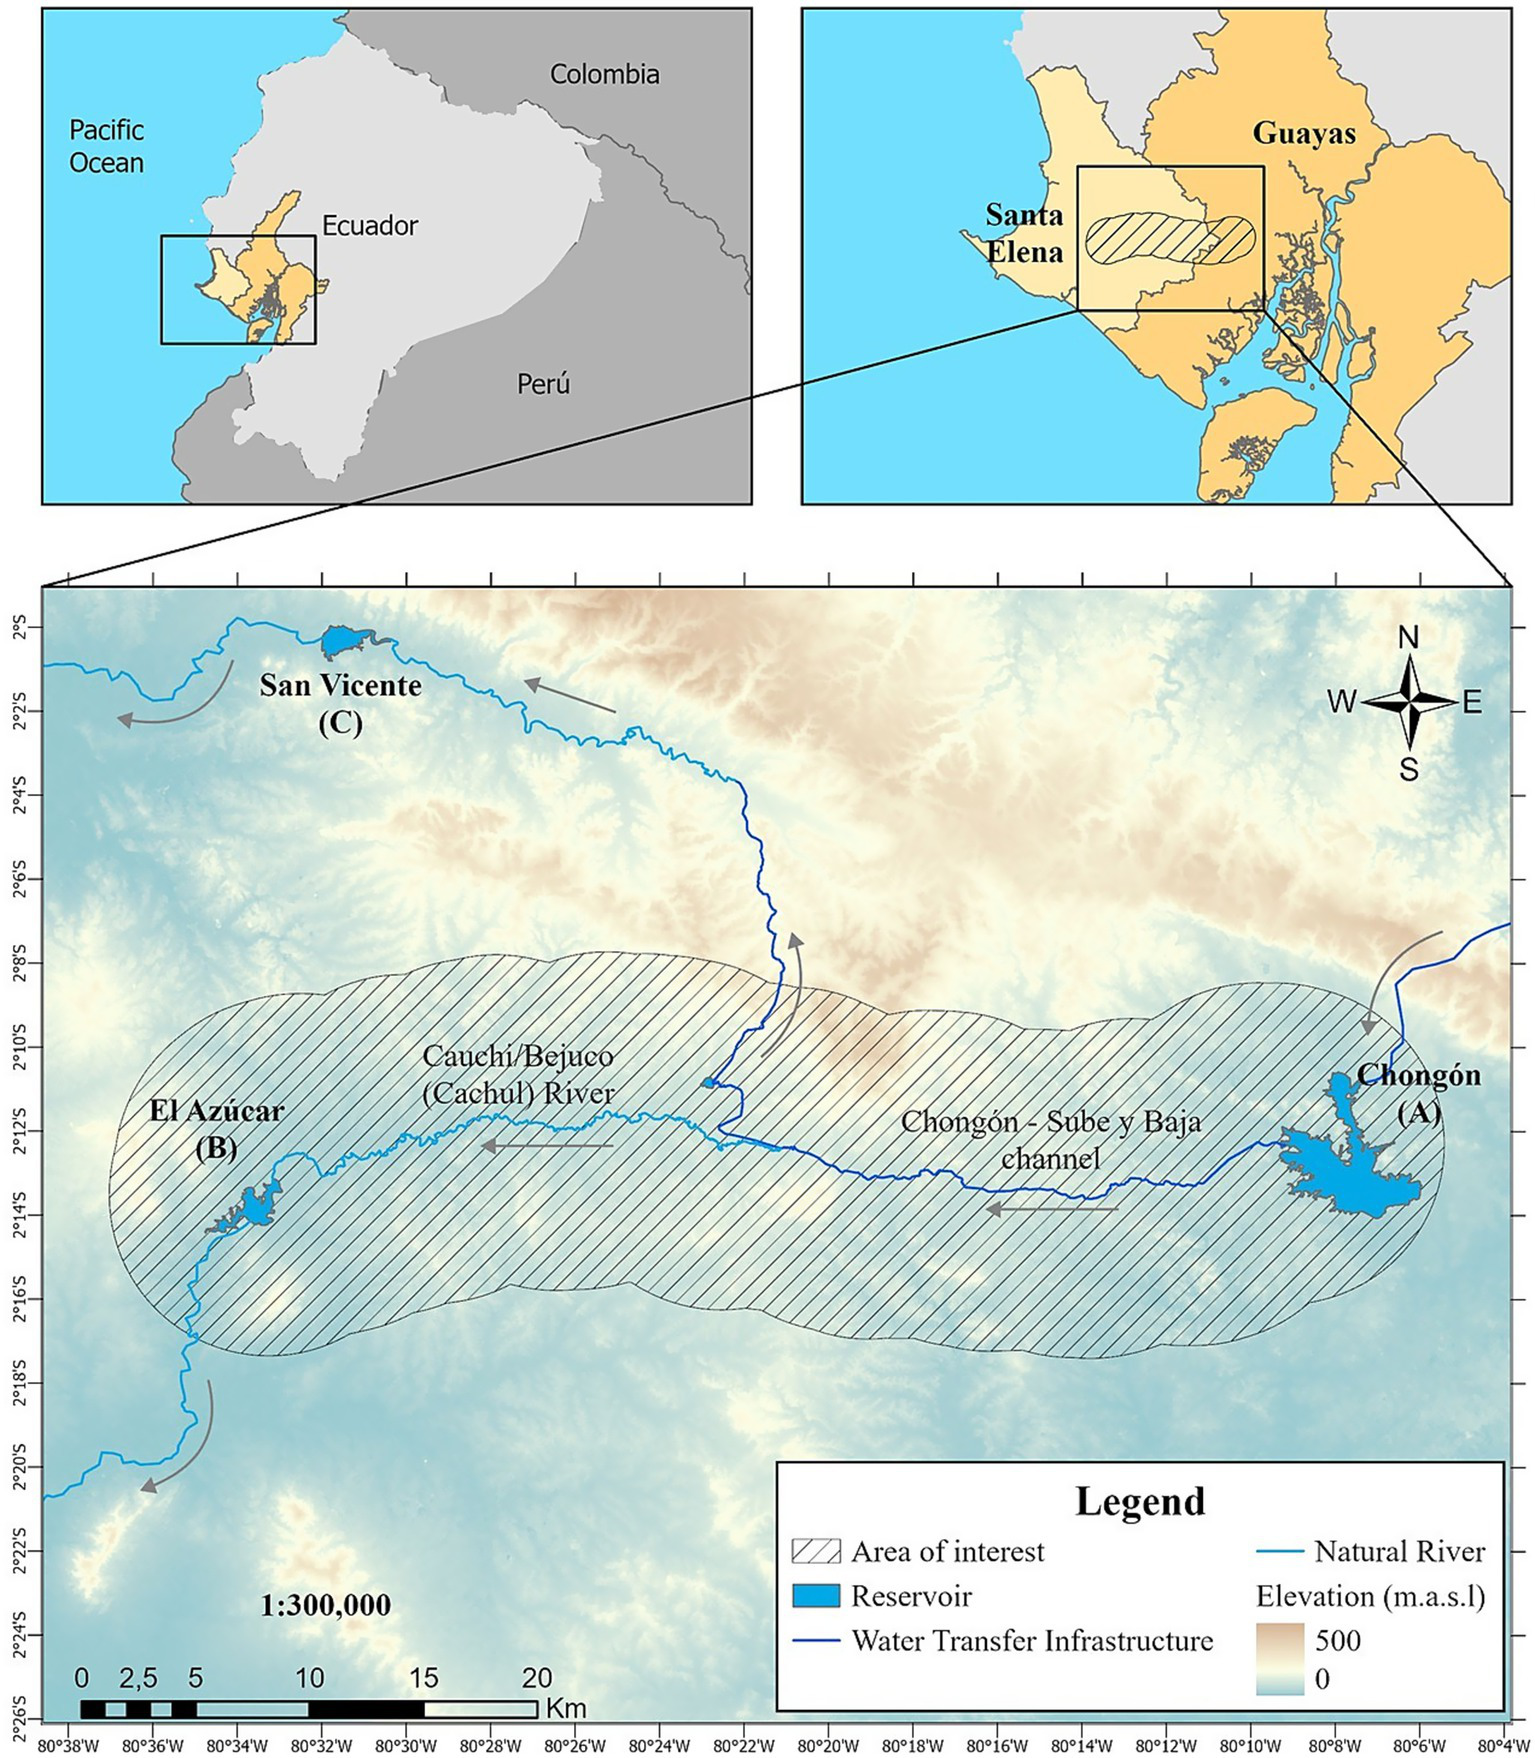
Study area (7 km buffer) and location of the Chongón (A), El Azúcar (B), and San Vicente (C) reservoirs. Coordinate system: WGS84/UTM 17 South. Digital Elevation Model (DEM) modified from (Spacesystems, N., and Team, U. S. /Japa. A. S, 2019).
The transfer system crosses the tropical dry forest ecosystem associated with the southeastern part of the Chongón Colonche mountain range and the protective forest of the same name, characterized by a pronounced seasonal climate, with annual rainfall below 800 mm, wet months (January–April), and a marked dry season (May–November) [INAMHI (Instituto Nacional de Meteorología e Hidrología), 2013; Jadán et al., 2022; NASA, 2025]. The dry season and low temperature variability (22.5 °C–26.6 °C) classify the climate as AW under the Köppen classification, a tropical savanna climate with a dry winter (Alvares et al., 2013; Jadán et al., 2022; NASA, 2025).
2.2 Methodology
The methodology was divided into three phases: (i) search and composition of Sentinel-2 Multispectral Instrument (MSI) image mosaics without cloud cover; (ii) calculation of spectral indices and Land Use/Land Cover (LULC) classification using Random Forest (RF); and (iii) identification of LULC changes by calculating the transition matrix (Figure 2).
Figure 2
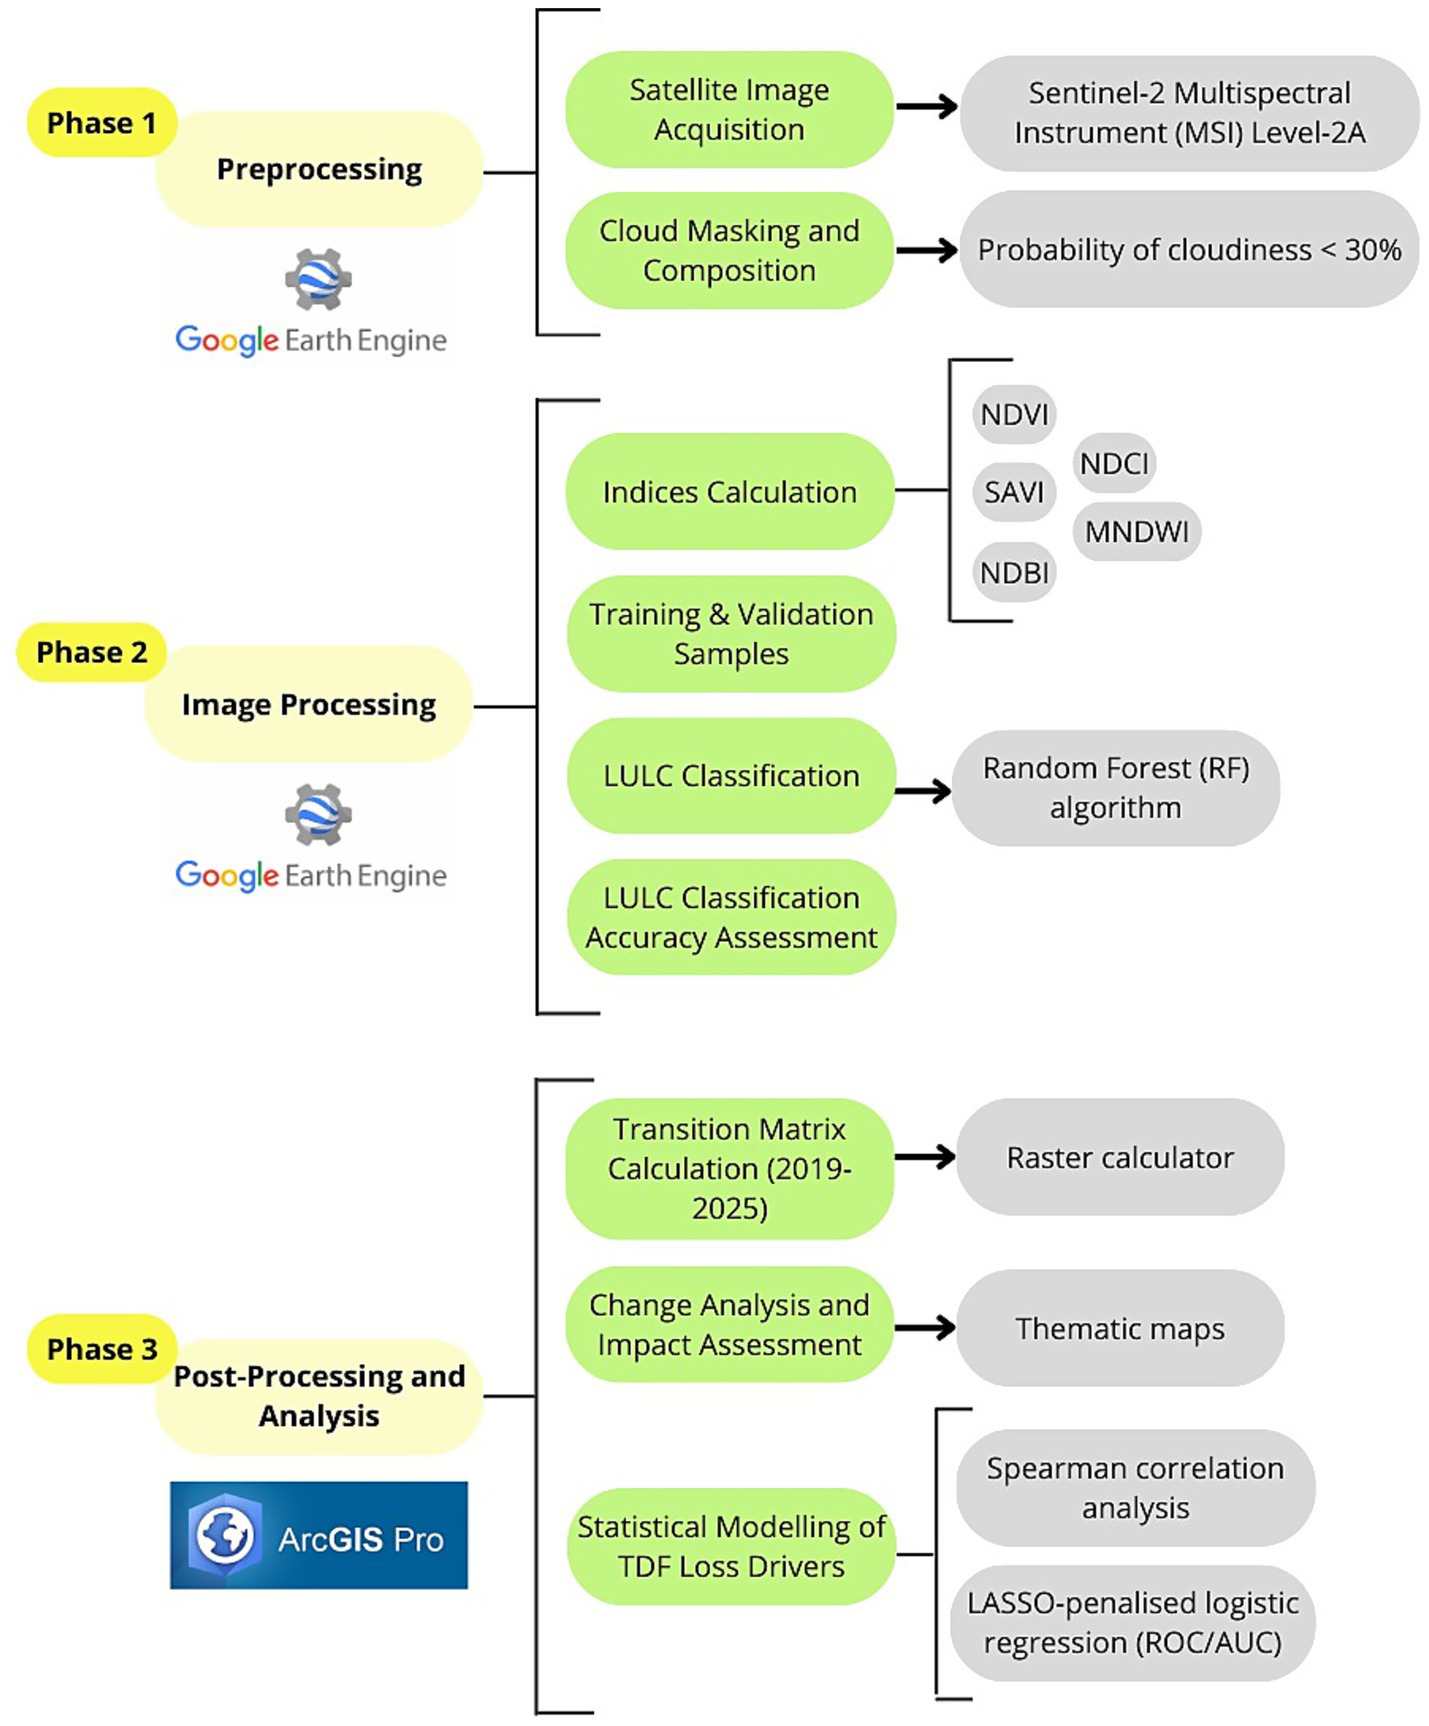
Flowchart of the applied methodology.
2.2.1 Phase I: preprocessing
2.2.1.1 Satellite image acquisition
Sentinel-2 MSI images from satellites 2A and 2B were used, corresponding to level 2A (atmospherically corrected and orthorectified surface reflectance), from the COPERNICUS/S2_SR_HARMONIZED collection available on the GEE platform (Google Earth Engine, 2023). This collection includes spectral bands B1–B12 with spatial resolutions between 10 and 60 meters (m), depending on the band, and is widely used for calculating spectral indices, land cover classification, and monitoring environmental changes (Google Earth Engine, 2023). The AOI shapefile was exported to the GEE repository and projected to the WGS 1984/UTM Zone 17S coordinate reference system to retrieve images for two analysis periods: January 1 to June 17, 2019, from which 22 images were obtained, and January 1 to June 17, 2025, from which 23 images were obtained. From each image, only seven spectral bands were used (Table 1).
Table 1
| Name | Spatial resolution | Wavelength in (nm) | |
|---|---|---|---|
| S2A | S2B | ||
| Blue (B) | 10 m | 496.6 | 492.1 |
| Green (G) | 10 m | 560 | 559 |
| Red (R) | 10 m | 664.5 | 665 |
| RedEdge | 20 m | 703.9 | 703.8 |
| Near Infrared (NIR) | 10 m | 835.1 | 833 |
| Water Vapor (WV) | 60 m | 945 | 943.2 |
| Short-Wave Infrared 1 (SWIR-1) | 20 m | 1613.7 | 1610.4 |
Sentinel-2 comprises two different satellites: Sentinel-2A (S2A) and Sentinel-2B (S2B).
Although they carry the same type of MSI sensor, the optical filters and calibration are not 100% identical, so they have different wavelengths in nanometers (nm) (Google Earth Engine, 2023).
Earlier Landsat scenes were initially explored to extend the time series to pre-transfer and construction-phase conditions. However, pervasive striping artifacts, data gaps, and greater cloud contamination, combined with Landsat’s coarser spatial resolution, prevented the derivation of consistent, high-quality LULC maps for those years. For this reason, the temporal analysis focuses on the 2019–2025 period, for which cloud-free Sentinel-2 Level-2A mosaics with suitable radiometric and spatial quality could be compiled.
2.2.1.2 Cloud masking and composition
To minimize cloud interference in the images, the masking and mosaic composition functions maskEdges and maskClouds were implemented, respectively. MaskEdges was initially applied to images from the COPERNICUS/S2_SR_HARMONIZED collection to extract pixels with cloud cover detected by the RedEdge 4 and Water Vapor bands, which are sensitive to geometry and atmospheric conditions. The maskClouds function was applied to this collection, incorporating data from the S2_CLOUD_PROBABILITY collection to replace pixels with a cloud probability greater than 30%. Once the masking functions were applied, the 2019 and 2025 mosaics were created by computing the median pixel value over the defined time range. Finally, the mosaics were clipped to the AOI, and an RGB composite image was generated for each year.
2.2.2 Phase II: image processing
2.2.2.1 Spectral indices calculation
Using RGB compositions, five dominant classes were identified in the AOI: TDF, Clear water, Turbid water, Agriculture, and Built-up Area (Table 2). To improve class identification, spectral indices were calculated. Spectral indices are mathematical combinations of reflectance values at different wavelengths, used in remote sensing to quantify specific surface characteristics (Martinuzzi et al., 2024). Based on the LULC types identified in the RGB composites, vegetation-, surface water-, and built-up-related spectral indices were computed and subsequently added as new bands to the 2019 and 2025 mosaics to improve class discrimination and Random Forest (RF) performance (Table 3). This approach has been widely adopted in recent studies (Ghezali and Boukhemacha, 2024; Velastegui-Montoya et al., 2024).
Table 2
| Class | Description |
|---|---|
| TDF | Areas with woody vegetation and dense or open scrubland, dominated by deciduous species. |
| Clear water | Water bodies with low or no turbidity, sediment, or aquatic plant biomass. |
| Turbid water | Water bodies with high turbidity, sediment, or aquatic plant biomass. |
| Agriculture | Areas of agricultural use with abundant, little, or no vegetation cover. |
| Built-up area | Areas with human settlements, buildings, infrastructure, and associated bare soils. |
LULC classes that make up the AOI, along with their descriptions.
TDF, tropical dry forest.
Table 3
| LULC type | Index name | Equation | Use | References |
|---|---|---|---|---|
| Vegetation | Normalized Difference Vegetation Index (NDVI) | Biomass and vegetation vigor | Rouse et al. (1974), and Desai et al. (2024) | |
| Soil Adjusted Vegetation Index (SAVI) | Vegetation on bare soil | Huete (1988), and Dadzie et al. (2025) | ||
| Surface water | Modified Normalized Difference Water Index (MNDWI) | Water bodies | Xu (2006), and Raj et al. (2023) | |
| Normalized Difference Chlorophyll Index (NDCI) | Clorofila en aguas turbias | Mishra and Mishra (2012), and Yılmaz et al. (2025) | ||
| Construction area | Normalized Difference Built-up Index (NDBI) | Built-up areas | Zha et al. (2003), and Santra et al. (2020) |
Spectral indices calculated in GEE and added as bands to the compositions for 2019 and 2025.
2.2.2.2 Training and validation samples
In both years, sampling was performed for each multiband composition, consisting of the seven original bands and the five spectral indices (Tables 1, 3). Representative polygons for each LULC class (TDF, Agriculture, Clear water, Turbid water, and Built-up area) were manually digitized at a scale of 1:10,000 across the AOI (Table 2). Polygons were placed in homogeneous regions, avoiding obvious edge pixels and mixed pixels. They were spatially dispersed along the canal–reservoir system and its surroundings to improve the representativeness of the samples with respect to the study area and to reduce short-range spatial clustering. From these polygons, all pixels belonging to each class were extracted so that the total number of samples per class corresponds to the sum of the pixels contained within all polygons delineated for that class (Table 4).
Table 4
| Class | Number of samples per year | |
|---|---|---|
| 2019 | 2025 | |
| TDF | 112,228 | 119,559 |
| Clear water | 21,195 | 5,153 |
| Turbid water | 835 | 3,097 |
| Agriculture | 25,382 | 21,485 |
| Built-up area | 579 | 578 |
| Total | 160,219 | 149,872 |
Number of samples (pixels) used for training and validation of LULC classification in 2019 and 2025.
The samples from each year were then randomly split at a 70/30 ratio for training and validation of the Random Forest (RF) classifier in GEE. The training set was used to train the classifier (classifier.train()), allowing the model to learn the spectral patterns associated with each class. Once trained, the validation set was used to evaluate the model’s performance by computing the confusion matrix and deriving overall accuracy (OA), kappa coefficient (κ), producer’s accuracy (PA), and user’s accuracy (UA) (Congalton, 1991). Because training and validation pixels were extracted from manually digitized polygons within the same landscape, some degree of spatial autocorrelation between both datasets is expected; therefore, the reported accuracy metrics should be interpreted as optimistic, upper-bound estimates of classification performance.
2.2.2.3 LULC classification using random Forest
Random Forest (RF) is a supervised machine learning algorithm used for classification, regression, and other predictive tasks. It is based on constructing multiple decision trees and combining their results to make more accurate predictions (Breiman, 2001). RF was selected for this study because of its robustness to noisy predictors, its ability to model non-linear relationships, and its consistently strong performance in recent remote sensing LULC classification applications. In both LULC scenarios, a similar sequence of steps was performed with the corresponding multiband composition for each year. First, we created an RF classifier with 100 trees (ee.Classifier.smileRandomForest(100)). Next, the train() method received the training samples, the LandUse property as a class label, and the list of 12 predictors (seven bands and five indices) as input variables, allowing the algorithm to learn the spectral patterns associated with each category. Subsequently, the trained models were applied to the multiband compositions of the scenarios using the classify() method of the ee.Image class, generating two rasters with class codes from 1 to 5. Finally, a spatial majority filter was applied to reclassify small groups of isolated pixels based on the predominant value of their neighborhoods, thereby reducing salt-and-pepper noise (Fan et al., 2021).
2.2.2.4 LULC classification accuracy assessment
The performance of the RF classifier was evaluated for both the 2019 and 2025 scenarios, with confusion matrices calculated on the validation set. First, the trained model was applied to the validation samples, and then a matrix was generated using errorMatrix(‘LandUse’, ‘classification’) in GEE. From this, the OA (accuracy()), κ (kappa()), PA (producersAccuracy()), and UA (consumersAccuracy()) were derived. Complementarily, the matrix was obtained on the training set using classifier.confusionMatrix(), used only for diagnostic purposes, not to estimate final performance.
2.2.3 Phase III: post-processing and analysis
2.2.3.1 Transition matrix calculation (2019–2025)
The classified and filtered rasters for 2019 and 2025 were exported to ArcGIS Pro, where they were reprojected to the WGS 1984 UTM Zone 17 South coordinate system with a 10-m cell size. When importing into ArcGIS Pro, a new class was identified that corresponds to pixels outside the study area. This class was excluded using the Set Null function, and the Spatial Analyst Tabulate Area tool was applied to both rasters. The Value field of each raster was used to distinguish the categories, and the processing cell was set to 10 m. The tool counted, for each class of 2019 (rows), the area that transitioned to each 2025 class (columns). Because the system used meters, the results were obtained in square meters (m2) and then converted to hectares (ha). The table was exported to Excel, and a transposed matrix was generated to improve interpretation, aligning with the representation in the literature (Velastegui-Montoya et al., 2024), in which each row corresponds to a class from 2025 and each column to a class from 2019.
2.2.3.2 Change analysis and impact assessment
Once the transition matrix was obtained, it was used to analyze land-cover changes. With these results, the magnitude and spatial distribution of coverage changes were evaluated, identifying the classes with the most significant gains or losses, and providing a synthetic index of the transfer’s pressure on each land use.
2.2.3.3 Statistical modelling of TDF loss drivers
To statistically assess the association between the Chongón–El Azúcar interbasin water-transfer system and the loss of tropical dry forest (TDF), we constructed a pixel-based dataset from classified LULC maps. The response variable forest-cover change (FC) was defined at 10-m resolution as a binary indicator of TDF loss: FC = 1 for pixels classified as TDF in 2019 and as a non-TDF class (agriculture, built-up area, turbid water, or clear water) in 2025, and FC = 0 for pixels that remained classified as TDF in both years. All other pixels were excluded from the analysis. The predictor variables (Table 5) included (i) Euclidean distance to the main transfer canal and reservoirs (dist_canal, m), used as a proxy for access to irrigation water; (ii) surface reflectance in the Blue, Green, Red, Red-Edge, NIR, Water vapor, and SWIR-1 bands derived from the 2019 Sentinel-2 mosaics; and (iii) the 2019 NDVI, SAVI, MNDWI, NDCI, and NDBI indices, which capture vegetation greenness and stress, surface-water conditions, and built-up signals.
Table 5
| Type of variable | Variable | Description |
|---|---|---|
| Predicted variable | ||
| Response variable | Forest-cover change (FC) | Binary indicator of TDF loss: FC = 1 for pixels classified as TDF in 2019 and as a non-TDF class in 2025; FC = 0 for pixels classified as TDF in both years. |
| Predictor variables | ||
| Proximity | Distance to IBWT (dist_canal) | Euclidean distance (m) to the main transfer canal and reservoirs, used as a proxy for access to irrigation water. |
| Spectral bands | Blue, Green, Red, Red-Edge, NIR, Water vapor, SWIR-1 | Surface reflectance in the 2019 mosaics, capturing biophysical gradients related to vegetation, moisture, and substrate. |
| Spectral indices | NDVI (nd), SAVI (nd_1), MNDWI (nd_2), NDCI (nd_3), NDBI (NIR_1) (2019) | Vegetation greenness and stress, surface water, and built-up signals derived from the 2019 mosaics. |
Response and predictor variables used in the statistical modelling of TDF loss.
All predictor variables were standardized to a mean of 0 and a variance of 1 to avoid scale effects in the model. The resulting data set was exported from GEE and analyzed in RStudio (Phan et al., 2020). We first performed an exploratory data analysis, computing descriptive statistics (mean, standard deviation, and quartiles) and Spearman’s rank correlation coefficients among predictors and between predictors and FC, in order to characterize their distributions and monotonic associations. Correlation magnitudes were interpreted following conventional thresholds (e.g., |ρ| ≈ 0.2–0.39, weak; 0.4–0.59, moderate; 0.6–0.79, strong; ≥0.8, very strong) (Qiu et al., 2023).
We then fitted a binary logistic regression model (logit link) to evaluate the influence of the predictor variables on the probability of TDF loss (Wang et al., 2022). The general form of the model is:
Where FCi is the forest-cover change status (0 or 1) for pixel i, Xik is the value of predictor k for pixel i, and βk are the regression coefficients. Each coefficient βk was interpreted as the change in the log-odds of TDF loss associated with a one-standard-deviation increase in the corresponding predictor, holding the other predictors constant.
Model performance was evaluated using the receiver operating characteristic (ROC) curve and the area under the curve (AUC) (Bera et al., 2020). AUC values range from 0.5 (no discrimination, equivalent to random allocation) to 1 (perfect discrimination). Following common practice in ecological modelling, AUC values greater than 0.7 were considered indicative of acceptable model performance (Chen et al., 2023).
3 Results
3.1 LULC classification and accuracy assessment
The RF classification achieved slightly better performance in 2019 than in 2025. The 2019 classification obtained an OA of 100% and a κ of 0.99, indicating very high agreement between the classification and the reference data, whereas the 2025 classification achieved an OA of 97.89% and a κ of 0.94. The decrease in classification performance in 2025 is evident in the per-class metrics: the PA of the Agriculture class decreased from 99 to 87.7%, and its UA decreased from 99.03 to 97.13%, mainly due to confusion with the TDF class. The clear-water and turbid-water classes maintained PA and UA at 1 in both years. The built-up area class improved its UA from 95 to 99.27%. However, some confusion persists regarding the Agriculture class, consistent with spectral similarities associated with crop phenology, vegetation cover, and exposed soil on building surfaces. Given its small extent and higher classification uncertainty, changes in the built-up area class are interpreted qualitatively rather than used as a primary quantitative indicator of land-cover dynamics.
Importantly, the extremely high OA and κ values for 2019 also reflect the fact that training and validation pixels were extracted from manually digitized polygons within the same landscape (Section 2.2.2.2), so neighboring pixels are not entirely independent. As a result, the reported accuracies, particularly for 2019, should be interpreted as optimistic, upper-bound estimates of map performance rather than as strictly independent validation metrics. Despite this caveat, visual inspection of the maps and the consistency of the mapped patterns with known land uses in the AOI support the use of both classifications for thematic and change-detection analysis. A spatial majority filter was applied to reduce salt-and-pepper noise and improve the spatial coherence of the classified rasters. The resulting LULC maps for 2019 and 2025, along with the corresponding 2019–2025 transition matrix, form the basis for the change analysis described below (Figure 3A, Table 6). The relative contribution of each LULC class in 2019 and 2025 is summarized in a bar chart, which highlights the dominance of TDF and the increase in agriculture and turbid water over the study period (Figure 3B).
Figure 3
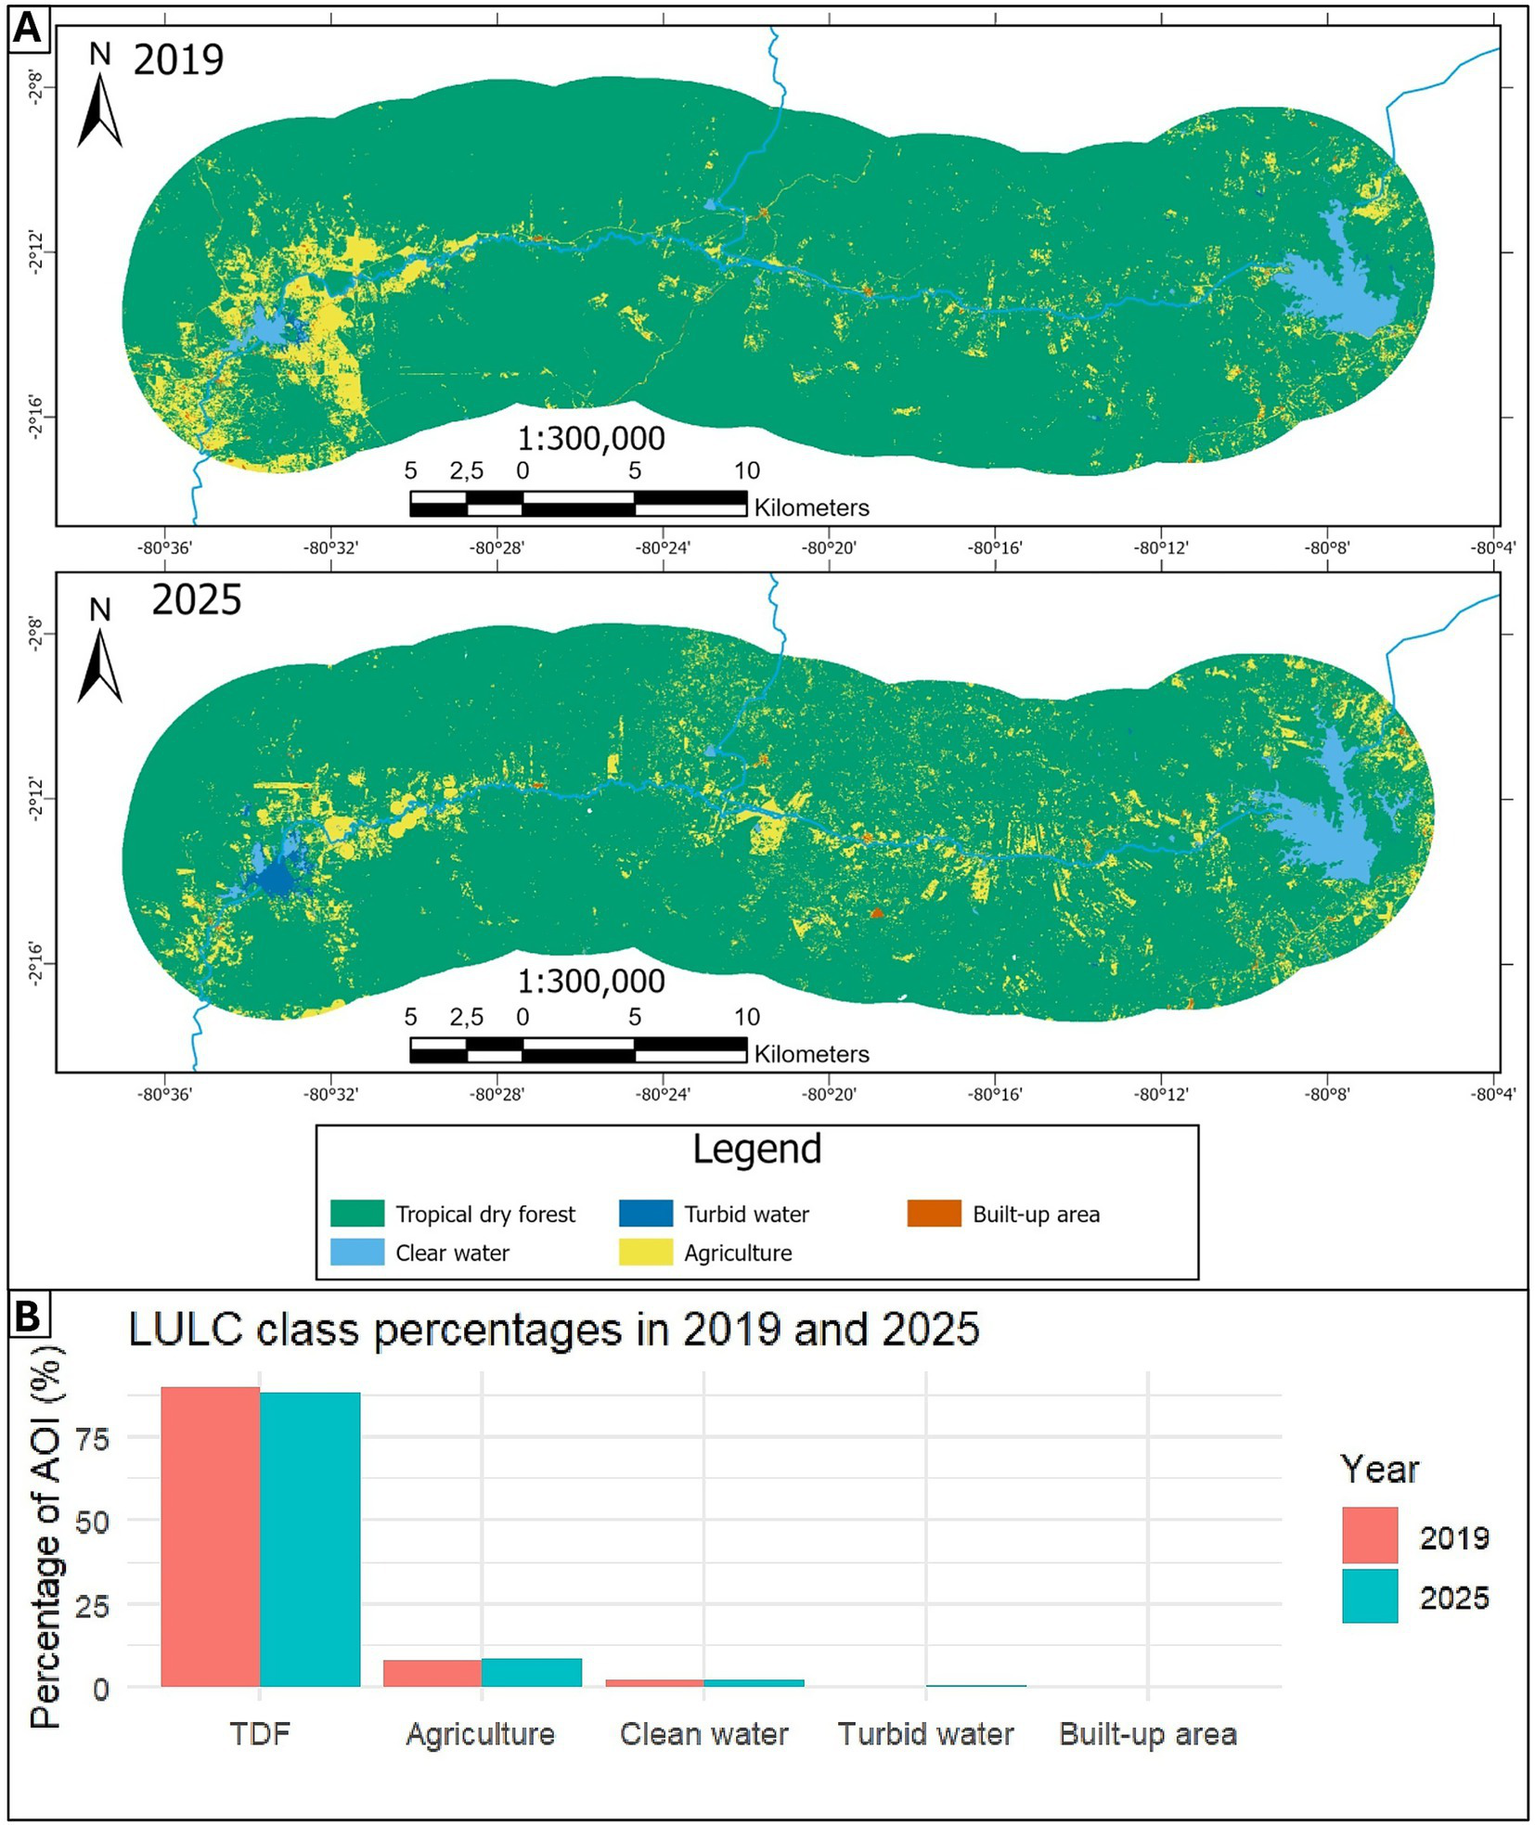
(A) Land-use/land-cover (LULC) maps for 2019 and 2025 derived from Random Forest classification of Sentinel-2 imagery. (B) Relative area (%) of each LULC class in 2019 and 2025, showing the dominance of tropical dry forest (TDF) and the increase in agriculture and turbid water over the study period.
Table 6
| LULC 2019 | |||||||
|---|---|---|---|---|---|---|---|
| LULC 2025 | TDF | Clear water | Turbid water | Agriculture | Built-up area | Total (b) | Variation (b-a) |
| TDF | 68,280.08 | 197 | 74 | 4,413.57 | 64.64 | 73,029.29 | −1,223.77 |
| Clear water | 509.29 | 1,295.66 | 26.57 | 82.66 | 2 | 1,916.18 | 249.02 |
| Turbid water | 107.56 | 167.82 | 50.78 | 68.49 | 0.39 | 395.04 | 233.88 |
| Agriculture | 5,278.72 | 6.62 | 9.65 | 1,788.72 | 63.83 | 7,147.54 | 756.21 |
| Built-up area | 77.41 | 0.06 | 0.16 | 37.89 | 60.52 | 176.04 | −15.34 |
| Total (a) | 74,253.06 | 1,667.16 | 161.16 | 6,391.33 | 191.38 | 82,664.09 | |
Transition matrix in ha.
3.2 Change analysis and impact assessment
Between 2019 and 2025, 85.57% of the area of interest (AOI) remained in the same LULC class, indicating high overall land-cover permanence (Table 6). The main change trajectories in LULC classes between 2019 and 2025 are summarized in a Sankey diagram (Figure 4). Approximately 92% of the TDF mapped in 2019 (68,280.08 of 74,253.06 ha) remained forest in 2025, while about 7% (5,278.72 ha) was converted to agriculture, and less than 1% transitioned to water or built-up classes. Conversely, nearly 69% of the agricultural land mapped in 2019 (4,413.57 of 6,391.33 ha) reverted to TDF, reflecting localized forest regrowth in the western sector near the El Azúcar reservoir. Agriculture in 2025 accounted for roughly 74% of its area from the former TDF (5,278.72 ha of 7,147.54 ha), confirming that most new agricultural land was converted from forest rather than from other land uses. A significant decrease in TDF was observed in central areas of the study zone, mainly in the vicinity of the Chongón–Sube y Baja canal, where fishbone and geometric deforestation patterns were identified. These spatial patterns and the associated class transitions are depicted in the LULC maps and the transition matrix (Figure 3, Table 6).
Figure 4
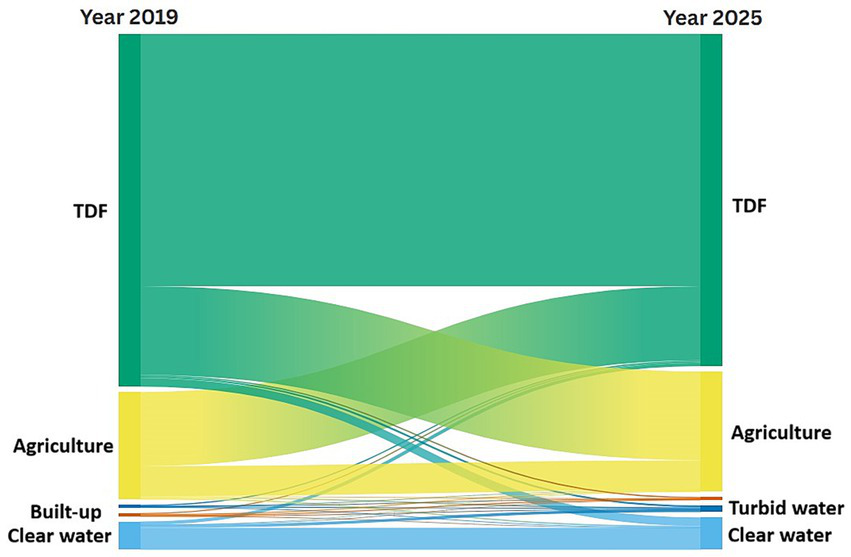
Sankey diagram of LULC change trajectories between 2019 (left) and 2025 (right).
In contrast, the natural Cauchi/Bejuco (Cachul) river section showed little deforestation. TDF had the largest net change, mainly due to displacement by agriculture. In the western part of the AOI, around the El Azúcar transfer, areas of TDF recovery were identified, occupying land previously classified as agricultural. However, despite this local TDF recovery, there was a net loss of 1,223.77 ha of TDF over the 6 years, while agricultural land increased by 756.21 ha (from 6,391.33 to 7,147.54 ha), representing an 11.8% expansion relative to its 2019 extent.
Within the AOI, the area classified as turbid water more than doubled between 2019 and 2025, increasing from 161.16 to 395.04 ha (+233.88 ha, +145%), whereas clear water increased more modestly from 1,667.16 to 1,916.18 ha (+249.02 ha) (Table 6). In the El Azúcar receiving reservoir, the turbid-water class expanded to occupy most of the reservoir surface in 2025. In the RGB composites, these waters exhibit a greenish tone, characteristic of optically complex, chlorophyll-rich conditions associated with the proliferation of aquatic plant biomass, such as floating macrophytes and algae. For the built-up area class, the RF model showed lower accuracy due to its small size and heterogeneity. Some areas with exposed soil in 2019 were classified as vegetated in 2025, which led to confusion with the TDF and agriculture classes. Consequently, built-up dynamics are considered with caution and used only to support qualitative interpretations in the discussion.
3.3 Drivers of TDF loss derived from statistical modelling
Spearman’s rank correlation analysis revealed statistically significant relationships between forest-cover change (FC) and the spatial and biophysical predictors associated with the water-transfer system (Figure 5). In particular, distance to the IBWT canal showed a moderate-to-strong negative correlation with FC, indicating that the probability of TDF loss increases systematically in the vicinity of the canal and decreases progressively with distance. Consistently, the vegetation indices NDVI and SAVI exhibited negative correlations with FC, reflecting lower vegetation vigour and cover in areas more strongly influenced by the transfer. In contrast, NDBI and MNDWI showed positive correlations with TDF loss, suggesting a transition from forest cover to agricultural surfaces, exposed soils, and water bodies, reflecting the redistribution of surface water. These patterns are coherent with the transition matrix and with the agricultural expansion observed in the immediate surroundings of the IBWT (Figure 3, Table 6).
Figure 5
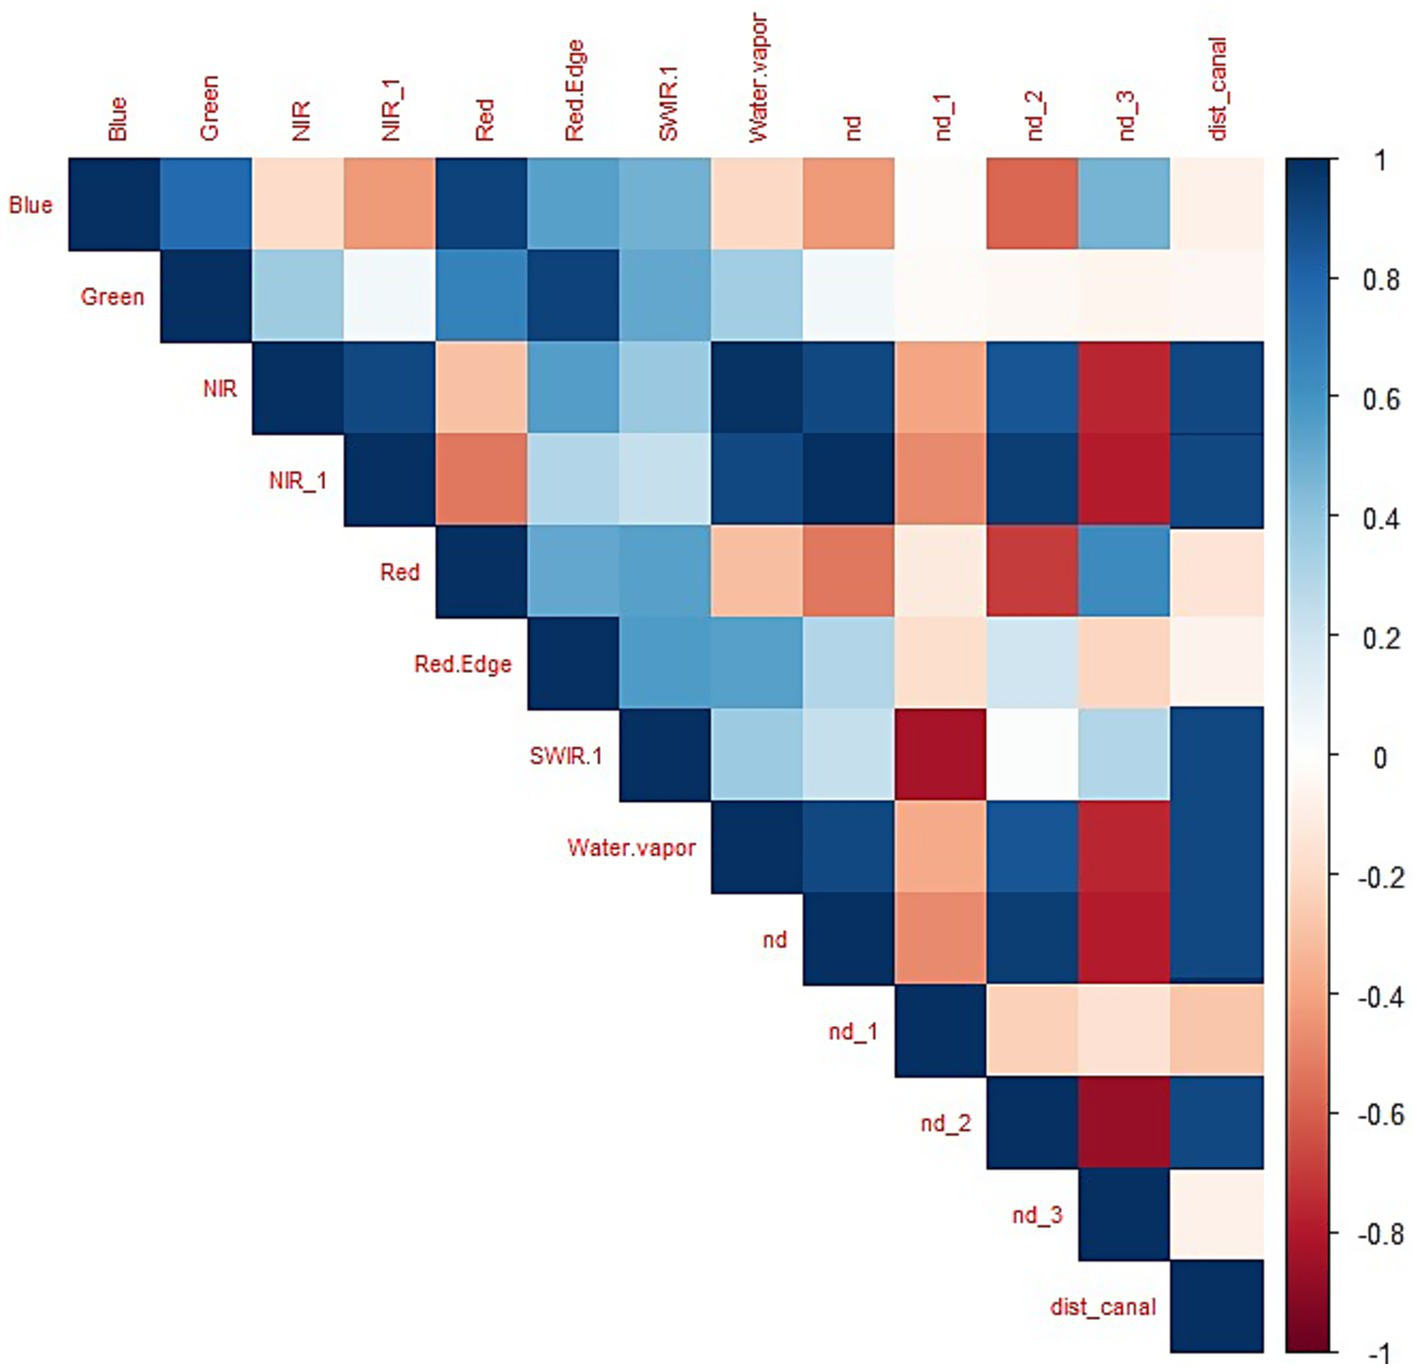
Spearman correlation matrix between forest-cover change (FC) and predictor variables.
The penalized logistic regression model (LASSO) highlighted a subset of predictors with the highest explanatory power for the probability of TDF loss associated with the IBWT system (Table 7). NDVI and SAVI displayed highly significant negative coefficients (p < 0.001 and p < 0.05, respectively), confirming that higher vegetation vigor and density are associated with a markedly lower probability of deforestation. In contrast, NDBI exhibited a positive, significant coefficient, indicating that increases in built-up and bare-soil surfaces increase the likelihood of TDF loss. Similarly, MNDWI showed a significant positive relationship with FC, suggesting that the presence of water bodies and wet areas linked to the transfer favors the conversion of forest to other land uses. The Blue and SWIR-1 bands also showed significant negative coefficients, reflecting their sensitivity to soil moisture, vegetation removal, and stress conditions, whereas Red-Edge had a significant positive coefficient, consistent with changes in photosynthetic activity along forest–agriculture transition zones. Distance to the canal remained a significant term in the model, confirming that spatial proximity to the water-transfer infrastructure is a key factor shaping the probability of forest loss.
Table 7
| Variable | Estimate | Std. error | Significance |
|---|---|---|---|
| Blue | −1.253e+01 | 8.771e+00 | * |
| SWIR−1 | −1.036e−01 | 2.113e+00 | *** |
| Red-Edge | 1.533e−02 | 2.945e+00 | *** |
| SAVI | −5.852e+02 | 7.427e+00 | * |
| MNDWI | 1.650e+0 | 3.685e+00 | * |
| NDVI | −1.299e+05 | 5.375e+00 | *** |
| NDBI | 8.633e+04 | 3.586e+00 | * |
| IBWT distance | 1.221e−05 | 3.037e+00 | *** |
| Green, Red, NIR, Water vapor, NDCI | ls | ||
Coefficients and significance of predictor variables in the LASSO-penalised logistic regression model of TDF loss.
***Significant at p < 0.001, *significant at p < 0.05 y ls low significant.
Model validation results further support the robustness of the logistic regression approach. The ROC curve shows a clear separation from the line of random classification (Figure 6), and the area under the curve (AUC) of 0.9599 indicates very high discriminatory capacity. This level of performance means that the model can reliably distinguish between pixels that experienced TDF loss and those that remained stable, confirming that the combination of spectral bands, biophysical indices, and distance to the IBWT effectively captures the spatial dynamics of deforestation in the study area.
Figure 6
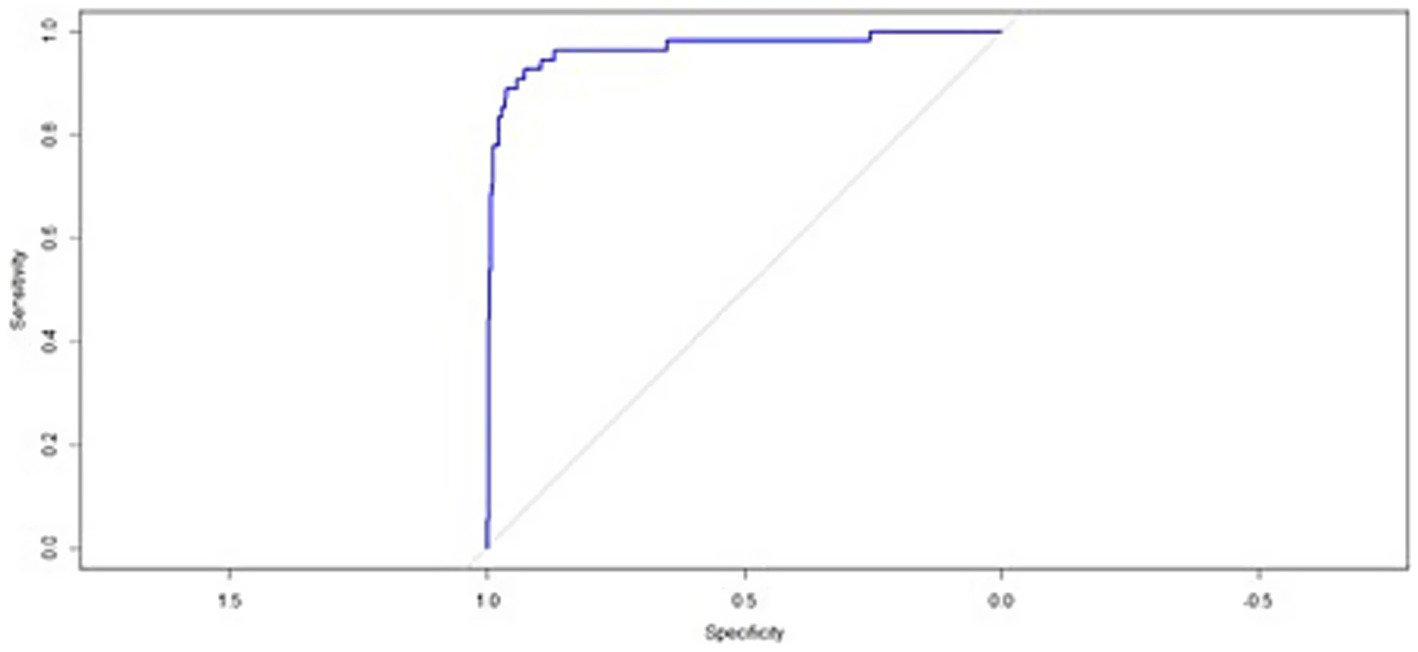
Receiver operating characteristic (ROC) curve for the logistic regression model of TDF loss.
Taken together, the spatial pattern of predicted probabilities shows that most TDF loss is concentrated within approximately 0.15–0.20 km of the Chongón–Sube y Baja canal, where the distance-to-canal coefficient is highly significant (p < 0.001), and that the likelihood of deforestation declines progressively beyond ~0.30 km. We therefore interpret buffer widths of 0.15–0.30 km as the minimum ecological distance required to reduce the risk of further TDF conversion within the transfer’s immediate influence zone. The fitted relationships between forest-cover change and spectral indices also provide operational thresholds to identify high-risk conditions: NDVI <0.45 and SAVI <0.30 indicate reduced vegetation vigor, NDBI >0 is associated with the expansion of agriculture and bare soils, and MNDWI >0.10 reflects elevated surface moisture linked to the redistribution of water by the IBWT. In parallel, the expansion of turbid water in the El Azúcar reservoir and the recurrent presence of Eichhornia crassipes are consistent with high agricultural nutrient loads, reinforcing the need for explicit nitrogen and phosphorus reduction targets in line with studies of eutrophication in comparable reservoirs. Finally, the high accuracy of the RF classifications (OA 97.89–100%) and the strong predictive performance of the logistic model (AUC = 0.9599) lend quantitative support to these management recommendations and indicate that buffer widths of 0.15–0.30 km, nutrient-control targets, and riparian-restoration strategies can be grounded in empirical evidence.
4 Discussion
Our results show that TDF was predominantly converted to agricultural land. In the LULC classification, all cropped and pasture areas were grouped into a single “Agriculture” class; therefore, individual crop types are not distinguished on the maps. However, agricultural statistics and land-use reports for the Chongón–El Azúcar region indicate that agriculture is dominated by maize and fodder grasses, with smaller areas of plums, mangoes, chia seeds, cacao, bananas, and passion fruit, as well as timber plantations such as Tectona grandis (MAG, 2020). The expansion of this agricultural matrix at the expense of TDF is consistent with the net increase of 756.21 ha of agricultural land and the loss of 1,223.77 ha of TDF quantified in the transition matrix (Table 6).
The marked increase in the turbid-water class in the El Azúcar reservoir between 2019 and 2025, together with its greenish spectral appearance, is consistent with higher chlorophyll concentrations and nutrient-enriched conditions associated with the proliferation of aquatic macrophytes and algae. These patterns are compatible with high nutrient loads from surrounding agricultural activities and may also help explain the local decline in agriculture around the reservoir due to deteriorating water quality. Unsanitary conditions and the presence of dead animals in the Cauchí/Bejuco (Cachul) River have been reported previously (GAD Parroquial Rural de Simón Bolívar, 2024). It is noteworthy that water from the El Azúcar reservoir is distributed to several regions in Santa Elena for human consumption. The apparent reduction in built-up area is most likely attributable to classification uncertainties within a small, heterogeneous class rather than to genuine land-cover change.
Previous studies have documented a sustained increase in the invasive macrophyte Eichhornia crassipes between 2000 and 2020, during which it covered approximately 80% of the water surface of the El Azúcar reservoir (Calderón, 2021). This species is an indicator of eutrophication because it feeds on nitrogen- and phosphorus-based nutrients and can exacerbate eutrophication if its biomass is not managed (Villamagna and Murphy, 2010). Several studies have proposed removing 20 ha or more per year for composting to reduce its proliferation (Calderón, 2021). Since 2013, Ecuadorian government entities have recognized El Azúcar as one of the reservoirs affected by Eichhornia crassipes and have promoted collection projects using barges, elevators, backhoes, and dump trucks to remove and dispose of the material (Subsecretaría Técnica de los Recursos Hídricos, G. N. de O. y M, 2013). In our 2019 and 2025 LULC maps, the area classified as turbid water in the El Azúcar reservoir is relatively small in 2019 but covers more than half of the reservoir surface in 2025 (Figure 3, Table 6), consistent with the documented proliferation of aquatic macrophytes in this system. These dynamics indicate that mechanical removal efforts must be sustained and complemented by measures to reduce nutrient inputs from surrounding agricultural activities to control eutrophication and improve water quality (García-Ávila et al., 2025).
It is necessary to prioritize the restoration and protection of TDF and to plan for sustainable, environmentally sustainable land use. The impact on TDFs is consistent with findings from other studies on IBWT, which document land-use reconfigurations, loss of riparian vegetation, and increased anthropogenic pressure associated with changes in flow regimes and access to water resources (Pittock et al., 2009). This study can help decision-makers understand the impacts that were not considered when the transfer was designed and implemented, which encouraged the expansion of agricultural activity in TDF areas due to easy access to water. On the one hand, the purpose of the transfer was to supply water to local communities, and the AOI was not initially considered as an irrigation area. However, in practice, water was allocated primarily to expanding agriculture in the region, displacing or impacting the flora and fauna of the TDF, as well as the community’s water quality.
Beyond the visual and cartographic evidence of land-cover change, the statistical analysis provides quantitative support for the association between the Chongón–El Azúcar water-transfer system and TDF loss. Spearman’s rank correlations showed that distance to the IBWT canal is negatively associated with forest-cover change, while water- and built-up–related indices (MNDWI and NDBI) are positively associated with the probability of TDF loss, whereas vegetation indices (NDVI and SAVI) are negatively associated with it. The LASSO-penalised logistic regression model further identified distance to the canal, NDVI, SAVI, MNDWI, and NDBI as significant predictors of TDF loss, with a high discriminatory capacity (AUC ≈ 0.96). Taken together, these results indicate that, in the absence of a longer pre-transfer time series, spatial gradients in water availability and land use around the canal and reservoirs provide consistent evidence that forest conversion is more likely in areas with increased access to irrigation water and intensifying agricultural and built-up land uses in the immediate influence zone of the transfer, even though other contextual factors (e.g., land tenure, market demand) and pre-existing deforestation trends that could not be fully reconstructed with available imagery may also contribute.
Similar ecosystem impacts occurred along the central route of the SNWDP in China, which were partially mitigated by the implementation of forest curtains and service roads. It was proposed not to intervene within a range of up to 0.1 km on either side of the canal, and to declare a protected area with controlled uses within a range of up to 0.5 km (Dong et al., 2016). In our case, the probability of TDF loss peaks within approximately 0.15–0.20 km of the Chongón–Sube y Baja canal and declines beyond about 0.30 km, suggesting that minimum buffer widths on the order of 0.15–0.30 km are required to effectively protect remnant TDF in the immediate influence zone of the transfer. Another documented impact is the decrease in river flow, accompanied by increased pollutant discharges. For this reason, Li et al. (2013) suggest ensuring ecological flows, nutrient control, and protection strips, as does Dong et al. (2016), to filter runoff and to implement continuous monitoring. Recently, Spain’s highest court demanded the immediate application of ecological flows in protected sections of the Tajo-Segura transfer (Cater, 2025), a transfer that inspired the construction of the PHASE project in Ecuador. Studies have investigated the role of phytoremediation in these contexts, such as the optimal vegetation type for N and P removal (Chen et al., 2017), which is associated with eutrophication processes and intensive agriculture driven by the implementation of transfers (Greenpeace, 2021). The area surrounding the Chongón–El Azúcar system has deciduous vegetation with low nutrient uptake during the dry season. Therefore, it may be possible to establish vegetated buffer strips with greater nutrient uptake capacity that do not alter the ecosystem balance and ensure ecological flows.
In environments ecologically similar to our AOI, Jardim et al. (2022) documented that the São Francisco interbasin transfer in Brazil triggered agricultural expansion, reduced the Caatinga dry forest, increased surface temperatures in grasslands and exposed soils, and increased evapotranspiration in irrigated areas. These patterns were interpreted as an ecohydrological reconfiguration typical of dry landscapes subjected to new water availability. Our findings in the Chongón–El Azúcar system, where TDF loss and agricultural expansion are concentrated near the canal and reservoir, are consistent with this interpretation and suggest that IBWT projects can act as strong regional drivers of land-use intensification in tropical dry-forest mosaics.
This study also has limitations that should be considered when interpreting the results. First, although historical Landsat scenes were initially explored to characterize pre-transfer and construction-phase conditions, pervasive striping artifacts, data gaps, and the coarser spatial resolution of those images prevented the derivation of reliable LULC maps for earlier years. As a result, the analysis is restricted to the 2019–2025 period and relies on freely available Sentinel-2 imagery. This temporal window captures the medium-term configuration of land use after the transfer has been operating for several years, but it does not allow us to reconstruct pre-existing deforestation trends or to isolate short-term construction-phase impacts.
Second, the pixel-based RF classification required resampling the Sentinel-2 bands at 20 m and 60 m to a 10 m grid, thereby increasing spectral mixing at class boundaries. Combined with the heterogeneity and imbalance of minor classes such as built-up areas, this can lead to misclassification and conservative estimates of change in some categories. Third, training and validation samples were extracted from manually digitized polygons, so neighbouring pixels are not fully independent. Although polygons were spatially dispersed across the AOI to reduce clustering, some short-range spatial autocorrelation may persist, potentially leading to slightly optimistic accuracy estimates. Fourth, despite the inclusion of multiple spectral indices, moderate confusion between TDF and agriculture remained, reflecting the spectral similarity between crops, pastures, and secondary woody vegetation at 10 m resolution. Future work could reduce this uncertainty by integrating multi-temporal phenological metrics, Synthetic Aperture Radar (SAR) data, and/or higher-resolution imagery to better separate agricultural areas from different stages of TDF succession.
Fifth, the classification framework relied exclusively on a Random Forest algorithm, without benchmarking against alternative supervised classifiers, such as support vector machines (SVMs), classification and regression trees (CARTs), or gradient-boosted trees. Although RF is widely recognised as a strong baseline for LULC mapping, the lack of cross-algorithm comparisons introduces additional uncertainty about model robustness and potential algorithm-specific biases. Future studies should explicitly compare multiple classifiers using the same training and validation datasets to assess the sensitivity of accuracy and change estimates to the choice of classification algorithm.
Finally, the 7 km buffer used to define the AOI is an operational choice intended to encompass the main clusters of IBWT-related land-use change around the canal and reservoirs. Although this distance was chosen based on visual inspection of satellite imagery and local land-use patterns, alternative buffer widths could be explored in future work to test the sensitivity of the results to the spatial extent considered.
There are alternative or complementary methodologies, each with its own advantages and limitations. In some cases, distinguishing events across intermediate time frames requires more data and greater computing power (Zhu and Woodcock, 2014). Iteratively Reweighted Multivariate Alteration Detection (IR-MAD) is bitemporal, like our methodology, and could be integrated if further improvements in sampling are needed, as it identifies hotspots of change without requiring prior classification (Nielsen, 2007). Other methodologies compare how the area influenced by the infrastructure changed with a similar area without the infrastructure, isolating the effect attributable to the transfer. Some limitations may be differences in soil, slope, accessibility, or land ownership, and both areas must have similar trends before the infrastructure is implemented (Underwood, 1994). On the other hand, future studies could be complemented by: radar images that improve the separability of forest and agriculture in cloudy scenarios (Ienco et al., 2019), implementation of spectral indices such as the Floating Algae Index (FAI) to differentiate between floating and non-floating aquatic plant biomass (Hu, 2009).
5 Conclusions and recommendations
Between 2019 and 2025, 85.57% of the area of interest (AOI) retained the same LULC class, indicating high overall land-cover permanence. However, the transition trajectories reveal an intense bidirectional exchange between TDF and agriculture, with insufficient returns to offset a net TDF loss of 1,223.77 ha. Agricultural land increased by 756.21 ha over the same period (from 6,391.33 to 7,147.54 ha, i.e., +11.8% relative to its 2019 extent), confirming that most new agricultural areas were converted from forest. These changes are spatially concentrated near the Chongón–Sube y Baja canal and the El Azúcar reservoir, where fishbone-type and geometric deforestation patterns are evident, whereas the western sector of the AOI shows localised TDF recovery in areas that were classified as agriculture in 2019.
Water bodies also underwent marked changes. In the El Azúcar receiving reservoir, the turbid-water class increased from 161.16 to 395.04 ha and now occupies more than half of the water surface, while clear water increased more modestly (from 1,667.16 to 1,916.18 ha). The greenish spectral appearance of these turbid waters is consistent with nutrient-enriched, chlorophyll-rich conditions and with the documented proliferation of aquatic macrophytes such as Eichhornia crassipes in the reservoir. These patterns indicate a high risk of eutrophication, which can degrade water quality for human consumption and irrigation and create feedback that affect agricultural productivity around the reservoir.
The statistical analyses provide quantitative support for the association between the Chongón–El Azúcar water-transfer system and TDF loss. Spearman’s rank correlations showed that distance to the IBWT canal is negatively associated with forest-cover change. In contrast, water- and built-up-related indices (MNDWI and NDBI) are positively associated with the probability of TDF loss, and vegetation indices (NDVI and SAVI) are negatively associated with it. The LASSO-penalised logistic regression model further identified distance to the canal, NDVI, SAVI, MNDWI, and NDBI as significant predictors of TDF loss, with a very high discriminatory capacity (AUC = 0.9599). Together, these results indicate that forest conversion is more likely in areas with increased water availability and intensifying agricultural and (to a lesser extent) built-up land uses in the immediate influence zone of the transfer. Given the small extent and higher classification uncertainty of the Built-up area class, these findings should be interpreted primarily as evidence of TDF conversion to agriculture and shifts in water-related conditions, with built-up signals providing only supplementary, qualitative information. Although broader socio-economic drivers (e.g., land tenure, market demand, infrastructure) also play a role, the IBWT acts as a key enabling factor, amplifying existing land-use pressures on TDF.
This study provides spatially explicit evidence and operational LULC products that can support public policies aimed at restoring and preserving TDF while regulating water-dependent agricultural expansion. Although the transfer was originally conceived to supply water to local communities and the AOI was not initially planned as an irrigation area, our results suggest that increased water availability has facilitated agricultural expansion into TDF, with potential impacts on biodiversity and on the quality of water used by the population. In this context, we recommend: (i) directing agricultural expansion toward already transformed soils, avoiding further conversion of TDF; (ii) establishing no-conversion riparian buffers of at least ~100 m on each bank of the Chongón–Sube y Baja canal and its main tributaries, complemented by protection belts extending up to ~500 m where only low-impact land uses and best-management practices are permitted, in line with mitigation measures proposed for other large IBWT schemes; (iii) implementing riparian corridors and vegetated buffer strips of at least 20–30 m around TDF remnants and along reservoir margins, planted with species of high nutrient uptake capacity to intercept sediment and nutrient loads; (iv) promoting good agricultural practices and runoff-control measures explicitly aimed at reducing nitrogen and phosphorus exports from irrigated fields to levels compatible with national water-quality standards for reservoirs used for human consumption; and (v) maintaining and strengthening mechanical removal programmes for aquatic macrophytes, combined with actions to reduce nutrient inputs from surrounding agricultural activities.
Finally, we recommend implementing an operational satellite-based monitoring programme with at least annual updates to LULC maps and indicators of TDF loss within distance bands that explicitly resolve the high-risk 0.15–0.30 km buffer identified by the logistic model (e.g., 0–0.3, 0.3–2, and >2 km) around the canal and reservoirs, potentially complemented by SAR data and phenology-based metrics, and by applying operational spectral thresholds (e.g., NDVI <0.45 and SAVI <0.30 for reduced vegetation vigor, NDBI >0 for agricultural and bare-soil expansion, and MNDWI >0.10 for increased surface moisture) as early-warning indicators of emerging TDF loss hotspots to track the replacement or displacement of TDF by agriculture and other land uses and to inform adaptive management and conservation decisions in tropical dry-forest landscapes influenced by IBWT.
Statements
Data availability statement
The raw data supporting the conclusions of this article will be made available by the authors, without undue reservation.
Author contributions
JM-A: Software, Project administration, Validation, Formal analysis, Conceptualization, Writing – review & editing, Methodology, Writing – original draft, Investigation, Data curation, Visualization. AV-M: Writing – review & editing, Writing – original draft, Validation, Conceptualization, Supervision, Methodology, Project administration. IC-E: Formal analysis, Software, Data curation, Writing – review & editing, Methodology, Investigation, Validation, Supervision. ES: Project administration, Validation, Supervision, Writing – review & editing, Methodology, Conceptualization.
Funding
The author(s) declared that financial support was not received for this work and/or its publication.
Conflict of interest
The author(s) declared that this work was conducted in the absence of any commercial or financial relationships that could be construed as a potential conflict of interest.
Generative AI statement
The author(s) declared that Generative AI was not used in the creation of this manuscript.
Any alternative text (alt text) provided alongside figures in this article has been generated by Frontiers with the support of artificial intelligence and reasonable efforts have been made to ensure accuracy, including review by the authors wherever possible. If you identify any issues, please contact us.
Publisher’s note
All claims expressed in this article are solely those of the authors and do not necessarily represent those of their affiliated organizations, or those of the publisher, the editors and the reviewers. Any product that may be evaluated in this article, or claim that may be made by its manufacturer, is not guaranteed or endorsed by the publisher.
References
1
Abbaszadeh Tehrani N. Mohd Shafri H. Z. Salehi S. Chanussot J. Janalipour M. (2022). Remotely-sensed ecosystem health assessment (RSEHA) model for assessing the changes of ecosystem health of Lake Urmia Basin. Int. J. Image Data Fusion13, 180–205. doi: 10.1080/19479832.2021.1924880
2
Aguirre N. Eguiguren P. Maita J. Ojeda T. Sanamiego N. Furniss M. et al . (2017). Potential impacts to dry forest species distribution under two climate change scenarios in southern Ecuador. Neotrop. Biodivers.3, 18–29. doi: 10.1080/23766808.2016.1258867
3
Alvares C. A. Stape J. L. Sentelhas P. C. de Moraes Gonçalves J. L. Sparovek G. (2013). Köppen’s climate classification map for Brazil. Meteorol. Z.22, 711–728. doi: 10.1127/0941-2948/2013/0507
4
Baque Narda L. F. Merchán Ponce N. P. (2024). Gestión pública y sostenibilidad del sistema de riego en el trasvase Daule—Santa Elena Empresa Pública del Agua EPA EP. Cienc. Desarro.27:343. doi: 10.21503/cyd.v27i1.2572
5
Benítez Á. Ortiz J. Matamoros-Apolo D. Bustamante A. López F. Yangua-Solano E. et al . (2024). Forest disturbance determines diversity of epiphytic lichens and bryophytes on trunk bases in tropical dry forests. Forests15:1565. doi: 10.3390/f15091565
6
Bera B. Saha S. Bhattacharjee S. (2020). Forest cover dynamics (1998 to 2019) and prediction of deforestation probability using binary logistic regression (BLR) model of Silabati watershed, India. Trees For. People2:100034. doi: 10.1016/j.tfp.2020.100034
7
Breiman L. (2001). Random Forests. Mach. Learn.45, 5–32. doi: 10.1023/A:1010933404324
8
Calderón M. 2021 Análisis de la cobertura de Eichhornia crassipes por sensores remotos para propuesta de gestión ambiental en el embalse El Azúcar Universidad Agraria del Ecuador. Available online at: https://cia.uagraria.edu.ec/Archivos/CALDERONFLOREANOMIRKAALEJANDRA.pdf
9
Cater D. . (2025). Spanish Supreme Court ruling affects Tagus-Segura water transfers. Water News Eur. Available online at: https://www.waternewseurope.com/spanish-supreme-court-ruling-affects-tagus-segura-water-transfers/ (Accessed August 11, 2025).
10
Chen C. Shen Z. Weng Y. You S. Lin J. Li S. et al . (2023). Modeling landslide susceptibility in forest-covered areas in Lin’an, China, using logistical regression, a decision tree, and random forests. Remote Sens15:4378. doi: 10.3390/rs15184378
11
Chen C. Zhao T. Liu R. Luo L. (2017). Performance of five plant species in removal of nitrogen and phosphorus from an experimental phytoremediation system in the Ningxia irrigation area. Environ. Monit. Assess.189:497. doi: 10.1007/s10661-017-6213-y,
12
Congalton R. G. (1991). A review of assessing the accuracy of classifications of remotely sensed data. Remote Sens. Environ.37, 35–46. doi: 10.1016/0034-4257(91)90048-B
13
Dadzie E. Twumasi Y. A. Ning Z. H. Osei J. D. Gyan D. T. Aniewu D. et al . (2025). Mapping the extent of land degradation in East Baton Rouge parish. Int. Arch. Photogramm. Remote. Sens. Spat. Inf. Sci.XLVIII-M-5-2024, 21–28. doi: 10.5194/isprs-archives-XLVIII-M-5-2024-21-2025,
14
De C. Teixeira A. Scherer-Warren M. Hernandez F. Andrade R. Leivas J. (2013). Large-scale water productivity assessments with MODIS images in a changing semi-arid environment: a Brazilian case study. Remote Sens5, 5783–5804. doi: 10.3390/rs5115783
15
de Sosa L. L. Carmona I. Panettieri M. Griffith D. M. Espinosa C. I. Jara-Guerrero A. et al . (2024). Ecosystem function associated with soil organic carbon declines with tropical dry forest degradation. Land Degrad. Dev.35, 2109–2121. doi: 10.1002/ldr.5047
16
Desai S. Mattoo M. Deshpande A. M. Dey A. Akiwate S. 2024. Vegetation change detection through NDVI analysis using Landsat-8 data., in 2024 4th international conference on computer, communication, control & information technology (C3IT), (IEEE), 1–6
17
Dong M. Tang M. Li S. Cao H. Deng H. Wu G. (2016). Effects of water transfer project construction on vegetation patterns. Acta Ecol. Sin.36, 6656–6663. doi: 10.5846/stxb201504080718
18
dos Santos U. J. Duda G. P. Marques M. C. de Valente Meiros E. de Sousa Lima J. R. de Soares Souza E. et al . (2019). Soil organic carbon fractions and humic substances are affected by land uses of Caatinga forest in Brazil. Arid L. Res. Manag.33, 255–273. doi: 10.1080/15324982.2018.1555871
19
Empresa Pública del Agua (EPA-EP) 2015 Intervención, ampliación y construcción del Plan Hidráulico Acueducto Santa Elena (PHASE) Guayaquil, Ecuador. Available online at: https://www.empresaagua.gob.ec/wp-content/uploads/downloads/2019/11/Perfil-Plan-Hidráulico-de-Acueducto-de-Santa-Elena.pdf
20
Escribano-Avila G. Cervera L. Ordóñez-Delgado L. Jara-Guerrero A. Amador L. Paladines B. et al . (2017). Biodiversity patterns and ecological processes in Neotropical dry forest: the need to connect research and management for long-term conservation. Neotrop. Biodivers.3, 107–116. doi: 10.1080/23766808.2017.1298495
21
Fan Y. Chen R. Sang Y. Chen H. Zhou Z. Hao Y. et al . (2021). Comparative research on several denoising methods for pepper and salt noise images, (Singapore: Springer), 1549–1556.
22
GAD Parroquial Rural de Simón Bolívar 2024 Plan de Desarrollo y Ordenamiento Territorial de la Parroquia Simón Bolívar: Actualización 2023–2027 Santa Elena, Ecuador. Available online at: http://www.gadsimonbolivar.gob.ec/pdot/4/
23
García-Ávila F. García-Pizarro E. Malla-Aguilar G. Sánchez-Cabrera C. Cadme-Galabay M. Valdiviezo-Gonzales L. et al . (2025). Influence of nutrients on aquatic vegetation and trophic status of lakes: analysis of eutrophication and mitigation. Results Eng.27:106381. doi: 10.1016/j.rineng.2025.106381
24
Ghezali S. Boukhemacha M. A. (2024). Mapping typical LULC classes using spatiotemporal analysis and the thresholds of spectral optical satellite imagery indices: a case study in Algiers city. Environ. Monit. Assess.197:67. doi: 10.1007/s10661-024-13577-z
25
Google Earth Engine (2023). COPERNICUS/S2_SR_HARMONIZED: Harmonized Sentinel-2 MSI: MultiSpectral Instrument, Level-2A. Google Dev. Available online at: https://developers.google.com/earth-engine/datasets/catalog/COPERNICUS_S2_SR_HARMONIZED?hl=es-419 (Accessed August 13, 2025).
26
Greenpeace (2021). El Mar Menor, una víctima del trasvase Tajo-Segura. Available online at: https://es.greenpeace.org/es/sala-de-prensa/informes/mar-menor-victima-trasvase-completo/ (Accessed August 13, 2025).
27
Hasnat G. N. T. (2022). “Climate change effects, adaptation, and mitigation techniques in tropical dry forests” in Research anthology on environmental and societal impacts of climate change. (Eds.) Bhadoria, R., Tripathi, S., and Srivastava, P. (Hershey, PA, USA: IGI Global), 309–331.
28
Hu C. (2009). A novel ocean color index to detect floating algae in the global oceans. Remote Sens. Environ.113, 2118–2129. doi: 10.1016/j.rse.2009.05.012
29
Huete A. (1988). A soil-adjusted vegetation index (SAVI). Remote Sens. Environ.25, 295–309. doi: 10.1016/0034-4257(88)90106-X
30
Ienco D. Interdonato R. Gaetano R. Ho Tong Minh D. (2019). Combining Sentinel-1 and Sentinel-2 satellite image time series for land cover mapping via a multi-source deep learning architecture. ISPRS J. Photogramm. Remote Sens.158, 11–22. doi: 10.1016/j.isprsjprs.2019.09.016
31
INAMHI (Instituto Nacional de Meteorología e Hidrología) (2013). Biblioteca—Instituto Nacional de Meteorología e Hidrología. Available online at: https://www.inamhi.gob.ec/biblioteca/ (accessed June 9, 2023).
32
Jadán O. Donoso D. A. Ponce-Ramírez E. Pucha-Cofrep F. Cabrera O. (2022). Six forests in one: tree species diversity in the Bosque protector Chongón colonche, a lowland mountain range in coastal Ecuadorian. For. Ecosyst.9:100069. doi: 10.1016/j.fecs.2022.100069
33
Jardim A. M. da R. F. Araújo Júnior G. do N. Silva M. V. da Santos A. dos Silva J. L. B. da Pandorfi H. et al . 2022Using remote sensing to quantify the joint effects of climate and land use/land cover changes on the Caatinga biome of northeast BrazilianRemote Sens14:1911 doi: 10.3390/rs14081911
34
Li Q. Song J. Wei A. Zhang B. (2013). Changes in major factors affecting the ecosystem health of the Weihe River in Shaanxi Province, China. Front. Environ. Sci. Eng.7, 875–885. doi: 10.1007/s11783-013-0568-2
35
MAG M. de A. y G. . (2020). Mapa de cobertura y uso de la tierra y sistemas productivos agropecuarios del Ecuador. Available online at: http://geoportal.agricultura.gob.ec/geonetwork/srv/spa/catalog.search#/metadata/4f7e118f-0439-42bf-ab62-f0e7c842a379 (Accessed August 11, 2025).
36
Martinuzzi F. Mahecha M. D. Montero D. Alonso L. Mora K. (2024). SpectralIndices. Jl: streamlining spectral indices access and computation for earth system research. Int. Arch. Photogramm. Remote. Sens. Spat. Inf. Sci.XLVIII-4/W12-2024, 89–95. doi: 10.5194/isprs-archives-XLVIII-4-W12-2024-89-2024,
37
Mattson M. Sousa D. Quandt A. Ganster P. Biggs T. (2024). Mapping multi-decadal wetland loss: comparative analysis of linear and nonlinear spatiotemporal characterization. Remote Sens. Environ.302:113969. doi: 10.1016/j.rse.2023.113969
38
Mishra S. Mishra D. R. (2012). Normalized difference chlorophyll index: a novel model for remote estimation of chlorophyll-a concentration in turbid productive waters. Remote Sens. Environ.117, 394–406. doi: 10.1016/j.rse.2011.10.016
39
Moura M. R. do Nascimento F. A. O. Paolucci L. N. Silva D. P. Santos B. A. (2023a). Pervasive impacts of climate change on the woodiness and ecological generalism of dry forest plant assemblages. J. Ecol.111, 1762–1776. doi: 10.1111/1365-2745.14139
40
Moura M. R. Oliveira G. A. Paglia A. P. Pires M. M. Santos B. A. (2023b). Climate change should drive mammal defaunation in tropical dry forests. Glob. Chang. Biol.29, 6931–6944. doi: 10.1111/gcb.16979,
41
NASA (2025). POWER|Data Access Viewer. Available online at: https://power.larc.nasa.gov/data-access-viewer/ (Accessed August 4, 2025).
42
Nielsen A. A. (2007). The regularized iteratively reweighted MAD method for change detection in multi- and hyperspectral data. IEEE Trans. Image Process.16, 463–478. doi: 10.1109/TIP.2006.888195,
43
Ogaya R. Barbeta A. Başnou C. Peñuelas J. (2015). Satellite data as indicators of tree biomass growth and forest dieback in a Mediterranean holm oak forest. Ann. For. Sci.72, 135–144. doi: 10.1007/s13595-014-0408-y
44
Phan T. N. Kuch V. Lehnert L. W. (2020). Land cover classification using Google earth engine and random Forest classifier—the role of image composition. Remote Sens12:2411. doi: 10.3390/rs12152411
45
Pittock J. Meng J. Geiger M. Chapagain A. K. 2009 Interbasin water transfers and water scarcity in a changing world—a solution or a pipedream? WWF Germany: Frankfurt am Main.
46
Qiu M. Wei X. Hou Y. Spencer S. A. Hui J. (2023). Forest cover, landscape patterns, and water quality: a meta-analysis. Landsc. Ecol.38, 877–901. doi: 10.1007/s10980-023-01593-2
47
Raj S. Harish A. Ramamoorthy S. (2023). Water logging analysis over Dubai using Sentinel-2 satellite imagery. (Singapore: Springer), 683–696.
48
Ray B. Mukherjee P. (2023). Forest income and rural livelihoods in West Bengal, India. Stud. Microecon.11, 10–35. doi: 10.1177/23210222211024389
49
Rivas C. A. Guerrero-Casado J. Navarro-Cerillo R. M. (2021). Deforestation and fragmentation trends of seasonal dry tropical forest in Ecuador: impact on conservation. For. Ecosyst.8:46. doi: 10.1186/s40663-021-00329-5
50
Rivas C. A. Navarro-Cerillo R. M. Johnston J. C. Guerrero-Casado J. (2020). Dry forest is more threatened but less protected than evergreen forest in Ecuador’s coastal region. Environ. Conserv.47, 79–83. doi: 10.1017/S0376892920000077
51
Rivas C. A. Navarro-Cerrillo R. M. (2024). Forest fragmentation and connectivity in South American dry forests. Biodivers. Conserv.33, 3015–3037. doi: 10.1007/s10531-024-02894-x
52
Rodríguez-Echeverry J. (2023). Extensification of agricultural land-use generates severe effects on the critically endangered inter-Andean dry forest in the Ecuadorian Andean landscape. J. Landsc. Ecol.16, 132–148. doi: 10.2478/jlecol-2023-0020
53
Rodríguez-Echeverry J. Leiton M. (2021). State of the landscape and dynamics of loss and fragmentation of forest critically endangered in the tropical Andes hotspot: implications for conservation planning. J. Landsc. Ecol.14, 73–91. doi: 10.2478/jlecol-2021-0005
54
Romero-Muñoz A. Jansen M. Nuñez A. M. Toledo M. Almonacid R. V. Kuemmerle T. (2019). Fires scorching Bolivia’s Chiquitano forest. Science366:1082. doi: 10.1126/science.aaz7264,
55
Romero-Saritama J. M. (2018). Seed conservation: an alternative to store germplasm and recover threatened Ecuadorian forests | Conservación de Semillas: Una alternativa inmediata Para almacenar germoplasma forestal y recuperar los bosques secos amenazados del Ecuador. Neotrop. Biol. Conserv.13, 74–85. doi: 10.4013/nbc.2018.131.09
56
Rouse J. W. Haas R. H. Schell J. A. Deering D. W. . (1974). Monitoring vegetation Systems in the Great Plains with ERTS, in Proceedings of the third earth resources technology Satellite-1 symposium, (Washington, D.C.: NASA Goddard Space Flight Center), 309–317. Available online at: https://ntrs.nasa.gov/citations/19740022614
57
Santra A. Mitra S. S. Sinha S. Routh S. (2020). Performance testing of selected spectral indices in automated extraction of impervious built-up surface features using Resourcesat LISS-III image. Arab. J. Geosci.13:1229. doi: 10.1007/s12517-020-06183-z
58
Schipper J. . (2020). Ecuadorian dry forests. One Earth. Available online at: https://www.oneearth.org/ecoregions/ecuadorian-dry-forests/ (Accessed August 16, 2025).
59
Schröder J. M. Ávila Rodríguez L. P. Günter S. (2021). Research trends: tropical dry forests: the neglected research agenda?Forest Policy Econ.122:102333. doi: 10.1016/j.forpol.2020.102333
60
Shahzad K. Ali W. S. Muhammad S. Dai J. Zeb U. Zhu M. (2024). Assessment of plant biodiversity in tropical dry forests of Sialkot, Pakistan; insight into environmental, anthropogenic influence and conservation strategies. Front. For. Glob. Change7:1362117. doi: 10.3389/ffgc.2024.1362117
61
Spacesystems, N., and Team, U. S. /Japa. A. S . (2019). ASTER Global Digital Elevation Model V003 (ASTGTM). Sioux Falls, SD, USA: NASA EOSDIS Land Processes DAAC (LP DAAC).
62
Subsecretaría Técnica de los Recursos Hídricos, G. N. de O. y M . (2013). Obras de mantenimiento del sistema control de inundaciones de la Cuenca Baja del Guayas; sistema Trasvase Daule–Santa Elena de otros sectores propensos a inundaciones en la Demarcación Hidrográfica Guayas. Available online at: https://www.empresaagua.gob.ec/wp-content/uploads/downloads/2018/04/Perfil-del-Programa-de-Mantenimiento-y-Operación1.pdf?utm (Accessed August 15, 2025).
63
Tabarelli M. Filgueiras B. K. C. B. K. C. Ribeiro E. M. S. E. M. S. Lopes A. V. A. V. Leal I. R. I. R. (2024). “Tropical dry forests” in Encyclopedia of biodiversity. ed. Samuel M. S. (Oxford: Elsevier), 294–312.
64
Troya F. (2014). Determinación de la disponibilidad del recurso hídrico en el área de influencia del Plan Hidráulico Acueducto de Santa Elena (PHASE) para consumo humano y uso agrícola Escuela Superior Politécnica del Litoral (ESPOL). Available online at: https://www.dspace.espol.edu.ec/xmlui/handle/123456789/41530 (Accessed August 24, 2025).
65
Underwood A. J. (1994). On beyond BACI: sampling designs that might reliably detect environmental disturbances. Ecol. Appl.4, 3–15. doi: 10.2307/1942110
66
Velastegui-Montoya A. García-Romero J. A. Chuizaca-Espinoza I. A. Quevedo R. P. Santana-Cunha C. Ochoa-Brito J. I. et al . (2024). Assessing regressive erosion effects: unveiling riverside land use land cover changes post hydroelectric project construction. Environ. Challenges15:100882. doi: 10.1016/j.envc.2024.100882
67
Villamagna A. M. Murphy B. R. (2010). Ecological and socio-economic impacts of invasive water hyacinth (Eichhornia crassipes): a review. Freshw. Biol.55, 282–298. doi: 10.1111/j.1365-2427.2009.02294.x
68
Wang S. Liu Y. Guo J. Liu J. Chai H. (2024). Impacts of the middle route of the south-to-north water diversion project on land surface temperature and fractional vegetation coverage in the Danjiang River basin. Remote Sens16:2665. doi: 10.3390/rs16142665
69
Wang X. Liu Z. Wu J. (2025). Inter-basin water transfer and water security: a landscape sustainability science perspective. J. Environ. Manag.390:126326. doi: 10.1016/j.jenvman.2025.126326,
70
Wang P. Tan S. Zhang G. Wang S. Wu X. (2022). Remote sensing estimation of forest aboveground biomass based on Lasso-SVR. Forests13:1597. doi: 10.3390/f13101597
71
Xu H. (2006). Modification of normalised difference water index (NDWI) to enhance open water features in remotely sensed imagery. Int. J. Remote Sens.27, 3025–3033. doi: 10.1080/01431160600589179
72
Yılmaz O. S. Acar U. Sanli F. B. Gülgen F. Ateş A. M. (2025). Investigation of water quality in Izmir Bay with remote sensing techniques using NDCI on Google earth engine platform. Trans. GIS29:e13301. doi: 10.1111/tgis.13301
73
Zemp D. C. Ehbrecht M. Seidel D. Ammer C. Craven D. Erkelenz J. et al . (2019). Mixed-species tree plantings enhance structural complexity in oil palm plantations. Agric. Ecosyst. Environ.283:106564. doi: 10.1016/j.agee.2019.06.003
74
Zha Y. Gao J. Ni S. (2003). Use of normalized difference built-up index in automatically mapping urban areas from TM imagery. Int. J. Remote Sens.24, 583–594. doi: 10.1080/01431160304987
75
Zhu Z. Woodcock C. E. (2014). Continuous change detection and classification of land cover using all available Landsat data. Remote Sens. Environ.144, 152–171. doi: 10.1016/j.rse.2014.01.011
76
Zinner D. Wygoda C. Razafimanantsoa L. Rasoloarison R. Andrianandrasana H. T. Ganzhorn J. U. et al . (2014). Analysis of deforestation patterns in the central Menabe, Madagascar, between 1973 and 2010. Reg. Environ. Chang.14, 157–166. doi: 10.1007/s10113-013-0475-x
Summary
Keywords
forest management, geographic information systems (GIS), Google Earth Engine (GEE), inter-basin water transfer (IBWT), land use and land cover (LULC), Random Forest (RF), remote sensing (RS), tropical dry forest (TDF)
Citation
Martínez-Angulo J, Velastegui-Montoya A, Chuizaca-Espinoza IA and Sanclemente E (2026) Multitemporal assessment of changes in land cover associated with water transfers in dry forests: case study of the Chongón–El Azúcar system (Ecuador). Front. For. Glob. Change 8:1697045. doi: 10.3389/ffgc.2025.1697045
Received
01 September 2025
Revised
10 December 2025
Accepted
16 December 2025
Published
12 January 2026
Volume
8 - 2025
Edited by
Abdoul Aziz Diouf, Centre de Suivi Ecologique, Senegal
Reviewed by
Subrata Haldar, Lovely Professional University, India
James Rodriguez Echeverry, University of Tolima, Colombia
Updates
Copyright
© 2026 Martínez-Angulo, Velastegui-Montoya, Chuizaca-Espinoza and Sanclemente.
This is an open-access article distributed under the terms of the Creative Commons Attribution License (CC BY). The use, distribution or reproduction in other forums is permitted, provided the original author(s) and the copyright owner(s) are credited and that the original publication in this journal is cited, in accordance with accepted academic practice. No use, distribution or reproduction is permitted which does not comply with these terms.
*Correspondence: Andrés Velastegui-Montoya, dvelaste@espol.edu.ec
Disclaimer
All claims expressed in this article are solely those of the authors and do not necessarily represent those of their affiliated organizations, or those of the publisher, the editors and the reviewers. Any product that may be evaluated in this article or claim that may be made by its manufacturer is not guaranteed or endorsed by the publisher.