Abstract
Accurate identification of the spatiotemporal characteristics and spatial matching of ecosystem services (ESs) supply and demand, as well as determination of the factors influencing the ESs supply-demand relationship, is of great significance for controlling the design of regional ecological protection policies and sustainable management. Unfortunately, the comprehensive characteristics of changes in ESs supply and demand, as well as their driving mechanisms, after large-scale vegetation restoration in the Shaanxi section of the Yellow River basin (SYRB) are still unclear. This study, conducted in the SYRB, employed specialized models to assess water yield, soil conservation, and carbon fixation on both the supply and demand sides after vegetation restoration in 2000 and 2023. Subsequently, the spatiotemporal heterogeneity of the supply-demand matching of ESs was explored by constructing the supply-demand ratio index. Finally, using the optimal parameter Geodetector, the influencing factors of the ESs supply-demand matching relationship in the SYRB were further identified. The results showed that the water yield in the SYRB was generally in a deficit, indicating insufficient supply throughout the study period, but this deficit state improved over time. In 2023, the counties with insufficient water yield supply were primarily located in the northern part of the SYRB and the Guanzhong Plain. Soil conservation reached a fundamental reversal from a “general deficit” to an “overall surplus.” In 2023, the counties with insufficient soil conservation supply were mainly located in the northern part of the SYRB. In contrast, the supply-demand relationship of carbon fixation in the vast majority of countries deteriorated. In 2023, the counties with insufficient carbon fixation supply were primarily located in the northern part of the SYRB and the Guanzhong Plain. Economic density, vegetation coverage, and population density were identified as the key factors in monitoring the water yield supply-demand matching relationship. Precipitation, slope, and population density were the main controlling factors for the soil conservation supply-demand matching relationship. Economic density, forest and grassland percentage, and population density were identified as the key factors shaping the carbon fixation supply-demand matching relationship. This study clarified the supply-demand relationship and driving mechanisms for key ESs in the SYRB, thereby providing a theoretical basis for the comprehensive management of regional ecosystems.
1 Introduction
Ecosystem services (ESs), representing the diverse benefits that humans derive from ecosystems, are closely linked to human wellbeing (Costanza et al., 1997; Ouyang et al., 2016). With the advent of global climate change and urbanization, natural ecosystems are experiencing progressive shrinkage and fragmentation, resulting in a decline in the quality of ESs provided by ecosystems (Luo et al., 2019; Masalvad et al., 2025; Palafox-Juárez et al., 2025). Existing research has demonstrated that approximately 60% of global ESs are deteriorating or being unsustainably exploited, thereby exerting adverse impacts on human livelihoods (Ma, 2005). Concurrently, with the rapid economic development and population explosion, the demand for ESs in human society is steadily increasing (Elliot et al., 2022; Ding and Sun, 2023; Zhang J. et al., 2025), which in turn has triggered the contradiction between the degradation of ESs supply and the increase of ESs demand. Therefore, the effective management of ESs (including supply and demand) is critically important (Lu et al., 2024; Wang et al., 2025). Within this context, it is necessary to enhance the exploration of the supply and demand relationship of regional ESs and their social-ecological driving factors. Such exploration is a prerequisite for further effective management of ESs, thereby improving human wellbeing and achieving sustainable development.
ESs supply is generally defined as the various products and services provided by the ecosystem to humans at specific locations and times (de Groot et al., 2010), whereas ESs demand refers to the services consumed or expected by humans (Cui et al., 2019). With the increase in human demand, mismatches between supply and demand have resulted in challenges to the sustainable development of human society (Elliot et al., 2022; de Knegt et al., 2024; Zhai et al., 2025). Incorporating ESs demand into ESs assessments can help to find mismatches (in space and time) between ESs supply and demand and provide a basis for designing effective ESs management strategies (Bennett and Gosnell, 2015; Zhang J. et al., 2025). Unfortunately, compared with ESs supply, ESs demand has only gradually received attention over the past decade (Rau et al., 2020). To date, researchers have followed different methods to quantify the relationships matching supply to demand, including expert experience (Burkhard et al., 2012; Jacobs et al., 2015; Das et al., 2024), survey (Casado-Arzuaga et al., 2013), modeling (Hou et al., 2023; Liu et al., 2024), and so on. These studies primarily focused on the quantification of the supply-demand balance for a particular ES, including water resources (Quintas-Soriano et al., 2014; Li F. et al., 2024), flood regulation (Maragno et al., 2018; Liu et al., 2023), soil erosion control (Wang et al., 2020; Jian et al., 2024), and air purification (Yao et al., 2021); or on specific ecosystem types, including farmlands (Dang et al., 2020; Li et al., 2025), forests (Blanco et al., 2017; Poturalska et al., 2025), grasslands (Jäger et al., 2020), and urban areas (Liu H. et al., 2020; Zhou et al., 2025). Although these studies have provided a clear reference point for current studies on ESs supply-demand balance, the study of this relationship remains challenging due to the influence of many complex factors, and existing knowledge is still insufficient to support ecological protection and sustainable development in specific river basins. Furthermore, to achieve sustainable development of ecosystems and promote harmonious coexistence between human society and natural ecosystems, merely examining the current ESs supply and demand state is insufficient (Chen et al., 2024; Zhou et al., 2025). It is necessary to clearly detect the underlying factors driving ESs supply-demand patterns to provide sufficient theoretical support for formulating adaptive management strategies and enhancing human wellbeing.
The Shaanxi section of the Yellow River Basin (SYRB) is located in the middle reaches of the Yellow River basin. It is an important part of the national ecological security strategic pattern of “Three Zones and Four Belts” and also a key area for soil erosion control and vegetation restoration in China (He et al., 2025). Meanwhile, SYRB is characterized by fragile ecological conditions, severe soil erosion, and water scarcity (Yang L. et al., 2025), making it a key area for ecological conservation and high-quality development of the Yellow River Basin. With the implementation of ecological restoration projects, such as vegetation restoration, the ecosystem structure in the SYRB has been greatly enhanced and stabilized (Li J. et al., 2024). However, the comprehensive change characteristics of the ESs supply and demand, along with their driving mechanisms in the restoration of SYRB, remain unclear, which are crucial for subsequent targeted governance. For this purpose, this study takes the SYRB as the study area. It takes the three fundamental ESs of water yield, soil conservation, and carbon fixation in the SYRB as the study objects, aiming to accomplish the following research goals: (1) quantify the supply and demand status of ESs following vegetation restoration; (2) comprehensively assess the spatiotemporal heterogeneity of ESs supply-demand matching relationship; and (3) reveal the driving mechanisms underlying the ESs supply-demand relationship. This study can help us understand the ESs supply-demand mismatch in the SYRB and its causes, thereby providing a scientific basis for the decision-making practice of ecosystem management and supply-demand relationship adjustment in the SYRB.
2 Materials and methods
2.1 Study area
The SYRB (106°18′-111°15′E, 33°41′-39°35′N) is located in the northern and central regions of Shaanxi province and is the “heartland” of the Yellow River Basin (Figure 1a). The total area of the SYRB is approximately 1.323 × 10⁵ km2, accounting for 64.3% of the total area of the Shaanxi province and 17.6% of the total area of the Yellow River Basin. The administrative scope of the SYRB mainly includes 78 counties and districts in Yulin city, Yan'an city, Xi'an city, Xianyang city, Weinan city, and Tongchuan city, as well as parts of Baoji city and Shangluo city of Shaanxi province (Figure 1b). The SYRB has diverse landforms, with an elevation range of 319–3,748 m (Figure 1b). The northern part lies at the southern edge of the Mu Us Desert and the Loess Plateau, the middle part comprises the Guanzhong Plain, and the southern part lies at the northern foot of the Qinling Mountains. The SYRB is characterized by a temperate continental monsoon climate and is located in the arid, semi-arid, and semi-humid climate zones, with an annual precipitation ranging from 325 to 879 mm (Figure 1c). The SYRB is rich in land resources. The areas include farmlands, forestlands, grasslands, water bodies, construction lands, and barren lands, which account for approximately 37.20%, 17.01%, 37.28%, 1.28%, 3.81%, and 3.42%, respectively. Among these areas, the proportion of farmland, forest, and grassland is nearly 91.5%, which is the main type of land use (Figure 1d). Under the cross-influence of multiple factors, such as vegetation restoration and socioeconomic development, the ecosystem of the SYRB has undergone considerable changes (Li J. et al., 2024; He et al., 2025; Yang L. et al., 2025). Therefore, it is necessary to investigate the changes in the ESs relationship and its driving mechanism in this area following vegetation restoration, which is of vital importance to the green development and ecosystem protection in the SYRB.
Figure 1
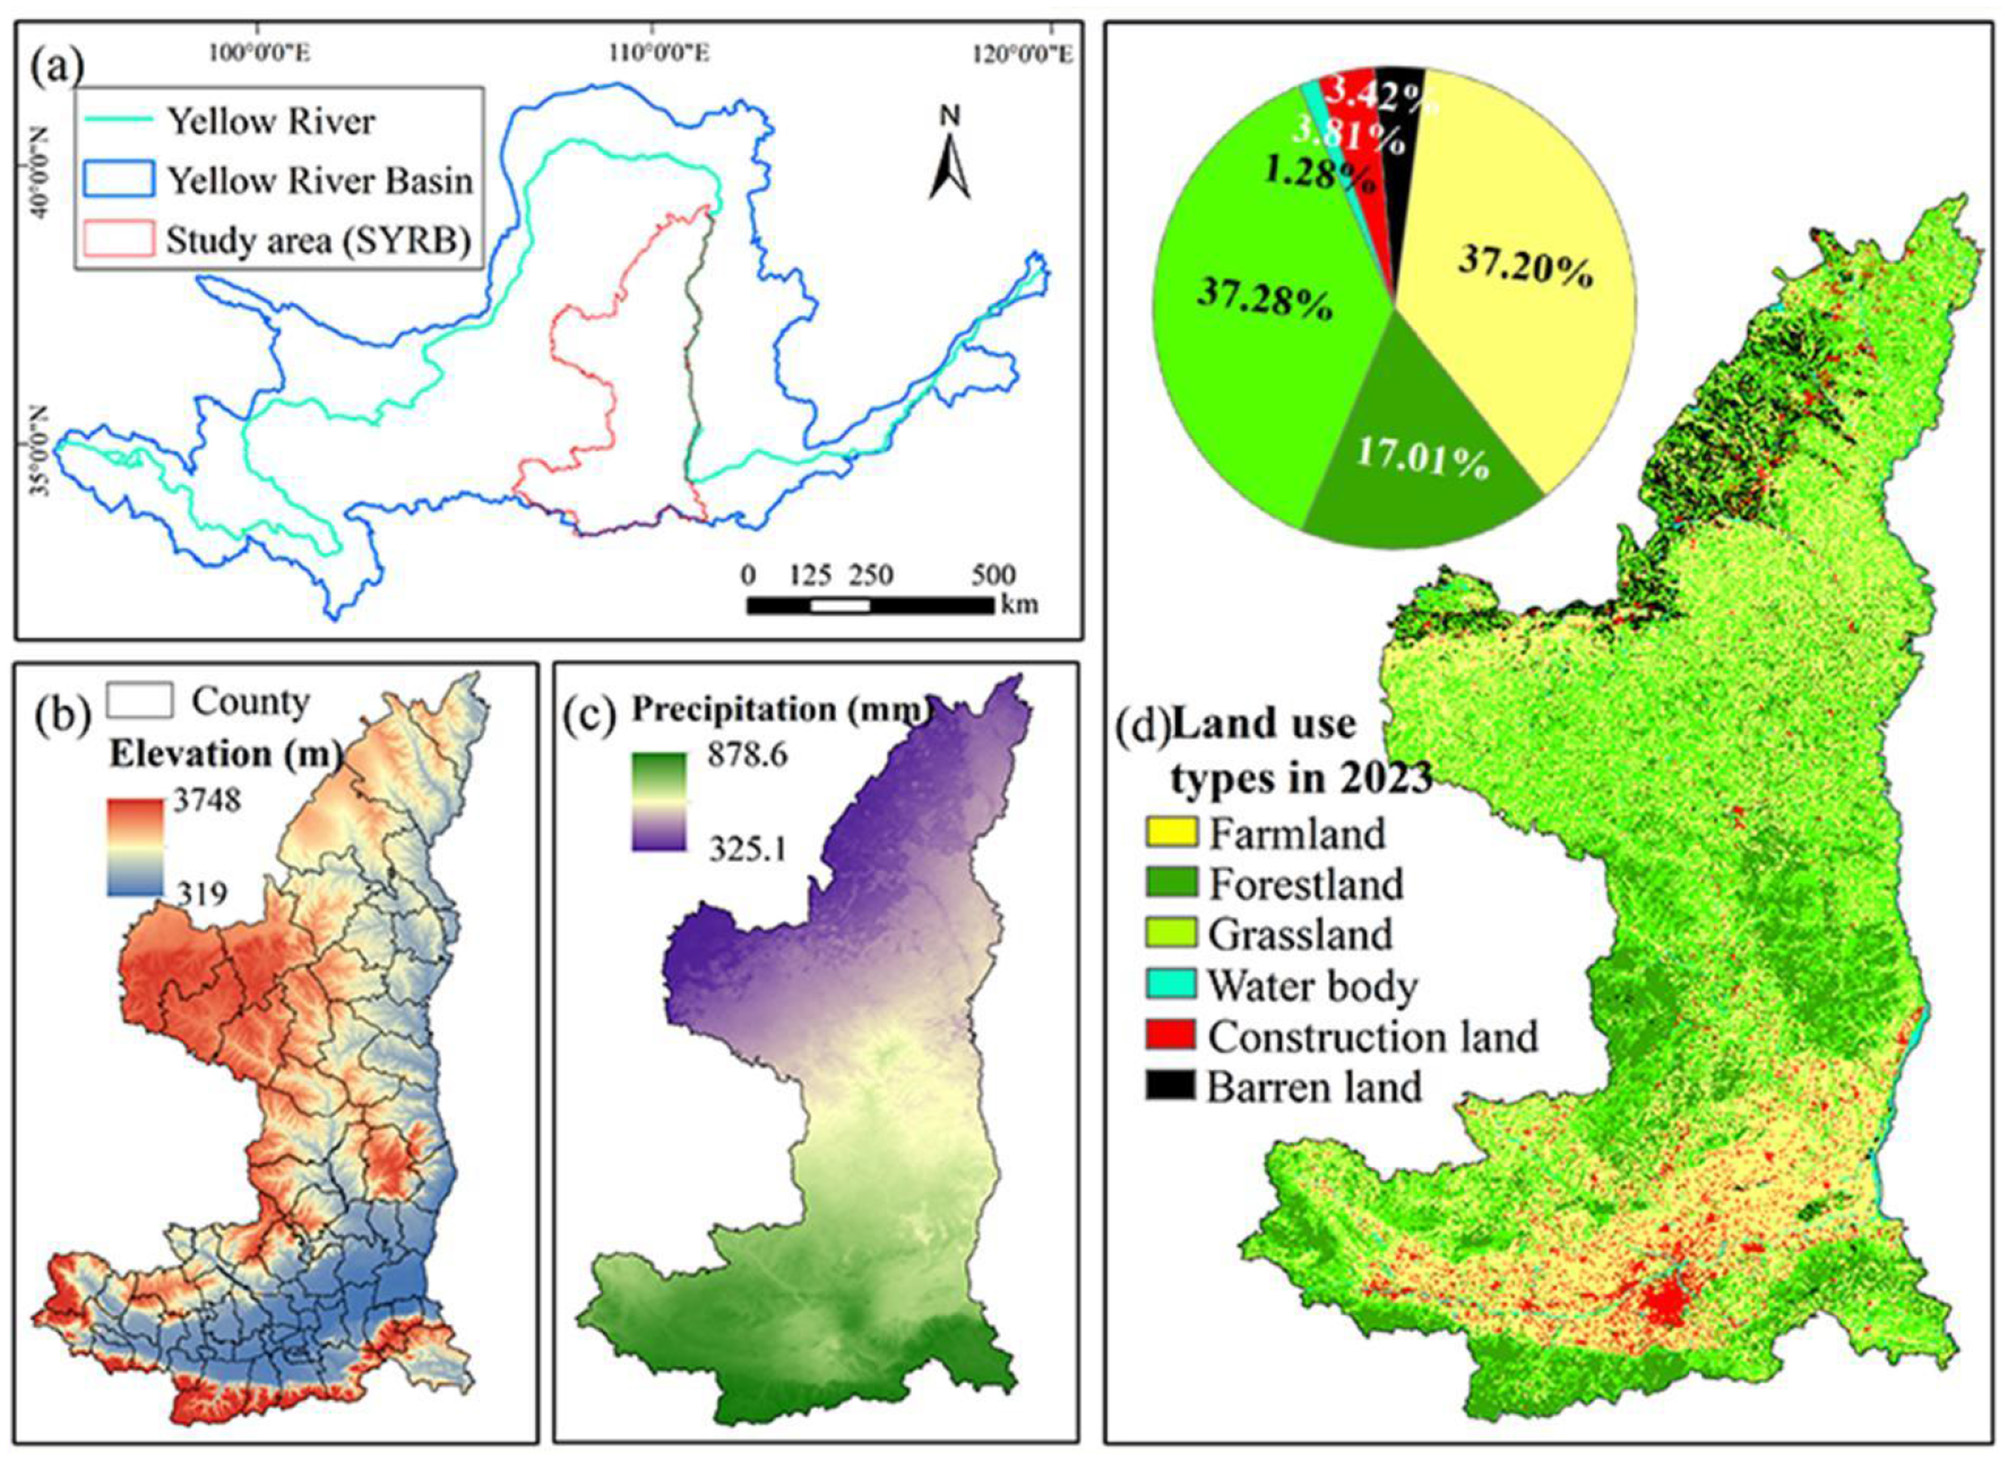
Study area: (a) location, (b) administrative division and elevation, (c) precipitation, and (d) land use type.
2.2 Data description
The study data were collected in 2000 (at the initiation of vegetation restoration) and in 2023 (after 3 years of restoration implementation). The datasets used in this study include the following:
-
(1) The Geospatial Data Cloud (http://www.gscloud.cn/) provided digital elevation model (DEM) data (90 m × 90 m).
-
(2) The Harmonized World Soil Database v1.1 (https://www.doi.org/10.12072/ncdc.westdc.db3647.2023) provided soil-related data (1 km × 1 km).
-
(3) The National Meteorological Information Center (http://data.cma.cn/) provided annual climatic data. Ordinary Kriging was used to change the climatic data to a spatial resolution of 1 km × 1 km.
-
(4) The Data Center for Resources and Environmental Sciences, Chinese Academy of Sciences (http://www.resdc.cn/) provided net primary production (NPP) data (1 km × 1 km) and land use data (30 m × 30 m).
-
(5) The National Tibetan Plateau Data Center (https://data.tpdc.ac.cn/) provided fractional vegetation cover data (250 m × 250 m).
-
(6) The Statistical Yearbook (https://data.cnki.net/), and Water Resources Bulletin published by the relevant regions, provided population, GDP, carbon emissions, and water consumption data. The missing carbon emissions and water consumption data for some counties were estimated using the average value for the municipal scale.
2.3 Quantification of ESs supply and demand
In this study, the ES indicators were selected based on the following criteria: (1) indicators must accurately reflect the ecological reality of the SYRB, such as water shortage and soil erosion; (2) indicators must be closely linked to the primary goals of vegetation restoration projects implemented in the SYRB, which aim to reduce soil erosion and increase carbon fixation; and (3) indicators must be quantified using established models and available data. Ultimately, three indicators that are particularly important to the SYRB were selected: water yield, soil conservation, and carbon fixation.
Additionally, the analysis in this study was conducted at the county scale for two main reasons: (1) demand data for certain ES indicators are not available at the grid scale; and (2) the county scale corresponds to the level at which many formal ecological management decisions are made in China, so the analysis at this scale can directly provide useful information for managers. However, the county scale has not previously been used in relevant research pertaining to SYRB, which may limit its effectiveness in supporting the formulation and implementation of ecological policies. Specifically, some indicators, such as water yield supply, soil conservation supply and demand, carbon fixation supply, and some latent drivers such as elevation, slope, temperature, precipitation, and fractional vegetation cover, at the grid scale were aggregated to the county level using ArcGIS 10.2 platform. To reduce methodological artifacts, water yield demand, carbon fixation demand, and some latent drivers, such as forest and grassland percentage, economic density, and population density, were calculated directly from raw data at the county scale.
2.3.1 Water yield (WY)
2.3.1.1 Water yield supply
The water yield (WY) supply for the SYRB was calculated using InVEST model, which is based on the principle of water balance, and considers the difference between precipitation and actual evapotranspiration in each grid to calculate WY (Yang et al., 2021). The formula for calculating WY is as follows:
Where WYx_supply is the WY supply,AETx is the annual actual evapotranspiration, and Px is the annual precipitation. For more detailed information on parameter calculation, please refer to the Supplementary material.
2.3.1.2 WY demand
The WY demand reflects the requirements and consumption of water resources by human social systems, while excluding losses caused by natural processes such as vegetation uptake and river interception (Hou et al., 2023; Li et al., 2025). Referring to existing research, the WY demand is calculated using regional water resource consumption (Larondelle and Lauf, 2016; Ding and Sun, 2023; Meng and Zhao, 2024; Zhou et al., 2025). By multiplying the collected per capita water consumption and population density, a measure of WY demand in different counties is calculated by the following formula:
where WYx_demand is the WY demand; Ppop is the population density; and Wper is the per capita water consumption, for each gridx.
2.3.2 Soil conservation
2.3.2.1 Soil conservation supply
The soil conservation (SC) supply is calculated as the difference between the potential amount of soil erosion and the actual amount of soil erosion, that is, the soil erosion that would occur in the absence of vegetation cover or land management measures minus the erosion observed under current vegetation cover management and soil and water conservation practices (Yang et al., 2021). The study adopted Revised Universal Soil Loss Equation (RUSLE) to quantify the SC supply by the following formula:
Where SCx_supply is the SC supply; Apx is the potential amount of soil erosion; Aax is the actual amount of soil erosion; Rx is the rainfall erosivity factor; Kx is the soil erodibility factor; Lx and Sx are the slope length and slope factors; Cx is the vegetation management factor; and Px is the soil and water conservation measures factor, for each grid x. For further information on parameter calculation, please refer to the Supplementary material.
2.3.2.2 Soil conservation demand
The actual amount of soil erosion represents the soil that human society expects to be managed and retained, as erosion poses significant threats to agricultural production, infrastructure, drinking water safety, and human life. This risk creates a human demand for erosion control (Chen et al., 2024; Meng and Zhao, 2024; Zhang J. et al., 2025). As such, the actual amount of soil erosion serves as a direct proxy for quantifying the SC demand (Jian et al., 2024; Li et al., 2025; Zhai et al., 2025) and is calculated using Equation 5.
2.3.3 Carbon fixation
2.3.3.1 Carbon fixation supply
In this study, carbon dioxide consumed by photosynthesis was used as an indicator to measure the carbon fixation (CF) supply. According to the formula describing photosynthesis, 1.63 g carbon dioxide is required to produce 1 g dry matter, and 1 g dry matter contains approximately 45% carbon (Zhao et al., 2018; Zhang J. et al., 2025). The calculation formula for CF is as follows:
where CFx_supply is the CF supply and NPP(x, t) is the NPP value, for each gridx.
2.3.3.2 Carbon fixation demand
To quantify the CF demand, carbon dioxide emissions (Larondelle and Lauf, 2016; Cui et al., 2019; Liu et al., 2024) were used in this study. Within the context of achieving carbon neutrality, the current anthropogenic emission level represents the sequestration effort needed to offset its climatic impact, thereby defining the societal demand for the carbon fixation service. This conceptualization is commonly adopted as a standard practice in relevant literature (Hou et al., 2023; Wang et al., 2025). Therefore, referring to previous studies (Ding and Sun, 2023; Zhai et al., 2025; Zhou et al., 2025), the CF demand was quantified using population density and per capita carbon emissions, and the calculation formula is as follows:
where CFx_demand is the CF demand and Cper is the per capita carbon emissions, for each grid x.
2.4 ESs supply-demand matching relationship
The ESs supply-demand ratio (ESDR) is an indicator that reflects the relationship between the actual supply and human space demand for ESs (Lu et al., 2024; Li et al., 2025). The ESDR is used to evaluate the supply-demand matching relationship for WY and CF. The calculation formula is as follows:
where ESDRi is the ESi supply-demand matching relationship, a positive value indicates surplus, a negative value indicates deficit, and zero indicates balance; and ESi_supply and ESi_demand are the supply value and demand values of ESi, respectively.
To quantify the matching relationship between SC supply and SC demand, it was not appropriate to use Equation 8. Previous studies have shown that the maximum allowable amount of soil erosion should not be more than 427 t/(km2·a) for the SYRB to maintain a certain level of productivity or to ensure that the crop yield can reach the stipulated level of economic production (Yang et al., 2020; Meng and Zhao, 2024). Therefore, the following formula was used to quantify the SC supply-demand matching relationship:
where ESDRSC is the SC supply-demand matching relationship and Aa is the actual amount of soil erosion and can be calculated by Equation 5.
2.5 Identifying the social-ecological drivers
2.5.1 Selection of latent drivers
Based on the reference of relevant research and in combination with the actual situation of SYRB, this study selected latent drivers from four aspects, topographic conditions, climatic factors, vegetation restoration and socioeconomic situations, and then established a subset of latent drivers for the ESs supply and demand relationship (Table 1). Among them, in terms of topographic conditions, elevation and slope were selected; in terms of climatic factors, annual average temperature and average precipitation were selected; in terms of vegetation restoration, fractional vegetation cover and forest and grassland percentage were selected; and in terms of socioeconomic situations, economic density and population density were selected.
Table 1
| Variable category | Variable | Abbreviation | Unit | |
|---|---|---|---|---|
| Dependent variables | ESs supply-demand ratio | ESDR | – | |
| Independent variables | Topographic conditions | Elevation | ELE | m |
| Slope | SLO | ° | ||
| Climate factors | Annual average temperature | TEM | °C | |
| Annual average precipitation | PRE | mm | ||
| Vegetation restoration | Fractional vegetation cover | FVC | % | |
| Forest and grassland percentage | FGP | % | ||
| Socioeconomic situations | Economic density | GDP | 104 yuan/km2 | |
| Population density | POP | People/km2 | ||
Details of variables examined to investigate influences on the ESs supply and demand relationship.
2.5.2 Modeling the drivers
A traditional Geodetector requires manual classification of variable categories, which has problems such as strong subjectivity and poor calculation accuracy (Cui et al., 2022; Dong et al., 2023). On the contrary, the optimal parameter Geodetector can discretize and optimize continuous variables through five classification methods (i.e., equal interval, natural breakpoint interval, quantile interval, geometric interval, and standard deviation interval), thereby obtaining the optimal parameters (classification method and interval number) that yield the highest Q value (Lin et al., 2025; Liu et al., 2025). This study adopts the optimal parameter Geodetector to discover the influencing factors of the ESs supply and demand relationship. The formula for calculating Q value is as follows:
where Q represents the influence intensity of latent drivers on the ESs supply and demand relationship. The larger the Q value, the stronger the influence intensity. L represents the number of strata of variables, Nh and N represent the number of samples in region h and the total number of samples, respectively, and and Nσ2 are the variance of region h and the overall variance of the whole region, respectively.
3 Results
3.1 Spatiotemporal characteristics of ESs supply and demand
3.1.1 ESs supply
The supply of three ESs, namely water yield, soil conservation, and carbon fixation, in SYRB from 2000 to 2023 exhibited significant spatiotemporal heterogeneity (Figure 2). The water yield supply improved considerably during the study period, rising from 30.08 mm in 2000 to 72.53 mm in 2023. Spatially, the water yield in both years showed a spatial distribution pattern of being higher in the south and lower in the north. Over time, each county showed an increasing trend. The results concluded that the water yield in the southern part of SYRB had the highest rate of increase when compared to the northern part. The SC supply in the SYRB was 57,063.18 t/km2 in 2000 and 66,183.55 t/km2 in 2023, showing an overall increasing trend. SC supply showed a spatial variation pattern of “high–low–high–low” zones from south to north. Over time, the supply in the high-value SC supply area in the southern region decreased, while the soil conservation supply in other regions showed an increasing trend, with the most significant increase in the central region of the study area. The regional average values of CF supply in 2000 and 2023 were 804.42 and 1,618.13 t/km2, respectively, both showing a spatial variation pattern of being higher in the south and lower in the north. From 2000 to 2023, the CF supply increased in all counties of the SYRB. The increase in CF was predominant in the central region of the SYRB, while the increase in the northern region was relatively small.
Figure 2
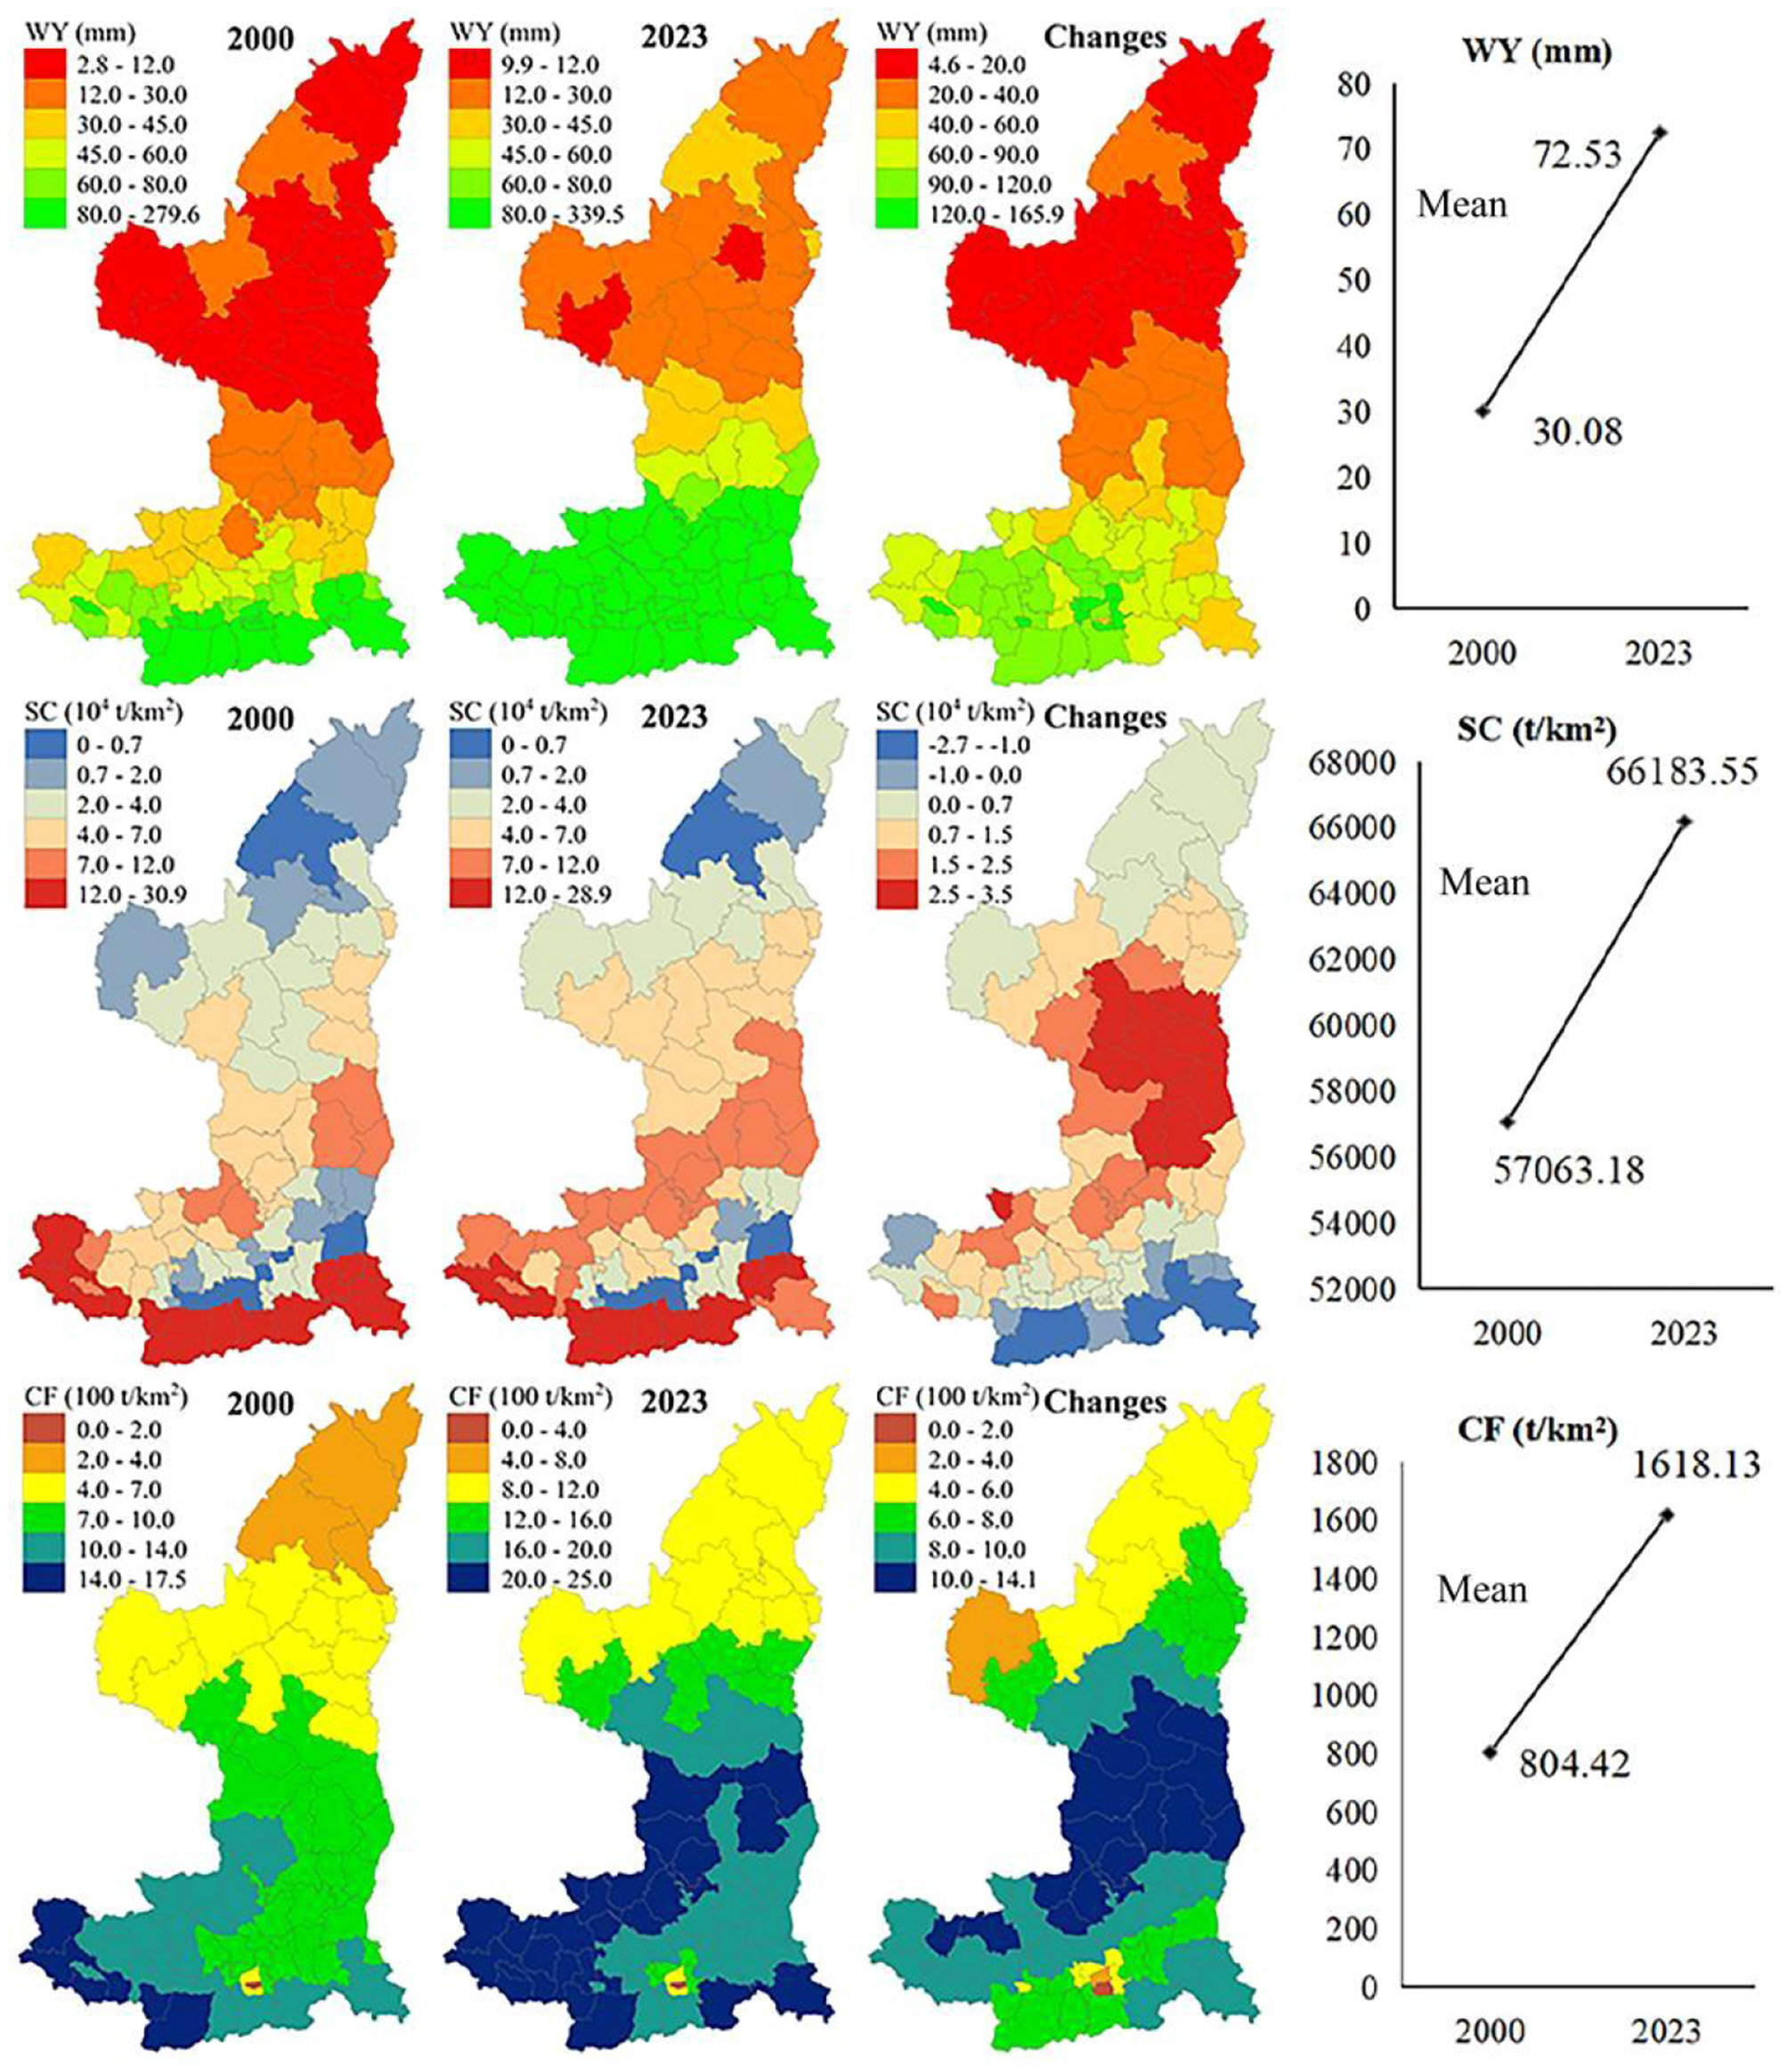
The spatiotemporal variations of ESs supply in the SYRB. WY, water yield; SC, soil conservation; CF, carbon fixation.
3.1.2 ESs demand
Similar to ESs supply, the demand for three ESs—water yield, SC, and CF—in the SYRB from 2000 to 2023 also showed significant spatiotemporal heterogeneity (Figure 3). The average value of water yield demand for the SYRB in 2000 and 2023 was 89.32 mm and 101.53 mm, respectively, which indicates that the total water yield demand increased during this period. The water yield demand in the 2 years showed similar spatial distribution characteristics. The high-value areas of water yield demand were mainly distributed in the Guanzhong Plain region, while the low-value areas were mainly located in the northern Shaanxi region. Over time, the counties where the demand for water yield has increased are mainly located in the northern region, while the demand for water yield in the Guanzhong Plain has decreased. Soil conservation demand (i.e., soil erosion amount) decreased significantly from 2000 to 2023. The regional average value in 2000 was 1,271.10 t/km2, and in 2023, it was 426.24 t/km2. Spatially, it generally showed a spatial distribution pattern of lower in the south and higher in the north. During the study period, the soil erosion in almost all the counties decreased. Overall, the soil erosion conditions showed most prominent improvement in the northern Shaanxi region. From 2000 to 2023, the CF demand in the SYRB increased from 607.73 to 2,933.67 t/km2. The 2 years exhibited a similar spatial distribution pattern, and the high-value area of CF demand was mainly located in the Guanzhong Plain. During the study period, the CF demand increased in all counties, with the most significant increase observed in the Guanzhong Plain and the northern region as a whole.
Figure 3
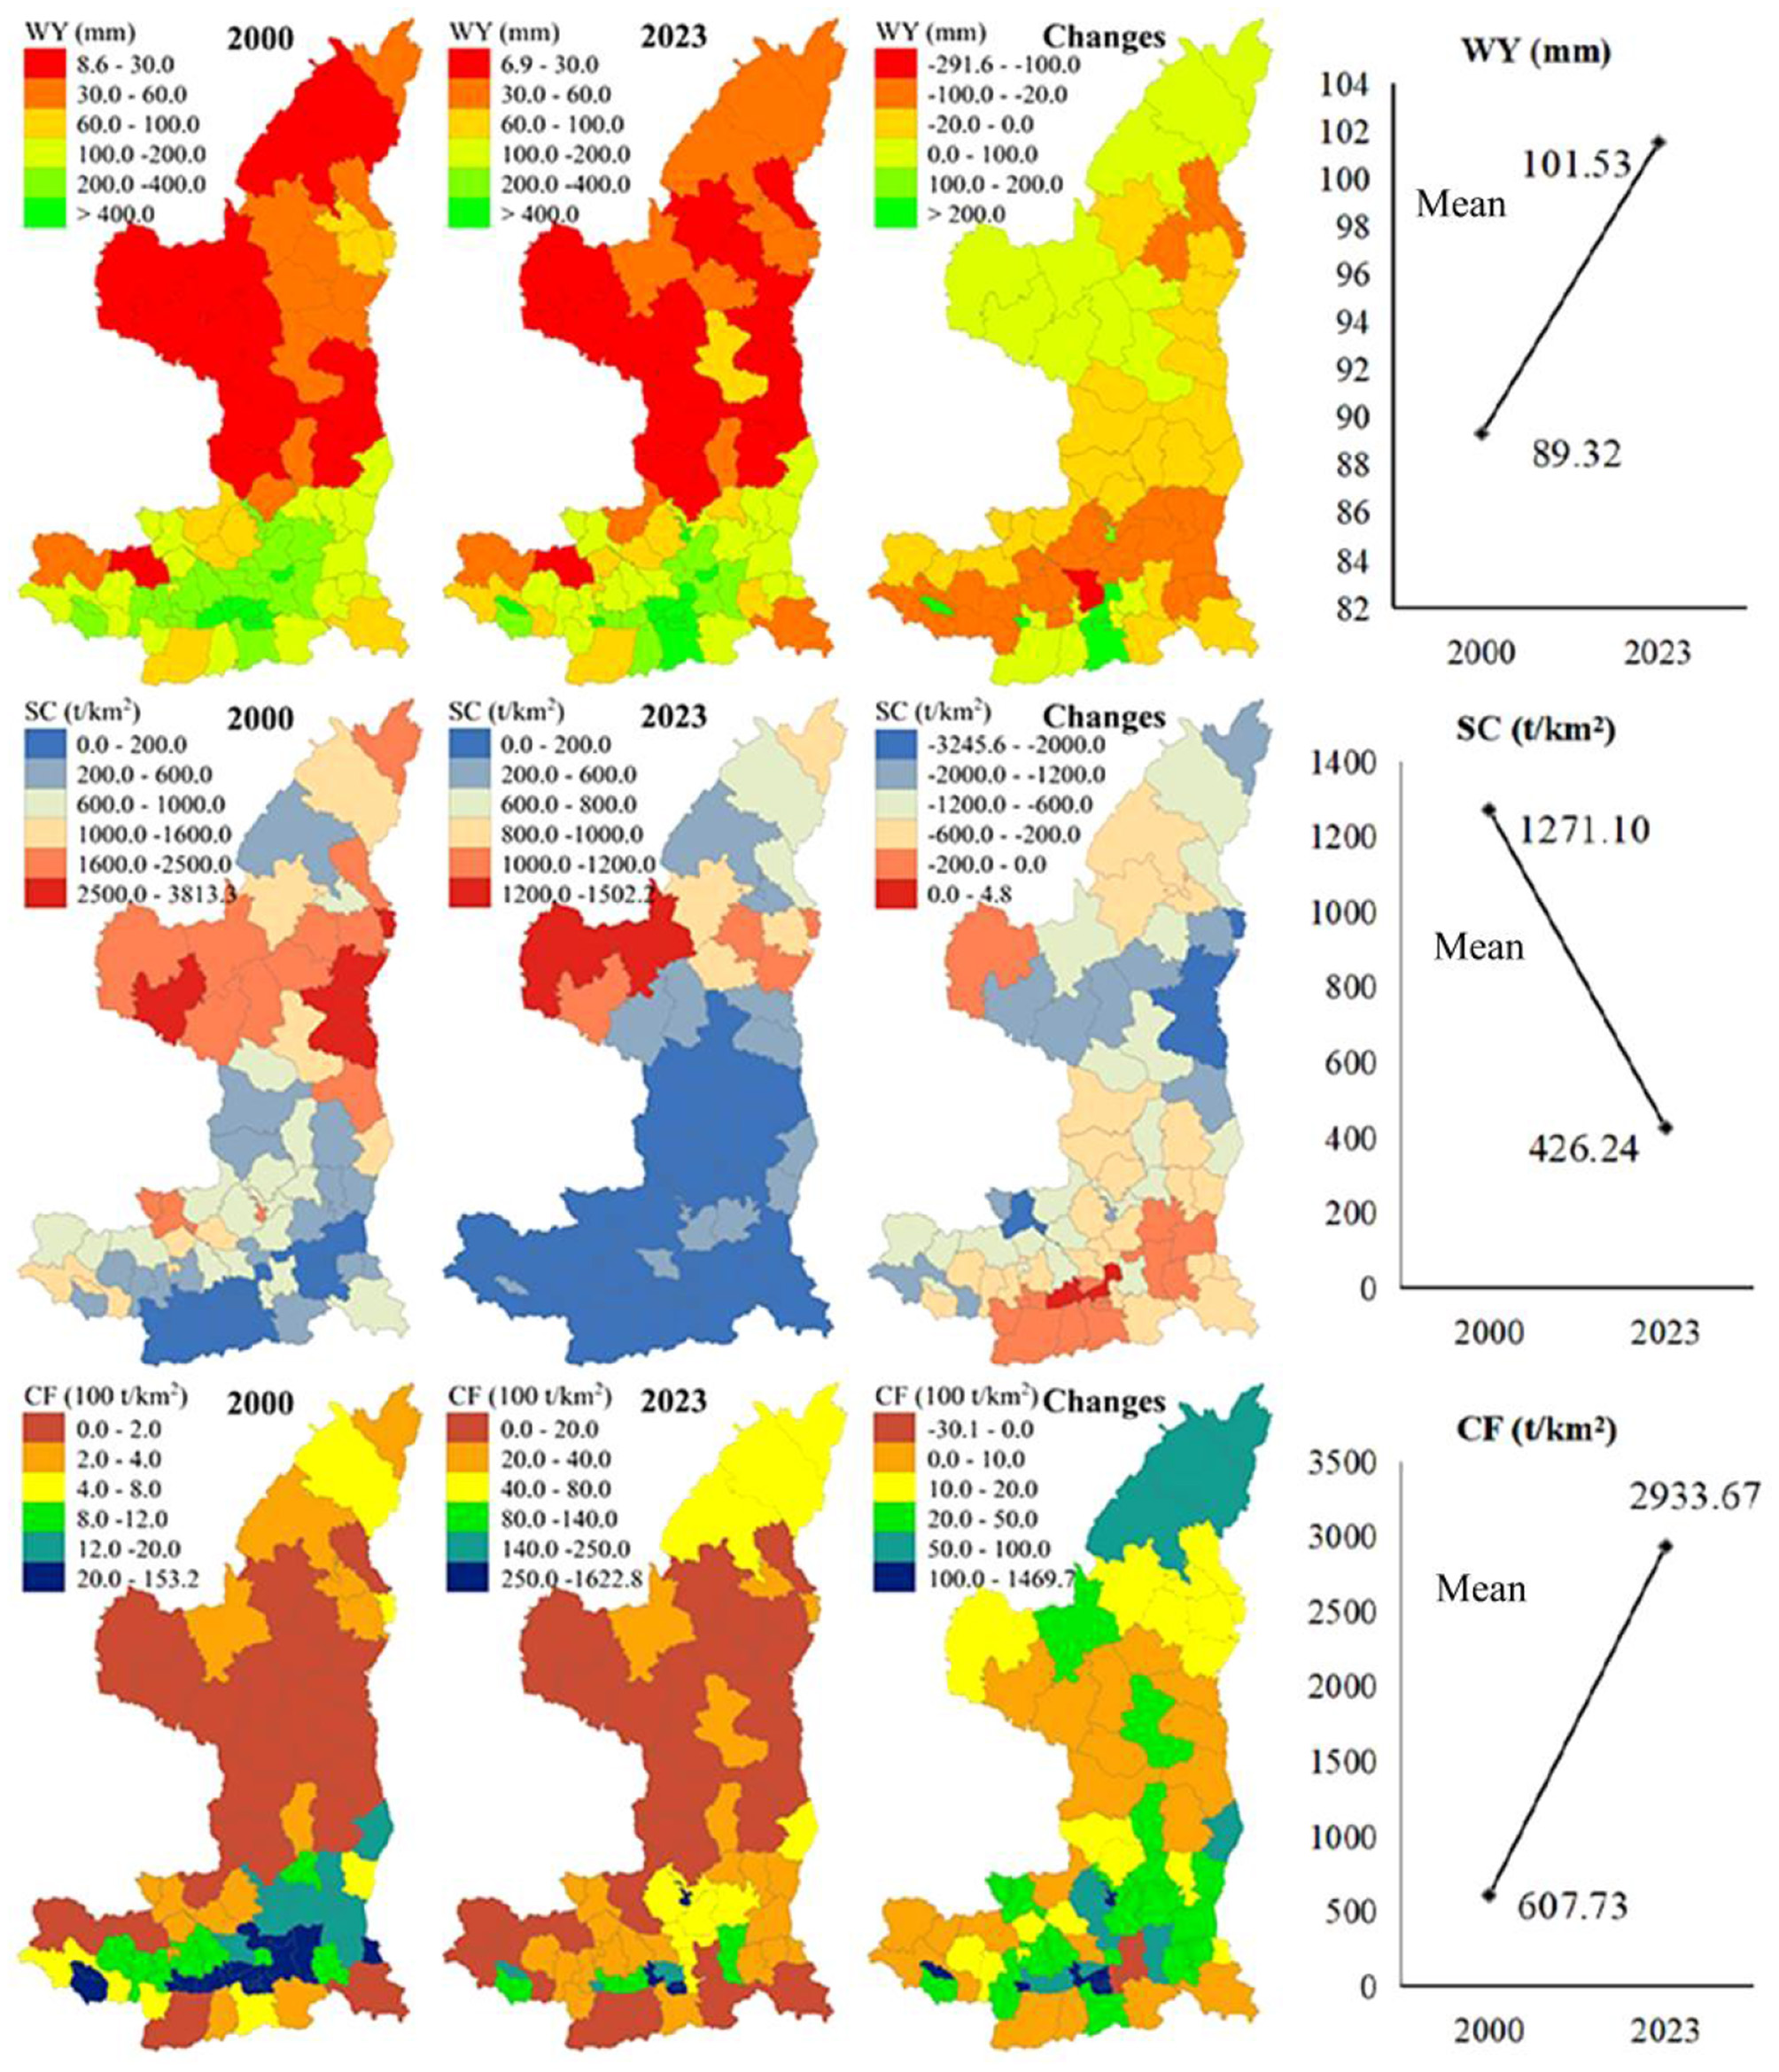
The spatiotemporal variations of ESs demand in the SYRB. WY, water yield; SC, soil conservation; CF, carbon fixation.
3.2 ESs supply-demand matching relationship
3.2.1 Time variation characteristics of ESDR
In 2000 and 2023, the ESDR of the three ESs exhibited different performances (Figure 4). Overall, the mean values of ESDR for WY, SC, and CF in 2000 were negative, negative, and positive, respectively, and in 2023, they were negative, positive, and negative, respectively. The mean values of ESDR for water yield and soil fixation increased over time, while the mean value of ESDR for carbon fixation decreased. Specifically, although the ESDR for water yield in the vast majority of counties was negative in 2000, indicating a state of supply falling short of demand, the ESDR has shown a positive trend toward positive over time. Regarding SC, in 2000, more than half of the counties had negative ESDR values. Over time, there has been a positive direction toward positive values, resulting in the majority of counties showing positive ESDR values in 2023. For CF, the ESDR in most counties shows a deteriorating trend, which in turn leads to the mean value of ESDR for CF reversing from a positive state of oversupply in 2000 to a negative state of insufficient supply.
Figure 4
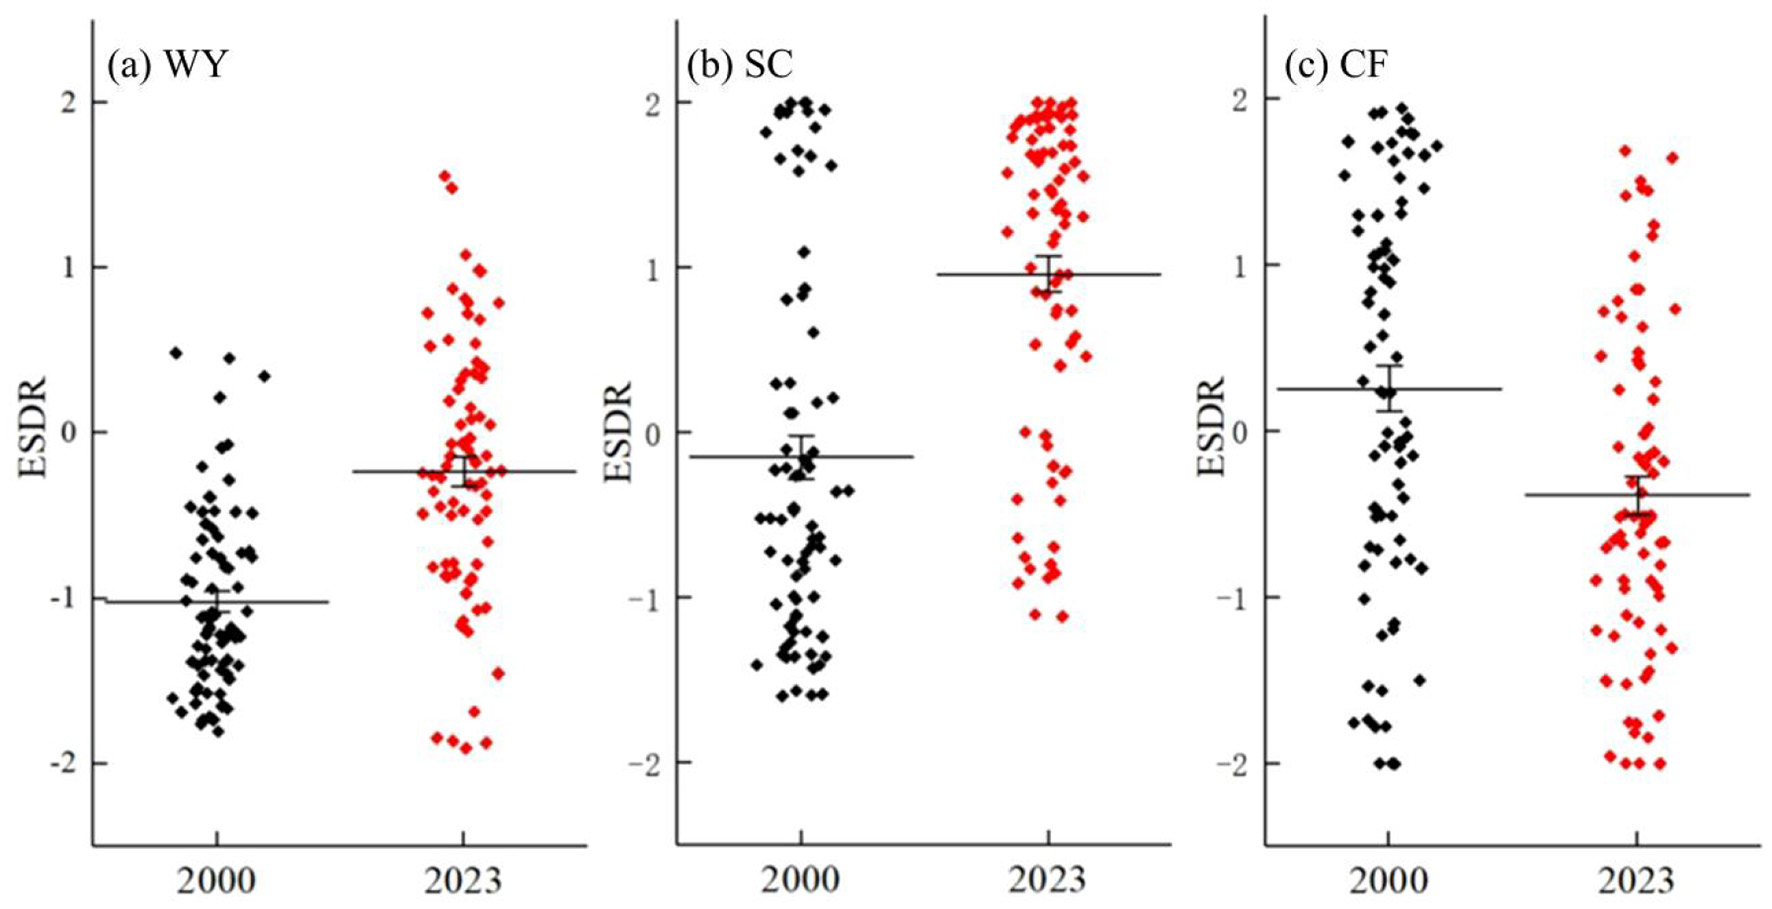
The temporal variations of ESDR in the SYRB: (a) WY, (b) SC, and (c) CF. WY, water yield; SC, soil conservation; CF, carbon fixation.
3.2.2 Spatial pattern of ESDR
The ESs supply-demand matching relationship in the SYRB is spatially unstable (Figure 5). There are obvious differences in the supply-demand matching relationship of the same ESs in different counties or different ESs in the same county, and there are also significant differences among different years.
Figure 5
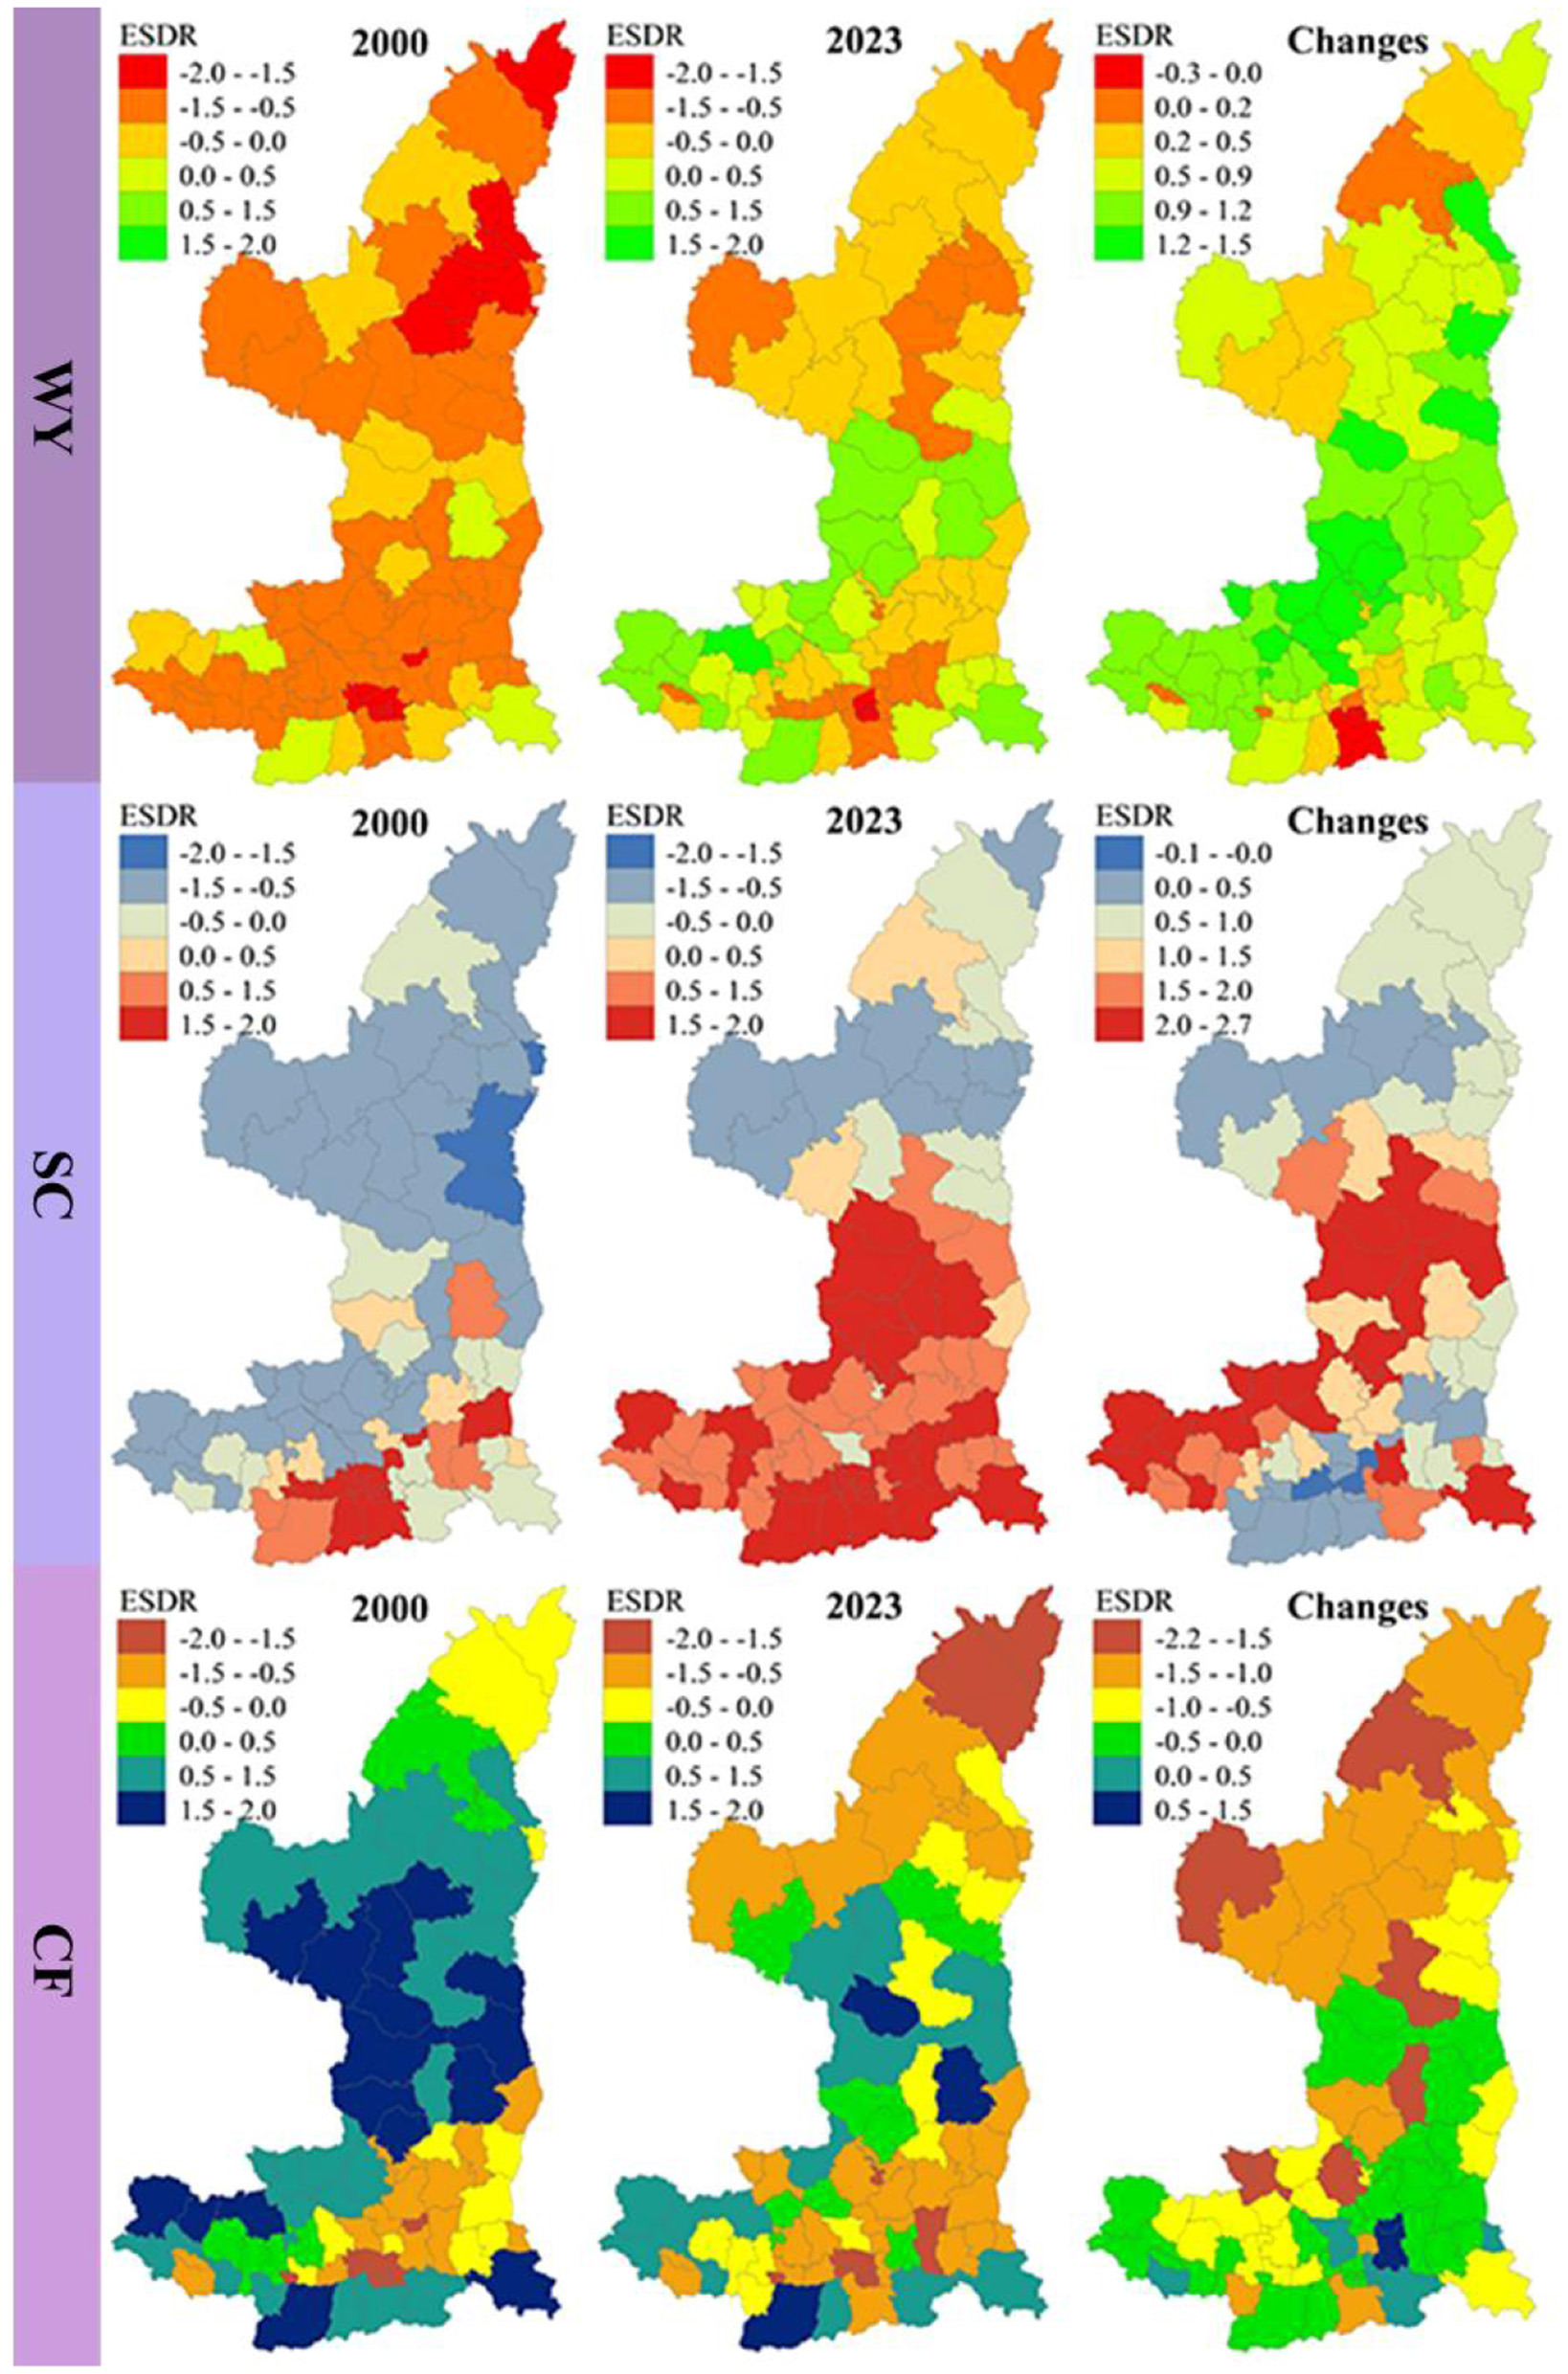
The spatial variations of ESDR in the SYRB. WY, water yield; SC, soil conservation; CF, carbon fixation.
In 2000, counties with negative ESDR (i.e., supply falling short of demand) almost covered the entire study area for both WY and SC. However, by 2023, WY was in short supply mainly in the northern region and the Guanzhong Plain, and SC was in short supply mainly in the northern region. From 2000 to 2023, the ESDR for WY and SC in the vast majority of counties in the study area have shown an increasing trend. This phenomenon suggests that the supply-demand matching relationship of these two ESs has exhibited a notable improvement trend, particularly within the central region of the study area. For CF, in 2000, counties with positive ESDR were widely distributed, while those with negative ESDR were relatively few and mainly located in the Guanzhong Plain region of the SYRB. Over time, the ESDR in most counties exhibited a deteriorating trend, with conditions in 2023 being markedly worse than in 2000. Notably, CF shifted from an oversupply in 2000 to a deficit in 2023, with the deterioration trend being most prominent in northern Shaanxi.
3.3 Social-ecological drivers for ESs supply-demand matching relationship
3.3.1 Parameter discretization results
In this study, we use the optimal parameter Geodetector R package to determine the optimal parameters for the discretization of spatial data. Specifically, for each latent driving factor, the Q values under different discretization methods and different numbers of discrete categories are calculated, and the results are shown in Figure 6. It can be observed that different discretization methods and the number of discrete categories will cause significant fluctuations in the Q value, that is, different combinations of discretization will have a significant impact on the driving mechanism. Therefore, for the different potential driving factors under the supply-demand matching relationship of different ESs, we selected the discretization combination with the largest Q value as the optimal parameter for data discretization in this study. For instance, when it comes to WY, the Q value reaches its maximum when the slope is divided into six categories by the quantile method. Therefore, in the exploration of the driving mechanism of the WY supply and demand matching relationship, the quantile (classification method) and six categories (interval number) should be adopted as the optimal parameters for the slope in Geodetector, and the optimal parameter selection for other latent drivers should also follow this method.
Figure 6
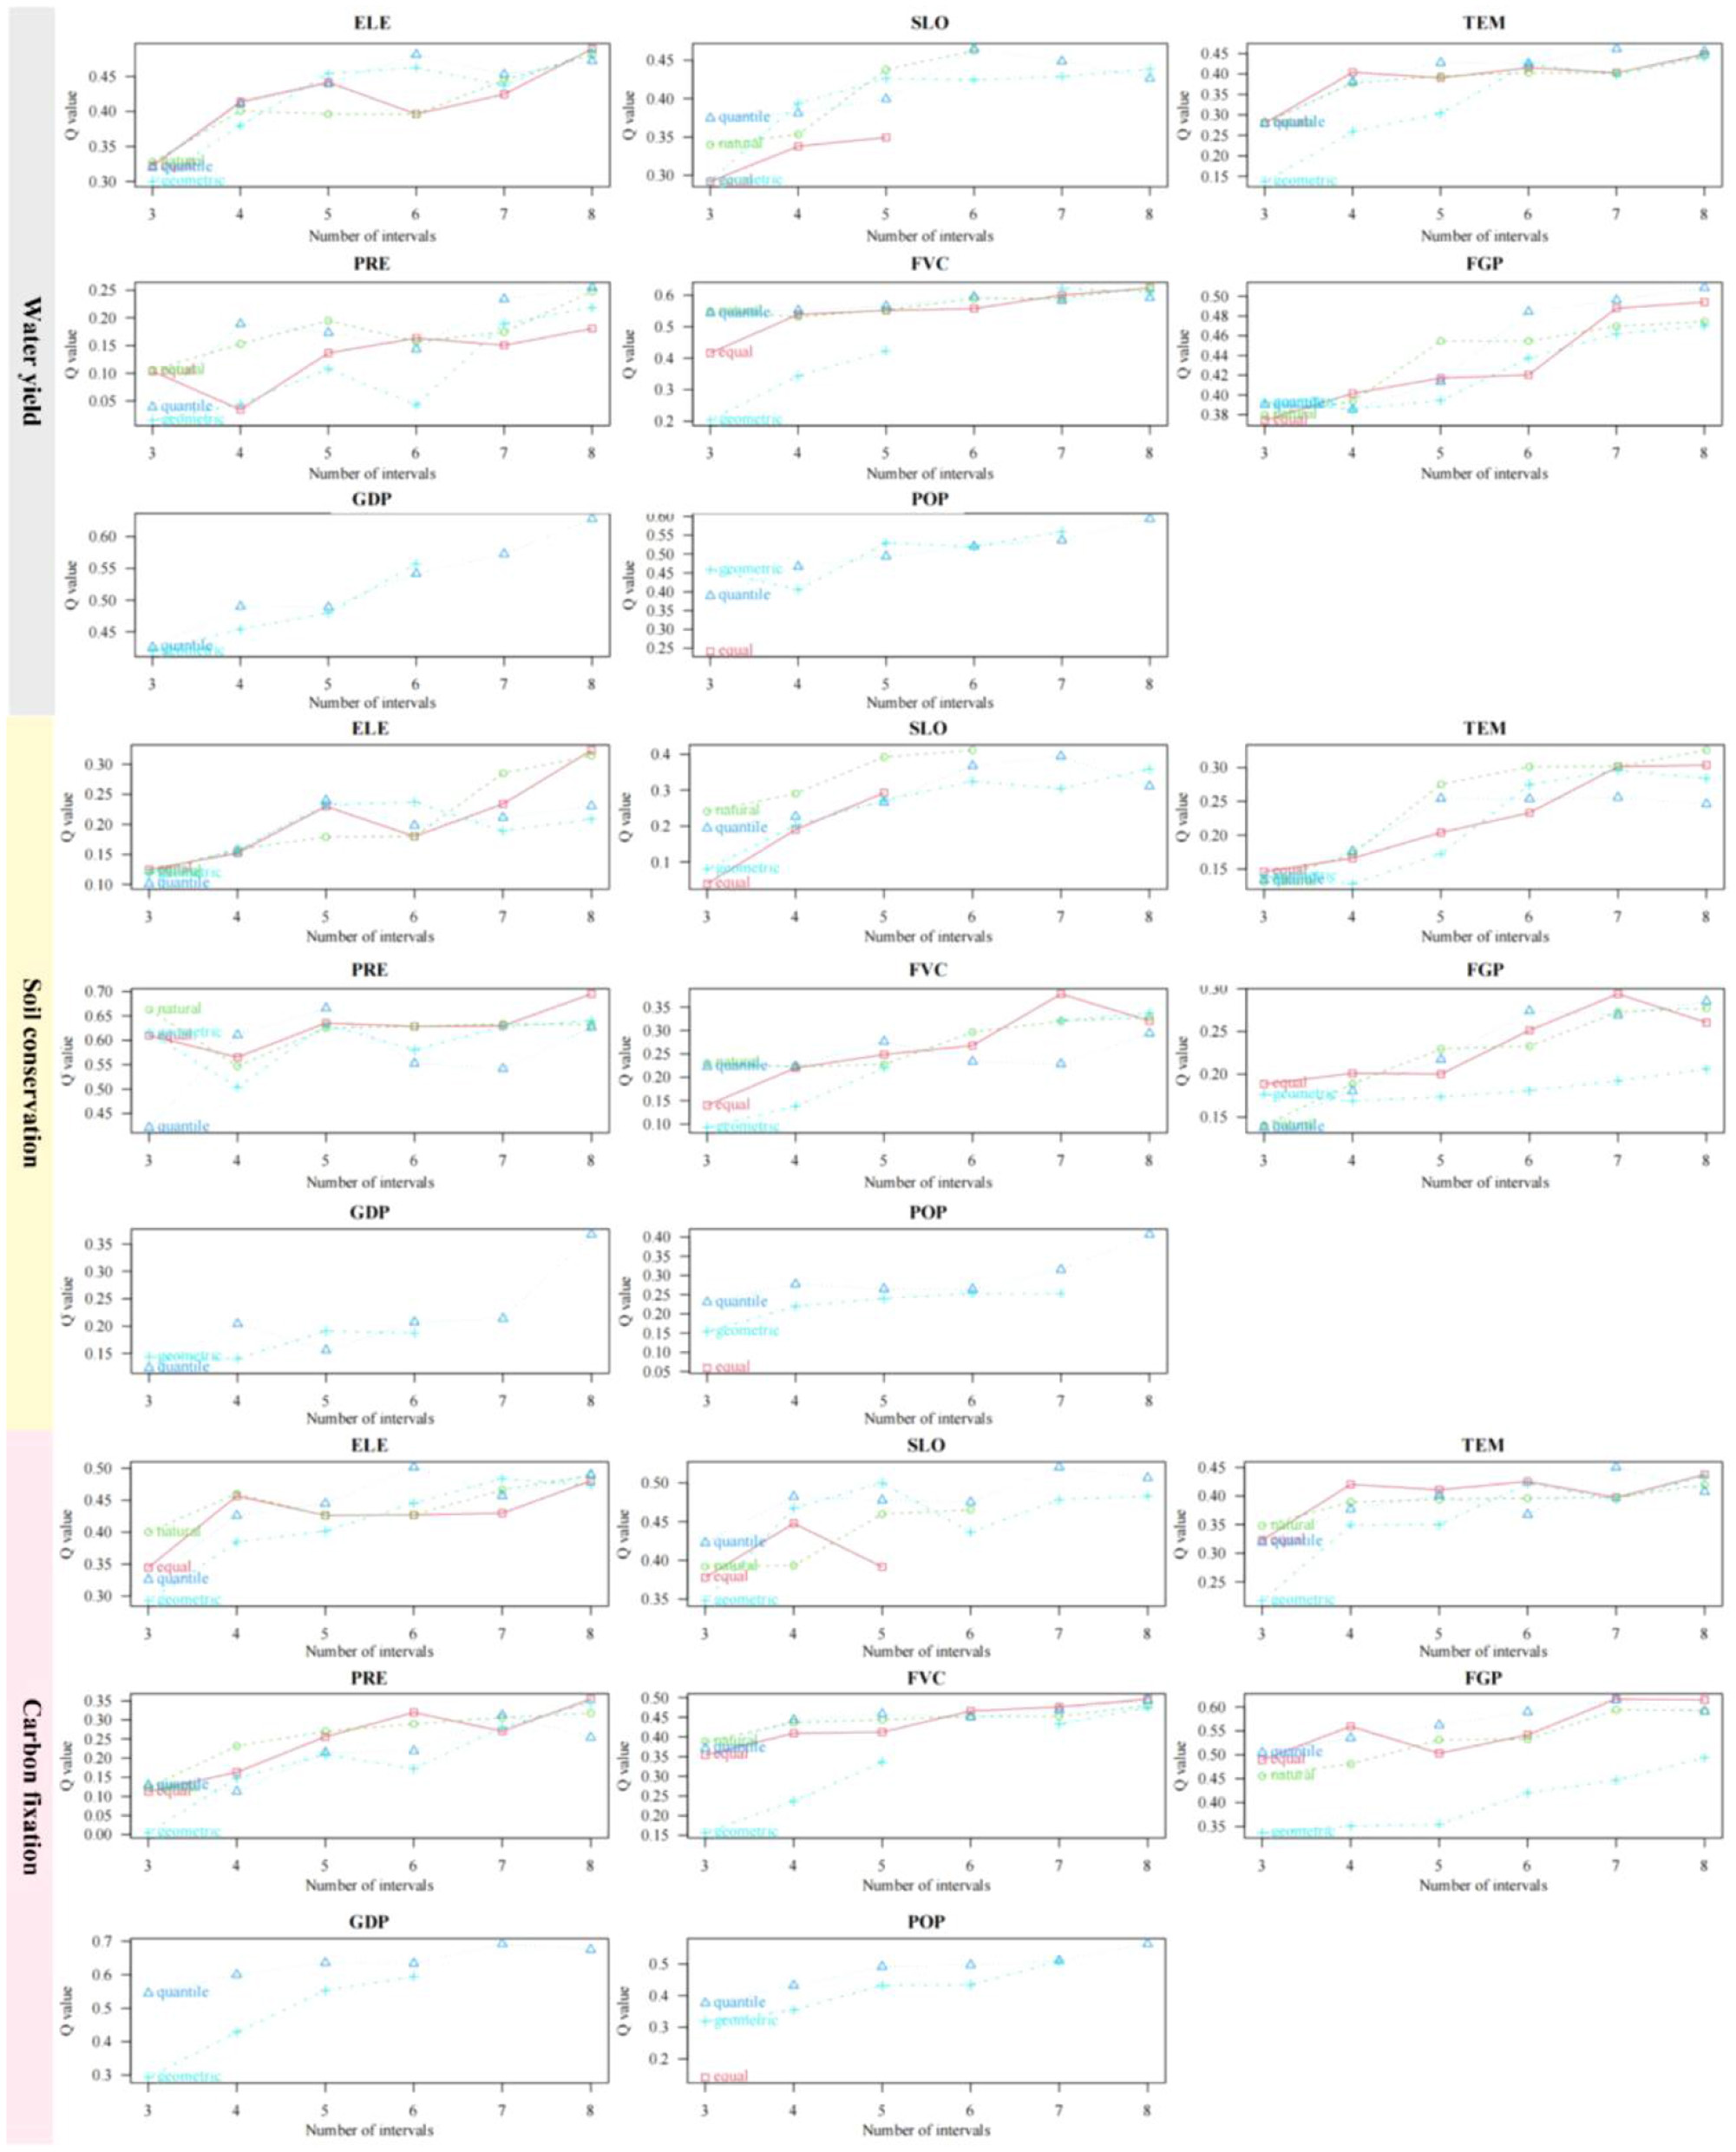
Discretization results for continuous variables. ELE, average elevation; SLO, average slope; TEM, annual average temperature; PRE, annual average precipitation; FVC, fractional vegetation cover; FGP, forest and grassland percentage; GDP, economic density; POP, population density.
3.3.2 Factor detection results
This study conducted single-factor detection on eight socio-ecological driving factors under the supply-demand matching relationship of three ESs, namely WY, SC, and CF, based on the optimal parameter Geodetector method. The Q value results of each driving factor are shown in Table 2. For the water yield supply-demand matching relationship, the Q value of economic density is the highest, which is 0.628, indicating that its influence on the water yield supply-demand matching relationship is the strongest. Immediately following are fractional vegetation cover and population density respectively, with Q values of 0.611 and 0.596, respectively. Therefore, economic density, fractional vegetation cover, and population density are the core factors influencing the water yield supply-demand matching relationship in the SYRB. For the soil conservation supply-demand matching relationship, precipitation has the greatest influence intensity, with a Q value of 0.692. Next are slope and population density, with Q values of 0.416 and 0.410, respectively, are secondary factors affecting the soil conservation supply-demand matching relationship. In addition, fractional vegetation cover and economic density also have a relatively strong influence on soil conservation supply-demand matching relationship. There are significant differences in the influence intensity of each factor on the carbon fixation supply-demand matching relationship. Among them, economic density, with the largest Q value (0.692), becomes the strongest factor affecting the carbon fixation supply-demand matching relationship, followed by the forest and grassland percentage, with a Q value of 0.609, and then population density, with a Q value of 0.573. Overall, vegetation restoration and socioeconomic driving factors dominate the supply-demand matching relationship of water yield and carbon fixation, while factors such as rainfall and slope dominate the supply-demand matching relationship of soil conservation.
Table 2
| No. | Variable | WY | SC | CF | |||
|---|---|---|---|---|---|---|---|
| Q value | p value | Q value | p value | Q value | p value | ||
| 1 | ELE | 0.489 | *** | 0.316 | *** | 0.502 | *** |
| 2 | SLO | 0.465 | *** | 0.416 | *** | 0.518 | *** |
| 3 | TEM | 0.461 | *** | 0.319 | *** | 0.450 | *** |
| 4 | PRE | 0.255 | ** | 0.692 | *** | 0.355 | *** |
| 5 | FVC | 0.611 | *** | 0.380 | *** | 0.496 | *** |
| 6 | FGP | 0.503 | *** | 0.294 | *** | 0.609 | *** |
| 7 | GDP | 0.628 | *** | 0.371 | *** | 0.692 | *** |
| 8 | POP | 0.596 | *** | 0.410 | *** | 0.573 | *** |
The Q value of influencing factors.
WY, water yield; SE, soil conservation; CF, carbon fixation; ELE, average elevation; SLO, average slope; TEM, annual average temperature; PRE, annual average precipitation; FVC, fractional vegetation cover; FGP, forest and grassland percentage; GDP, economic density; POP, population density.
** p < 0.05.
*** p < 0.001.
4 Discussion
4.1 Improvement of ES supply after vegetation restoration
The implementation of large-scale vegetation restoration projects has been a dominant force driving ecological changes in the SYRB since 2000. The quantification reveals a marked overall enhancement in the supply capacity of key ESs—WY, SC, and CF—across the study period, underscoring the positive biophysical effects of ecological engineering.
The regional average soil conservation supply increased by 16% from 2000 to 2023, consistent with findings from (Wu et al. 2019) on the Loess Plateau, who similarly attributed significant erosion reduction to Grain for Green Program. The large-scale conversion of sloping cropland to forests and grasslands, together with supporting soil and water conservation projects, effectively reduced raindrop splash and runoff scouring, thereby enhancing soil conservation capacity (Tian et al., 2023; Yang M. et al., 2025). Concurrently, CF supply exhibited a 101% increase, in line with the findings of (Fang et al. 2021) and Yang M. et al. (2025) that identified the Shaanxi region as a core area of net primary productivity (NPP) growth in the Yellow River Basin. This increase in CF likely reflects synergistic increases in biomass and soil organic carbon following afforestation (Lu et al., 2018; Zhang Y. et al., 2025). For WY, despite the potential for increased evapotranspiration to reduce runoff because of vegetation restoration, a substantial 141% increase in supply was observed. This finding aligns with observations by (Wang and Xu 2022), suggesting that the positive contributions of increased regional precipitation and improved infiltration may have offset vegetation water consumption (Yang M. et al., 2025).
4.2 ESs supply-demand mismatches
The spatiotemporal pattern of the matching relationship between ESs supply and demand in the SYRB from 2000 to 2023 revealed the complex interaction between local vegetation restoration and socioeconomic development. The research results not only confirm the law of trade-off and synergy among ESs caused by land use change on the global scale (Wang et al., 2024) but also highlight the regional particularity shaped by the ecological vulnerability of the Yellow River Basin and the high-intensity human intervention.
Although the water yield supply increased, the large base and growth trend of water yield demand led to a consistently negative ESDR, indicating that the study area has been in a “water deficit” state for a long time. Spatially, the supply increment in the northern arid area is limited while the water yield demand pressure continues to rise. Meanwhile, the Guanzhong Plain has become a high deficit core region due to intensive agricultural and urban water yield demand. However, the central Loess Plateau region has enhanced its water conservation capacity through vegetation restoration, turning the local ESDR from negative to positive, demonstrating the positive effects of ecological restoration projects (He et al., 2025). These results confirm the urgency of balancing “natural restoration” and “demand regulation” in water resource management in semi-arid regions (Liu et al., 2025). The soil conservation supply-demand relationship has undergone a qualitative change from a “general deficit” to an “overall surplus.” The core driving force is the significant reduction in soil erosion, especially in the northern Shaanxi region, where the Green for Grain Project has significantly decreased the erosion modulus (Yang M. et al., 2025). Spatially, the Qinling Mountains has always maintained a low demand state due to its high coverage of native vegetation, while the northern Shaanxi region has achieved a transformation from “high demand–low supply” to “low demand–medium-high supply” through vegetation restoration. This transformation highlights the remarkable effectiveness of China's large-scale vegetation restoration policy in curbing soil erosion (Yang et al., 2022), which has also been supported in the research of the middle reaches of the Yellow River Basin (Zhang et al., 2023). However, it is also necessary to be vigilant that there are still local deficits in the northern counties of the study area, which to some extent highlights the vulnerability of the ecosystem at the edge of the desert to climate fluctuations (Liu S. et al., 2020). The trend of carbon fixation is the most worrying, and the supply-demand relationship has deteriorated systematically. The core of this contradiction lies in the explosive growth of carbon fixation demand, far exceeding the increase in carbon fixation supply. Spatially, the Guanzhong Plain, as an economic core region, has witnessed a rapid process of industrialization and urbanization since the 21st century, which has given rise to huge carbon emissions (Zhai et al., 2025). This has led to the existing carbon fixation capacity being unable to meet the carbon emission demand. Although the northern Shaanxi region has enhanced its carbon sink capacity due to vegetation restoration (He et al., 2025; Yang L. et al., 2025), the huge demand brought about by energy development has led the region to slide into a “severe deficit,” making it the region with the most prominent deterioration in the carbon fixation supply-demand matching relationship. This result highlights the trade-off dilemma between “ecological restoration and carbon fixation” and “economic development and carbon emissions,” that is, relying solely on ecological sequestration is difficult to offset the carbon emission pressure caused by economic growth.
4.3 Understanding of social-ecological drivers to promote sustainable development
The driving analysis based on the optimal parameter Geodetector indicates that there are significant differences in the driving mechanisms for the supply-demand matching of water yield, soil conservation, and carbon fixation. This finding not only reflects the specificity of ESs, but also provides a scientific basis for integrating social ecological governance.
Economic density, fractional vegetation cover, and population density are the main driving factors for the water yield supply-demand matching relationship. The dominant role of economic density and population density reflects the high water yield demand feature of the urban-agricultural complex system in the Guanzhong Plain—the demand for industrial, irrigation and domestic water has exceeded the local supply capacity. The high Q value for fractional vegetation cover reveals its dual impact: the dense forests in the south may enhance water conservation through canopy interception and soil infiltration (Liu et al., 2023). However, in the semi-arid region of northern Shaanxi, large-scale artificial afforestation can increase surface vegetation coverage, the excessive evaporation, and water consumption of deep-rooted trees continue to suck up deep soil water, leading to the development of soil dry layers (Wang et al., 2023). Therefore, future policies should prioritize the promotion of drought-tolerant native species and precision irrigation technologies to balance vegetation restoration and water security. Precipitation and slope dominate the soil conservation supply-demand matching relationship, highlighting the sensitivity of the SYRB to erosive rainfall (Yang et al., 2022; Jian et al., 2024). The high erosion risk (steep slopes combined with concentrated rainfall) in the northern region highlights the need for supporting engineering measures (such as silt arrester), while restoring vegetation to achieve coordinated prevention and control. The impact of population density indicates that agricultural intensification in plain areas, such as the Guanzhong region, leads to a reduction in surface cover and exacerbates erosion risks. It is worth noting that the influence intensity of fractional vegetation cover is lower than expected, suggesting that simple vegetation restoration needs to be combined with soil conservation measures to effectively control erosion. This finding supports the “comprehensive governance” approach advocated by China—that is, integrating the synergy effects of biological, engineering, and agricultural measures. Economic density, forest and grassland percentage, and population density are the key driving factors for the carbon fixation supply-demand matching relationship. The industrialization (high GDP) and urban expansion (population concentration) in the Guanzhong Plain directly pushed up the carbon demand, but the positive effect of the forest and grassland percentage was not sufficient to offset the increase in carbon emissions. The energy base in northern Shaanxi, such as coal mining, has further exacerbated the deficit, with the release of carbon from fossil fuel mining and combustion far exceeding the local carbon fixation capacity (Zhai et al., 2025). Therefore, it calls for the promotion of “Wind-Solar-Storage Integration” clean energy substitution in northern Shaanxi and the development of “low-carbon industrial clusters” in Guanzhong to effectively advance the process of “dual carbon” goals.
4.4 Limitations and prospects
This study provided a comprehensive assessment of ESs supply-demand relationship and their underlying driving mechanism in the SYRB, offering a valuable decision-making basis for achieving the coordination of regional ESs supply and demand. However, similar to other studies, our study also has limitations that need to be addressed in future studies. First, due to limited data availability, relevant analyses on three key ESs, which may not be sufficient to comprehensively reflect the ecological status of the SYRB, were performed. Future studies should take into account more types of ESs in order to more accurately evaluate the interaction mechanism between the ESs supply and demand in the SYRB and its changing driving factors. Second, considering the spillover effect of ESs supply and demand, future research should incorporate methods, especially the flow paths of ESs, to improve the understanding of the driving mechanism of supply-demand relationships. Third, this study analyzed the ESs supply and demand exclusively at the county scale. However, the ESs supply and demand exhibit heterogeneity at different scales (Cui et al., 2019). Subsequent research should conduct in-depth discussions on the ESs supply-demand relationship from multiple scales.
5 Conclusions
This study quantified the supply and demand dynamics of WY, SC, and CF in the SYRB from 2000 to 2023 and revealed the spatiotemporal differentiation characteristics of three ESs mismatch and the socio-ecological driving mechanism. The main conclusions include the following: (1) vegetation restoration facilitated a fundamental reversal of SC from a “general deficit” to an “overall surplus,” and the WY service remained in a persistent state of deficit. Most notably, CF experienced a sharp deterioration, transitioning from a state of supply surplus to one of significant deficit. (2) The spatial patterns of ES supply-demand mismatches showed significant heterogeneity. Water scarcity was concentrated in the northern part of the SYRB and the Guanzhong Plain region, whereas the most severe deterioration in carbon fixation balance was predominantly observed in the northern Shaanxi region. (3) The supply-demand matching relationship of each ES was controlled by a unique set of socio-ecological drivers. Economic density and population density were the primary controlling factors for the supply-demand matching relationship of WY and CF, highlighting the dominant role of anthropogenic pressure. Conversely, the soil conservation balance was mainly controlled by natural factors, specifically precipitation and slope. (4) The results confirm the remarkable effectiveness of large-scale vegetation restoration policies in effectively curbing soil erosion. However, they also reveal an emerging critical challenge: the growing pressure from socioeconomic development on water resources and carbon sinks, which threatens to undermine regional sustainability goals.
Statements
Data availability statement
The original contributions presented in the study are included in the article/Supplementary material, further inquiries can be directed to the corresponding author.
Author contributions
MY: Conceptualization, Writing – review & editing, Methodology, Data curation, Writing – original draft, Investigation, Formal analysis, Visualization, Funding acquisition. LC: Writing – review & editing, Writing – original draft, Methodology, Supervision, Conceptualization, Project administration. MW: Writing – review & editing, Validation, Writing – original draft, Conceptualization, Visualization, Supervision, Investigation. SM: Writing – review & editing, Methodology, Investigation, Formal analysis, Supervision, Conceptualization, Project administration, Funding acquisition.
Funding
The author(s) declared that financial support was received for this work and/or its publication. This work was jointly supported by the National Natural Science Foundation of China (42401384), the Humanities and Social Sciences Foundation of Ministry of Education of China (24YJCZH376), and the Key Scientific Research Projects of Colleges and Universities in Henan Province (25A170008).
Conflict of interest
The author(s) declared that this work was conducted in the absence of any commercial or financial relationships that could be construed as a potential conflict of interest.
Generative AI statement
The author(s) declared that generative AI was not used in the creation of this manuscript.
Any alternative text (alt text) provided alongside figures in this article has been generated by Frontiers with the support of artificial intelligence and reasonable efforts have been made to ensure accuracy, including review by the authors wherever possible. If you identify any issues, please contact us.
Publisher’s note
All claims expressed in this article are solely those of the authors and do not necessarily represent those of their affiliated organizations, or those of the publisher, the editors and the reviewers. Any product that may be evaluated in this article, or claim that may be made by its manufacturer, is not guaranteed or endorsed by the publisher.
Supplementary material
The Supplementary Material for this article can be found online at: https://www.frontiersin.org/articles/10.3389/ffgc.2025.1700105/full#supplementary-material
References
1
Bennett D. E. Gosnell H. (2015). Integrating multiple perspectives on payments for ecosystem services through a social-ecological systems framework. Ecol. Econ.116, 172–181. doi: 10.1016/j.ecolecon.2015.04.019
2
Blanco V. Holzhauer S. Brown C. Lagergren F. Vulturius G. Lindeskog M. et al . (2017). The effect of forest owner decision-making, climatic change and societal demands on land-use change and ecosystem service provision in Sweden. Ecosyst. Serv.23, 174–208. doi: 10.1016/j.ecoser.2016.12.003
3
Burkhard B. Kroll F. Nedkov S. Müller F. (2012). Mapping ecosystem service supply, demand and budgets. Ecol. Indic.21, 17–29. doi: 10.1016/j.ecolind.2011.06.019
4
Casado-Arzuaga I. Madariaga I. Onaindia M. (2013). Perception, demand and user contribution to ecosystem services in the Bilbao Metropolitan Greenbelt. J. Environ. Manage.129, 33–43. doi: 10.1016/j.jenvman.2013.05.059
5
Chen Y. Qiao X. Yang Y. Zheng J. Dai Y. Zhang J. (2024). Identifying the spatial relationships and drivers of ecosystem service supply-demand - demand matching: a case of Yiluo River Basin. Ecol. Indic.163:112122. doi: 10.1016/j.ecolind.2024.112122
6
Costanza R. d'Arge R. de Groot R. Farber S. Grasso M. Hannon B. et al . (1997). The value of the world's ecosystem services and natural capital. Nature387, 253–260. doi: 10.1038/387253a0
7
Cui F. Tang H. Zhang Q. Wang B. Dai L. (2019). Integrating ecosystem services supply and demand into optimized management at different scales: a case study in Hulunbuir, China. Ecosyst. Serv.39:100984. doi: 10.1016/j.ecoser.2019.100984
8
Cui J. Zhu M. Liang Y. Qin G. Li J. Liu Y. (2022). Land use/land cover change and their driving factors in the Yellow River Basin of Shandong Province based on Google earth engine from 2000 to 2020. ISPRS Int. J. Geo-Inf.11:163. doi: 10.3390/ijgi11030163
9
Dang K. B. Burkhard B. Dang V. B. Vu K. C. (2020). Potential, flow and demand of rice provisioning ecosystem services – case study in Sapa district, Vietnam. Ecol. Indic.118:106731. doi: 10.1016/j.ecolind.2020.106731
10
Das M. Das A. Saikh S. (2024). Estimating supply-demand mismatches for optimization of sustainable land use planning in a rapidly growing urban agglomeration (India). Land Use Policy139:107061. doi: 10.1016/j.landusepol.2024.107061
11
de Groot R. S. Alkemade R. Braat L. Hein L. Willemen L. (2010). Challenges in integrating the concept of ecosystem services and values in landscape planning, management and decision making. Ecol. Complex.7, 260–272. doi: 10.1016/j.ecocom.2009.10.006
12
de Knegt B. Lof M. E. Le Clec'h S. Alkemade R. (2024). Growing mismatches of supply and demand of ecosystem services in the Netherlands. J. Environ. Manage.373:123442. doi: 10.1016/j.jenvman.2024.123442
13
Ding H. Sun R. (2023). Supply-demand analysis of ecosystem services based on socioeconomic and climate scenarios in North China. Ecol. Indic.146:109906. doi: 10.1016/j.ecolind.2023.109906
14
Dong H. Liu Y. Cui J. Zhu M. Ji W. (2023). Spatial and temporal variations of vegetation cover and its influencing factors in Shandong Province based on GEE. Environ. Monit. Assess.195:1023. doi: 10.1007/s10661-023-11650-7
15
Elliot T. Goldstein B. Gomez-Baggethun E. Proenca V. Rugani B. (2022). Ecosystem service deficits of European cities. Sci. Total Eviron.837:155875. doi: 10.1016/j.scitotenv.2022.155875
16
Fang L. Xu D. Wang L. Niu Z. Zhang M. (2021). The study of ecosystem services and the comparison of trade-off and synergy in Yangtze River Basin and Yellow River Basin. Geogr. Res.40, 821–838. In Chinese. doi: 10.11821/dlyj020200044
17
He Z. Geng G. Zheng R. (2025). Variation characteristics and its driving forces of fractional vegetation cover in the shaanxi section of the Yellow River Basin under the background of the grain for green program. Environ. Sci.46:7819–30. In Chinese. doi: 10.13227/j.hjkx.202409154
18
Hou W. Hu T. Yang L. Liu X. Zheng X. Pan H. et al . (2023). Matching ecosystem services supply and demand in China's urban agglomerations for multiple-scale management. J. Clean. Prod.420:138351. doi: 10.1016/j.jclepro.2023.138351
19
Jacobs S. Burkhard B. Daele T. V. Staes J. Schneiders A. (2015). ‘The Matrix reloaded': a review of expert knowledge use for mapping ecosystem services. Ecol. Model.295, 21–30. doi: 10.1016/j.ecolmodel.2014.08.024
20
Jäger H. Peratoner G. Tappeiner U. Tasser E. (2020). Grassland biomass balance in the European Alps: current and future ecosystem service perspectives. Ecosyst. Serv.45:101163. doi: 10.1016/j.ecoser.2020.101163
21
Jian Z. Sun Y. Wang F. Zhou C. Pan F. Meng W. et al . (2024). Soil conservation ecosystem service supply-demand and multi scenario simulation in the Loess Plateau, China. Glob. Ecol. Conserv.49:e02796. doi: 10.1016/j.gecco.2023.e02796
22
Larondelle N. Lauf S. (2016). Balancing demand and supply of multiple urban ecosystem services on different spatial scales. Ecosyst. Serv.22, 18–31. doi: 10.1016/j.ecoser.2016.09.008
23
Li F. Xin Q. Fu Z. Sun Y. Xiong Y. (2024). A refined supply-demand framework to quantify variability in ecosystem services related to surface water in support of sustainable development goals. Earths Future12:e2023EF004058. doi: 10.1029/2023EF004058
24
Li J. Chen X. De Maeyer P. van de Voorde T. Li Y. (2025). Investigating the supply-demand gap of farmland ecosystem services to advance sustainable development goals (SDGs) in Central Asia. Agr. Water Manage.312:109419. doi: 10.1016/j.agwat.2025.109419
25
Li J. Pan B. Zheng W. Zhang Y. (2024). Spatio-temporal evolution of land use pattern in the Yellow River Basin (Shaanxi Section) from 1990 to 2020. J. Guizhou Norm. Univ (Nat. Sci.). 42, 46–57. In Chinese. doi: 10.16614/j.gznuj.zrb.2024.03.006
26
Lin Y. Zhou J. Wang J. Xu H. Li Y. Chen F. et al . (2025). Spatiotemporal evolution and driving forces of landscape ecological risk in the lower reaches of the Yellow River from 2000 to 2020. Sci. Rep.15:21375. doi: 10.1038/s41598-025-05724-4
27
Liu C. Yan X. Han Z. Liu Y. Li X. Li X. et al . (2024). Guiding and constraining reclamation for coastal zone through identification of response thresholds for ecosystem services supply-demand relationships. Land Degrad. Dev.35, 1804–1817. doi: 10.1002/ldr.5022
28
Liu H. Remme R. P. Hamel P. Nong H. Ren H. (2020). Supply and demand assessment of urban recreation service and its implication for greenspace planning-a case study on Guangzhou. Landsc. Urban Plann.203:103898. doi: 10.1016/j.landurbplan.2020.103898
29
Liu J. Wang J. Tan Y. (2023). Spatiotemporal pattern and influencing mechanism of the flood-regulating ecosystem service capacity and demand in China? Yellow River basin, 2000-2020. J. Hydrol-Reg. Stud.45:101312. doi: 10.1016/j.ejrh.2022.101312
30
Liu L. Wang J. Li J. He S. Lan Y. Liu F. (2025). Evaluation of ecosystem service capacity using the integrated ecosystem services index at optimal scale in central Yunnan, China. Ecol. Evol.15:e71222. doi: 10.1002/ece3.71222
31
Liu S. Bai C. Bian Z. An T. Xia C. Hou R. et al . (2020). Land use change and its eco-environmental effects on vulnerable desert margin areas: a case study from Yanchi County in Ningxia. Prat Sci.31, 2175–2184. In Chinese. doi: 10.11829/j.issn.1001-0629.2019-0432
32
Lu F. Hu H. Sun W. Zhu J. Liu G. Zhou W. et al . (2018). Effects of national ecological restoration projects on carbon sequestration in China from 2001 to 2010. P. Natl. Acad. Sci. USA.115, 4039–4044. doi: 10.1073/pnas.1700294115
33
Lu Z. Li W. Yue R. (2024). Investigation of the long-term supply-demand relationships of ecosystem services at multiple scales under SSP-RCP scenarios to promote ecological sustainability in China's largest city cluster. Sustain. Cities. Soc.104:105295. doi: 10.1016/j.scs.2024.105295
34
Luo Y. Lü Y. Fu B. Harris P. Wu L. Comber A. (2019). When multi-functional landscape meets Critical Zone science: advancing multi-disciplinary research for sustainable human well-being. Nat. Sci. Rev.6, 349–358. doi: 10.1093/nsr/nwy003
35
Ma (2005). Millennium Ecosystem Assessment: Ecosystems and Human Well-Being. Washington, DC: Island Press.
36
Maragno D. Gaglio M. Robbi M. Appiotti F. Fano E. A. Gissi E. (2018). Fine-scale analysis of urban flooding reduction from green infrastructure: an ecosystem services approach for the management of water flows. Ecol. Model.386, 1–10. doi: 10.1016/j.ecolmodel.2018.08.002
37
Masalvad S. K. Patil C. Vardhan A. R. Yadav A. Lavanya B. Sakare P. K. (2025). Predicting land use changes and ecosystem service impacts with CA-Markov and machine learning techniques. Environ. Dev. Sustain. doi: 10.1007/s10668-025-06017-6
38
Meng R. Zhao X. (2024). Priority protected area and drivers of ecosystem services from supply-demand perspective: taking the loess gully area of the Yellow River basin as an example. Environ. Pollut. Control46, 1068–1075+1084. In Chinese. doi: 10.15985/j.cnki.1001-3865.202311059
39
Ouyang Z. Zheng H. Xiao Y. Polasky S. Liu J. Xu W. et al . (2016). Improvements in ecosystem services from investments in natural capital. Science352, 1455–1459. doi: 10.1126/science.aaf2295
40
Palafox-Juárez E. B. Callejas-Jiménez M. E. Herrera-Silveira J. A. Teutli-Hernández C. Camacho-Valdez V. López-Martínez J. O. (2025). Effects of land use change on ecosystem services in freshwater wetlands in Bacalar, Mexico. PEERJ13:e18954. doi: 10.7717/peerj.18954
41
Poturalska A. Kotavaara O. Ala-Hulkko T. (2025). A spatial accessibility framework for mapping the mismatch between wood supply and demand across Europe. Ecol. Indic.170:113116. doi: 10.1016/j.ecolind.2025.113116
42
Quintas-Soriano C. Castro A. J. García-Llorente M. Cabello J. Castro H. (2014). From supply to social demand: a landscape-scale analysis of the water regulation service. Landscape Ecol.29, 1069–1082. doi: 10.1007/s10980-014-0032-0
43
Rau A. L. Burkhardt V. Dorninger C. Hjort C. Ibe K. Kessler L. et al . (2020). Temporal patterns in ecosystem services research: a review and three recommendations. Ambio49, 1377–1393. doi: 10.1007/s13280-019-01292-w
44
Tian P. Tian X. Geng R. Zhao G. Yang L. Mu X. et al . (2023). Response of soil erosion to vegetation restoration and terracing on the Loess Plateau. Catena227:107103. doi: 10.1016/j.catena.2023.107103
45
Wang C. Chang Y. Guo Y. Liu P. (2025). Forecasting and evaluation of ecosystem services supply-demand under SSP-RCP scenarios in the henan segment of the Yellow River Basin, China. Remote Sens.17:1067. doi: 10.3390/rs17061067
46
Wang J. Wu W. Yang M. Gao Y. Shao J. Yang W. et al . (2024). Exploring the complex trade-offs and synergies of global ecosystem services. Environ. Sci. Ecotechnol. 21:100391. doi: 10.1016/j.ese.2024.100391
47
Wang L. Yan H. Wang X. Wang Z. Yu S. Wang T. et al . (2020). The potential for soil erosion control associated with socio-economic development in the hilly red soil region, southern China. Catena194:104678. doi: 10.1016/j.catena.2020.104678
48
Wang P. Xu M. (2022). Evaluating the inter-annual surplus/deficit dynamic of water retention service in the Yellow River Basin, China. Ecol. Indic.145:109695. doi: 10.1016/j.ecolind.2022.109695
49
Wang S. Yang M. Gao X. Hu Q. Song J. Ma N. et al . (2023). Divergent responses of deep SOC sequestration to large-scale revegetation on China's Loess Plateau. Agr. Ecosyst. Environ.349:108433. doi: 10.1016/j.agee.2023.108433
50
Wu X. Wang S. Fu B. Feng X. Chen Y. (2019). Socio-ecological changes on the Loess Plateau of China after grain to green program. Sci. Total Eviron.678, 565–573. doi: 10.1016/j.scitotenv.2019.05.022
51
Yang B. Wang Q. Zhou P. Xu X. Dang J. (2022). Change analysis and future prediction of soil erosion in Yulin in the context of Grain for Green Project. Sci. Soil. Water Conserv.20, 56−64. In Chinese. doi: 10.16843/j.sswc.2022.01.008
52
Yang L. Liu Y. Liu Y. Liu R. (2025). Spatial-temporal dynamics and drivers of ecosystem service interactions along the Yellow River area in Shaanxi Province. J. Clean. Prod.496:145095. doi: 10.1016/j.jclepro.2025.145095
53
Yang L. Wang D. Wang Y. Liang Z. Wu S. Li S. (2020). Quantitative assessment of the supply-demand relationship of soil conservation service in the Sushui River Basin. Resour. Sci.42, 2451–2462. In Chinese. doi: 10.18402/resci.2020.12.15
54
Yang M. Gao X. Zhao X. Wu P. (2021). Scale effect and spatially explicit drivers of interactions between ecosystem services—a case study from the Loess Plateau. Sci. Total Environ.785:147389. doi: 10.1016/j.scitotenv.2021.147389
55
Yang M. Wang M. Cao L. Zhang H. Niu H. Liu J. (2025). Evolution and attribution analysis of the relationship among soil erosion negative service, carbon sequestration, and water yield in the Yellow River Basin after the grain for green program. Remote Sens.17:3028. doi: 10.3390/rs17173028
56
Yao J. Liu M. Chen N. Wang X. He X. Hu Y. et al . (2021). Quantitative assessment of demand and supply of urban ecosystem services in different seasons: a case study on air purification in a temperate city. Landscape Ecol.36, 1971–1986. doi: 10.1007/s10980-020-01112-7
57
Zhai T. Ma Y. Huang L. Lu Y. Li L. Chen Y. et al . (2025). Research on the spatiotemporal evolution characteristics and driving mechanisms of supply-demand risks of ecosystem services in the yellow river basin integrating the hierarchy of needs theory. Ecol. Indic.171:113229. doi: 10.1016/j.ecolind.2025.113229
58
Zhang J. Wang M. Liu K. Chen S. Zhao Z. (2025). Social-ecological system sustainability in China from the perspective of supply-demand balance for ecosystem services. J. Clean. Prod.497:145039. doi: 10.1016/j.jclepro.2025.145039
59
Zhang Y. Shi F. Zhang Y. Li M. Cui G. Liu Z. (2023). Temporal and spatial changes and driving factors of soil erosion in the middle reaches of the Yellow River. Res. Soil. Water Conserv.30, 1–12. In Chinese. doi: 10.13869/j.cnki.rswc.2023.05.003
60
Zhang Y. Wang Z. Lu X. Xiao P. Zhao G. (2025). Evolution of ecosystem carbon sink and its driving factors in the Loess Plateau. Res. Soil. Water Conserv.32, 266–274+284. In Chinese. doi: 10.13869/j.cnki.rswc.2025.01.030
61
Zhao M. Peng J. Liu Y. Li T. Wang Y. (2018). Mapping watershed-level ecosystem service bundles in the Pearl River Delta, China. Ecol. Econ.152, 106–117. doi: 10.1016/j.ecolecon.2018.04.023
62
Zhou X. Zhang X. Peng H. Ren W. Zou Q. (2025). Bridging the ecosystem service supply-demand imbalance: spatial flow patterns and driving forces in the Yangtze River midstream urban agglomeration, China. Ecol. Indic. 175:113531. doi: 10.1016/j.ecolind.2025.113531
Summary
Keywords
ecosystem service demand, ecosystem service supply, matching relationship, social-ecological drivers, Yellow River Basin
Citation
Yang M, Cao L, Wang M and Ma S (2026) Spatiotemporal relationships and underlying drivers of ecosystem service supply-demand matching following vegetation restoration in the Shaanxi section of the Yellow River basin. Front. For. Glob. Change 8:1700105. doi: 10.3389/ffgc.2025.1700105
Received
09 September 2025
Revised
26 November 2025
Accepted
08 December 2025
Published
20 January 2026
Volume
8 - 2025
Edited by
Zisheng Xing, Agriculture and Agri-Food Canada (AAFC), Canada
Reviewed by
Pankaj Kumar, University of Delhi, India
Yaohui Liu, Aerospace Information Technology University, China
Fanglei Zhong, Minzu University of China, China
Updates
Copyright
© 2026 Yang, Cao, Wang and Ma.
This is an open-access article distributed under the terms of the Creative Commons Attribution License (CC BY). The use, distribution or reproduction in other forums is permitted, provided the original author(s) and the copyright owner(s) are credited and that the original publication in this journal is cited, in accordance with accepted academic practice. No use, distribution or reproduction is permitted which does not comply with these terms.
*Correspondence: Sha Ma, masha1970@126.com
Disclaimer
All claims expressed in this article are solely those of the authors and do not necessarily represent those of their affiliated organizations, or those of the publisher, the editors and the reviewers. Any product that may be evaluated in this article or claim that may be made by its manufacturer is not guaranteed or endorsed by the publisher.