Abstract
Introduction:
Forest carbon accumulation is crucial to mitigate ongoing climate change, as large individual trees store a substantial portion of the total carbon in biomass. In this study, large trees and carbon storage were estimated in five forests in the Peruvian Amazon.
Methods:
For the study, 100 plots were selected (twenty 500 m2 plots per forest site), distributed between 382 to 2086 meters above sea level. Various relationships were explored between the diameter at breast height (DBH) of the most abundant tree species and above- and below-ground carbon. The average carbon content in the tree was calculated based on 50% of the total tree volume at five sites of the Peruvian Amazon.
Results:
The site with most tree species (Alto Mayo Forest), had 59 tree species. The species Brosimum alicastrum, Ficus insipida, Manilkara bidentata, Inga sp., and Pourouma cecropiifolia showed an average aboveground carbon of 2.31, 3.09, 2.52, 2.78, 2.93 t ha-1, respectively, and values of 0.35, 0.48, 0.38, 0.42 and 0.43 t ha-1 of belowground carbon in trees with ≥ 46 cm DBH. Nectandra sp. showed an above and belowground carbon of 2.50 and 0.38 t ha-1 in trees with ≥ 46 cm DBH, while Cedrelinga catenaeformis showed averages of 5.21 and 0.74 t ha-1 of above and belowground carbon in trees with ≥ 61 cm DBH.
Discussion:
It was concluded that given the urgency of keeping carbon reserves out of the atmosphere, it is necessary to conserve trees larger than 41 cm, this also allows conserving forest biodiversity and microfauna by buffering the microclimate in the face of future climate changes.
1 Introduction
Climate change and global warming represent the two of the most greatest global challenges confronting our planet today. Recently, the rate of global temperature has risen substantially. In July 2023, the global average temperature reached historic highs (Song et al., 2024). Anthropogenic activities have increased the Earth’s temperature by 1 °C relative to pre-industrial levels, and this is projected to rise to 1.5 °C by 2052, if current emissions rates continue (Huang and Zhai, 2021). Therefore, countries have set targets to limit global temperature rise to below 2 °C within the framework of the Paris Agreement. In this context, forests offer a viable solution as they cover about 31% of the Earth’s surface (FAO, 2022) and sequester 15–20% of annual carbon (C) emissions from human activity (Le Quéré et al., 2018; Case et al., 2021). Globally, forest C removal was equivalent to approximately 30% of fossil fuel emissions annually between 2009 and 2018 (Friedlingstein et al., 2019). Crucial to this C removal and biodiversity structuring of forests, are large, old trees, which have declined worldwide (Hauck et al., 2023).
Forests are the world’s largest carbon sink and play a pivotal role in climate change mitigation through carbon sequestration. Assessing forest carbon stocks is therefore essential for policymaking and management decisions (Joshi et al., 2021). Recent studies demonstrate that large trees accumulate and store a disproportionate share of aboveground forest carbon (Mildrexler et al., 2023). Therefore, protecting large trees to support climate stabilization is critically important for managing forest ecosystems as socio-ecological systems. This protection creates an opportunity for the public, decision-makers, and forest managers to recognize the integral role of trees on climate solution (Mildrexler et al., 2020). The protection of ancient forests is also crucial because they play a strategic role in hosting unique biodiversity (DellaSala et al., 2022) and regulating water and nutrient cycles.
In Peru, forests cover about more than half of the territory (57.3%), with the Amazon being the region with the largest forest area (SERFOR, 2021). Peru ranks ninth globally in forest cover, fourth in tropical forest cover, and second in Amazonian forest cover (MINAM, 2015; FAO, 2020). Of the country’s total 72 million hectares of forest, more than 68 million hectares are located in the Amazon region, representing approximately 94.6% of forest cover. In contrast, 3.7 million hectares are located on the coast (5.1%) and 0.22 million hectares in the Sierra (0.31%) (MINAM, 2015). However, the effects of climate change and greenhouse gas emissions in Peru are largely driven by deforestation, as forests are converted into pastures and agricultural lands, resulting in the loss of large carbon sink areas (MINAM, 2016). Considering only aboveground carbon, the Amazonian forests of Peru are estimated to store 6.928 million t CO2e (Csillik et al., 2019). According to the National Forest and Wildlife Inventory (“Inventario Nacional Forestal y de Fauna Silvestre”), most of C is stored in lowland rainforests, with an aboveground carbon density of 138.8 t C ha−1, followed by forests in the hydromorphic zone having a density of 85.63 tC/ha (SERFOR, 2021).
The Peruvian Amazon rainforest has undergone significant land-use changes, affecting biological diversity such as arbuscular mycorrhizae (Corazon-Guivin et al., 2022; Vallejos-Torres et al., 2022). These changes are largely driven by deforestation of the forest ecosystem for the establishment of silvopastures and agricultural crops, including coffee and cocoa, which has contributed to increased atmospheric CO2 (Vallejos-Torres et al., 2024). Therefore, forests are undergoing constant change and are subject to multiple stressors and pressures (Sabogal-Dunin-Borkowski, 2023). Further, the fragmentation of these forests could lead to the extinction of numerous flora, fauna, and funga species with restricted or endemic distributions in the area over the midium and long term (García-Villacorta, 2015). In the Amazon, it has been estimated that the point of no return–where the ecosystem will no longer be able to renew itself due to insufficient resilience–will be reached when deforestation and degradation exceed 20–25% (Almond et al., 2020). However, the current level of deforestation and degradation has already reached 26% (Almond et al., 2020). If this trend continues, the ecosystem will be seriously damaged and, despite its resilience, will not be able to overcome the destruction. As large trees in forest play a crucial role in carbon capture and resilience, this study is aimed to evaluate carbon storage in large trees across five Peruvian Amazon forests.
2 Materials and methods
2.1 Study sites and sampling
This study was performed in five forests in the San Martín Region, Peru, namely: (i) “Ojos de Agua Forest (OAF)” of 2357.62 ha, located in Pucacaca district of Picota province, extending from coordinates 6°50′50.99”S and 76°27′52.24”W at 382 m.a.s.l., (ii) “Huallaga Forest (HF)” of 2102.26 ha, located in Saposoa district of Huallaga province, extending from coordinates 6°47′32.01”S and 70°44′27.89”O at 699 m.a.s.l., (iii) “Bajo Huallaga Forest (BHF)” with 191,000 ha, located in Tocache district of Tocache province, extending from coordinates 8°23′11.82”S and 76°44′29.76”W at 1,245 m.a.s.l., (iv) “Alto Mayo Forest (AMF)” of 182,000 ha, located in Pardo Miguel Naranjos town of Rioja province, extending from coordinates 5°39′16.64”S and 77°41′32.81”W at 1625 m.a.s.l., and (v) “Alto Roque Forest (ARF)” of 2722.39 ha, located in the Alonso de Alvarado Roque district of Lamas province, extending from coordinates 6°22′9.67”S and 76°50′36.73”W at 2086 m.a.s.l. (Figure 1). These forests are threatened by extensive agricultural practices, such as corn plantations, and by climate change (Vallejos-Torres et al., 2021). The San Martín region covers about 51253.31 km2 area and is characterized by a subtropical and tropical climate. Throughout the year, temperatures generally range from 24 °C to 31 °C, with an average annual rainfall of approximately 1,000 mm.
Figure 1
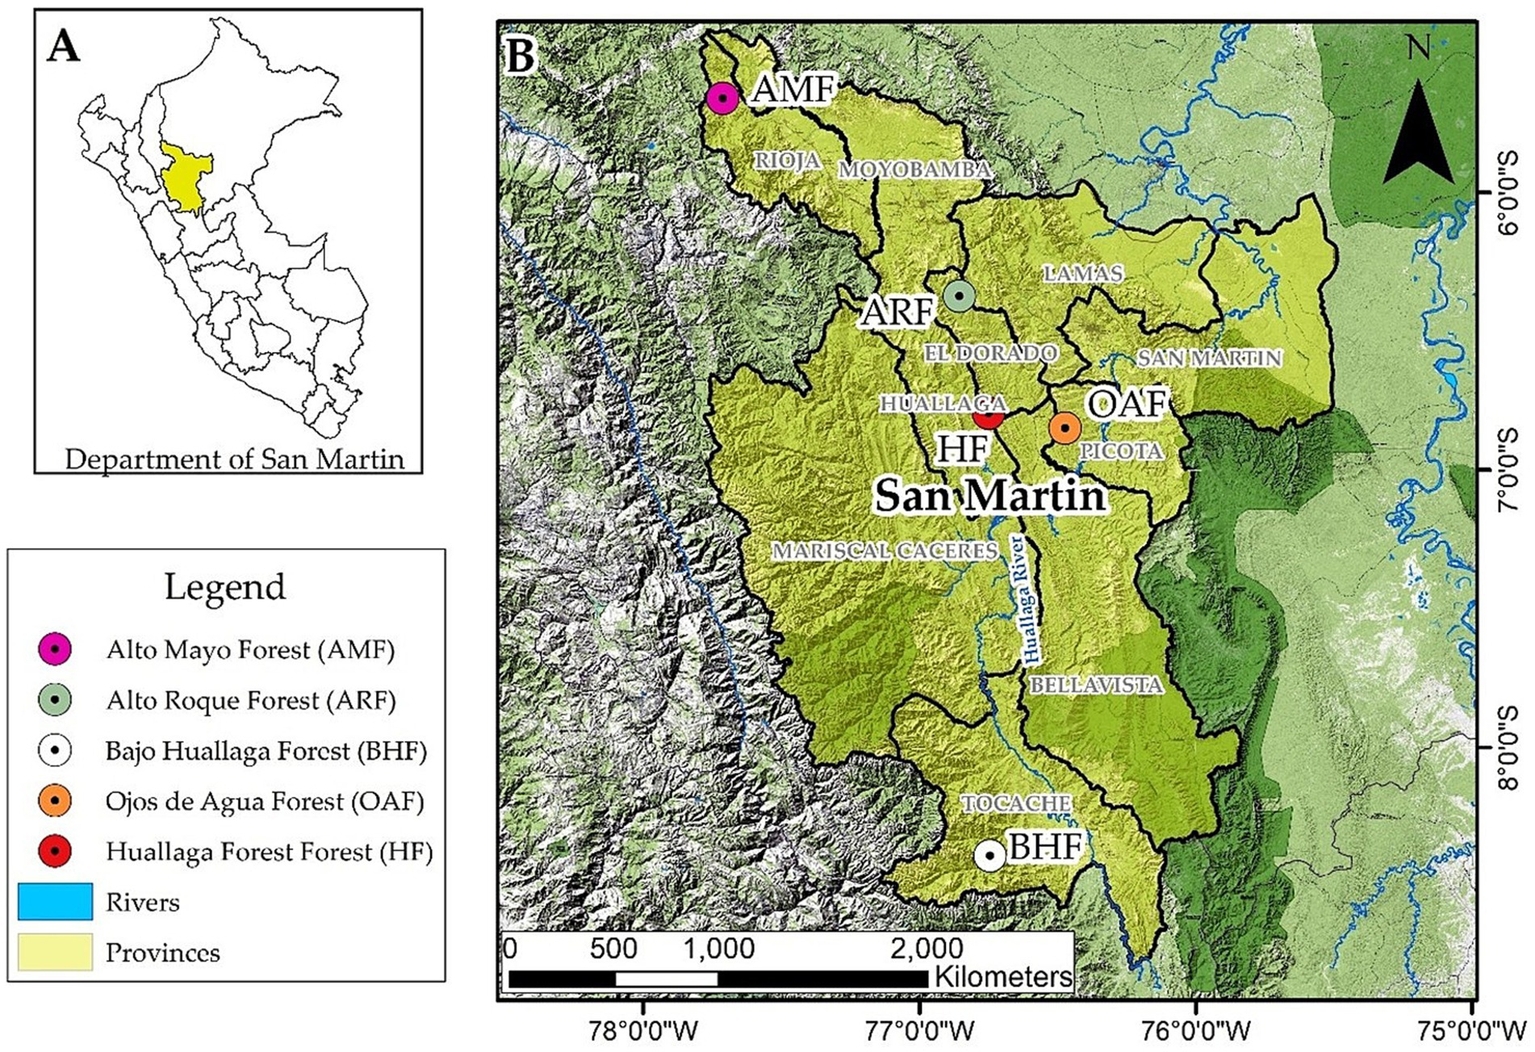
Map of the study sites. Location of the study area in the Peruvian Amazon. (A) country and (B) region.
To study carbon storage in large trees in these Amazonian forests, total of 100 plots (20 plots per forest site (Figure 1), each plot of 500 m2) were selected. The plots were located between 382 and 2086 m.a.s.l. This study included the measurement of 535 trees.
2.2 Estimation of above- and below-ground biomass and carbon in forest trees
Allometric models were employed to estimate aboveground biomass using diameter at breast height (DBH), total height, and wood basal density. Wood basal density values for each identified species were obtained from the “Global Wood Density Database” (Zanne et al., 2009). In cases where species data was not available in the database, genus or family density values were considered. Aboveground and root biomass were estimated using the regression equations developed by Chave et al. (2014), which incorporates variables such as DBH, tree height (H), and wood density (ρ). Similarly, Cairns et al. (1997) derived based on the natural logarithm of aboveground biomass. Biomass values for individual trees within the same plot were aggregated to estimate the total biomass, which was then extrapolated to estimate biomass and carbon stock per hectare. The carbon fraction of 50% is a standard value widely used in biomass and carbon studies (Toochi, 2018); however, several studies have documented variability in carbon content across tropical woody tissues. The IPCC recommends default values between 0.47 and 0.50 for tropical woods (IPCC, 2014). In addition, Martin and Thomas (2011) demonstrated that the carbon content in the topical wood species can vary considerably among coexisting species, with an average of 47.4% ± 2.51%. Since this variability has been documented for Amazonian species and may influence carbon estimates, a sensitivity analysis was conducted. Taking these findings as reference standards, above- and below-ground carbon stocks were estimated by multiplying the biomass values with 0.5, under the assumption that the total biomass contains 50% carbon content (Aye et al., 2022; Eshetu and Hailu, 2020).
2.3 Statistical analyses
Tree biodiversity was assessed using metrics such as species richness and the Shannon–Wiener, Simpson, and Pielou indices, which were based on data on the abundance of plant species in each forest independently.
The structural characterization of the forests was carried out through measurements of DBH, total tree height, crown area, and above- and below-ground carbon content. To evaluate whether environmental or functional factors could influence the observed structural and carbon patterns, a covariance analysis (ANCOVA) with Type III sum of squares was performed. In this model, forest type was included as a fixed categorical factor, while altitude (m a.s.l.) and wood basic density (g cm−3) were considered as continuous covariates. Treating altitude as a covariate preserved its continuous variation along the altitudinal gradient (382–2086 m), thereby avoiding arbitrary categorization. Wood density was also included, given its well-documented functional role in biomass accumulation.
The general model used was given by the following formula:
where represents the dependent variable (DBH, total height, crown area, aboveground carbon, or belowground carbon); is the overall mean; corresponds to the effect of forest type; is the altitude covariate; is the wood basic density covariate;and are the regression coefficients of each covariate; and is the random error term, assumed to follow a normal distribution and to be independent among observations.
The assumptions of the ANCOVA were assessed using the Shapiro–Wilk test for normality, Levene’s test for homogeneity of variances, and residual-versus-fitted plots.
As the carbon content in woody tissues naturally varies among tropical species, a sensitivity analysis was also performed to validate whether the carbon fraction used affected the ANCOVA results. Above- and below-ground carbon estimates were recalculated under three scenarios (48, 50, and 52% carbon content), and a Type III ANCOVA was fitted for each scenario using the same predictors (forest type, altitude, and wood density). The p-values for each predictor were compared across scenarios to assess whether the assumed carbon fraction influenced the statistical significance of the effects.
In addition, partial effect sizes (η2) were calculated for each dependent variable to quantify the proportion of variance explained by each predictor (forest type, altitude, and wood density). This approach determined whether the observed variability in structural traits and carbon storage was mainly associated with forest type or with environmental gradients and functional wood properties, thus distinguishing structural from environmental effects, a one-way analysis of variance (ANOVA) was used to evaluate differences among forests, followed by Tukey’s multiple comparison test (p < 0.05) to identify statistically distinct groups.
Additionally, the relationship between tree diameter and carbon content (above and belowground) was calculated using the Spearman correlation coefficient (p < 0.05). Dispersion graphs were also employed to assess the relationships between the DBH of the most abundant tree species, the proportion of each tree species, aboveground carbon, and belowground carbon. The most abundant species were grouped according to different minimum DBHs considered for felling: greater than 41 cm, 46 cm, and 61 cm. These values were based on the “Resolución Jefatural No. 458-2002-INRENA” for forest species in the Peruvian Amazon. All statistical analyses were done in R Studio version 4.0.3 (R Core Team, 2024).
3 Results
3.1 Biodiversity metrics an analysis of tree dasometric variables and above- and below-ground carbon in forests
A total of 59 tree species were recognized across all sites, ranging from 5 to 18 forest species per forest. The Shannon–Wiener index indicated a high level of diversity in the AMF, followed by the OAF, and HF with 2.485, 2.269, and 2.210, respectively (Table 1). Meanwhile, the Simpson and Pielou indices where generally high across the five forests, indicating high evenness and low dominance across all forests, thus no single species is found to be extremely dominant in each of these sites. Specifically, the Simpson index reaffirms the high diversity in AMF, followed by OAF and HF with average values of 0.896, 0.867, and 0.862, respectively (Table 1).
Table 1
| Site | Average tree richness | Shannon–Wiener index | Simpson index | Pielou index |
|---|---|---|---|---|
| Ojos de Agua Forest (OAF) | 16 | 2.269 | 0.867 | 0.818 |
| Huallaga Forest (HF) | 14 | 2.210 | 0.862 | 0.838 |
| Bajo Huallaga Forest (BHF) | 5 | 1.503 | 0.758 | 0.934 |
| Alto Mayo Forest (AMF) | 18 | 2.485 | 0.896 | 0.859 |
| Alto Roque Forest (ARF) | 6 | 1.664 | 0.802 | 0.929 |
Biodiversity metrics of forest species in different sites of the San Martín region, Peru.
The covariance analysis (ANCOVA, Type III sum of squares) depicted that forest type had a highly significant effect on all evaluated dasometric variables (DBH, total height, and crown area), as well as on above- and below-ground carbon (p < 0.001). In contrast, altitude and wood basic density did not exhibit significant effects on any of the variables (p > 0.05), and their effect sizes were very low (η2 < 0.02), indicating that their direct contribution to the model was limited within the altitudinal and functional range sampled (Table 2). The sensitivity analysis demonstrated that, across all scenarios, forest type remained highly significant (p ≈ 10−11), whereas altitude and wood density consistently remained non-significant (p > 0.65 and p > 0.41, respectively). This confirms that the model inferences are robust and independent of the assumed carbon fraction.
Table 2
| Variable | Forest | Altitude | Wood density |
|---|---|---|---|
| DBH | 0.83 | 0.043 | 0.045 |
| Total height | 0.77 | 0.018 | 0.079 |
| Crown area | 0.42 | ~0.00002 | ~0.00002 |
| Aboveground carbon | 0.73 | 0.002 | 0.02 |
| Belowground carbon | 0.72 | 0.004 | 0.014 |
Partial effect sizes (η2).
Nevertheless, given the dataset size and the uneven sampling distribution among forests, these results should be interpreted with caution. A lack of statistical significance does not necessarily indicate the absence of ecological effect. Overall, these findings suggest that the variability observed in structural characteristics and carbon storage is driven primarily by differences among forest types, while altitude may exert indirect influences through shifts in forest structure and floristic composition along the altitudinal gradient.
The analysis of covariance revealed that forest type had a highly significant effect on all dasometric variables (DBH, total height, and crown area), as well as on aboveground and belowground carbon (p < 0.001). In contrast, wood density and altitude showed no significant effect within the sampled range for any of the evaluated variables (p > 0.05). Nevertheless, altitude may exert indirect influences through shifts in forest structure and floristic composition along with altitudinal gradient (Supplementary Table 1).
The HF presented the highest values of dasometric variables, showing an average DBH of 74.24 cm, an average tree height of 20.65 m, and an average tree canopy area of 48.84 m2 with significant differences between forests. Likewise, the highest values of above and belowground carbon were found in HF with averages of 331.06 t ha-1 and 47.41 t ha-1, respectively. Meanwhile, the lowest above and belowground carbon contents were found in the OAF with values of 86.83 t ha-1 and 15.18 t ha-1, respectively. Significant differences were observed among the five forest sites in all measured dasometric parameters (Table 3).
Table 3
| Forest site | Tree diameter (cm) | Total height (m) | Tree crown area (m2) | Carbon aboveground (t ha−1) | Carbon belowground (t ha−1) |
|---|---|---|---|---|---|
| Ojos de Agua Forest (OAF) | 32.68 ± 1.79c | 13.23 ± 0.35 cd | 35.44 ± 3.13bc | 116.19 ± 0.80d | 18.92 ± 0.13c |
| Huallaga Forest (HF) | 74.24 ± 2.67a | 20.65 ± 0.54a | 48.84 ± 2.29a | 331.06 ± 4.41a | 47.41 ± 0.63a |
| Bajo Huallaga Forest (BHF) | 48.72 ± 2.73b | 13.76 ± 0.39c | 20.61 ± 1.86d | 160.47 ± 1.73b | 24.61 ± 0.26b |
| Alto Mayo Forest (AMF) | 36.11 ± 1.12c | 12.11 ± 0.27d | 44.29 ± 2.08ab | 86.83 ± 0.67d | 15.18 ± 0.12c |
| Alto Roque Forest (ARF) | 44.24 ± 2.09b | 15.43 ± 0.58b | 31.99 ± 4.25 cd | 124.99 ± 1.37bc | 19.80 ± 0.22b |
Analysis of tree dasometric variables and above and belowground carbon in the five forest sites across the San Martín region, Peruvian Amazon.
Different letters in bars indicate significant differences between treatments according to the Tukey test (p < 0.05).
3.2 Above- and below-ground carbon content in forest species
In general, a very high positive correlation was observed between DBH and carbon content, both above (ρ = 0.932, p-value <0.001) (Figure 2) and belowground (ρ = 0.946, p-value <0.001) (Figure 3). The tree species Brosimum alicastrum presents an average above and belowground carbon storage of 0.32 and 0.06 t ha-1 per tree, respectively, in trees with diameters less than 41 cm, meanwhile, it shows respective averages of 2.31 and 0.35 t ha-1 in trees greater than or equal to 41 cm DBH. Ficus insipida presents an above and belowground carbon storage of 0.33 and 0.06 t ha-1 per tree respectively, in trees with diameters less than 41 cm, meanwhile, it shows averages of 3.09 and 0.48 t ha-1 in trees greater than or equal to 41 cm DBH. Manilkara bidentata presents an above and belowground carbon storage of 0.90 and 0.48 t ha-1 per tree, respectively, in trees with diameters less than 41 cm, meanwhile, it shows averages of 2.52 and 0.38 t ha-1 in trees greater than or equal to 41 cm DBH. Inga sp. presents an above and belowground carbon storage of 0.27 and 0.05 t ha-1 per tree, respectively, in trees with diameters less than 41 cm, meanwhile, it shows respective averages of 2.78 and 0.42 t ha-1 in trees greater than or equal to 41 cm DBH. P. presents an above and belowground carbon storage of 0.38 and 0.07 t ha-1 per tree, respectively, in trees with diameters less than 41 cm, while it shows respective averages of 2.93 and 0.43 t ha-1 in trees greater than or equal to 41 cm DBH (Figures 2, 3).
Figure 2
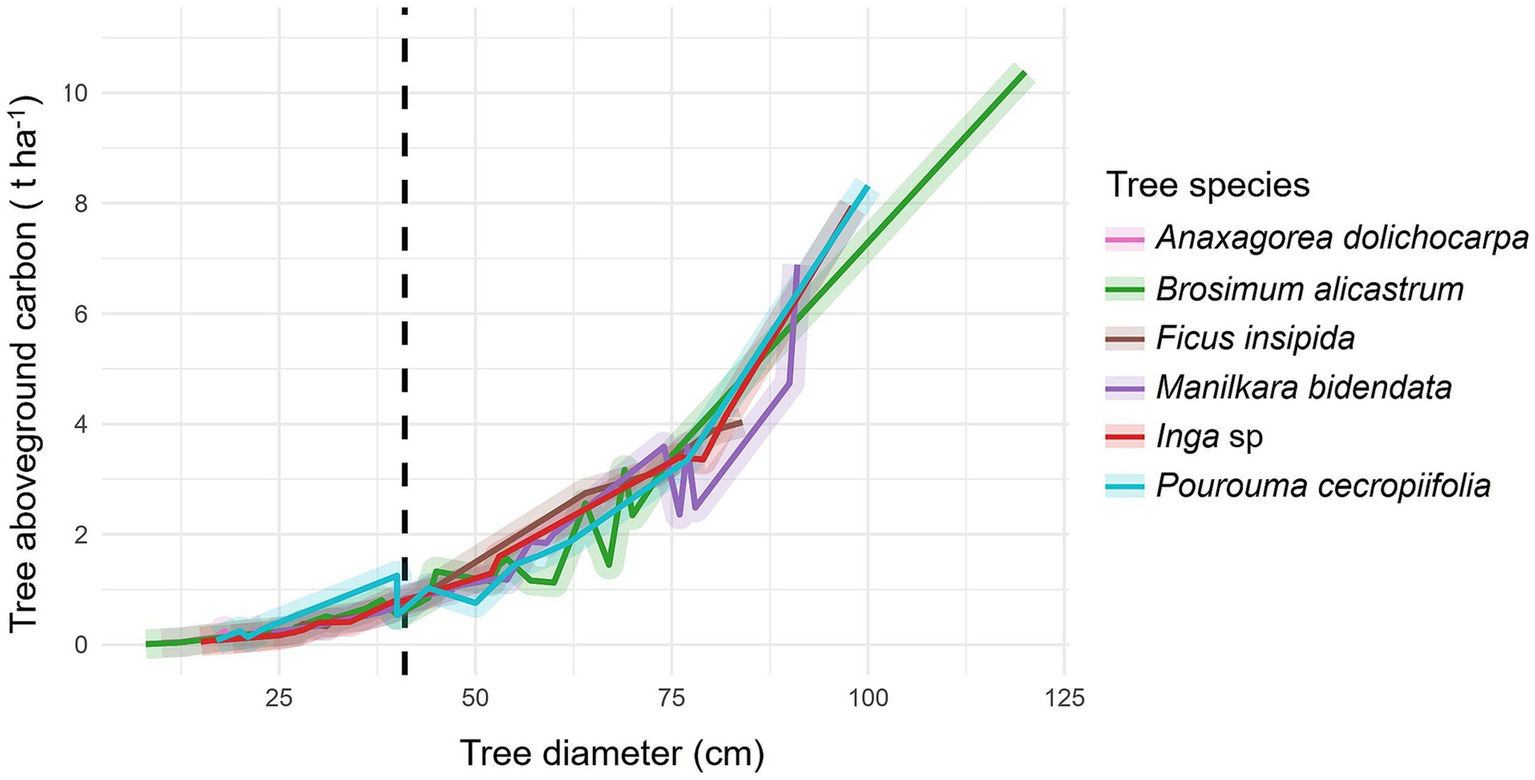
Aboveground carbon content in forest species with ≥ 46 cm DBH (dashed line).
Figure 3
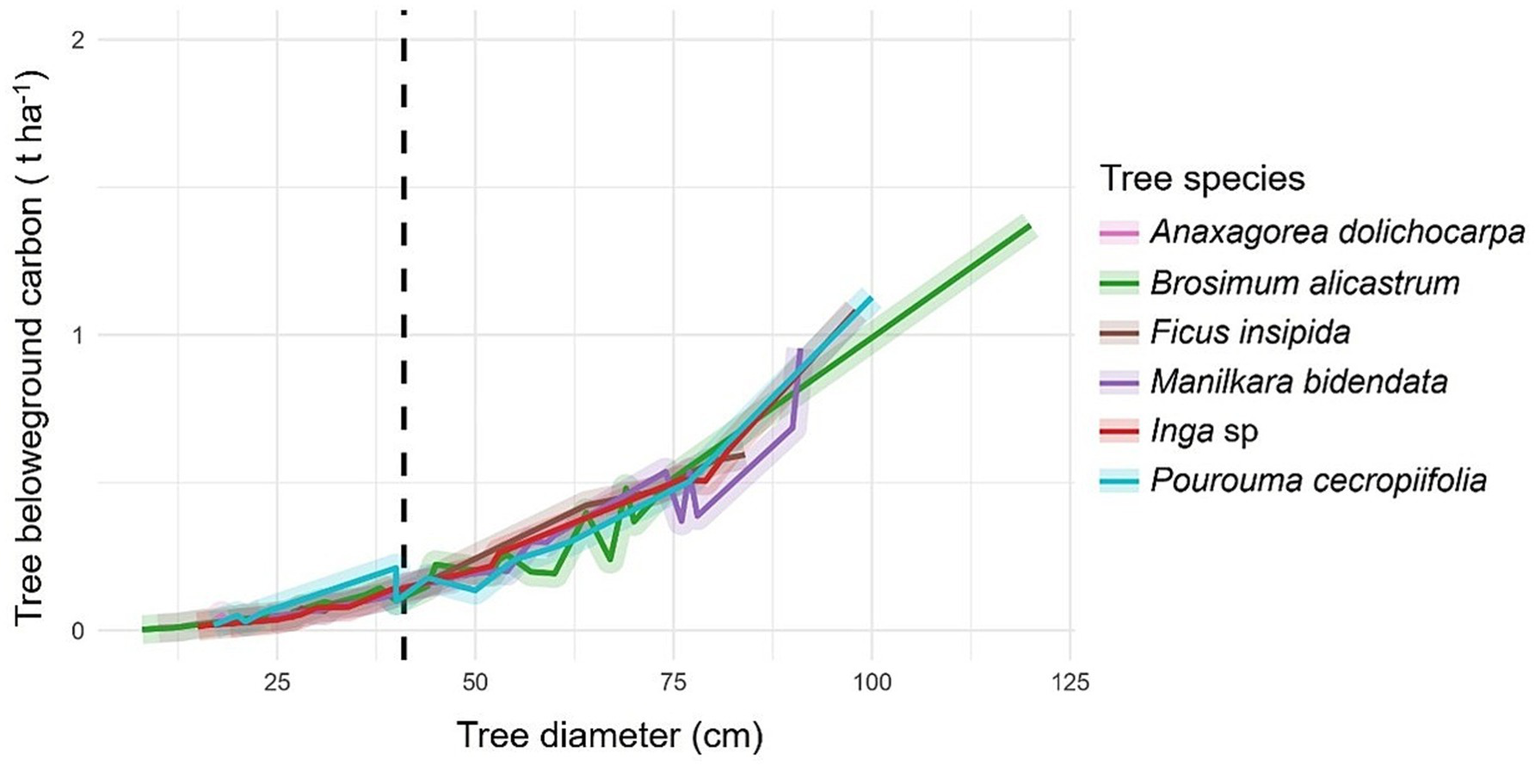
Belowground carbon content in forest species with ≥ 46 cm DBH (dashed line).
3.3 Proportion of above- and below-ground carbon in forest species larger and smaller than 41, 46 y 61 cm in diameter
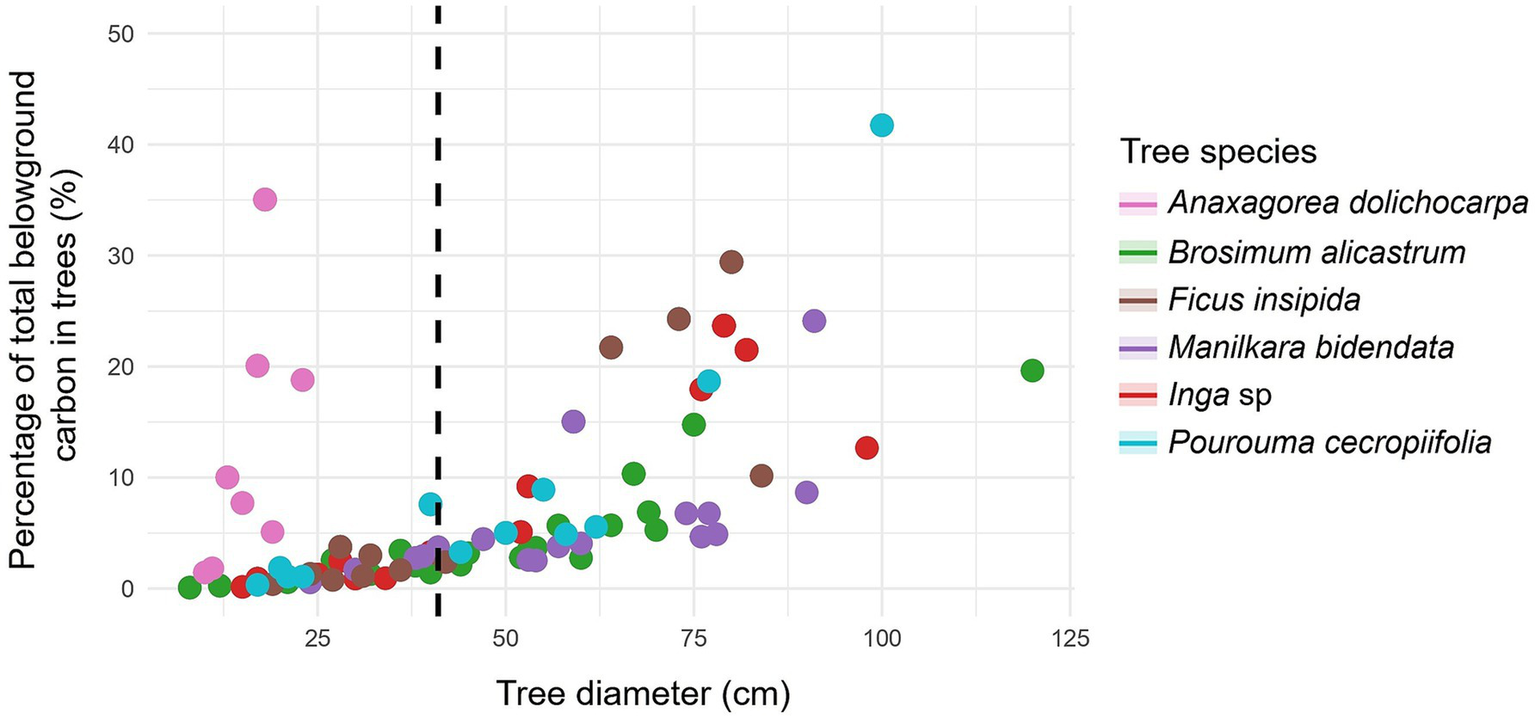
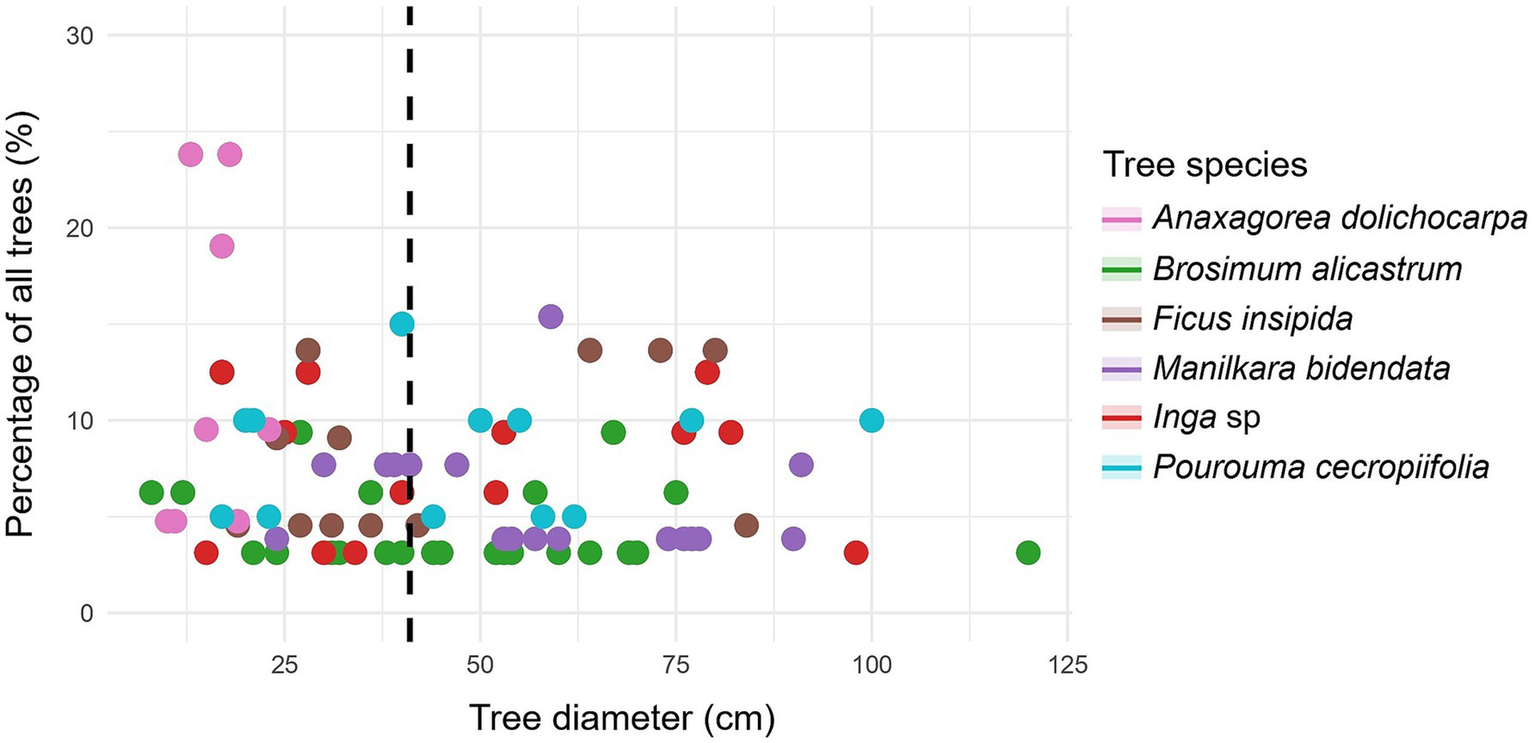
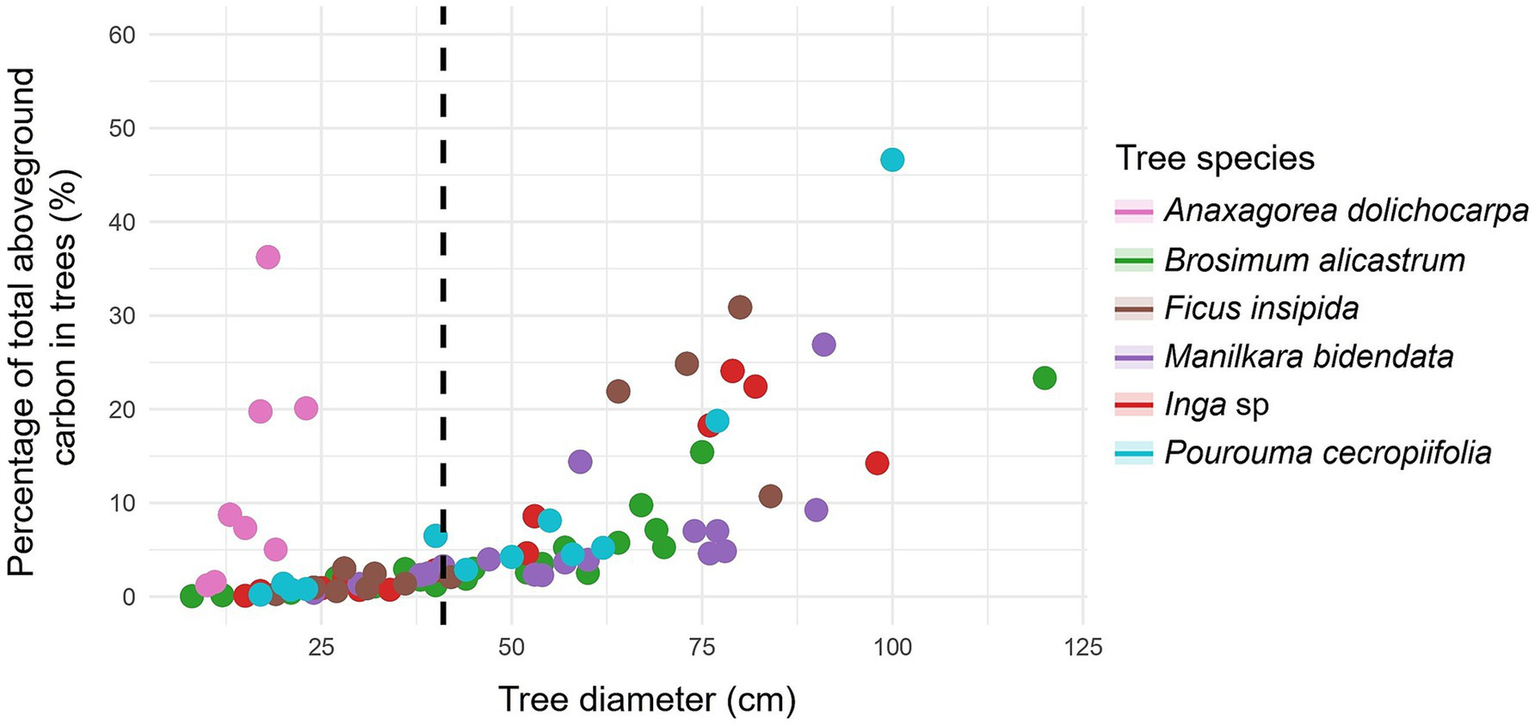
For the main forest species, the highest percentage of trees was found with DBH > 41 cm, for example with B. alicastrum, M. bidentata, and P. cecropiifolia (Table 4). Likewise, with respect to the aboveground (Figure 4) and belowground carbon (Figure 5), the highest proportions were found in trees with DBH > 41 cm, reaching 93.47% in M. bidentata. The tree species B. alicastrum had an above- and below-ground carbon storage of 11.35 and 13.73%, respectively, in trees with DBH <41 cm, in contrast, it exhibited respective averages of 88.65 and 86.27%, in trees with DBH ≥ 41 cm. Accordingly, F. insipida presents an above- and below-ground carbon storage of 9.56 and 11.69%, respectively, in trees with <41 cm DBH, meanwhile, it exhibited respective averages of 90.44 and 88.31%, in trees with DBH ≥41 cm. Manilkara bidentata had an above- and below-ground carbon storage of 6.53 and 7.94%, respectively, in trees with DBH <41 cm, meanwhile, it exhibited respective averages of 93.47 and 92.06% in trees with DBH ≥ 41 cm. Furthermore, Inga sp. had an above- and below-ground carbon storage of 7.74 and 9.90% respectively, in trees with DBH <41 cm, while it exhibited averages of 92.26 and 90.0% in trees with DBH ≥ 41 cm; and P. cecropiifolia had an above- and below-ground carbon storage of 9.65 and 11.94% respectively, in trees with DBH <41 cm, while it exhibited averages of 90.35 and 88.06%, in trees with DBH ≥ 41 cm (Table 4 and Figure 6).
Table 4
| Species | Total % of trees | % of aboveground carbon | % of belowground carbon | |||
|---|---|---|---|---|---|---|
| <41 cm | ≥41 cm | <41 cm | ≥41 cm | <41 cm | ≥41 cm | |
| Anaxagorea dolichocarpa | 100 | 0 | 100 | 0 | 100 | 0 |
| Brosimum alicastrum | 46.88 | 53.12 | 11.35 | 88.65 | 13.73 | 86.27 |
| Ficus insipida | 50 | 50 | 9.56 | 90.44 | 11.69 | 88.31 |
| Manilkara bidentata | 26.92 | 73.08 | 6.53 | 93.47 | 7.94 | 92.06 |
| Inga sp. | 50 | 50 | 7.74 | 92.26 | 9.9 | 90.1 |
| Pourouma cecropiifolia | 45 | 55 | 9.65 | 90.35 | 11.94 | 88.06 |
Proportion of total trees and carbon content in trees less than and greater than 41 cm DBH.
Figure 4
Relationship between tree diameter at breast height to carbon in forest species with ≥ 41 cm DBH (dashed line): percentage of all forest trees in the study.
Figure 5
Relationship between tree diameter at breast height to carbon in forest species with ≥ 41 cm DBH (dashed line): aboveground carbon content.
Figure 6
Relationship between tree diameter at breast height to carbon in forest species with ≥ 41 cm DBH (dashed line): belowground carbon content.
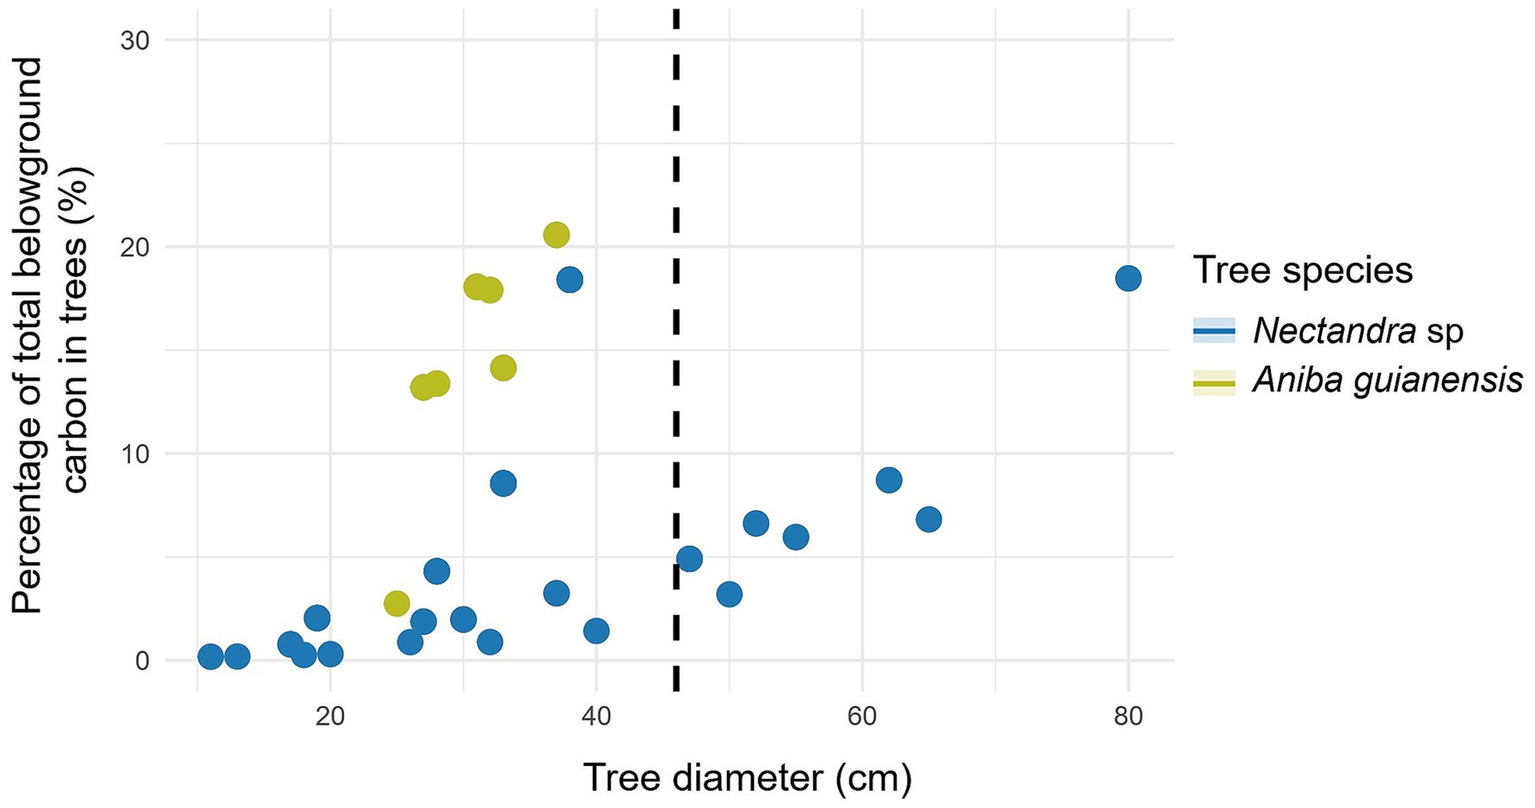
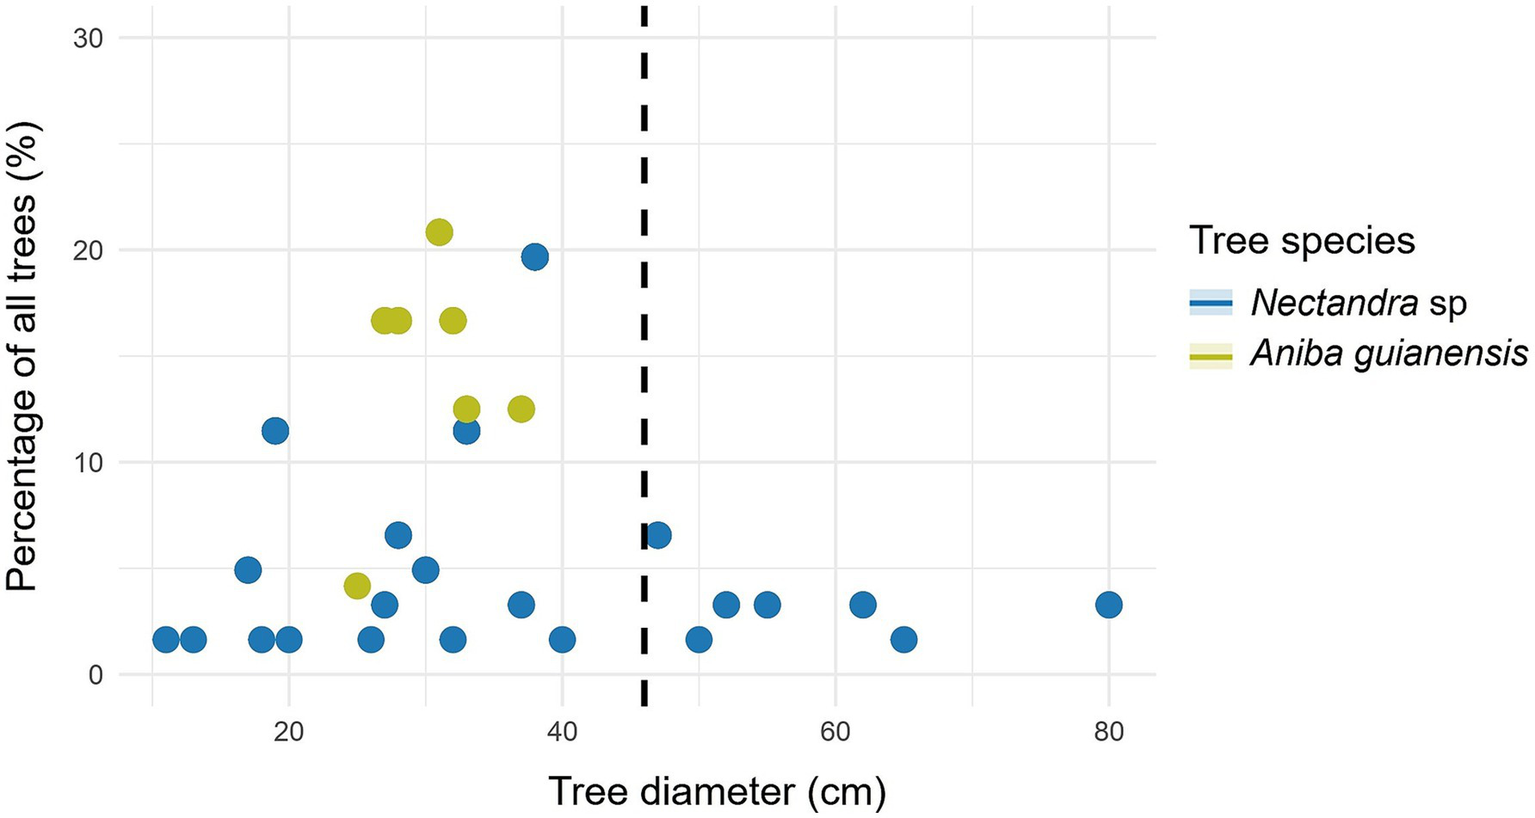
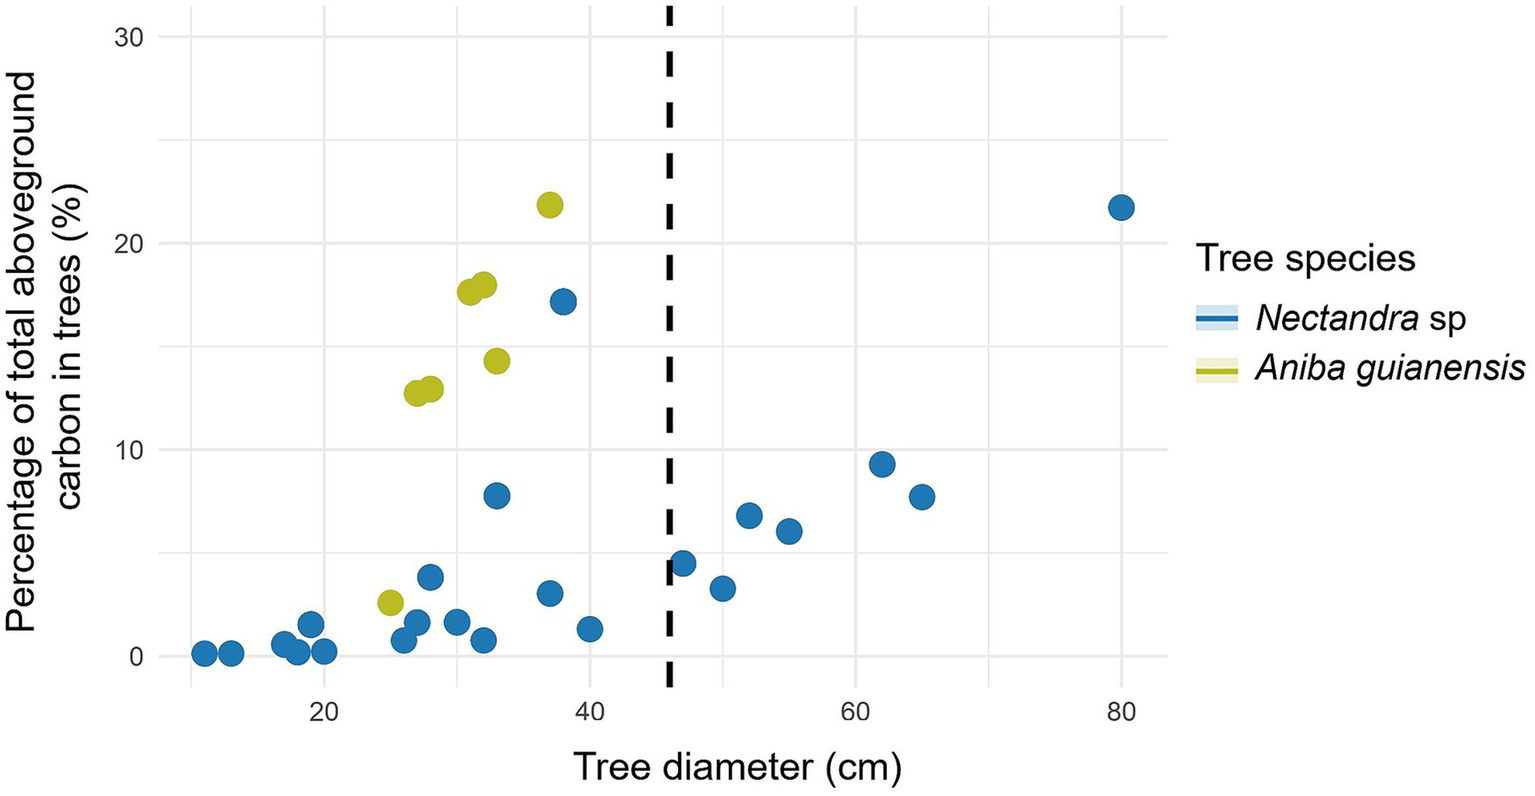
Further based on this study, for Nectandra sp. the highest percentage of trees was found with DBH < 46 cm (Table 5). Likewise, with respect to the percentage of aboveground (Figure 7) and belowground carbon (Figure 8), the highest proportions were found in trees with DBH > 46 cm (59.32 and 54.69%, respectively) (Table 5). This species presents an aboveground and belowground carbon storage of 40.68 and 45.31%, respectively, in trees with DBH <46 cm, while it shows respective averages of 59.32 and 54.69% in trees with DBH ≥ 46 cm. The species also presents an aboveground and belowground carbon storage of 0.39 and 0.07 t ha-1 per tree, respectively, with DBH <46 cm, while it exhibited averages of 2.50 and 0.38 t ha-1 in trees with DBH ≥ 46 cm (Table 5 and Figure 9).
Table 5
| Species | Total % of trees | % of aboveground carbon | % of belowground carbon | |||
|---|---|---|---|---|---|---|
| <46 cm | ≥46 cm | <46 cm | ≥46 cm | <46 cm | ≥46 cm | |
| Nectandra sp. | 77.05 | 22.95 | 40.68 | 59.32 | 45.31 | 54.69 |
| Aniba guianensis | 100 | 0 | 100 | 0 | 100 | 0 |
Proportion of total trees and carbon content in trees less than and greater than 46 cm diameter at breast height (DBH).
Figure 7
Relationship between tree diameter at breast height to carbon in forest species with ≥ 46 cm DBH (dashed line): percentage of all forest trees in the study.
Figure 8
Relationship between tree diameter at breast height to carbon in forest species with ≥ 46 cm DBH (dashed line): aboveground carbon content.
Figure 9
Relationship between tree diameter at breast height to carbon in forest species with ≥ 46 cm DBH (dashed line): belowground carbon content.
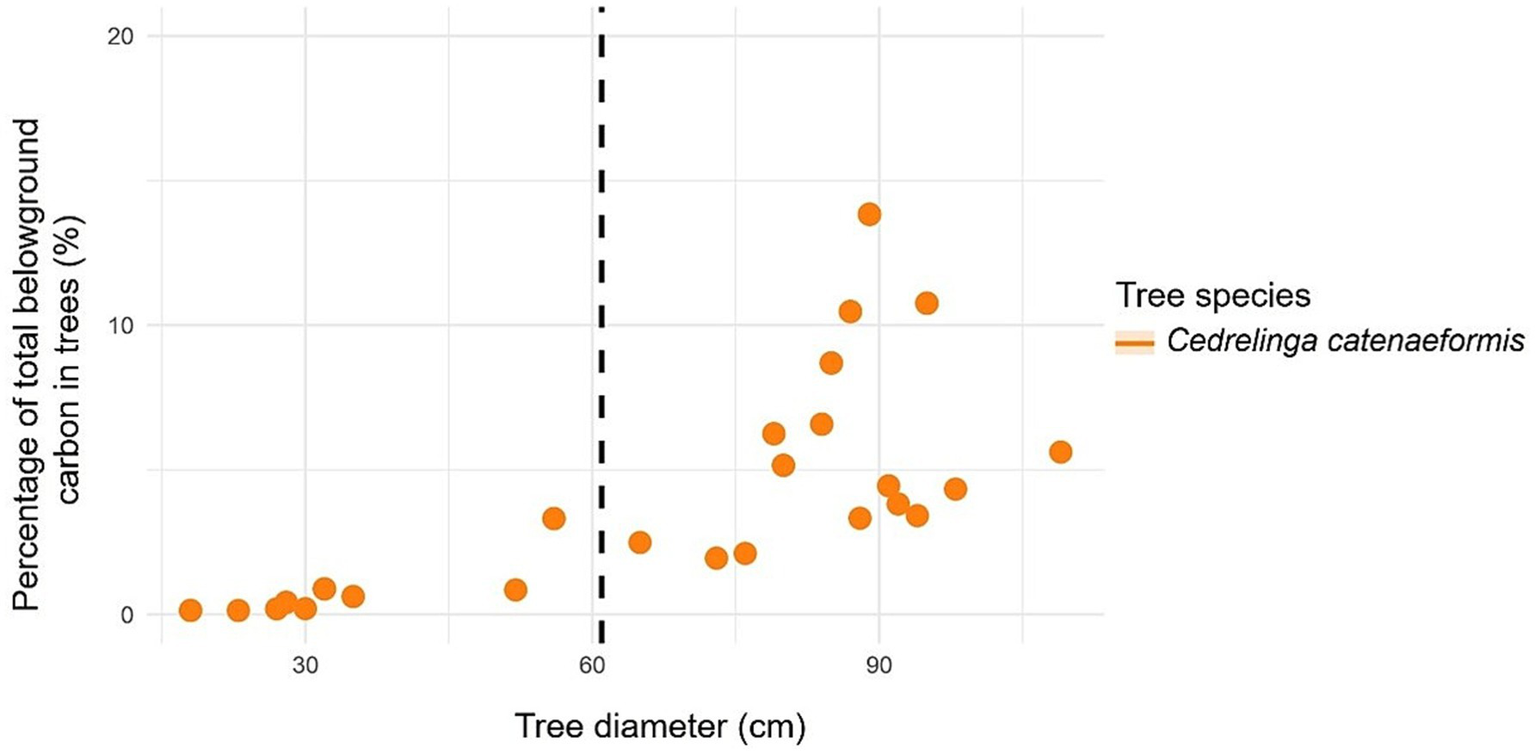
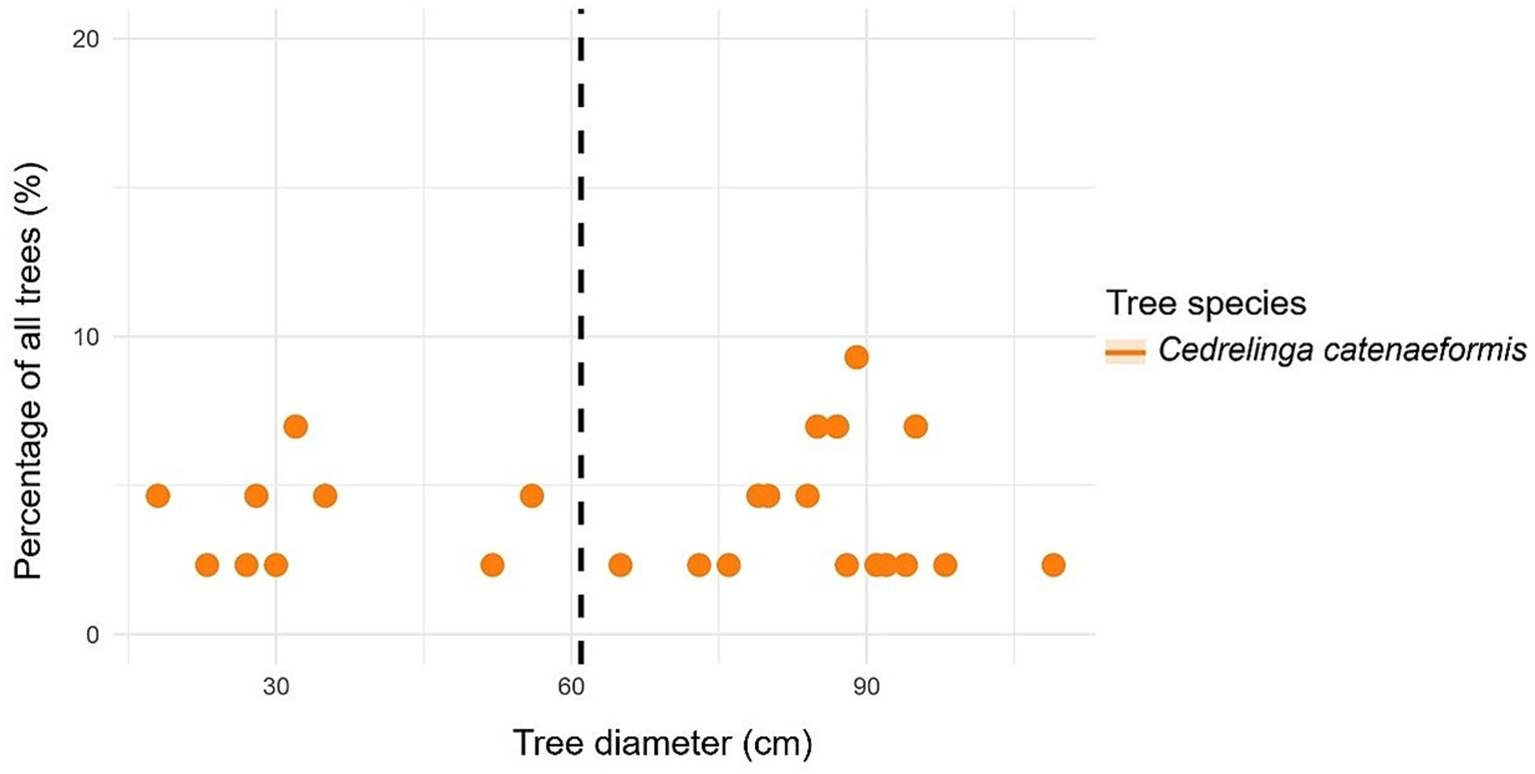
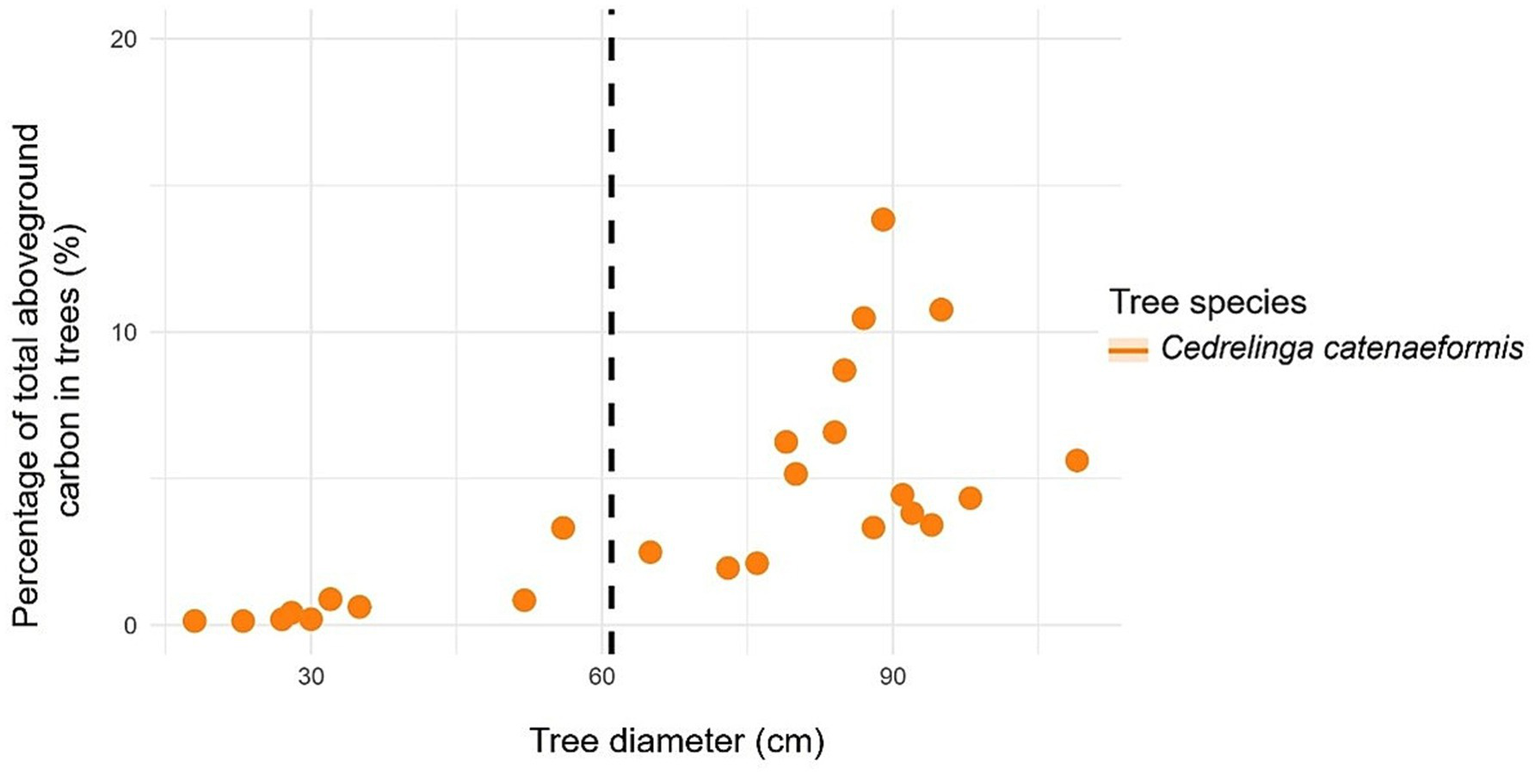
In the case of C. catenaeformis, the highest percentage of trees was found with DBH > 61 cm (Table 6). Likewise, with respect to the percentage of aboveground (Figure 10) and belowground carbon (Figure 11), the highest proportions were found in trees with DBH > 61 cm, reaching up to 93.24. The species of C. catenaeformis presents an aboveground and belowground carbon storage of 6.76 and 7.94%, respectively, in trees with DBH <61 cm, while it exhibited respective averages of 93.24 and 92.06% in trees with DBH ≥ 61 cm. The species also presents an aboveground and belowground carbon storage of 0.70 and 0.12 t ha-1 per tree, respectively, in trees with DBH <61 cm, while it had averages of 5.21 and 0.74 t ha-1 in trees with DBH ≥ 61 cm DBH (Table 6 and Figure 12).
Table 6
| Species | Total % of trees | % of aboveground carbon | % of belowground carbon | |||
|---|---|---|---|---|---|---|
| <61 cm | ≥61 cm | <61 cm | ≥61 cm | <61 cm | ≥61 cm | |
| Cedrelinga catenaeformis | 34.88 | 65.12 | 6.76 | 93.24 | 7.94 | 92.06 |
Proportion of total trees and carbon content in trees less than and greater than 61 cm diameter at breast height (DBH).
Figure 10
Relationship between tree diameter at breast height to carbon in forest species with ≥ 61 cm DBH (dashed line): percentage of all forest trees in the study.
Figure 11
Relationship between tree diameter at breast height to carbon in forest species with ≥ 61 cm DBH (dashed line): aboveground carbon content and 12 belowground carbon content.
Figure 12
Relationship between tree diameter at breast height to carbon in forest species with ≥ 61 cm DBH (dashed line): belowground carbon content.
4 Discussion
The results of this study are consistent with those reported by Valdez et al. (2018), in their evaluation of a thorn scrub forest in Mexico, documented a Shannon–Wiener index of 2.426 and a Pielou index of 0.694. Similarly, Medrano et al. (2017) reported Shannon–Wiener index of 1.94 to 2.67 very close to that found in this study. Meanwhile, Kumar et al. (2022) observed Shannon–Wiener index values greater than 2.06 and Pielou index of 0.99. The Simpson diversity index had higher values in the case of AMF, reflecting indicating a pronounced dominance of certain forest species. The Pielou evenness index value in this study ranged from 0.82 to 0.93, very close to 1, already noted by Kanieski et al. (2018).
This study results are also consistent with those by Mildrexler et al. (2020), whom demonstrated that large-diameter trees store disproportionately large amounts of carbon and also play an important driver of carbon cycle dynamics in forests worldwide. The marked increase in carbon storage with increasing tree diameter found in the San Martín region validates the importance of conserving and maintaining large trees to maintain levels of stored carbon in the forest ecosystem (Law et al., 2018). This study also exposes large aboveground and belowground carbon pools, especially in species with DBH > 41 cm. This findings highlight the potential for significant losses of both the aboveground and belowground carbon resulting from felling of large trees.
Carbon storage associated with the forest species studied in the different Peruvian Amazon forests is a significant benefit of this measure that guarantees the protection of forest species. The tree species B. alicastrum, F. insipida, M. bidentata, Inga sp., P. cecropiifolia, Nectandra sp., and C. catenaeformis with DBH ≥ 41 cm store 198.031 t ha-1 of aboveground carbon and 30.06 t ha-1 of belowground carbon. This finding highlights the important role of large trees in carbon storage in forest ecosystems and is consistent with previous findings regarding the disproportionately important role of large trees in the forest carbon cycle (Lutz et al., 2018; Stephenson et al., 2014; Mildrexler et al., 2020). The obvious increase in carbon storage with increasing tree diameter (Figure 2), particularly after 41 cm DBH, highlights to the importance of conserving large trees in order to store adequate amount of carbon in the forest ecosystem, where it remains for centuries (Law et al., 2018; Lutz et al., 2018). For Nectandra sp. regarding the percentage of aerial and underground carbon, the highest proportions were found in trees with DBH > 46 cm (59.32 and 54.69%). The results found in this study are close to those reported by Ma et al. (2018), who calculated an average carbon content of 47.9% in trees on a global scale.
It is important to note that a diameter limit that emphasized the protection of carbon stocks would ideally conserve trees starting with a DBH limit of ≥41 cm. It is therefore recommended that this Chief Resolution be annulled, and that concessionaires be obligated to determine and justify the DBH for the species they intent to harvest (Kometter, 2019). Otherwise, human exploitation would accelerate species extinction, causing events that naturally occur over millennia to repeat within few decades (Romero et al., 2021; Fearnside, 2021). It negotiations the ecological integrity of the habitats of the forest species presented in the study. Meanwhile, previous research shows that overexploitation of key species, particularly large trees of commercial interest that store significant amounts of carbon, generates significant ecological imbalances (Udali et al., 2024; Romero et al., 2025).
Factoring in the spatial variation of wood density notably changes the estimates of forest carbon stocks, causing differences of up to 21% within biomes. Therefore, wood density is another key factor of tree carbon investment strategies, impacting productivity and carbon storage (Mo et al., 2024). Further, forest ecosystems play a vital role in global carbon sequestration, with the majority of forest carbon stored in biomass (Chen et al., 2024). Meanwhile, dominant trees across different forests contributed substantially to carbon storage in both biomass and forest soils, thereby enhancing carbon credits and facilitating forest ecosystem carbon trading (Joshi and Garkoti, 2025).
The next step in this research on tree species in San Martin, is to assess how different above- and below-ground functional groups might explain both species coexistence and species-specific carbon accumulation. For example, after analyzing 145 co-occurring tropical tree species in Malaysia, Iida et al. (2012) found that wood density (at standardized tree heights) correlated negatively with stem diameter and height of the lowest foliage, and positively with stem biomass and crown density. Thus, species with low wood density tend to have thicker stems but lower biomass costs, whereas species with high wood density exhibit wider and deeper crowns (Iida et al., 2012). Despite this, other studies have reported contrasting patterns. For instance, in Amazonian forests, recently Menezes et al. (2025) found ‘no evidence for architectural trait linkage to wood density’ when they assessed traits such as DBH, total and stem height, crown length, and many others. However, they did find that trees with higher wood density had smaller leaf size, lower foliar base cations, and reduced stem water content and sapwood fraction, consistent with the fast–slow plant economics spectrum (Reich, 2014). Based on these finding, a next step in this research will be to assess those functional traits (Menezes et al., 2025) but also belowground traits that might explain species-specific carbon accumulation.
5 Conclusion
It is important to note that a diameter threshold emphasizing carbon stock protection would ideally safeguard trees with a DBH ≥ 41 cm. However, the current cmD standards based on 41 cm for the forest species B. alicastrum, F. insipida, M. bidentata, Inga sp., and P. cecropiifolia, 46 cm for Nectandra sp., and 61 cm for C. catenaeformis, as regulated by Resolution No. 458-2002-INRENA, could pose serious challenges for forest conservation and carbon storage. Quantitative assessments of dasymetric characteristics and the application of allometric equations have demonstrated the substantial carbon storage potential of different forest species in the Peruvian Amazon. The loss of these carbon stocks could have severe climatic consequences, particularly if large trees are felled. Logging large trees with DBH > 41 cm would release very large amounts of biogenic carbon into the atmosphere, making Peru’s net-zero carbon goal difficult, if not impossible, to achieve. Young trees will not be able to recover or accumulate the carbon stored in mature and older forests within the next critical decades, and would only reach comparable levels in a century or more from now. This knowledge of aboveground and belowground carbon storage potential in Amazonian tree species creates an opportunity for the public, decision-makers, and forest managers to recognize that these trees are integral part of the climate solution.
Statements
Data availability statement
The raw data supporting the conclusions of this article will be made available by the authors, without undue reservation.
Author contributions
AL: Project administration, Resources, Software, Supervision, Writing – review & editing. NG-J: Investigation, Methodology, Project administration, Resources, Writing – review & editing. JA: Conceptualization, Methodology, Validation, Visualization, Writing – original draft. PG-G: Conceptualization, Data curation, Formal analysis, Funding acquisition, Writing – review & editing. AA: Investigation, Project administration, Resources, Supervision, Writing – original draft. LO: Writing – review & editing, Conceptualization, Visualization. JS-R: Investigation, Methodology, Project administration, Visualization, Writing – original draft. JT-H: Investigation, Methodology, Project administration, Visualization, Writing – original draft. LV: Writing – original draft, Methodology, Resources. OT-H: Conceptualization, Methodology, Project administration, Resources, Writing – original draft. JB-V: Data curation, Project administration, Software, Validation, Visualization, Writing – original draft. RC-R: Methodology, Resources, Writing – review & editing, Investigation, Project administration. SÁ: Conceptualization, Project administration, Resources, Supervision, Writing – original draft. CM: Methodology, Software, Validation, Visualization, Writing – review & editing. GV-T: Funding acquisition, Investigation, Methodology, Supervision, Validation, Visualization, Writing – original draft, Writing – review & editing.
Funding
The author(s) declared that financial support was received for this work and/or its publication. Special thanks to the National University of San Martín for funding this research.
Conflict of interest
The author(s) declared that this work was conducted in the absence of any commercial or financial relationships that could be construed as a potential conflict of interest.
The author CM declared that they were an editorial board member of Frontiers, at the time of submission. This had no impact on the peer review process and the final decision.
Generative AI statement
The author(s) declared that Generative AI was not used in the creation of this manuscript.
Any alternative text (alt text) provided alongside figures in this article has been generated by Frontiers with the support of artificial intelligence and reasonable efforts have been made to ensure accuracy, including review by the authors wherever possible. If you identify any issues, please contact us.
Publisher’s note
All claims expressed in this article are solely those of the authors and do not necessarily represent those of their affiliated organizations, or those of the publisher, the editors and the reviewers. Any product that may be evaluated in this article, or claim that may be made by its manufacturer, is not guaranteed or endorsed by the publisher.
Supplementary material
The supplementary material for this article can be found online at: https://www.frontiersin.org/articles/10.3389/ffgc.2025.1711078/full#supplementary-material
References
1
Almond R. Grooten M. Juffe-Bignoli D. Petersen T. 2020 Living planet report 2020 -bending the curve of biodiversity loss Almond R.E.A. Grooten M. Petersen T. WWF Gland, Switzerland. Available online at: https://www.wwf.org.uk/sites/default/files/2020-09/LPR20_Full_report.pdf
2
Aye W. N. Tong X. Tun A. W. (2022). Species diversity, biomass and carbon stock assessment of Kanhlyashay natural mangrove Forest. Forests13:1013. doi: 10.3390/f13071013
3
Cairns M.A. Brown S. Helmer F.H. Baumgardner G.A. (1997). Root biomass allocation in the world’s upland forests. Oecologia111, 1–11. Doi:10.1007/s004420050201, 1,
4
Case M. J. Johnson B. G. Bartowitz K. J. Hudiburg T. W. (2021). Forests of the future: climate change impacts and implications for carbon storage in the Pacific northwest, USA. For. Ecol. Manag.482:118886. doi: 10.1016/j.foreco.2020.118886
5
Chave J. Réjou-Méchain M. Búrquez A. Chidumayo E. Colgan M. C. Delitti W. B. C. et al . (2014). Improved allometric models to estimate the aboveground biomass of tropical trees. Glob. Chang. Biol.20, 3177–3190. doi: 10.1111/gcb.12629,
6
Chen K. Li T. Yang M. Zhou X. Peng C. (2024). The effects of environmental factors and plant diversity on forest carbon sequestration vary between eastern and western regions of China. J. Clean. Prod.437:140371. doi: 10.1016/j.jclepro.2023.140371
7
Corazon-Guivin M. A. Vallejos-Torres G. Vallejos-Tapullima A. Tenorio-Cercado M. Á. Caballero W. M. Marín C. et al . (2022). Rhizoglomus cacao, a new species of the Glomeraceae from the rhizosphere of Theobroma cacao in Peru, with an updated identification key for all species attributed to Rhizoglomus. Nova Hedwigia115, 99–115. Available at: https://www.schweizerbart.de/papers/nova_hedwigia/detail/115/101684/Rhizoglomus_cacao_a_new_species_of_the_Glomeraceae?af=crossref
8
Csillik O. Kumar P. Mascaro J. O’Shea T. Asner G. P. (2019). Monitoring tropical forest carbon stocks and emissions using planet satellite data. Sci. Rep.9:17831. doi: 10.1038/s41598-019-54386-6,
9
DellaSala D. A. Mackey B. Norman P. Campbell C. Comer P. J. Kormos C. F. et al . (2022). Mature and old-growth forests contribute to large-scale conservation targets in the conterminous United States. Front. For. Glob. Change5, 1–20. doi: 10.3389/ffgc.2022.979528
10
Eshetu E. Y. Hailu T. A. (2020). Carbon sequestration and elevational gradient: the case of Yegof mountain natural vegetation in north east, Ethiopia, implications for sustainable management. Cogent Food Agric.6:1733331. doi: 10.1080/23311932.2020.1733331
11
FAO . (2020). Global Forest resources assessment: Main report. Roma: FAO. Available online at: https://openknowledge.fao.org/server/api/core/bitstreams/9f24d451-2e56-4ae2-8a4a-1bc511f5e60e/content
12
FAO (2022). The state of the world’s forests. Forest pathways for green recovery and building inclusive, resilient and sustainable economies. Rome: Food and Agriculture Organization.
13
Fearnside P. M. (2021). The intrinsic value of Amazon biodiversity. Biodivers. Conserv.30, 1199–1202. doi: 10.1007/s10531-021-02133-7
14
Friedlingstein P. Jones M. W. O’Sullivan M. Andrew R. M. Hauck J. Peter G. P. et al . (2019). Global carbon budget. Earth Syst. Sci. Data11, 1783–1838. doi: 10.5194/essd-11-1783-2019
15
García-Villacorta R. 2015 Inventario Biológico en los Bosques Estacionalmente Secos del Huallaga Central, San Martín, Perú. Pág. 1–172. Available online at: https://repositorio.iiap.gob.pe/bitstream/20.500.12921/362/1/Garcia_libro_2015.pdf
16
Hauck M. Csapek G. Dulamsuren C. (2023). The significance of large old trees and tree cavities for forest carbon estimates. For. Ecol. Manag.546:121319. doi: 10.1016/j.foreco.2023.121319
17
Huang M. T. Zhai P. M. (2021). Achieving Paris agreement temperature goals requires carbon neutrality by middle century with far-reaching transitions in the whole society. Adv. Clim. Chang. Res.12, 281–286. doi: 10.1016/j.accre.2021.03.004
18
Iida Y. Poorter L. Sterck F. J. Kassim A. R. Kubo T. (2012). Wood density explains architectural differentiation across 145 co-occurring tropical tree species. Functional Ecology.26, 274–282. doi: 10.1111/j.1365-2435.2011.01921.x
19
IPCC 2014 2013 supplement to the 2006 IPCC guidelines for National Greenhouse gas Inventories Switzerland IPCC. Available online at: https://www.ipcc.ch/publication/2013-supplement-to-the-2006-ipcc-guidelines-for-national-greenhouse-gas-inventories-wetlands/
20
Joshi R. K. Garkoti S. C. (2025). Ecosystem carbon storage, allocation and carbon credit values of major forest types in the central Himalaya. Carbon Res.4:7. doi: 10.1007/s44246-024-00159-4
21
Joshi V. C. Negi V. S. Bisht D. Sundriyal R. C. Arya D. (2021). Tree biomass and carbon stock assessment of subtropical and temperate forests in the central Himalaya, India. Trees Forests People6:100147. doi: 10.1016/j.tfp.2021.100147
22
Kanieski M.R. Longhi S.J. Soares R.C. (2018). Methods for biodiversity assessment: case study in an area of Atlantic Forest in southern Brazil. Selected Studies in Biodiversity. London, United Kingdom: InTech. Available online at: https://www.intechopen.com/chapters/57718
23
Kometter R. 2019 Análisis de las prácticas de manejo y la sostenibilidad del recurso en las concesiones forestales con fines maderables. PRFNP-C-CON-021-2019-USAID/USFS Forest. 078C-201900021 Lima, Perú: USAID/USFS. Available online at: https://www.researchgate.net/publication/341341088_Analisis_de_las_Practicas_de_Manejo_y_de_la_Sostenibilidad_del_Recurso_en_las_Concesiones_Forestales_Maderables?channel=doiandlinkId=5ebb548f92851c11a864fd24andshowFulltext=true
24
Kumar P. Dobriyal M. Kale A. Pandey A. K. Tomar R. S. Thounaojam E. (2022). Calculating Forest species diversity with information-theory based indices using sentinel-2A sensor's of Mahavir swami wildlife sanctuary. PLoS One17:e0268018. doi: 10.1371/journal.pone.0268018,
25
Law B. E. Hudiburg T. W. Berner L. T. Kent J. J. Buotte P. C. Harmon M. (2018). Land use strategies to mitigate climate change in carbon dense temperate forests. Proc. Natl. Acad. Sci. USA115, 3663–3668. doi: 10.1073/pnas.1720064115,
26
Le Quéré C. Andrew R. M. Friedlingstein P. Sitch S. Hauck J. Pongratz J. et al . (2018). Global carbon budget. Earth Syst. Sci. Data.10, 2141–2194. doi: 10.5194/essd-10-2141-2018
27
Lutz J. A. Furniss T. J. Johnson D. J. Davies S. J. Allen D. Alonso A. et al . (2018). Global importance of large-diameter trees. Glob. Ecol. Biogeogr.27, 849–864. doi: 10.1111/geb.12747
28
Ma S. He F. Tian D. Zou D. Yan Z. Yang Y. et al . (2018). Variaciones y determinantes del contenido de carbono en plantas: Una síntesis global. Biogeosciences15, 693–702. doi: 10.5194/bg-15-693-2018
29
Martin A. R. Thomas S. C. (2011). Reevaluación del contenido de carbono en árboles tropicales. PLoS One6:e23533. doi: 10.1371/journal.pone.0023533,
30
Medrano M. Hernández F. J. Corral S. Nájera J. A. (2017). Diversidad arbórea a diferentes niveles de altitud en la región de El Salto, Durango. Rev. Mex. Cienc. For.8, 57–68. Available at: https://www.scielo.org.mx/scielo.php?script=sci_arttext&pid=S2007-11322017000200057
31
Menezes V. D. S. Gimenez B. O. Wright C. L. Higuchi N. Nascimento C. C. Barros F. et al . (2025). Mortality correlates with tree functional traits across a wood density gradient in the Central Amazon. Front. Plant Sci.16:1572767. doi: 10.3389/fpls.2025.1572767,
32
Mildrexler D. J. Berner L. T. Law B. E. Birdsey R. A. Moomaw W. R. (2020). Large trees dominate carbon storage in forests east of the Cascade crest in the United States Pacific northwest. Front. For. Glob. Change3:594274. doi: 10.3389/ffgc.2020.594274
33
Mildrexler D. J. Berner L. T. Law B. E. Birdsey R. A. Moomaw W. R. (2023). Protect large trees for climate mitigation, biodiversity, and forest resilience. Conserv. Sci. Pract.5:e12944. doi: 10.1111/csp2.12944
34
MINAM . 2015. Estrategia Nacional Sobre Bosques y Cambio Climático. Lima Ver en: Ministerio del Ambiente de Perú. Available online at: bit.ly/3xJm7PM
35
MINAM 2016 Tercera Comunicación Nacional del Perú a la Convención Marco de las Naciones Unidas sobre el Cambio Climático Lima, Perú: Ministerio del Ambiente de Perú. Available online at: https://sinia.minam.gob.pe/documentos/tercera-comunicacion-nacional-peru-convencion-marco-las-naciones
36
Mo L. Crowther T. W. Maynard D. S. van den Hoogen J. Ma H. Bialic-Murphy L. et al . (2024). The global distribution and drivers of wood density and their impact on forest carbon stocks. Nat Ecol Evol.8, 2195–2212. doi: 10.1038/s41559-024-02564-9
37
R Core Team . 2024. R: A language and environment for statistical computing. R Foundation for Statistical Computing, Vienna, Austria. Available online at: https://www.R-project.org/
38
Reich P. B. (2014). The world-wide ‘fast–slow’plant economics spectrum: a traits manifesto. J. Ecol.102, 275–301. doi: 10.1111/1365-2745.12211
39
Romero F. M. B. Jacovine L. A. G. Carneiro A. d. C. O. Chaves M. V. G. S. Bezerra E. B. Lafuente J. P. S. et al . (2025). Carbon content of Amazonian commercial tree boles: implications for forest management. Sustainability17:2960. doi: 10.3390/su17072960
40
Romero F. M. B. Jacovine L. A. G. Torres C. M. M. E. Ribeiro S. C. de Morais Junior V. T. M. da Rocha S. J. S. S. et al . (2021). Forest management with reduced-impact logging in Amazonia: estimated aboveground volume and carbon in commercial tree species in managed forest in Brazil’s state of acre. Forests12:481. doi: 10.3390/f12040481
41
Sabogal-Dunin-Borkowski A. (2023). Reflexión introductoria: los bosques del Perú desde una mirada compleja. Revista Kawsaypacha: Sociedad Y Medio Ambiente12:A-000. doi: 10.18800/kawsaypacha.202302.A000
42
SERFOR . (2021). Servicio Nacional Forestal y de Fauna Silvestre Cuenta de Bosques del Perú Documento metodológico. Lima, Perú: Servicio Nacional Forestal y de Fauna Silvestre de Perú. Available at: https://seea.un.org/content/cuenta-de-bosques-del-per%C3%BA-documento-metodol%C3%B3gico
43
Song Z. Shi P. Li P. Li Z. Niu H. Zu P. et al . (2024). Efectos del tipo de bosque en el almacenamiento de carbono en la región montañosa de la meseta de Loess, China. Front. For. Glob. Change7:1349047. doi: 10.3389/ffgc.2024.1349047
44
Stephenson N. L. Das A. J. Condit R. Russo S. E. Baker P. J. Beckman N. G. et al . (2014). Rate of tree carbon accumulation increases continuously with tree size. Nature507, 90–93. doi: 10.1038/nature12914,
45
Toochi E. (2018). Carbon sequestration: howmuch can forestry sequester CO2. For. Res. Eng. Int. J.2, 148–150. doi: 10.15406/freij.2018.02.00040
46
Udali A. Chung W. Talbot B. Grigolato S. (2024). Managing harvesting residues: a systematic review of management treatments around the world. For. Int. J. For. Res.98, 117–135. doi: 10.1093/forestry/cpae041,
47
Valdez M. C. G. Guzmán L. M. A. Valdés G. A. Forougbakhch P. R. Alvarado V. M. A. Rocha E. A. (2018). Estructura y diversidad de la vegetación en un matorral espinoso prístino de Tamaulipas, México. Rev. Biol. Trop.66, 000–000. doi: 10.15517/rbt.v0i2
48
Vallejos-Torres G. Gaona-Jimenez N. Pichis-García R. Ordoñez L. García-Gonzales P. Quinteros A. et al . (2024). Carbon reserves in coffee agroforestry in the Peruvian Amazon. Front. Plant Sci.15:1410418. doi: 10.3389/fpls.2024.1410418,
49
Vallejos-Torres G. Ríos-Ramírez O. Saavedra H. Gaona-Jimenez N. Mesén-Sequeira F. Marín C. (2021). Vegetative propagation of Manilkara bidentata (a.DC.) a.Chev. Using mini-tunnels in the Peruvian Amazon region. Forest Syst.30:eRC01. doi: 10.5424/fs/2021302-17971
50
Vallejos-Torres G. Torres S. C. Gaona-Jimenez N. Saavedra J. Tuesta J. C. Tuesta O. A. et al . (2022). The combined effect of arbuscular mycorrhizal fungi and compost improves growth and soil parameters and decreases cadmium absorption in cacao (Theobroma cacao L.) plants. J. Soil Sci. Plant Nutr.22, 5174–5182. doi: 10.1007/s42729-022-00992-9
51
Zanne A. E. Lopez-Gonzalez G. Coomes D. A. Ilic J. Jansen S. Lewis S. L. et al . (2009). Data from: towards a worldwide wood economics spectrum [dataset]. Dryad. doi: 10.5061/dryad.234
Summary
Keywords
forest, aerial carbon, cutting cycle, DMC, allometric formulas, species richness
Citation
Lozano A, Gaona-Jimenez N, Alvarado JW, García-Gonzáles P, Arévalo AA, Ordoñez L, Saavedra-Ramírez J, Tuesta-Hidalgo JC, Vilela L, Tuesta-Hidalgo OA, Baselly-Villanueva JR, Chuchon-Remon R, Águila SR-D, Marín C and Vallejos-Torres G (2026) Dominance of large trees in carbon storage of Peruvian Amazon forest. Front. For. Glob. Change 8:1711078. doi: 10.3389/ffgc.2025.1711078
Received
25 September 2025
Revised
18 November 2025
Accepted
30 November 2025
Published
26 January 2026
Volume
8 - 2025
Edited by
Hubert Hasenauer, University of Natural Resources and Life Sciences Vienna, Austria
Reviewed by
Dary Rigueira, Federal University of Bahia (UFBA), Brazil
Gabriela Salami, Federal University Rural Semi-Arid, Brazil
Updates
Copyright
© 2026 Lozano, Gaona-Jimenez, Alvarado, García-Gonzáles, Arévalo, Ordoñez, Saavedra-Ramírez, Tuesta-Hidalgo, Vilela, Tuesta-Hidalgo, Baselly-Villanueva, Chuchon-Remon, Águila, Marín and Vallejos-Torres.
This is an open-access article distributed under the terms of the Creative Commons Attribution License (CC BY). The use, distribution or reproduction in other forums is permitted, provided the original author(s) and the copyright owner(s) are credited and that the original publication in this journal is cited, in accordance with accepted academic practice. No use, distribution or reproduction is permitted which does not comply with these terms.
*Correspondence: Geomar Vallejos-Torres, gvallejos@unsm.edu.pe
Disclaimer
All claims expressed in this article are solely those of the authors and do not necessarily represent those of their affiliated organizations, or those of the publisher, the editors and the reviewers. Any product that may be evaluated in this article or claim that may be made by its manufacturer is not guaranteed or endorsed by the publisher.