Abstract
The spatiotemporal differentiation of net primary productivity (NPP) is non-linearly regulated by multiple factors, with the identification of driving factor thresholds and ecological zoning remaining a key challenge in ecosystem research. This study examined the spatiotemporal evolution of NPP using the Sen+MK test and the Hurst index. It then identified thresholds and interactions among NPP driving factors through an XGBoost–SHAP–Restricted Cubic Splines (RCS) model. Finally, it developed ecological zoning based on the identified thresholds. The main conclusions are as follows: (1) Over the past 21 years, NPP in the study area exhibited a fluctuating upward trend with significant spatial heterogeneity (higher in the west, lower in the east), and a potential decline is projected for the future. (2) Driving factors were ranked by importance, and their critical thresholds identified: precipitation (1103.77 mm) > soil organic matter content (4%, 8.31%) > vegetation index (0.44) > elevation (129.99 m) > temperature (13.71 °C) > distance to roads (1.11 km) > distance to water bodies (1.65 km, 8.91 km) > slope (7.24°) > distance to residential areas (4.1 km) > nighttime light intensity (1.55 NW/cm2/sr). Significant non-linear effects and interactions among the driving factors were identified. (3) Ecological zoning was implemented based on the identified critical thresholds. The results indicate that most areas of Yichang City were classified as key protection zones and key prevention zones, primarily influenced by natural factors; while a small portion was designated as key treatment zones, primarily influenced by anthropogenic factors. This zoning provides a clear scientific basis for implementing differentiated ecosystem management strategies.
1 Introduction
As a key component of terrestrial ecosystems, vegetation plays a vital role in the carbon cycle, water balance, and energy transformation (Deng et al., 2019). Net primary productivity (NPP) represents the net accumulation of organic matter by plants through photosynthesis per unit area and time, after accounting for losses due to autotrophic respiration (Xue et al., 2023). Consequently, NPP is widely recognized as a key indicator for evaluating ecosystem health and stability. Vegetation productivity plays a crucial role in driving the terrestrial carbon cycle and serves as a key regulator of natural carbon sequestration in terrestrial ecosystems (Li et al., 2022a). However, the rapid development of urbanization and the intensifying impacts of climate change may adversely affect vegetation growth, with these changes typically reflected in NPP over relatively short timescales (Cramer and Field, 1999). Therefore, studying NPP is crucial for enhancing our understanding of ecosystem health and stability, as well as providing scientific support for mitigating and adapting to global environmental changes.
As early as the 1970s, Lieth and Whittaker (1975) established a global model for the spatial distribution of vegetation NPP, revealing a clear functional relationship between temperature, precipitation, and NPP. Since then, researchers have concentrated on the temporal and spatial variations of NPP and its driving factors (Liu et al., 2025; Wang et al., 2025; Liu et al., 2019; Yin et al., 2023). Early studies primarily employed linear models to analyse the relationship between NPP and its driving factors (Peng et al., 2016; Sun et al., 2021). However, these models, based on linear assumptions, often overlook the complex non-linear responses of ecosystems, thereby limiting their predictive capabilities under dynamic environmental conditions. This results from the non-linear relationship between vegetation NPP and its driving factors (Ma et al., 2021; Tian et al., 2016), shaped by multiple complex environmental variables (Shi et al., 2023; Li et al., 2023; Song et al., 2021). Additionally, numerous studies have identified threshold effects in the influence of driving factors on NPP (Wang et al., 2017; Huang et al., 2019). Under certain environmental conditions, the impact of a driving factor on NPP can undergo significant changes at critical thresholds. To more accurately capture these non-linear features and thresholds, some studies have adopted methods capable of revealing non-linear relationships and identifying the thresholds of driving factors, such as segmented linear regression (Zhang et al., 2023), elasticity coefficient analysis (Lin et al., 2023), and constraint line techniques (Li et al., 2021). For instance, Li et al. (2022b) applied the restricted cubic spline (RCS) method to analyse the non-linear responses of ecosystem services to both natural and anthropogenic drivers, identify critical thresholds, and conduct regional zoning based on these thresholds. It is important to include ecological thresholds in environmental management because many ecosystems react to both natural and human-made factors in a non-linear way (Kelly et al., 2015). Nevertheless, these methods still have limitations and often fail to elucidate the complex interactions between driving factors.
With the continuous development of machine-learning techniques, an increasing number of machine-learning methods have been introduced into ecological research (Yuan et al., 2024; Zhou et al., 2024). Machine learning can flexibly fit complex non-linear relationships and offers strong explanatory power and accurate predictive abilities. Among these, the core concept of SHAP (Shapley Additive Explanations) is to break down the importance of each feature into a weighted sum of Shapley values across different feature values, while also accounting for interactions among driving factors. For example, Wieland et al. (2021) used extreme gradient boosting (XGBoost) and SHAP to analyze the complex relationships between driving factors of grassland degradation; Wang et al. (2023) integrated XGBoost and SHAP to explore the relationships between urban environmental factors (such as rainfall, subsurface conditions, and construction elements) and flood depth; Tian et al. (2024) applied the XGBoost-SHAP model to analyze the non-linear effects, thresholds, and interactions of drivers on ecosystem services. However, threshold identification in these studies mainly relied on the values of driving factors where SHAP contributions were equal to zero, lacking a clear quantitative basis. Therefore, this paper combines the constraint line method for threshold identification. The coupled XGBoost-SHAP-RCS framework provides a comprehensive perspective for studying NPP. It can analyze the non-linear effects of driving factors and accurately identify impact thresholds, offering valuable insights for regional ecological zoning and decision-making. Ecological zoning serves as an effective approach to developing regional management strategies that promote long-term ecosystem stability (Wu et al., 2018), and incorporating ecological thresholds enhances its scientific basis by helping to identify optimal areas for conservation and restoration in response to changing environmental conditions (Hong et al., 2024). Thresholds represent the boundaries at which ecological processes exhibit regime shifts or functional changes, and incorporating them into spatial zoning allows management interventions to align with ecological mechanisms rather than arbitrary administrative boundaries. Recent studies have emphasized that threshold-informed zoning can substantially improve the efficiency and precision of ecosystem conservation, resource allocation, and landscape planning by explicitly linking ecological processes with management strategies (Shao et al., 2025). Therefore, developing a threshold-based ecological zoning framework is essential for supporting long-term ecosystem stability and guiding science-based regional decision-making.
As the core area of the Three Gorges Project, Yichang plays an important role in water conservation, air purification, and biodiversity protection. Changes in vegetation in Yichang directly affect sediment deposition in the Three Gorges Reservoir, flood regulation, and biodiversity. Good vegetation restoration helps maintain the ecological functions and sustainable development of the reservoir. Moreover, vegetation plays a crucial role in shaping ecosystems, and ecological restoration projects frequently improve ecosystem services by promoting vegetation growth (Zheng et al., 2019). Understanding the trends in vegetation NPP and the threshold interactions of driving factors can support sustainable ecosystem management.
Against this backdrop, the scientific issues focused on in this paper are the construction of the XGBoost-SHAP-RCS framework and threshold identification of NPP driving factor interactions. Specifically, the main objectives of this paper are: (1) to construct the XGBoost-SHAP-RCS research framework; (2) to analyze threshold identification under the interactions of NPP driving factors; (3) to perform ecological zoning based on the thresholds and propose management recommendations.
2 Materials and methods
2.1 Research area
Yichang City, located in southwestern Hubei Province, China, is strategically situated at the confluence of the upper and middle reaches of the Yangtze River. Renowned for its association with the Three Gorges Dam and the Gezhouba Water Control Project, it is often referred to as the “World Hydropower Capital” (Figure 1). Yichang shares borders with Jingzhou to the east, Hunan Province to the south, Chong-qing to the west, and the Shennongjia Forest Area to the north. As a prominent urban within the Yangtze River Basin, Yichang has historically played a vital role in environmental management and protection. However, rapid socio-economic development has introduced significant environmental challenges, including the expansion of chemical industries along the river, water pollution, and ecological degradation.
Figure 1
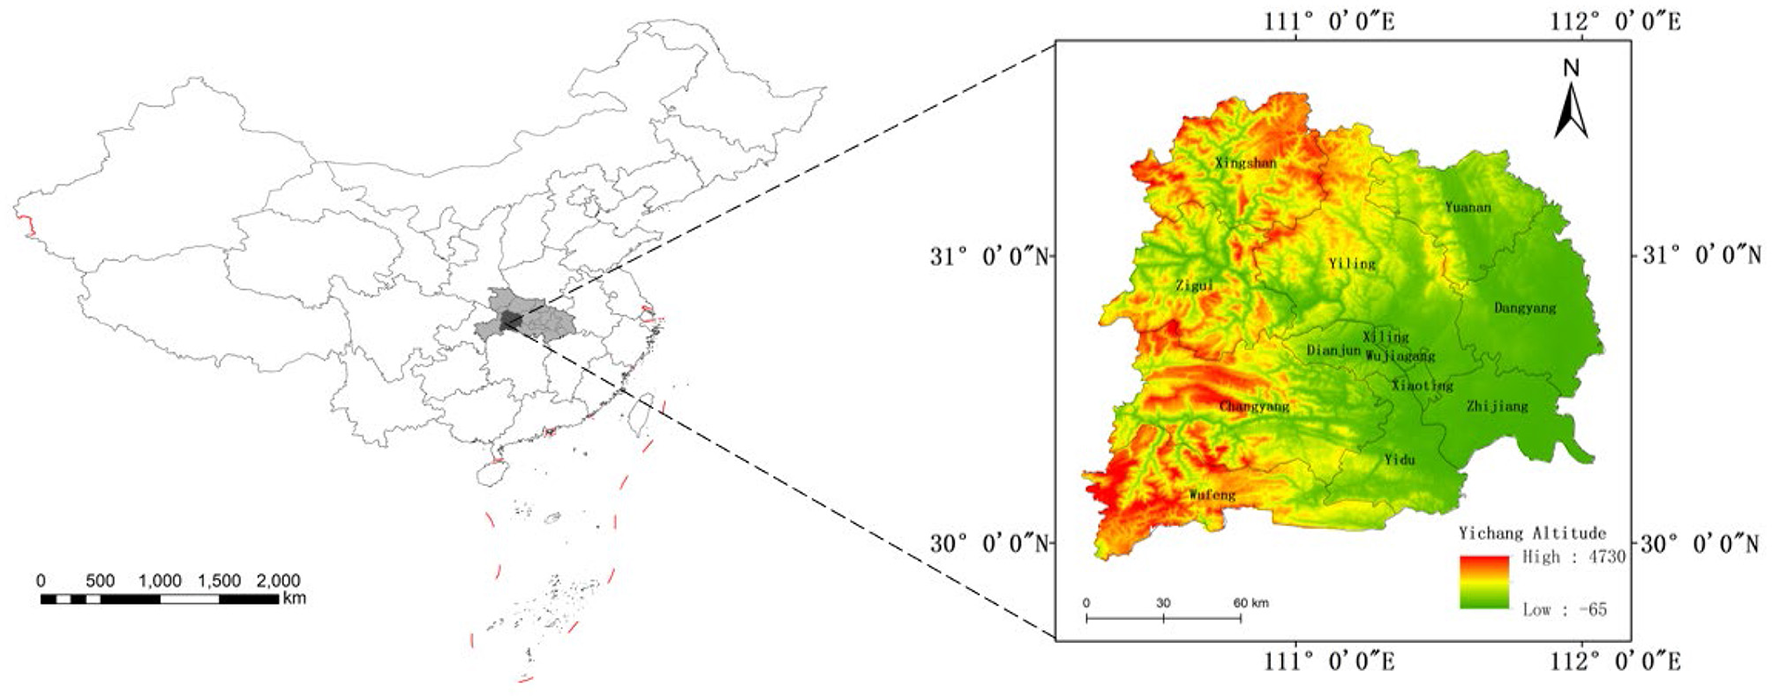
Geographical location of the study area.
2.2 Data sources
The data sources are delineated in Table 1. All spatial data were processed using ArcGIS version 10.6 and Python, with the coordinate system standardized to CGCS2000_3_Degree_GK_CM_111E and a spatial resolution of 500 m by 500 m.
Table 1
| Data name | Source of data | Data time | Data resolution | Unit (of measure) |
|---|---|---|---|---|
| NPP | GEE Platform (https://earthengine.google.com) | 2003–2023 | 500 m | g/(m2 -a) |
| Night light | 2023 | 750 m | NW/cm2/sr | |
| Temperature | 2023 | 1,000 m | °C | |
| NDVI | 2023 | 500 m | ||
| Soil organic matter | 2020 | 250 m | % | |
| DEM | Geospatial Data Cloud (https://www.gscloud.cn) | 2000 | 30 m | m |
| Precipitation | National Tibetan Plateau Science Data Center (https://data.tpdc.ac.cn) | 2023 | 1,000 m | mm |
| Road, water, housing estate | OpenStreetMap (https://www.openstreetmap.org) | 2023 |
Data source.
2.3 Methods
This study investigates the spatio-temporal evolution of NPP in Yichang from 2003 to 2023 and its driving mechanisms. An integrated framework—covering spatio-temporal analysis, driver factor modeling, and comprehensive zoningis established as shown in Figure 2.
Figure 2
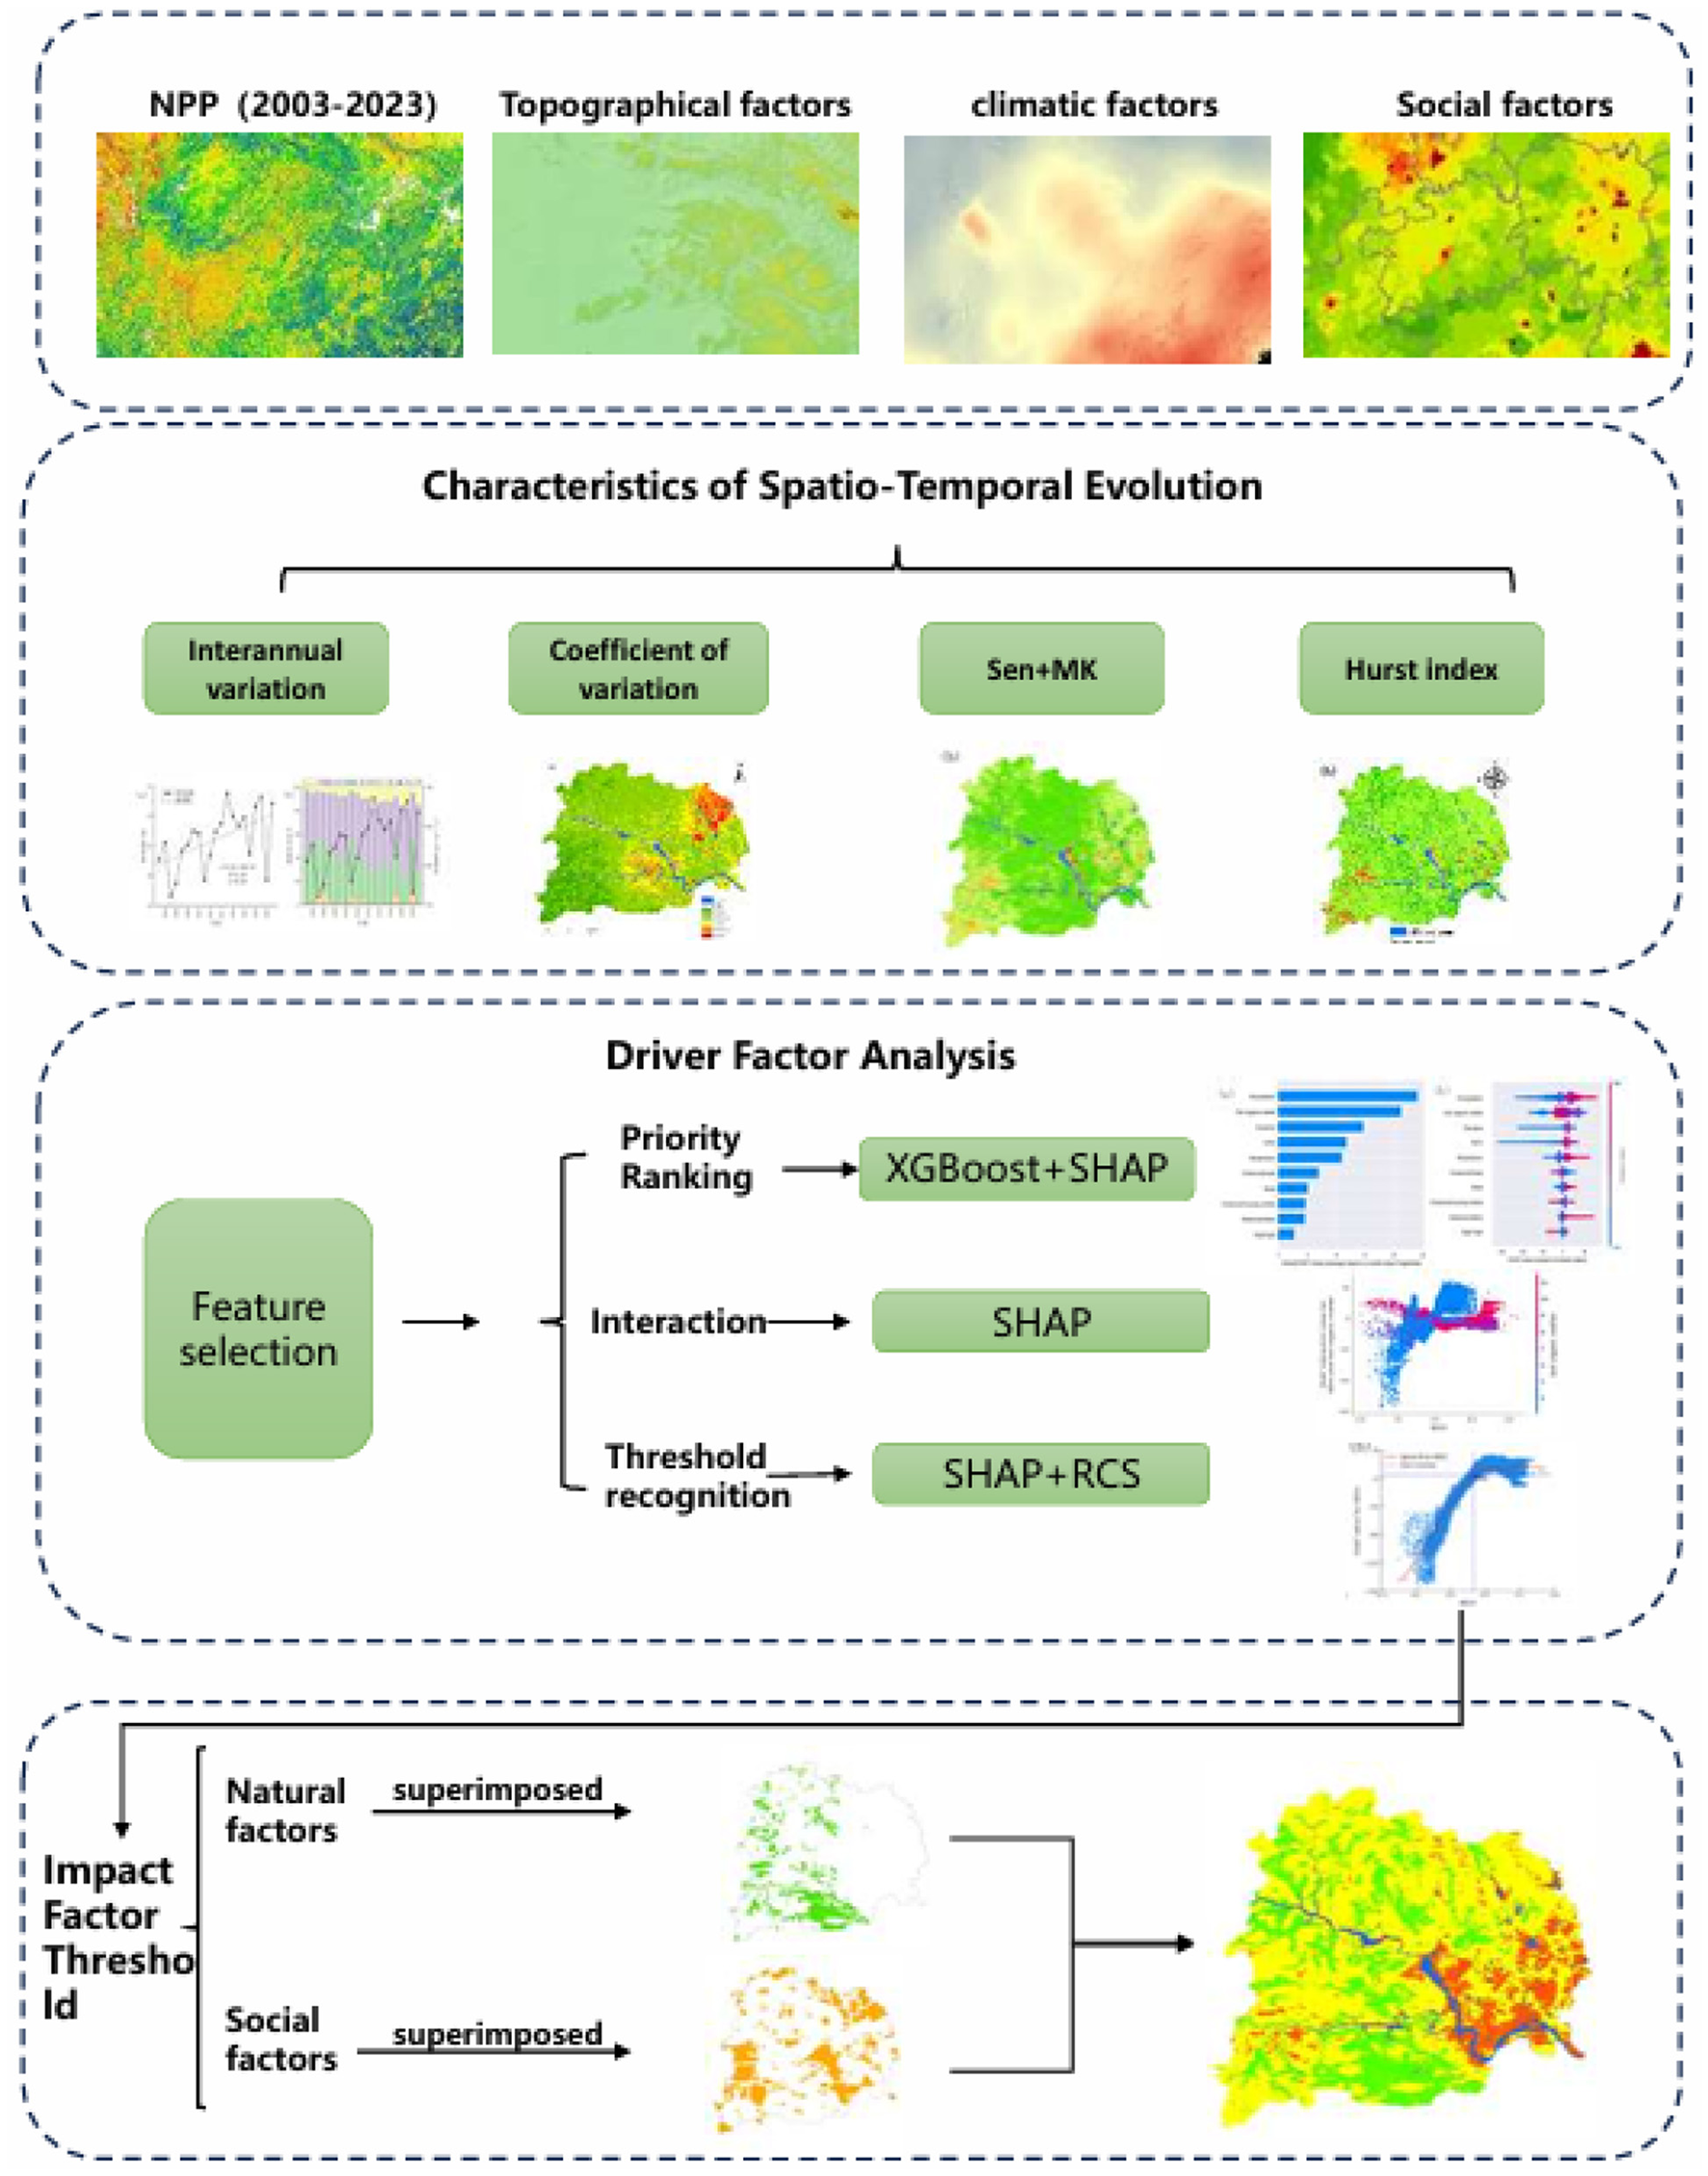
Technology roadmap.
Multi-source datasets (NPP, topography, climate, and socio-economic factors) are compiled, and NPP dynamics are characterized using interannual variation, the coefficient of variation, the Sen–MK test, and the Hurst index. The XGBoost–SHAP framework is adopted to rank driving factors, identify non-linear interactions, and detect ecological thresholds through a combined SHAP–RCS approach. Finally, thresholds of natural and social drivers are spatially mapped and overlaid to construct a threshold-based zoning scheme, providing scientific support for ecological management and regional regulation.
2.3.1 Coefficient of variation
This study evaluated NPP stability through the coefficient of variation (Cv) as a key metric, which reflects how much geographical elements vary over time (Zhang et al., 2024). The Cv is computed using the following formula:
Cv represents the coefficient of variation of NPP, while NPPi denotes the value of NPP in year i. The variable n indicates the number of years encompassed within the study period. is the mean value of NPP in 21 years. A smaller Cv signifies greater stability, whereas a larger Cv indicates reduced stability.
2.3.2 Theil-Sen trend
Theil-Sen trend analysis is a non-parametric statistical approach mainly used for detecting trends in long-term time series data (Li et al., 2022c). The formula for its calculation is as follows:
Where: median is the median function, when β > 0, the sequence exhibits an upward trend; conversely, when β < 0, the sequence demonstrates a downward trend. In this context, NPPi and NPPj represent the NPP values corresponding to the time series at indices i and j, respectively.
2.3.3 Mann-Kendall test
The Mann-Kendall test is a robust statistical method for testing trends within time series data (Long et al., 2024). This method does not rely on specific distributional assumptions, making it less sensitive to outliers, while the statistic Z serves as a measure of change in the time series. The formula is as follows:
Where: Z is the standardized statistic; NPPi and NPPj are the NPP values of time series numbers i and j, respectively, and n is the number of time series data; sgn denotes the sign function. The statistic S is approximately normally distributed when n ≥ 8, and V(S) denotes the variance of the S statistic. The significance of the change in sequence values can be judged at a given significance level when |Z|>1.96 and |Z|>1.65, which means that the change trend passes the significance test at the 0.05 and 0.1 confidence level, respectively.
2.3.4 Hurst index
The Hurst index measures the persistence of time series data and is often used to predict future trends in NPP (Hurst, 1956). It is commonly calculated using the R/S analysis method, with the index value ranging from 0 to 1. The interpretation of the Hurst index is as follows: Hurst index < 0.5 indicates an anti-persistent trend, where smaller values closer to 0 signify stronger anti-persistence; Hurst index = 0.5 implies a random process where future trends are independent of the past; Hurst index >0.5 denotes a persistent trend, with values closer to 1 indicating stronger continuity. Detailed formulae for calculating the Hurst index are provided in the literature (Ba et al., 2023).
2.3.5 Leshy algorithm
Leshy algorithm is an advanced version of Boruta's algorithm, designed for feature selection (Ahmadpour et al., 2021). Its fundamental principle involves generating shadow features and combining them with the original features to construct a feature matrix. The importance scores of the shadow features serve as a benchmark, enabling the identification of original features with greater importance than the shadow features, thereby forming the selected feature set. This study utilizes the afrs package in Python to perform feature screening.
2.3.6 XGBoost algorithm
This study employs the XGBoost algorithm as the foundation for regression analysis, incorporating the SHAP model for interpretability (Chen and Guestrin, 2016). XGBoost is an improved variant of the traditional gradient-boosting decision tree algorithm. It builds a robust predictive model by integrating multiple weak classifiers, namely decision trees. Each tree is trained on the residuals of the previous one, progressively minimizing them through iterative optimization of the loss function. The algorithm effectively handles non-linear relationships between variables and targets, offering high predictive accuracy (Jia et al., 2024).
In this study, the XGBoost model was configured with the following key hyperparameters: max_depth = 4, learning_rate = 0.05, and n_estimators = 150, which were selected based on model performance and computational efficiency. Under this configuration, R2 = 0.4498 and a root mean square error of RMSE = 87.1896.
2.3.7 SHAP model
The SHAP model, introduced by Lundberg and Lee (2017), improves the interpretability of categorical regression models. Its core concept is to break down the importance of each feature into a weighted sum of Shapley values associated with different feature values (Molnar et al., 2020). The calculations are as follows:
where xi represents the i-th sample, xij denotes the j-th feature of the i-th sample, mcij indicates the marginal contribution of the feature, wj refers to the weights of the edges, and f(xi) signifies the SHAP value of the sample xij. The prediction for the sample is presented as yi, and ymean represents the mean of the target variable across all samples.
A positive f(xij) indicates that the feature contributes positively to the prediction, playing a supportive role, while a negative f(xij) suggests that the feature detracts from the prediction, having a negative impact. SHAP values are visually represented through graphs that illustrate the positive or negative influence of each feature on the prediction outcomes.
2.3.8 RCS
RCS are commonly utilized to model non-linear relationships between independent and dependent variables (Yang et al., 2024). RCS can be described as a segmented polynomial; however, it is essential that the spline maintains continuity and possesses a second-order derivative at each node to ensure the smoothness of the curve. As a result, RCS involves greater complexity than simply fitting a cubic polynomial at each node, requiring the incorporation of additional constraints to guarantee that the resulting spline curve is both continuous and smooth. In the current study, RCS was implemented using the scikit-learn library in Python, with the independent variable designated as the driving factor and its SHAP value as the dependent variable. To identify non-linear thresholds, we integrated SHAP values with RCS (SHAP–RCS). The workflow involved: (1) fitting RCS curves to characterize the non-linear response of each factor; and (2) detecting ecological thresholds at inflection points where the SHAP response changed in direction or magnitude, particularly at intersections between the RCS curve and the SHAP = 0 line.
Additionally, the placement of spline knots was primarily guided by the distribution of SHAP values, which reflect the contribution and non-linear response patterns of each driving factor. This approach ensures that the RCS model accurately captures the key transitions and thresholds in the relationship between predictors and their SHAP-derived effects.
3 Results
3.1 The characteristics of NPP's spatiotemporal variation
3.1.1 The temporal variation of vegetation NPP
The total and mean vegetation NPP in Yichang City exhibited a fluctuating upward trend throughout the study period. As illustrated in Figure 3a, the total vegetation NPP in Yichang varied between 45.94 and 56.28 TgC (where 1 TgC = 1012 gC), with an annual average growth rate of 0.25 TgC per annum and a multi-year mean of 51.65 TgC. The coefficient of variation was calculated to be 0.06, suggesting that the fluctuations in NPP were relatively minor. Figure 3b indicates that the annual mean NPP ranged from 560.26 to 685.97 gC/(m2·a), with a multi-year mean of 628.63 gC/(m2·a). In terms of classification, from 2003 to 2023, Yichang's NPP predominantly fell within the range of 400 to 800 gC/(m2·a). Over time, the proportion of NPP values exceeding 600 gC/(m2·a) demonstrated a rising trend, whereas the proportions of the other two categories exhibited a decline.
Figure 3
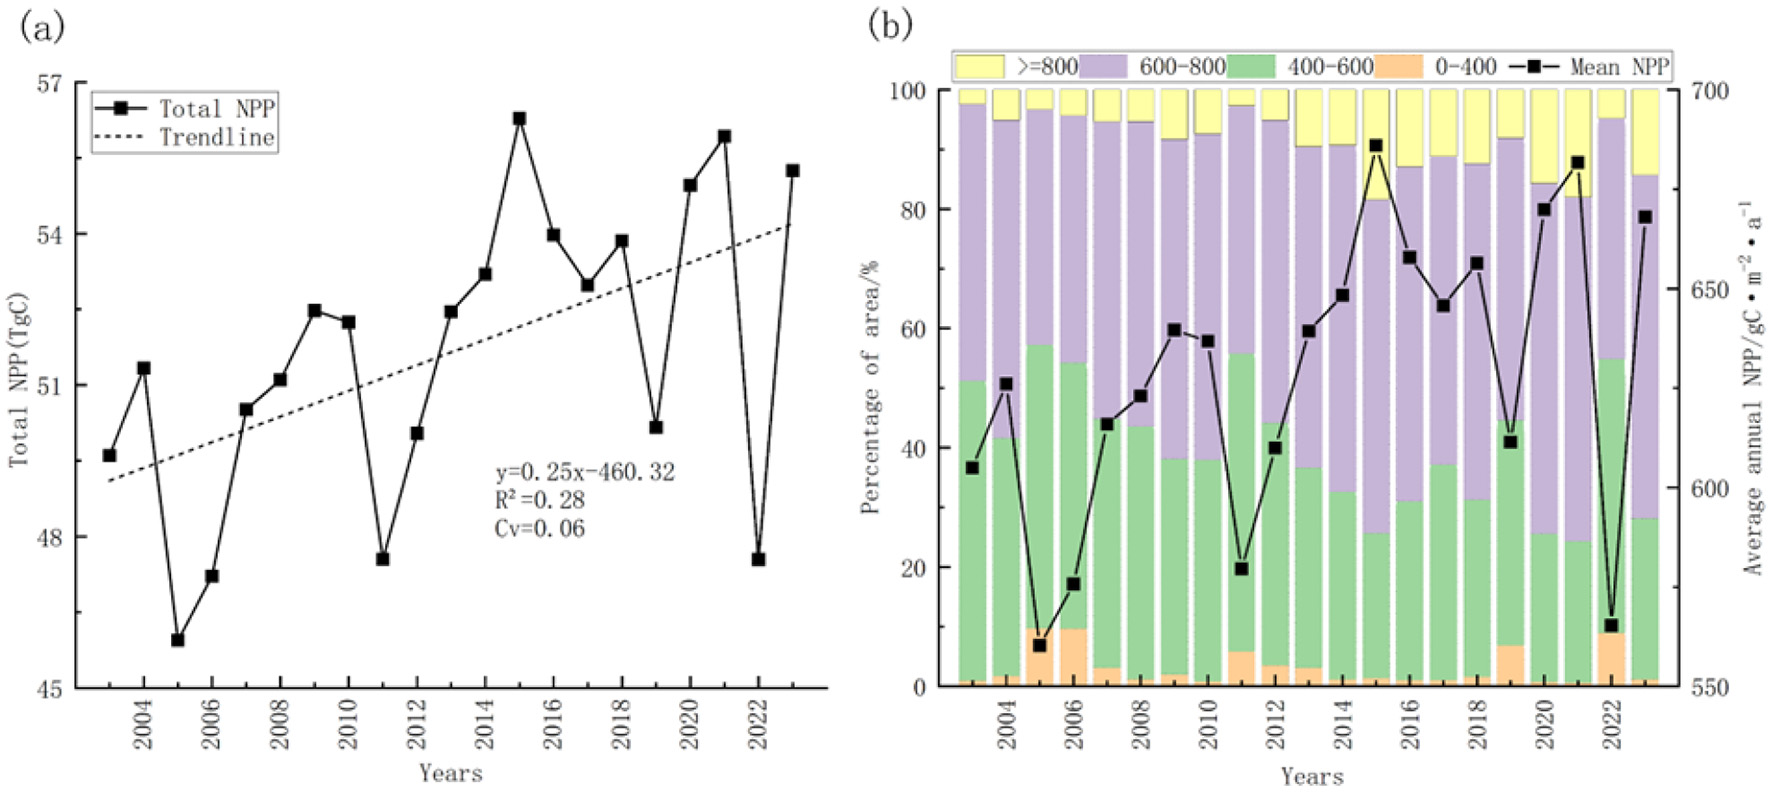
Inter-annual fluctuations in total net primary productivity (NPP) (a) and yearly mean NPP (b) in Yichang City from 2003 to 2023.
3.1.2 Spatial distribution and coefficient of variation (Cv) of vegetation NPP
As shown in Figure 4a, the annual mean NPP of Yichang City exhibits a clear spatial distribution, with higher values in the western region and lower values in the eastern region. The NPP in the western mountainous areas gener-ally surpasses that of the eastern plains. Notably, regions such as Wufeng, XingShan, ChangYang, and Zigui feature relatively high NPP, with most regions exceeding 600 gC/(m2·a). In contrast, the eastern areas, including Zhijiang and Dangyang, primarily consist of cultivated land, where NPP typically ranges from 400 to 600 gC/(m2·a). Furthermore, urbanized and smaller northeastern regions exhibit NPP values lower than 400 gC/(m2·a). Throughout the study period, Yichang City's average NPP was 627.91 gC/(m2·a), significantly higher than the national average of 325 gC/(m2·a) for China between 2000 and 2022 (Li et al., 2023). This suggests that Yichang City's ecological environment is relatively favorable.
Figure 4
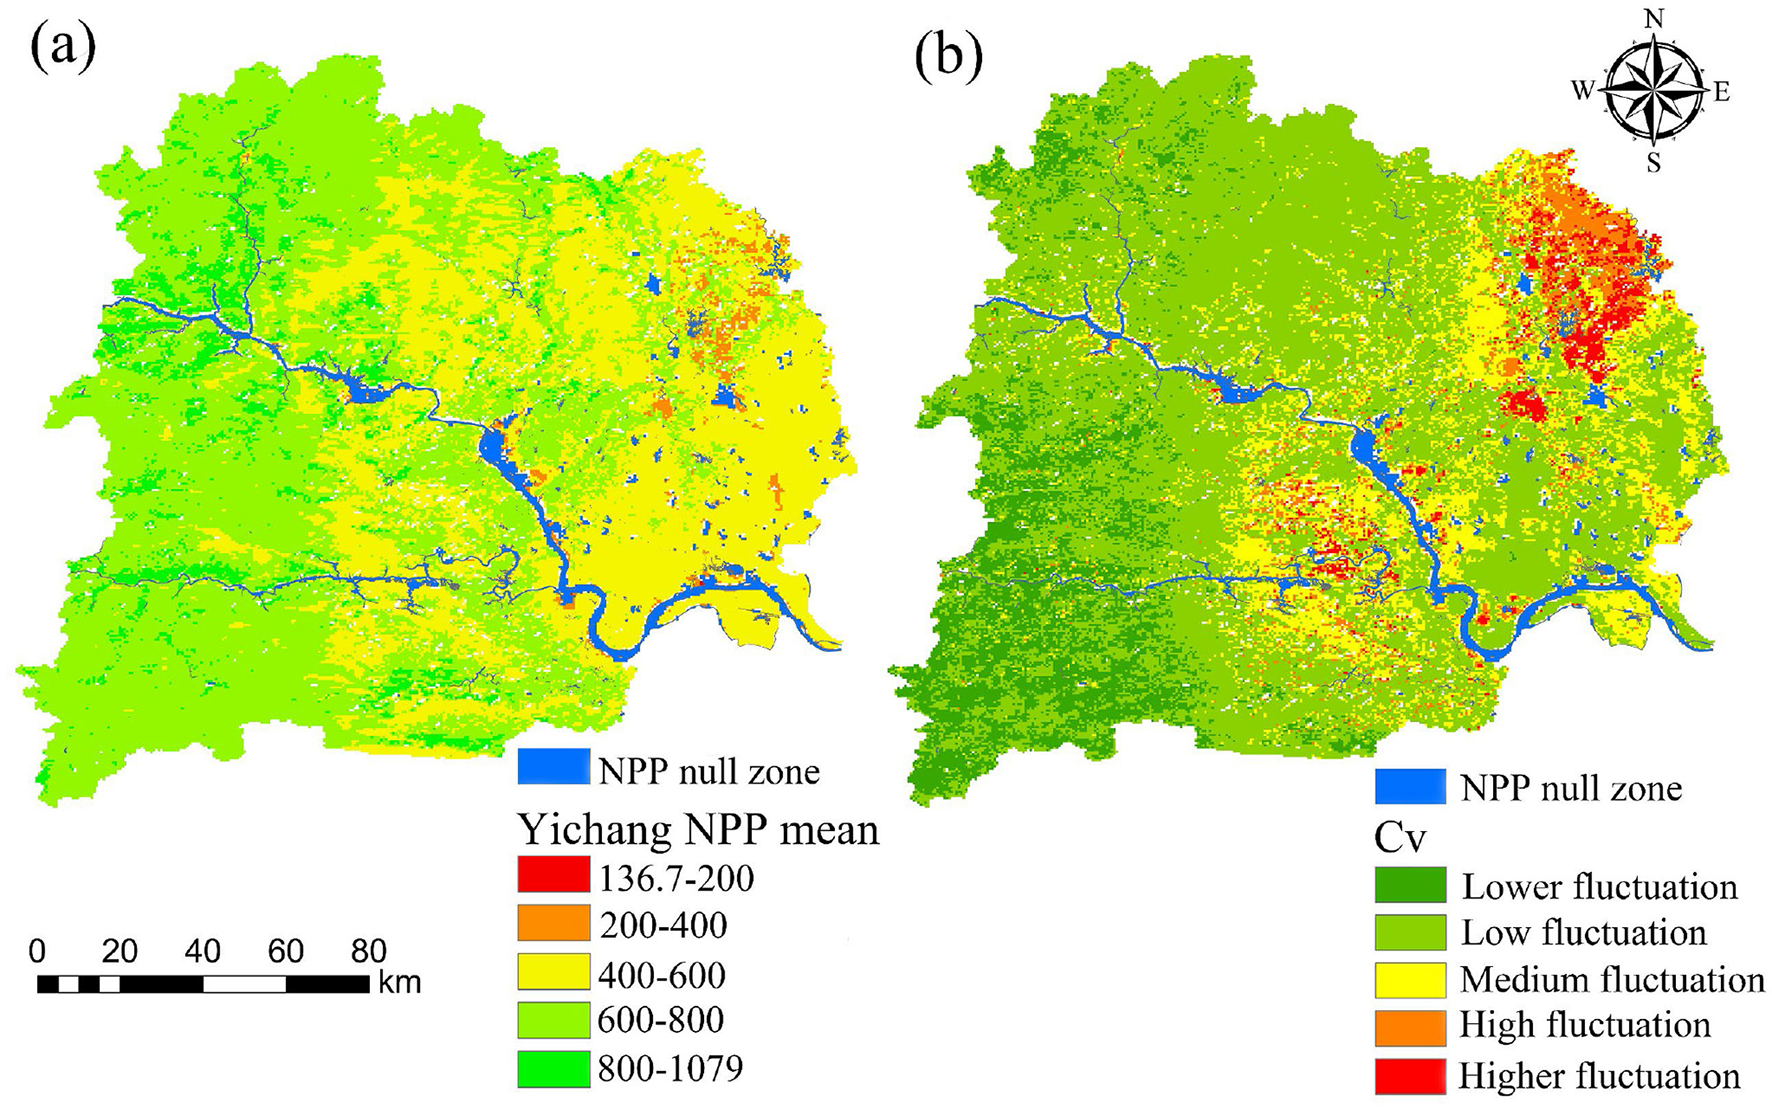
Spatial distribution of NPP mean (a) and coefficient of variation of NPP (b) in Yichang from 2003 to 2023.
Figure 4b shows that the coefficient of variation (Cv) for vegetation NPP in Yichang City varied between 0.02 and 0.61, with an average of 0.08, reflecting stable NPP variation at the pixel level. Areas with low fluctuation and lower fluctuation (Cv ≤ 0.1) accounted for a total of 75.3%, mainly in southeastern Yichang. Regions with medium fluctuation (0.1 < Cv ≤ 0.15) were scattered, accounting for 17.6% of the total area. Areas with high fluctuation (Cv > 0.2), mainly distributed in the central and northeastern parts, accounting for 7.2% of the total area, were influenced by stronger anthropogenic activities and exhibited more significant NPP changes.
3.1.3 The trend and significance of NPP change
As illustrated in Figure 5 and Table 2, the Sen-MK trend analysis classifies the changes in NPP across Yichang City into seven distinct categories. From 2003 to 2023, more than 94.5% of the city's area exhibited an increasing trend in NPP, while only 5.5% demonstrated a decreasing trend, indicating a sustained improvement in vegetation over the past 21 years. Specifically, 52.6% of the area experienced a significant increase in NPP, 12.1% showed a slight increase, and 29.8% exhibited no significant change. These shifts can be attributed to the ongoing ecological protection measures in Yichang City and growing public awareness of environmental issues. The regions displaying a decreasing trend are predominantly located in the eastern and western high-altitude areas. The eastern region, primarily consisting of urban and agricultural land, is heavily influenced by human activities, leading to a decline in NPP. In contrast, the western region, with its higher elevations and cooler temperatures, provides less favorable conditions for vegetation growth.
Figure 5
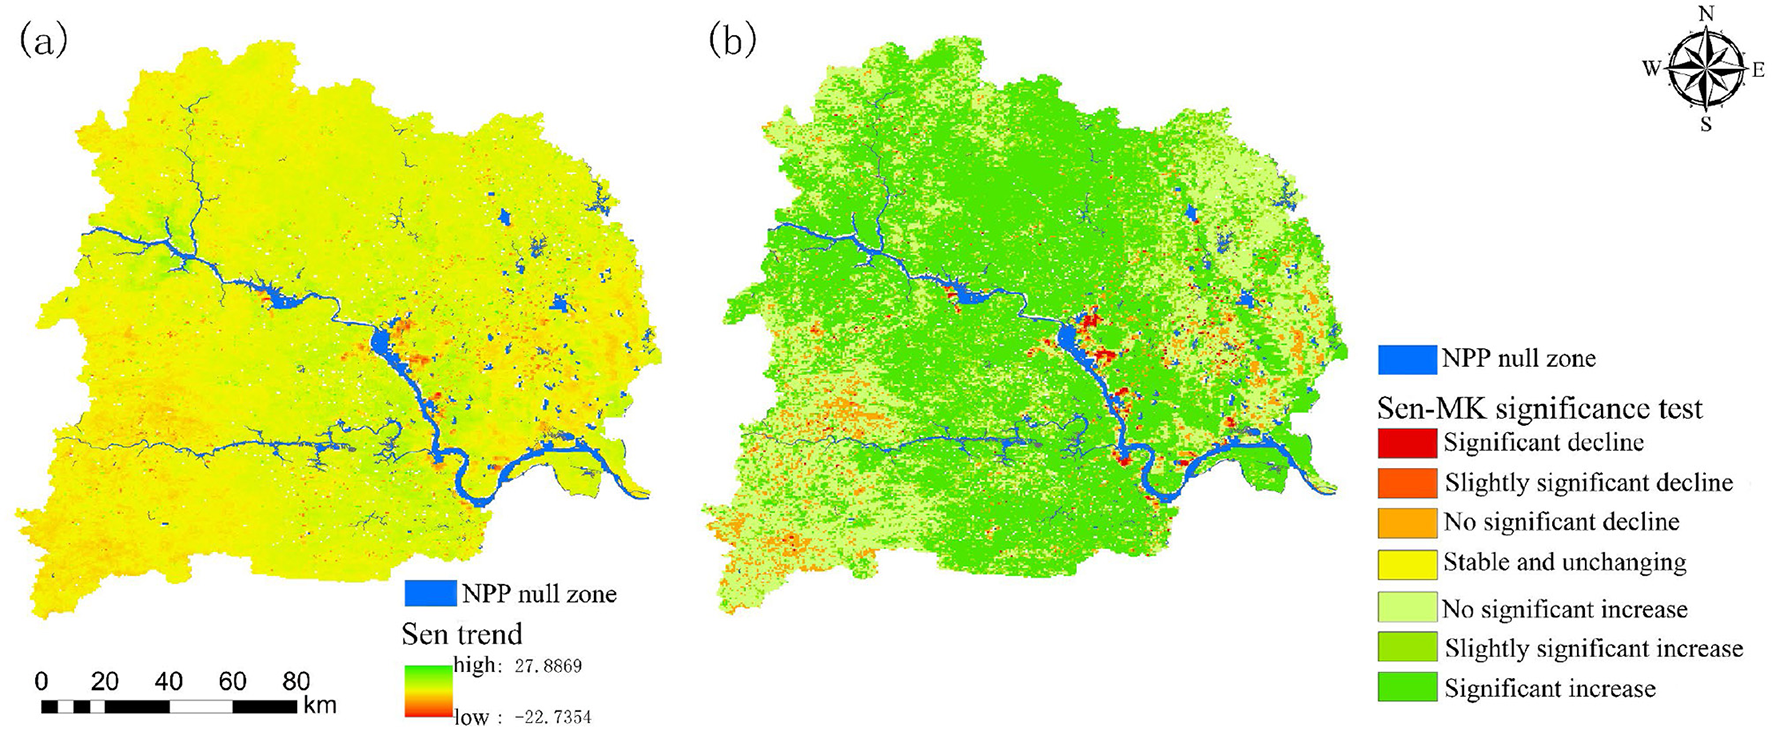
Temporal and spatial variation trends (a) and Sen-MK significance test (b) of vegetation NPP in Yichang City from 2003 to 2023.
Table 2
| β value | |Z| value | Changes in NPP trends | Percentage of area (%) |
|---|---|---|---|
| >0 | ≥1.96 | Significant increase | 52.6 |
| 1.65–1.96 | Slightly significant increase | 12.1 | |
| 0–1.65 | No significant increase | 29.8 | |
| =0 | =0 | Stable and unchanging | 0 |
| < 0 | 1.65–0 | No significant decrease | 4.7 |
| 1.65–1.96 | Slightly significant decrease | 0.3 | |
| ≤ 1.96 | Significant decrease | 0.5 |
Statistics of change trend of NPP.
3.1.4 Prediction of NPP change trend
The Hurst index of NPP in Yichang City from 2003 to 2023 ranges from 0.13 and 0.86, with a mean value of 0.44. The Hurst index is divided into four categories: strong anti-persistence (0 < H ≤ 0.2), weak anti-persistence (0.2 < H ≤ 0.5), weak persistence (0.5 < H ≤ 0.7), and strong persistence (H > 0.7), as illustrated in Figure 6a. The results indicate that 78% of the total area exhibits anti-persistence (H < 0.5), while 22% shows persistence (H > 0.5). This indicates that future NPP in Yichang City is likely to predominantly exhibit anti-persistence, meaning that nearly 80% of areas may experience reversals in the future.
Figure 6
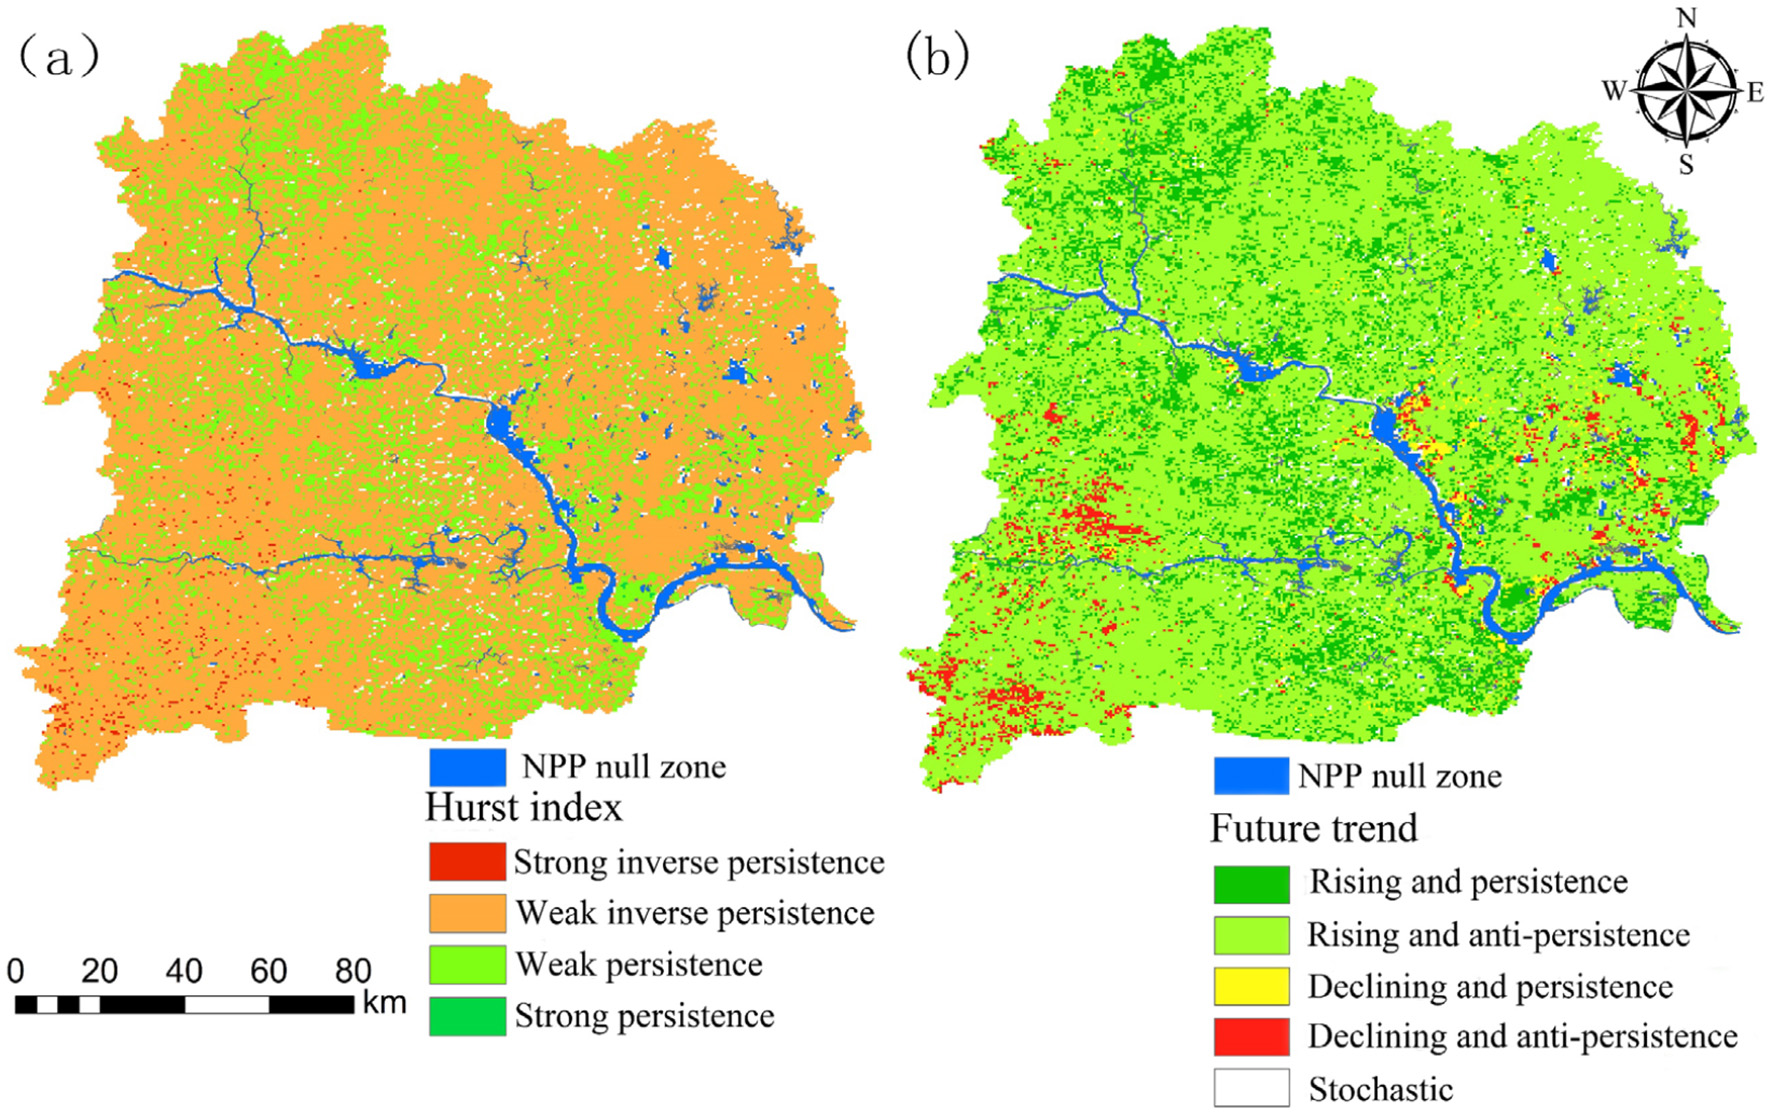
Persistence characteristics based on Hurst index (a) and the future trend of vegetation NPP (b) in Yichang City from 2003 to 2023.
As shown in Figure 6b and Table 3, when combining the trend test results with the Hurst index, it is found that the future trend of NPP in Yichang City is mainly characterized by rising and anti-persistent trends, accounting for 71% of the total area. This suggests that the past upward trends in these areas may be difficult to sustain in the future. Areas with rising and persistent trends account for 17.9% of the area and are scattered across different locations. Declining and persistent areas are relatively few, primarily located near urban zones. To prevent further degradation, environmental protection efforts should be strengthened in the rising and anti-persistent areas, as well as in the declining and persistent areas.
Table 3
| Hurst Index | β value | Changes in future trends | Percentage of area (%) |
|---|---|---|---|
| >0.5 | >0 | Rising and persistent | 17.9 |
| < 0.5 | >0 | Rising and anti-persistent | 71 |
| >0.5 | < 0 | Declining and persistent | 2 |
| < 0.5 | < 0 | Declining and anti-persistent | 3 |
| = 0.5 | Stochastic | 5.1 |
Statistics of the future trend of NPP in Yichang.
3.2 NPP driver analysis
3.2.1 Screening of NPP driving factors
The study considered seven natural driving factors: precipitation, soil organic matter content, NDVI, elevation, temperature, distance to water bodies, and slope. Additionally, three anthropogenic factors were included: distance to roads, distance to the housing estates, and night-time light intensity. These factors were used as inputs for the Leshy algorithm, with NPP serving as the output variable. The model utilized a total of 79,513 samples. Screening through the Leshy algorithm confirmed that all selected drivers met the criteria for inclusion in the analysis.
3.2.2 Importance analysis of NPP driving factors
The feature importance assessment was conducted utilizing the XGBoost and SHAP models, as illustrated in Figure 7a. The ranking of feature importance is as follows: precipitation > soil organic matter content > NDVI > elevation > temperature > distance to roads > distance to water bodies > slope > distance to the housing estates > night-time light intensity. Precipitation emerges as the most significant driver of NPP in Yichang City, accounting for nearly 30% of the total influence, followed by soil organic matter content at over 20%. Elevation, NDVI, and temperature each contribute more than 10%, while the remaining factors each account for less than 10%.
Figure 7
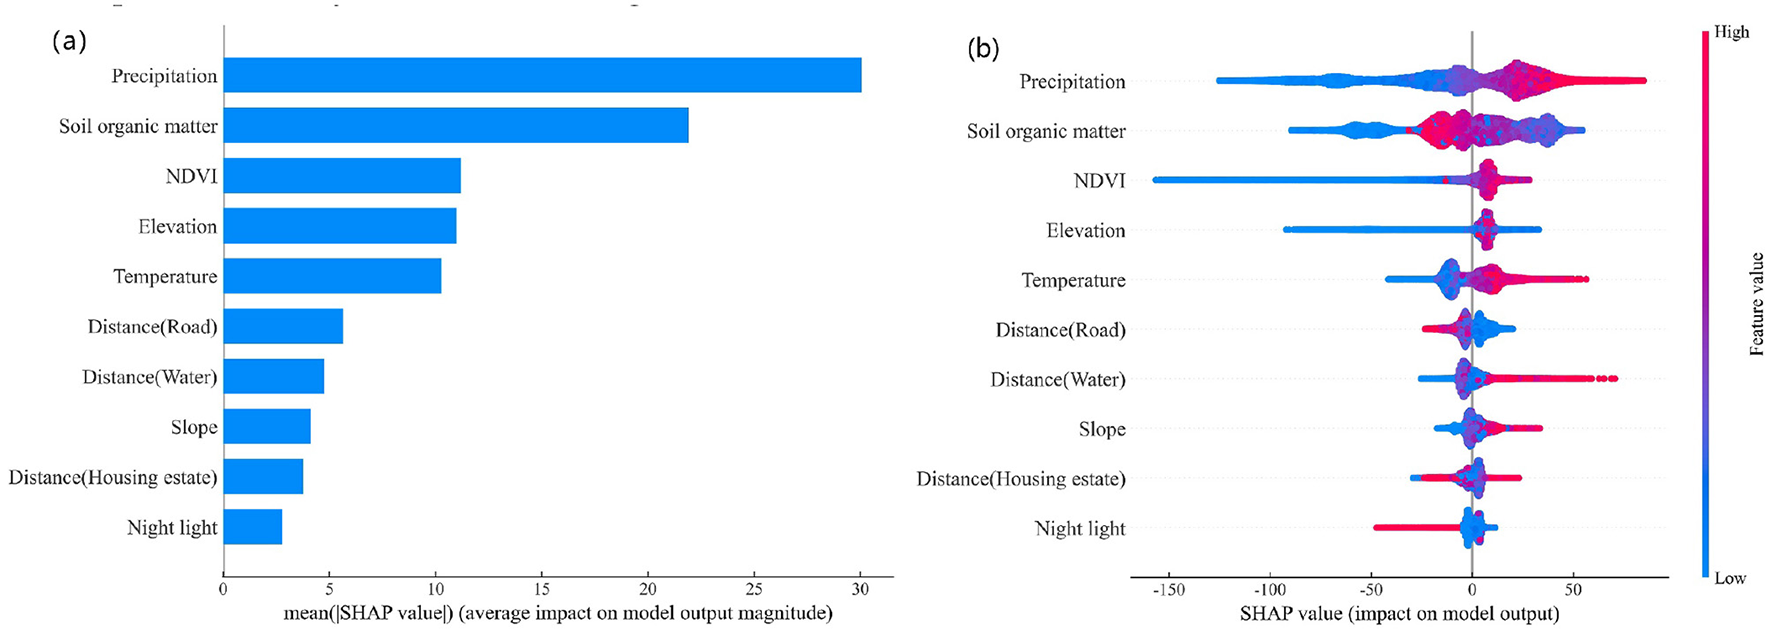
Feature importance (a) and summary plot (b) of the XGBoost model based on SHAP values.
Figure 7b presents a SHAP summary plot, where each point represents an individual sample. The color gradient, ranging from blue to red, signifies low to high feature values, while the x-axis displays the SHAP values associated with the driving factors. Higher SHAP values correspond to a more substantial influence of the feature on the prediction for a given sample. Positive SHAP values indicate a beneficial effect on NPP predictions, whereas negative SHAP values imply a detrimental impact. As the values of precipitation, NDVI, temperature, and slope increase, their respective SHAP values also increase, transitioning their influence on NPP predictions from negative to positive. In contrast, features such as distance to roads and night-time light intensity show a decreasing trend in SHAP values as their feature values increase. Other driving fac-tors, such as elevation, soil organic matter content, distance to housing estates, and distance to water bodies, exhibit more complex interactions with SHAP values. For instance, elevation displays both low and high values beyond SHAP = 0, while soil organic matter content, distance to housing estates, and distance to water bodies show both low and high values on both sides of SHAP = 0. In summary, all driving factors exhibit a change in their influence at SHAP = 0. How-ever, the corresponding values of these driving factors span a range rather than being singular. To refine the analysis, RCS was applied to model the distribution curves of each driving factor against their SHAP values. The threshold for each driving factor's influence was determined as the value corresponding to SHAP = 0 on the fitted curve.
3.2.3 NPP driving factors interaction analysis
To investigate the interactions among various driving factors, SHAP was used to analyse the relationships between the five most significant factors, as illustrated in Figure 8. The interaction between precipitation and soil organic matter content reveals that, in regions with low precipitation, increasing soil organic matter content intensifies negative impacts while reducing positive ones. Conversely, in areas with high precipitation, both positive and negative impacts diminish, ultimately converging toward zero. Regarding precipitation and NDVI, in low-precipitation regions, increasing NDVI generally shifts interactions from positive to negative. Conversely, an opposite trend is observed in high-precipitation areas. The interactions between precipitation and elevation decrease with increasing elevation in low-altitude regions with low precipitation. However, in high-altitude areas with high precipitation, interactions shift from positive to negative. From the interaction between precipitation and temperature, areas receiving less than 1,100 mm of precipitation predominantly exhibit negative impacts as temperature rises. Between 1,100 mm and 1,300 mm of precipitation, interactions transition from negative to positive, and remain positive for precipitation levels above 1,300 mm. Interactions between soil organic matter content and NDVI indicate that increasing NDVI mitigates negative impacts and amplifies positive impacts in areas with low soil organic matter. In regions with high soil organic matter, more complex patterns emerge, shifting from positive to negative and back to positive. The interaction between soil organic matter and elevation is predominantly negative in areas with high soil organic matter content and positive in those with low content, with effects stabilizing as values increase. For NDVI and elevation, increasing elevation reduces both positive and negative impacts in areas with high and low NDVI. Interactions between NDVI and temperature are largely negative in low-NDVI areas, while remaining stable in high-NDVI areas as temperature increases. In the interactions involving soil organic matter content and elevation with temperature, regions with higher temperatures are dominated by negative effects when these two factors are at lower values, while positive effects prevail at higher values. Conversely, in cooler regions with higher soil organic matter content and elevation, inter-actions between elevation and temperature primarily exhibit negative effects. For soil organic matter content and temperature, interactions shift from positive to negative as soil organic matter content decreases.
Figure 8
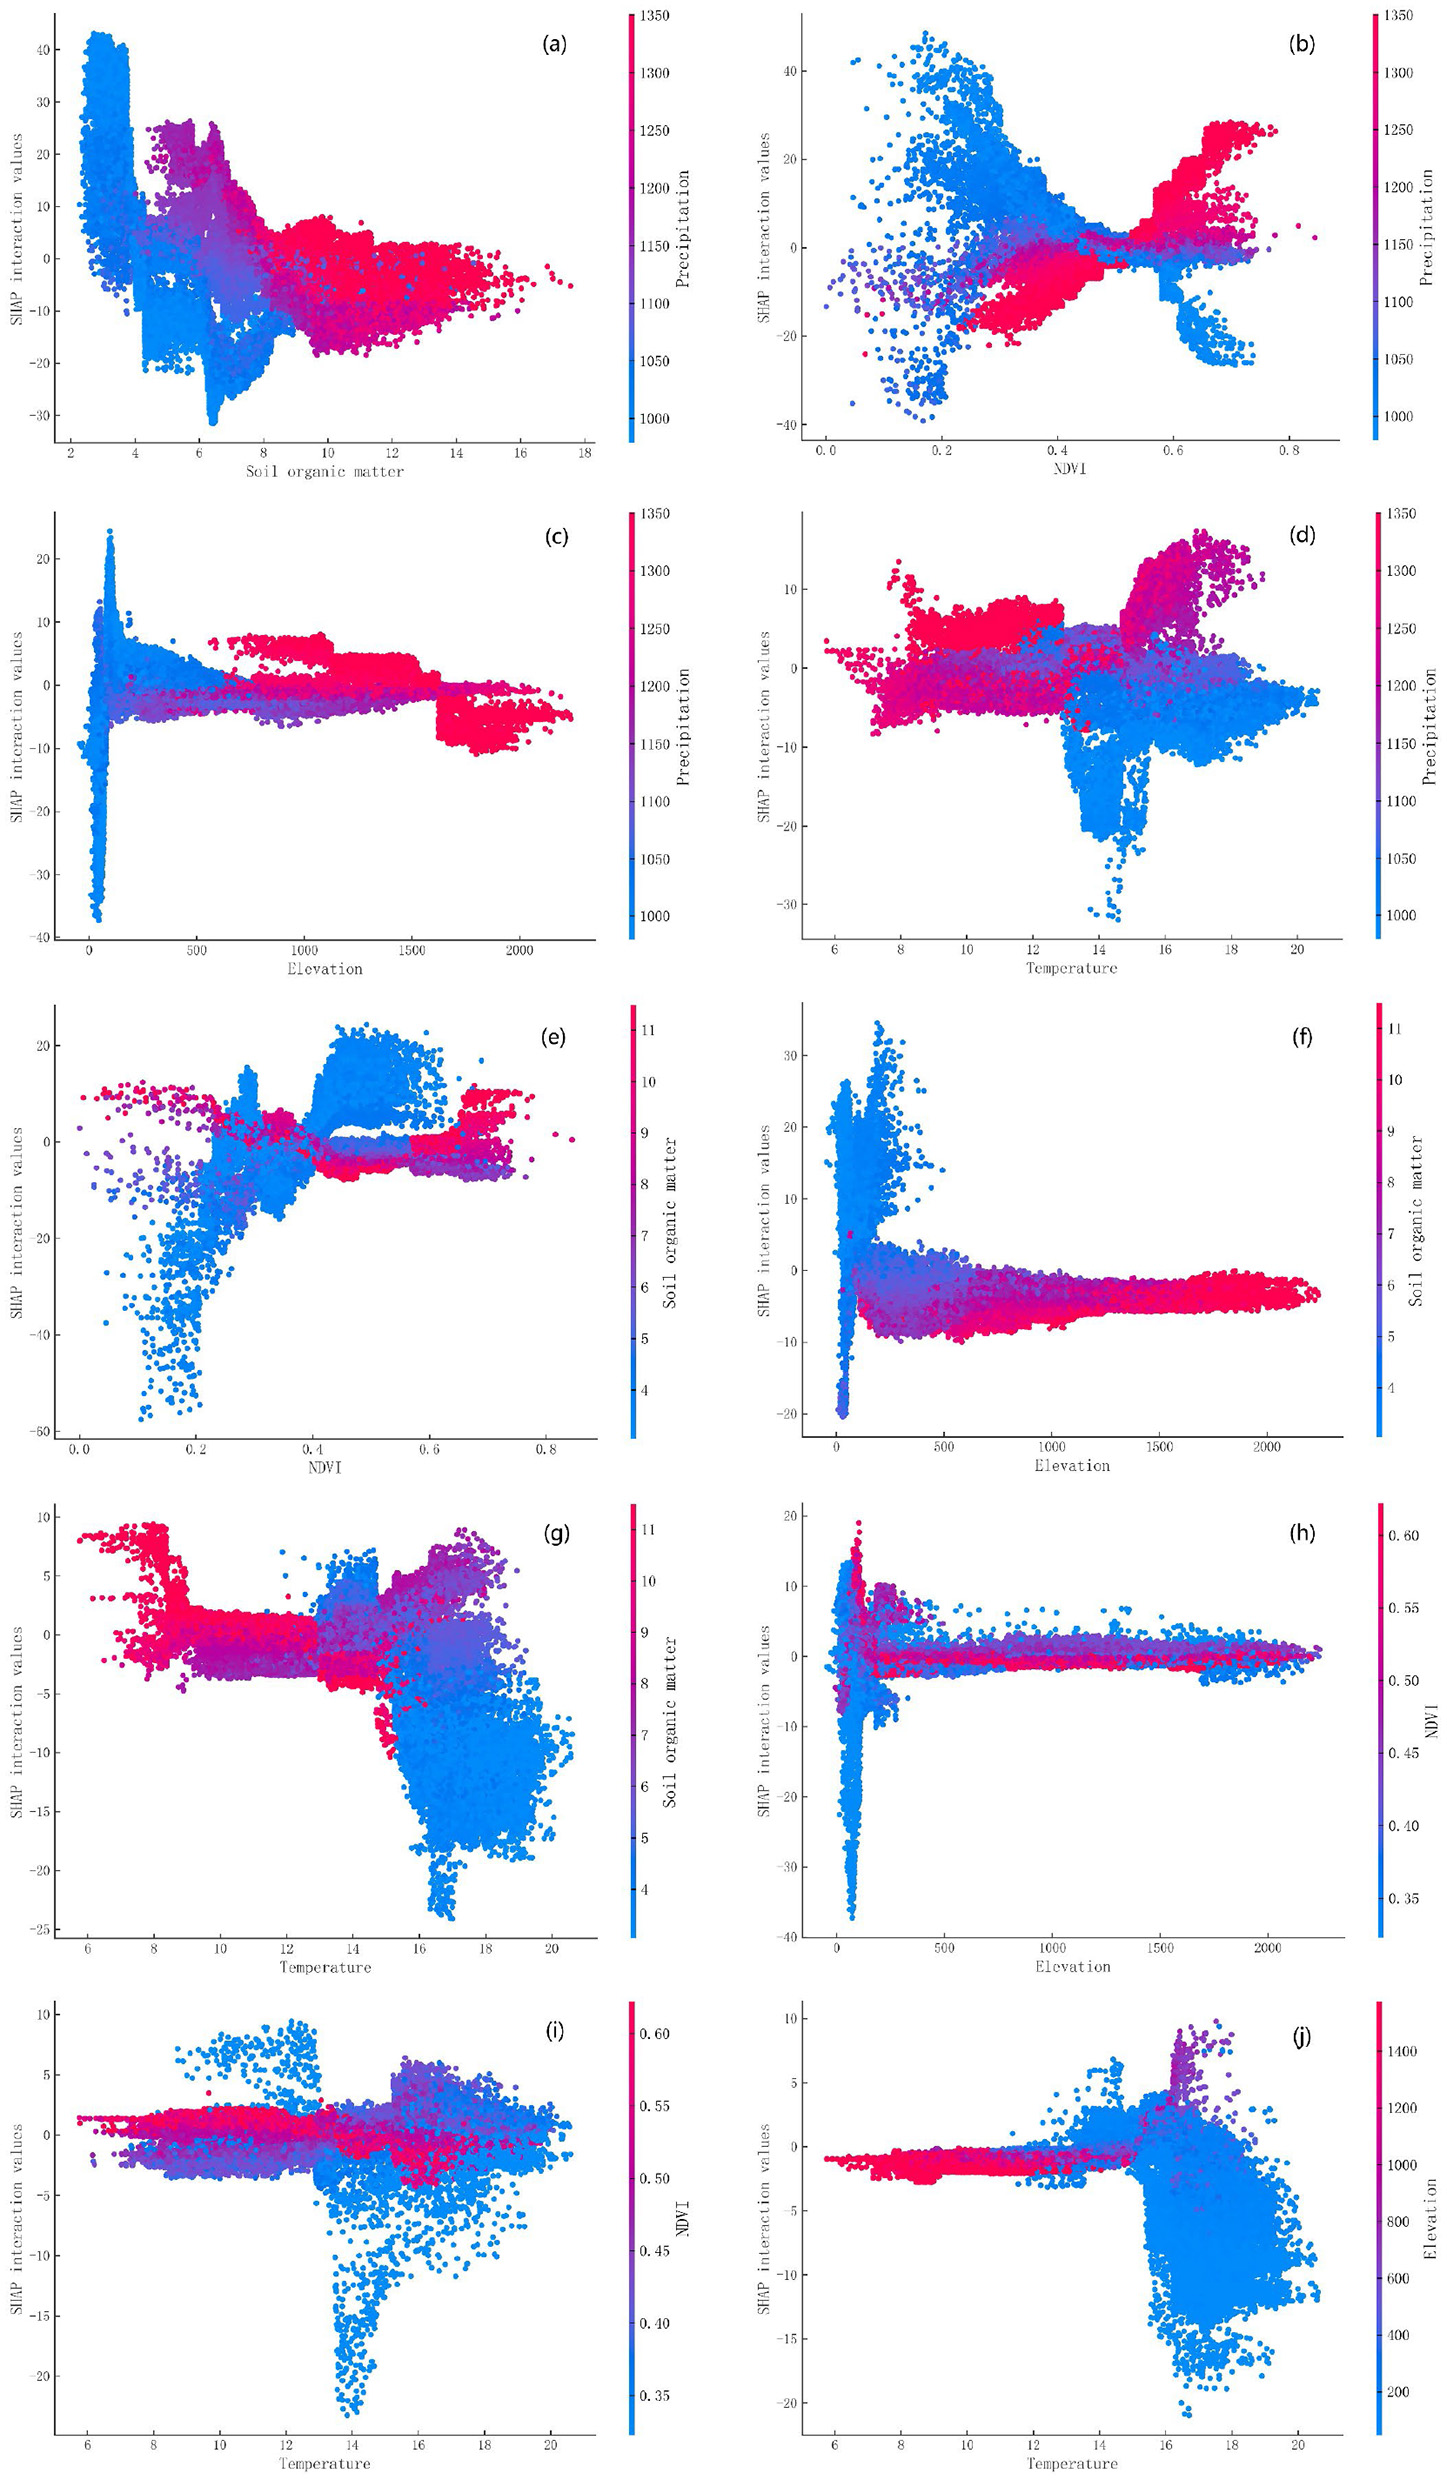
Interaction of top five ranked importance of NPP drivers (a–j).
In summary, significant interactions exist among the driving factors of NPP in Yichang City. These interactions should be carefully considered when determining the thresholds of driving factors affecting NPP.
3.2.4 Threshold analysis of NPP drivers
The SHAP dependence plot was fitted using RCS to determine the thresholds for each driving factor, as shown in Figure 9. The threshold for precipitation was 1103.77 mm (Figure 9a); beyond this value, increased rainfall enhanced its positive effect on vegetation NPP. For NDVI, the threshold was 0.44 (Figure 9b), where values below 0.44 showed a negative effect, while values above it exhibited a positive effect. This phenomenon was the result of multiple drivers, such as low NDVI regions interacting with soil organic matter content, elevation, and temperature (Figure 8), which predominantly exhibited negative effects. The thresholds for soil organic matter content were identified as 4% and 8.31% (Figure 9c). A positive effect was observed within this range, while levels below or above these values displayed negative impacts. The reason for this may be that in areas with lower soil organic matter content, the interaction with NDVI and temperature predominantly has a negative effect, while excessively high soil organic matter content may lead to salt accumulation, adversely affecting plant growth. Similarly, the distance to water had thresholds of 1.65 km and 8.91 km (Figure 9d). Between these distances, NPP was mainly inhibited, while proximity to water supported vegetation growth by providing adequate hydration. The slope threshold was determined to be 7.24° (Figure 9e). Beyond this value, the slope had a positive effect on the NPP, as gentler terrain is often associated with cultivated or developed land where human activities exert greater influence. For temperature, the threshold was 13.71 °C (Figure 9f), with values above this positively influencing NPP, while lower temperatures inhibited vegetation activity. The thresholds for distance to housing estates were 4.1 km and 16.7 km (Figure 9j). Within this range, NPP was positively influenced, whereas settlements located too close may reduce NPP due to resource over-utilization, pollution, or other disturbances, while greater distances may reflect interactions with other influencing factors. Elevation threshold was 129.99 m (Figure 9h), with values above this level promoting NPP. Higher elevations generally experience reduced human activities, leading to increased vegetation cover and higher NPP. The distance to roads showed a threshold of 1.11 km (Figure 9i), with values below this positively affecting NPP. Vegetation near roads is often maintained through regular pruning, weed removal, and pest control, reducing resistance to vegetation growth. Night-time light intensity exhibited a threshold of 1.55 (Figure 9j), where lower lighting intensity positively influenced NPP, while lower intensity indicated less human activity, which minimizes negative impacts on vegetation growth.
Figure 9
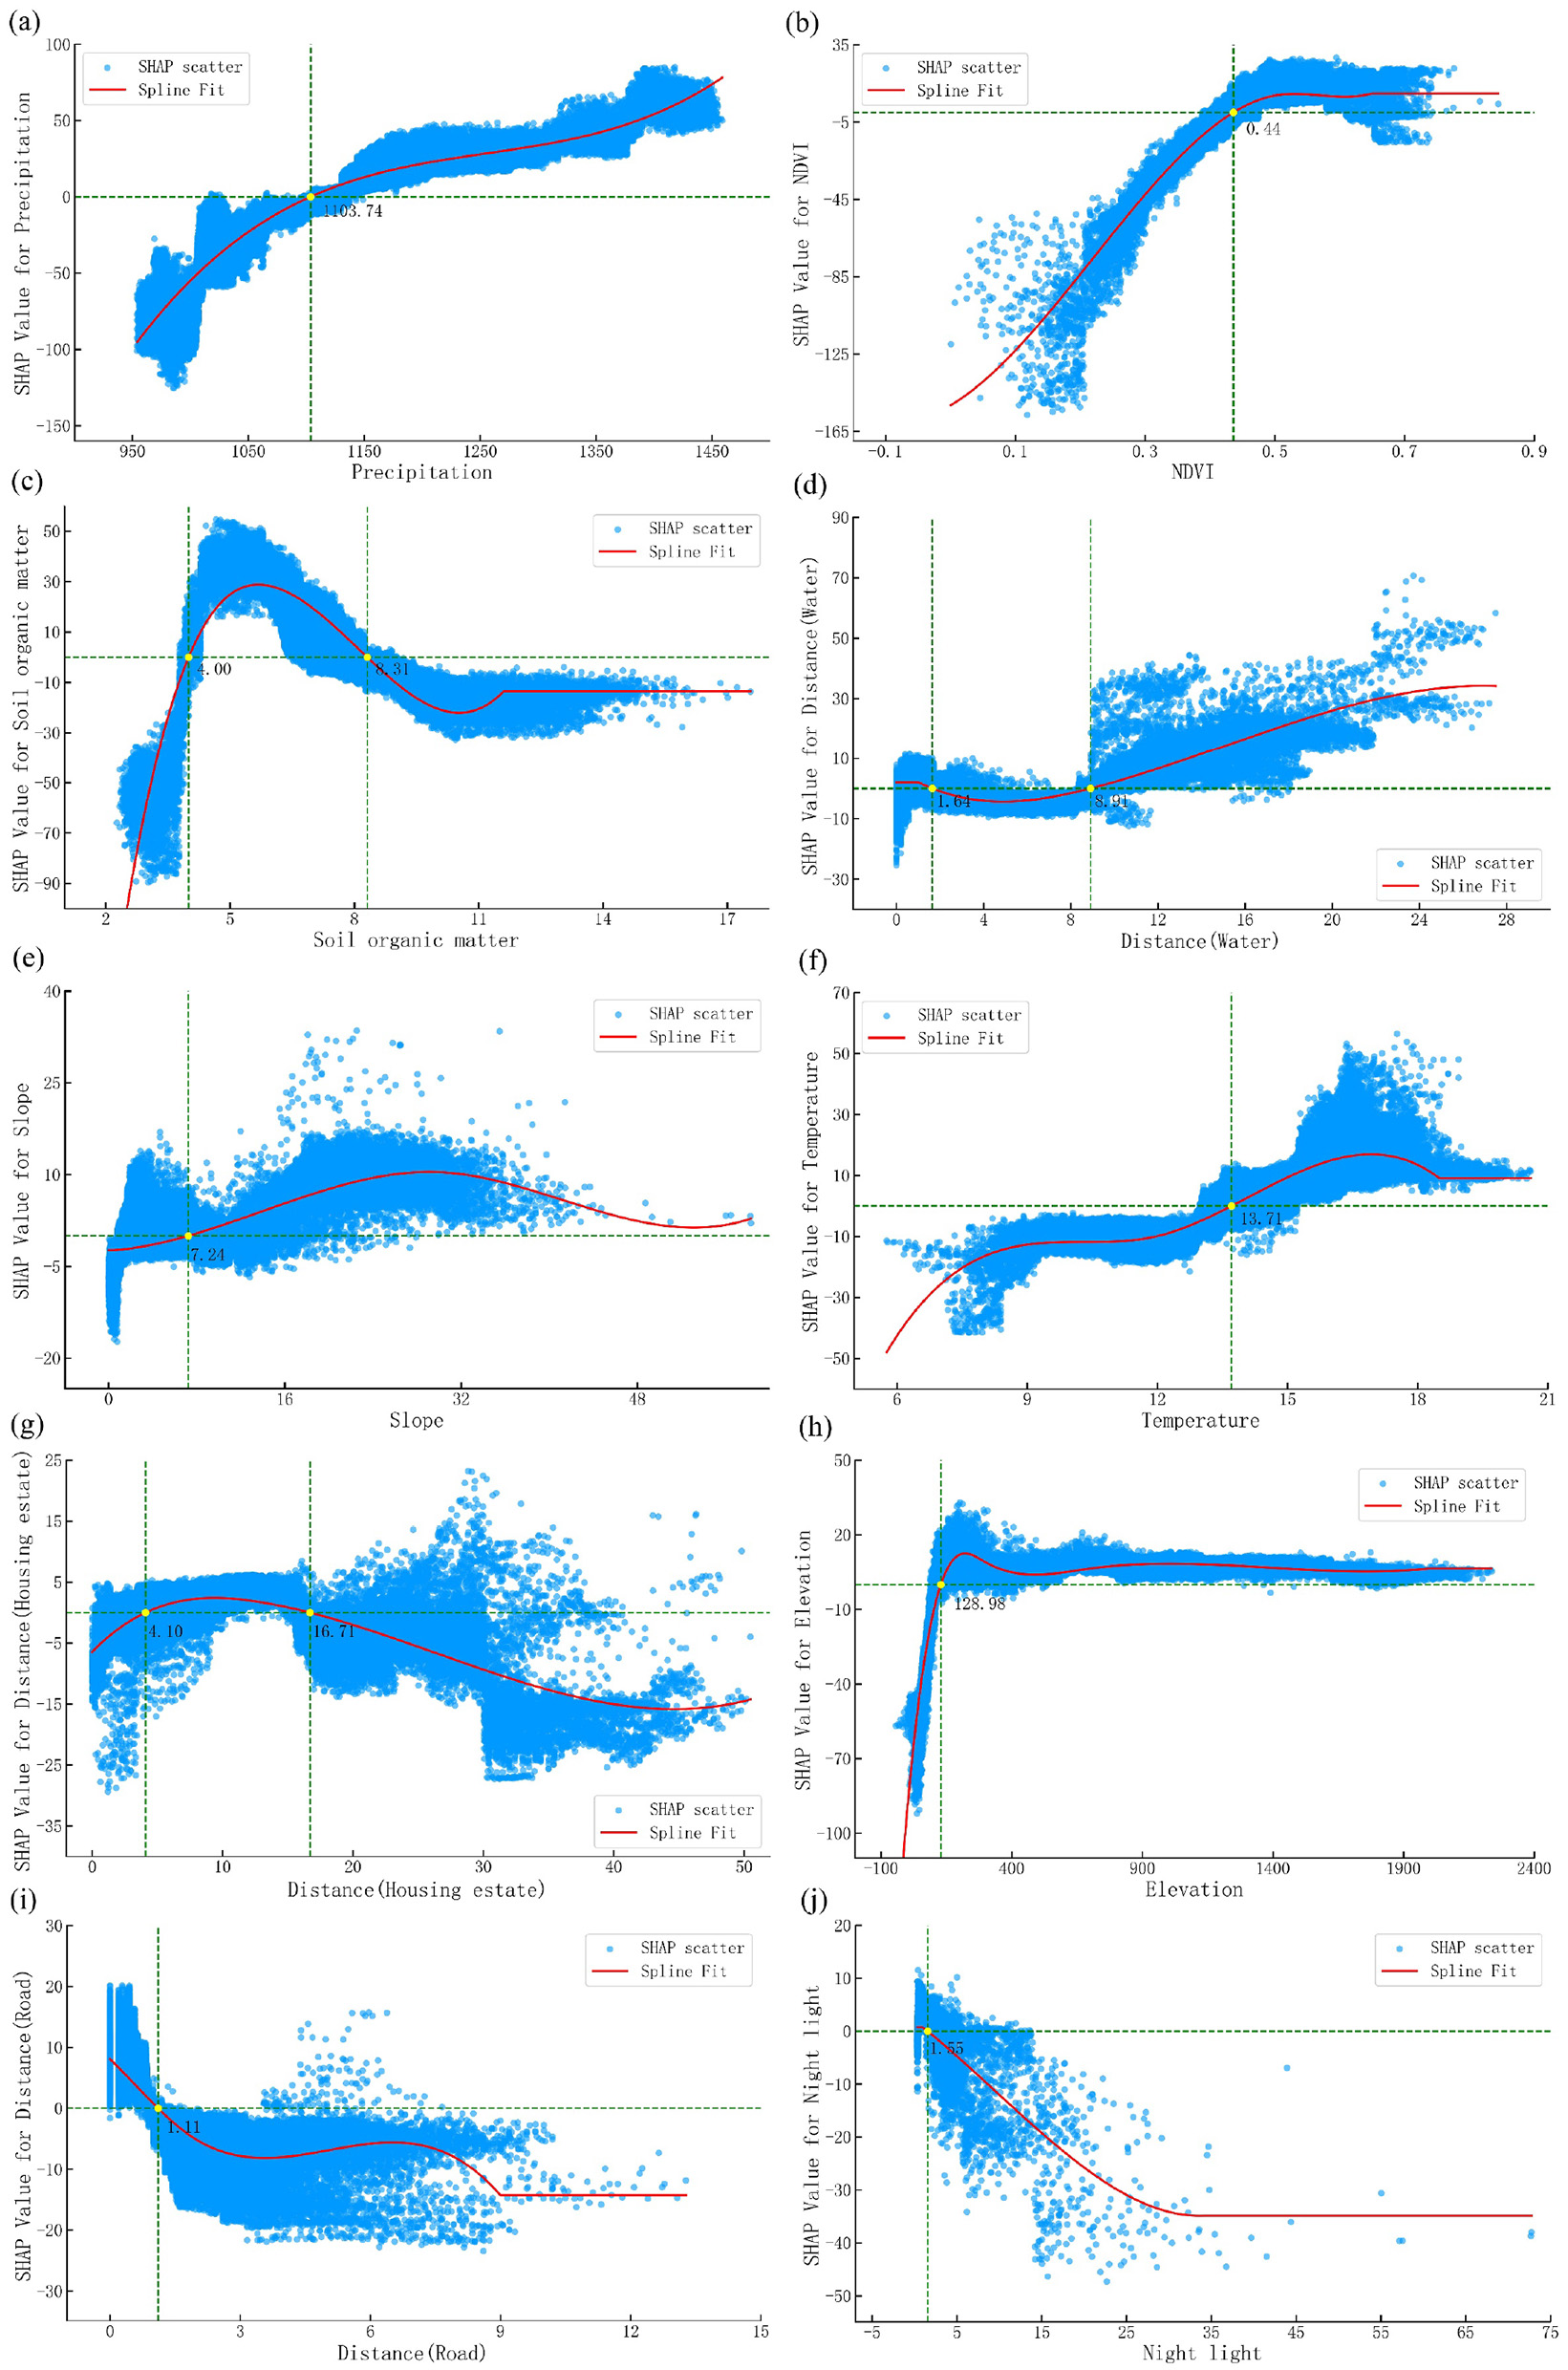
The SHAP dependence plot for each driver (a–j).
3.2.5 Ecological zoning and recommendations based on driver thresholds
Based on the thresholds of the driving factors (as listed in Table 4), each factor was reclassified in GIS. Pixels falling within the threshold range were assigned a value of 1, while those outside the range were assigned a value of 0. Finally, the reclassified maps of all driving factors were overlaid to generate a combined threshold-based classification map, which was categorized into three classes: 0–3 (key restoration zones), 4–6 (key prevention zones), and 7–9 (key conservation zones), as shown in Figure 10. The majority of the region was classified as key prevention and conservation zones, with a smaller portion designated as key restoration zones. Spatially, key restoration zones occupy 12.7% of the total area, mainly distributed in eastern Yichang City and urban regions. These areas are heavily affected by human activities. Key prevention zones make up 66.29% of the area and are scattered across the region, reflecting the combined effects of natural and anthropogenic factors. Key conservation zones account for 21.01%, mainly distributed across forested areas and mainly influenced by natural factors.
Table 4
| Driving factor | Thresholds |
|---|---|
| Precipitation (mm) | ≥1103.77 |
| Temperature (°C) | ≥13.71 |
| Elevation (m) | ≥129.99 |
| NDVI | ≥0.44 |
| Soil organic matter content (%) | 4–8.31 |
| Distance to roads (km) | ≤ 1.11 |
| Distance to housing estates (km) | 4.1–16.71 |
| Distance to water (km) | ≥8.91 or ≤ 1.65 |
| Night-time light intensity (nW/cm2/sr) | ≤ 1.55 |
| Slope (°) | ≥7.24 |
Thresholds of individual drivers.
Figure 10
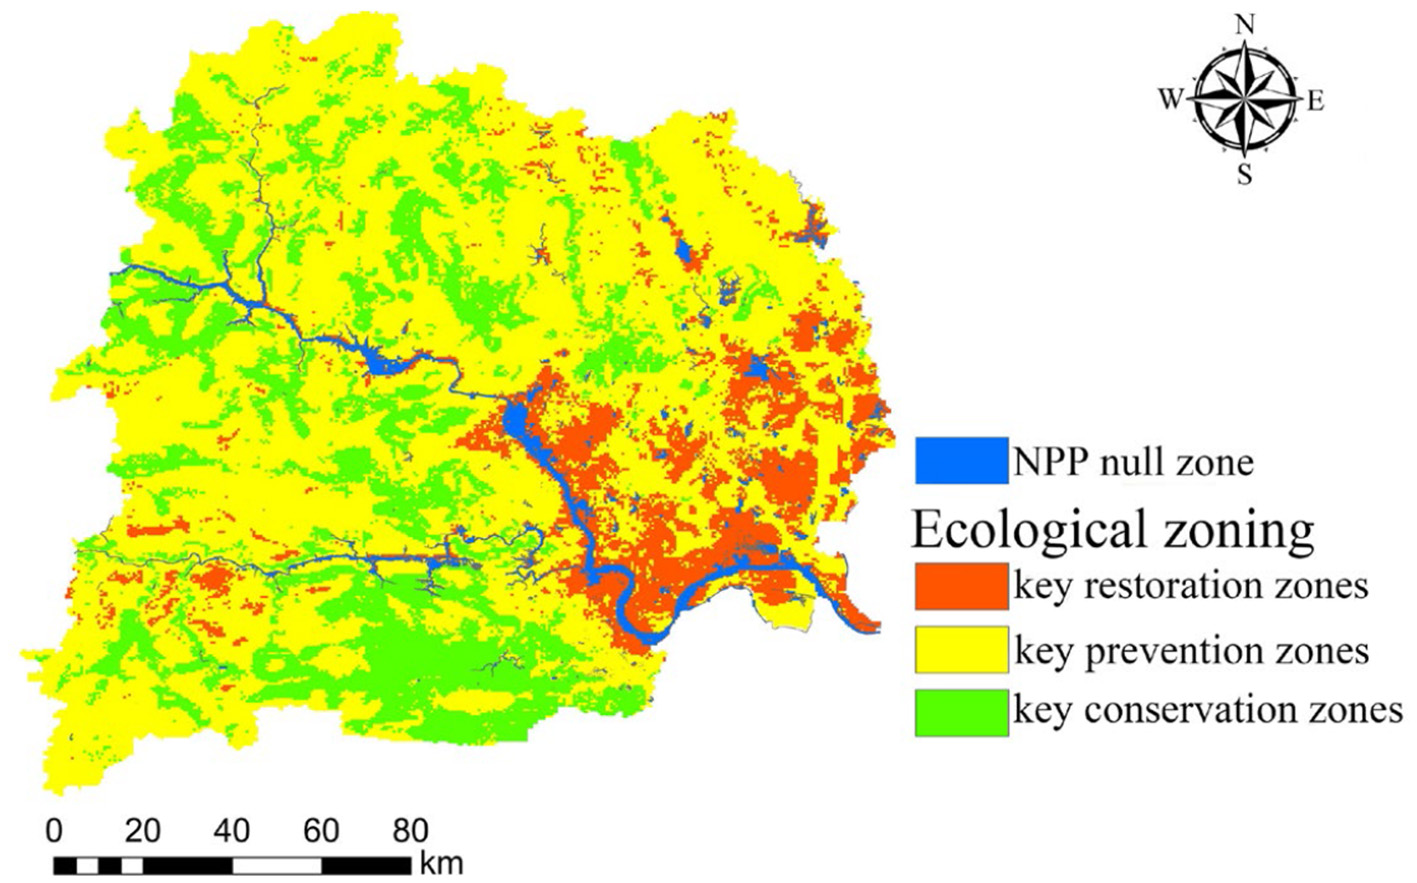
Ecological zones in Yichang City.
Ecological zoning based on the thresholds of driving factors provides a scientific foundation for delineating the three zones in Yichang City. Based on this, the following management recommendations are proposed:
-
(1) In the key restoration zones, comprehensive measures such as three-dimensional greening, ecological restoration, and public participation should be implemented to improve their greening coverage so that the vegetation index reaches above the threshold value; soil organic matter content can be improved through the appropriate introduction of organic mulch, the addition of soil conditioners, and the reasonable allocation of multi-layered vegetation, so that the soil organic matter content is within a reasonable threshold value. Small-scale water conservancy and reservoir projects should be constructed to improve agricultural irrigation technology and other measures to enhance regional water resources' storage capacity and utilization efficiency.
-
(2) In key prevention areas, a balanced management strategy integrating natural and artificial restoration should be implemented. Additionally, regular ecological monitoring is crucial to maintain the ecosystem's stability and health.
-
(3) In the key conservation areas, ecological protection measures, such as establishing nature reserves or implementing forest closures, should be enforced to limit human activities. Additionally, relevant laws and regulations should be strengthened to provide robust legal protection for the ecosystems in these protected areas.
4 Discussion
4.1 Importance and interaction of driving factors
The study of the importance of driving factors for NPP reveals that the top five key factors influencing NPP in Yichang are precipitation, soil organic matter content, vegetation index, altitude, and temperature, in that order. Among these, precipitation exerts the greatest influence on NPP, accounting for over 20%. Previous research also indicates that under natural conditions, climatic factors are typically the primary drivers of vegetation growth (Alkama et al., 2022; Guo et al., 2021).
By analyzing the SHAP summary plot and interaction plot, it is evident that the influence of driving factors on NPP exhibits a distinct non-linear pattern, with significant interactions among these factors. This suggests that the ecosystem's response to various environmental factors is not a simple linear summation but is instead governed by complex non-linear processes. In particular, complex interactions between different driving factors further amplify this non-linear impact. Relevant studies have also shown that these interaction effects differ significantly from the simple addition of individual factor effects (Wang et al., 2017). For example, the interaction between precipitation and temperature may have varying effects on vegetation growth under different climate conditions, which cannot be explained by the effect of each factor alone. The existence of such multi-factor interactions implies that the ecosystem's response depends not only on the independent effects of each factor but also on the significant influence of their interactions. Therefore, a deeper understanding of the interactions between driving factors and incorporating them into ecosystem models is crucial for revealing the intrinsic mechanisms of ecological processes and optimizing ecological management decisions, with important scientific and practical implications.
4.2 Threshold validity of driving factors
The RCS model was applied to fit NDVI, precipitation, and NPP data separately, analyzing the impact of interactions among driving factors (Figures 11a, b). Results indicate that NDVI values below 0.44 still exert a positive influence on NPP, showing significant divergence from the trend depicted in Figure 8b. This discrepancy stems primarily from two factors: First, Figure 9b employed NDVI as the independent variable and SHAP values as the dependent variable for RCS fitting. SHAP values integrate the combined effects of all drivers, calculated by superimposing individual driver contributions onto the mean of the target variable. Second, significant interactions exist among the drivers. For instance, the interactions between NDVI and soil organic matter content, NDVI and temperature, and NDVI and elevation (Figures 8e, h, i) predominantly exhibit negative correlations in low NDVI regions. The interaction between NDVI and precipitation (Figure 8b) is more complex. These interdependent relationships among factors lead to inaccurate threshold identification in Figure 11a.
Figure 11
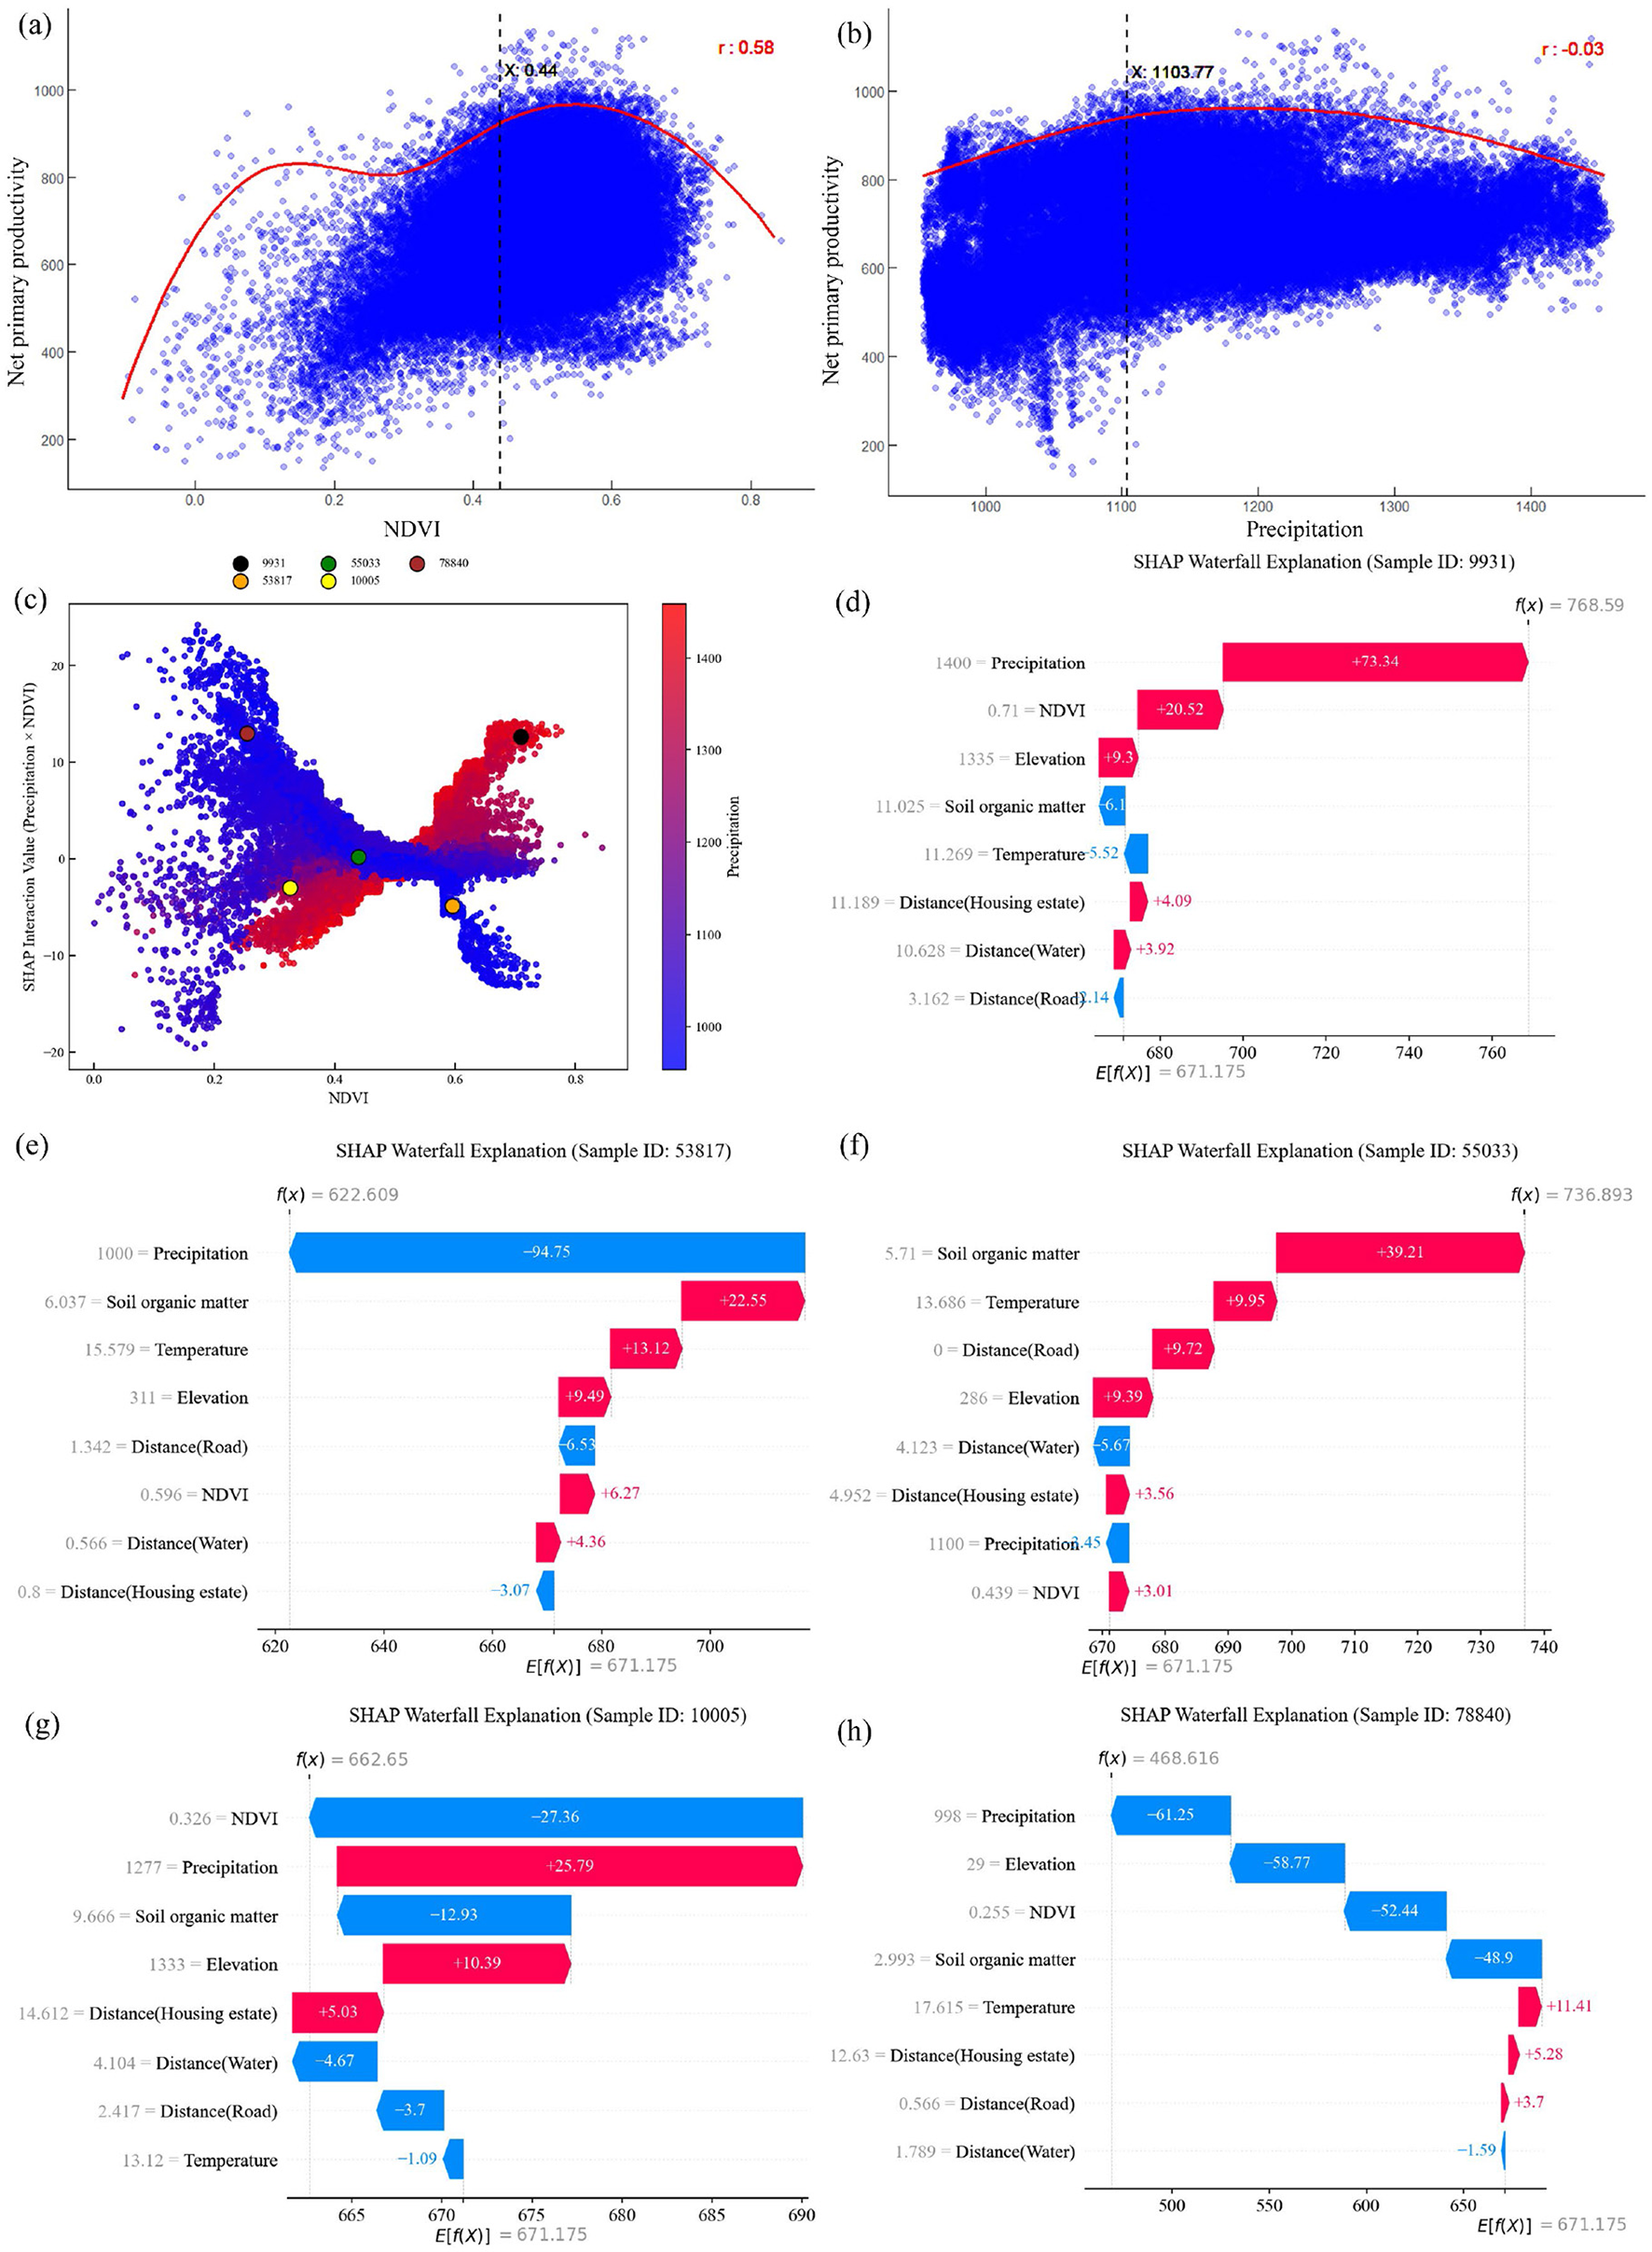
NPP and NDVI scatter plots (a, b) and SHAP interpretation (c–h).
To validate the effectiveness of the XGBoost-SHAP-RCS model, five samples from Figure 11c were selected for interpretability analysis, as shown in Figures 11d–h: NDVI values exceeding 0.44 and precipitation exceeding 1,103 mm exert a positive influence on NPP. Furthermore, the results from the explanatory plots confirm that net primary productivity is influenced by multiple factors, consistent with conclusions from existing literature (Guo et al., 2020).
4.3 Significance of zoning management
By clearly defining ecological and land-use thresholds, ecological management can become more targeted, transparent, and scientifically grounded. These thresholds reveal the non-linear response mechanisms of ecosystem services (ESs) to changes in key drivers, enabling managers to identify critical tipping points where minor alterations in land-use structure trigger disproportionately significant ecological consequences. As demonstrated by threshold-based studies on ecosystem service supply-demand balancing, regional sensitivities to land use proportions, socio-economic pressures, and environmental gradients exhibit significant variation. Consequently, implementing threshold-oriented management measures optimizes resource allocation for ecological conservation and restoration, ensuring interventions are precisely targeted at areas yielding the most significant effects.
Moreover, threshold-based zoning frameworks may facilitate the translation of complex ecological processes into actionable spatial decision rules—such as maintaining, increasing, or reducing the proportion of specific land use types—thereby achieving predetermined ecosystem service balance objectives. This approach enhances regional resilience to climate change, sustains long-term ecological stability, and mitigates degradation risks arising from exceeding ecological carrying capacity. By identifying areas where ecosystem service provision may fall below demand or significantly exceed regional averages, threshold-driven zoning supports proactive governance rather than reactive restoration.
Furthermore, applying thresholds within zoning systems helps clarify the spatial heterogeneity of ecosystem responses. This differentiation is particularly crucial in mountainous and ecologically fragile regions, where land-use structures, topographical features, and human activity intensity interact to shape ecosystem service dynamics. Building upon this enhanced understanding, policymakers can formulate multi-tiered spatial regulation strategies—encompassing interventions at county, township, and even grid levels—that align with ecological realities while integrating into broader land-use planning frameworks. Ultimately, threshold-based zoning not only deepens our comprehension of complex human-environment interactions but also establishes a robust scientific foundation for addressing environmental change and achieving long-term sustainable development objectives.
4.4 Limitations and prospects
First, this study is primarily based on remote sensing data and lacks validation through field observation data. Future research should integrate field survey data to address the limitations of remote sensing data in spatial resolution and enhance the accuracy of the results.
Second, this study only examines the response of NPP to three anthropogenic factors: distance to settlements, distance to roads, and nighttime light intensity. The anthropogenic factors considered are relatively limited, as other factors such as population density, GDP, and human activity intensity were not analyzed for their potential impacts on vegetation NPP.
Third, although the XGBoost model effectively captures non-linear relationships and handles high-dimensional features, its global training characteristic limits its ability to fully reflect the spatial heterogeneity of NPP driving mechanisms. This may reduce prediction accuracy in local sub-regions, especially where driving factors differ significantly or interact complexly (Xu et al., 2026).
Lastly, with the increasing frequency of extreme climate events such as droughts and heatwaves, their impacts on vegetation NPP are becoming more pronounced (Liu et al., 2022). These events may alter the non-linear thresholds of key environmental and anthropogenic drivers, potentially shifting the response curves and modifying the critical points at which NPP is most sensitive. Additionally, intensified human activity, including urban expansion, infrastructure development, and land-use changes, may interact with these climatic extremes, amplifying or mitigating their effects on local carbon balance. Therefore, future research should investigate how extreme climate events and human disturbances jointly influence the thresholds of NPP response, which is essential for refining predictive models and developing adaptive, location-specific management strategies.
5 Conclusions
This study examined the spatiotemporal patterns of NPP in Yichang City over the past 21 years through the coefficient of variation, Theil-Sen trend analysis, Mann-Kendall test, and Hurst index. The primary driving factors influencing NPP changes and their interactions were investigated through the XGBoost algorithm, SHAP, and RCS, and key thresholds were identified to guide regional zoning. The main conclusions are as follows:
-
(1) Over the past 21 years, the mean and total NPP in Yichang City have displayed a fluctuating increase. NPP presents a clear spatial pattern, with greater values in the west and lower ones in the east. From 2003 to 2023, more than 90% of Yichang's area experienced improvements in NPP. However, future trends are predominantly upward yet anti-persistent.
-
(2) The critical driving factors influencing NPP in descending order are precipitation > soil organic matter content > vegetation index > elevation > temperature > distance to roads > distance to water > slope > distance to settlements > nighttime light intensity. These factors exhibit significant non-linear impacts on NPP, with notable interactions among them.
-
(3) The effects of driving factors on NPP display certain thresholds. NPP is promoted under the following conditions: precipitation > 1103.77 mm, NDVI > 0.44, slope > 7.24°, temperature > 13.71 °C, elevation > 129.99 m, distance to roads < 1.1 km, nighttime light intensity < 1.55, soil organic matter content between 4 and 8.31, distance to settlements between 4.1 and 16.71 km, and distance to water < 1.65 km or > 8.91 km. Outside these thresholds are the driving factors for suppressing NPP.
-
4) Yichang City's ecological zones are mainly classified into key prevention and conservation zones, with relatively fewer key restoration zones. Human activities primarily affect key restoration zones, whereas natural factors predominantly influence key conservation zones. Strategies such as increasing vegetation cover, soil improvement, and water resource management can be implemented to enhance NPP in key restoration zones. Key prevention zones should adopt a combination of natural recovery and artificial restoration to ensure ecosystem stability and sustainability. Key conservation zones should focus on establishing protected areas and implementing forest enclosures to promote ecosystem health and development.
Statements
Data availability statement
The original contributions presented in the study are included in the article/supplementary material, further inquiries can be directed to the corresponding author.
Author contributions
YJ: Conceptualization, Methodology, Writing – original draft, Writing – review & editing. DT: Conceptualization, Funding acquisition, Writing – review & editing. HY: Conceptualization, Writing – original draft. YZ: Writing – review & editing.
Funding
The author(s) declared that financial support was received for this work and/or its publication. This work was supported by the National Natural Science Foundation of China (Grant No. 42367070).
Conflict of interest
The author(s) declared that this work was conducted in the absence of any commercial or financial relationships that could be construed as a potential conflict of interest.
Generative AI statement
The author(s) declared that generative AI was not used in the creation of this manuscript.
Any alternative text (alt text) provided alongside figures in this article has been generated by Frontiers with the support of artificial intelligence and reasonable efforts have been made to ensure accuracy, including review by the authors wherever possible. If you identify any issues, please contact us.
Publisher’s note
All claims expressed in this article are solely those of the authors and do not necessarily represent those of their affiliated organizations, or those of the publisher, the editors and the reviewers. Any product that may be evaluated in this article, or claim that may be made by its manufacturer, is not guaranteed or endorsed by the publisher.
References
1
Ahmadpour H. Bazrafshan O. Rafiei-Sardooi E. Zamani H. Panagopoulos T. (2021). Gully erosion susceptibility assessment in the Kondoran watershed using machine learning algorithms and the Boruta feature selection. Sustainability13:10110. doi: 10.3390/su131810110
2
Alkama R. Forzieri G. Duveiller G. Grassi G. Liang S. Cescatti A. (2022). Vegetation-based climate mitigation in a warmer and greener World. Nat. Commun.13:606. doi: 10.1038/s41467-022-28305-9
3
Ba W. Qiu H. Cao Y. Gong A. (2023). Spatiotemporal characteristics prediction and driving factors analysis of NPP in Shanxi Province covering the period 2001–2020. Sustainability15:12070. doi: 10.3390/su151512070
4
Chen T. Guestrin C. (2016). “Xgboost: a scalable tree boosting system,” in Proceedings of the 22nd ACM SIGKDD International Conference on Knowledge Discovery and Data Mining (San Francisco, CA: ACM), 785–794. doi: 10.1145/2939672.2939785
5
Cramer W. Field C. B. (1999). Comparing global models of terrestrial net primary productivity (NPP): introduction. Glob. Change Biol. 5, iii–iv. doi: 10.1046/j.1365-2486.1999.00001.x
6
Deng C. Zhang B. Cheng L. Hu L. Chen F. (2019). Vegetation dynamics and their effects on surface water-energy balance over the Three-North Region of China. Agric. For. Meteorol.275, 79–90. doi: 10.1016/j.agrformet.2019.05.012
7
Guo B. Han B. Yang F. Chen S. Liu Y. Yang W. (2020). Determining the contributions of climate change and human activities to the vegetation NPP dynamics in the Qinghai-Tibet Plateau, China, from 2000 to 2015. Environ. Monit. Assess.192, 1–18. doi: 10.1007/s10661-020-08606-6
8
Guo D. Song X. Hu R. Cai S. Zhu X. Hao Y. (2021). Grassland type-dependent spatiotemporal characteristics of productivity in Inner Mongolia and its response to climate factors. Sci. Total Environ.775:145644. doi: 10.1016/j.scitotenv.2021.145644
9
Hong G. Liu S. Liu W. Wu X. (2024). Nonlinear trade-off relationship and critical threshold between ecosystem services and climate resilience for sustainable urban development. Sustain. Cities Soc.103:105253. doi: 10.1016/j.scs.2024.105253
10
Huang M. Piao S. Ciais P. Peñuelas J. Wang X. Keenan T. F. et al . (2019). Air temperature optima of vegetation productivity across global biomes. Nat. Ecol. Evol.3, 772–779. doi: 10.1038/s41559-019-0838-x
11
Hurst H. E. (1956). Methods of using long-term storage in reservoirs. Proc. Instit. Civil Eng.5, 519–543. doi: 10.1680/iicep.1956.11503
12
Jia Z. Zhang Z. Cheng Y. Borjigin S. Quan Z. (2024). Grassland biomass spatiotemporal patterns and response to climate change in eastern Inner Mongolia based on XGBoost model estimates. Ecol. Indic.158:111554. doi: 10.1016/j.ecolind.2024.111554
13
Kelly R. P. Erickson A. L. Mease L. A. Battista W. Kittinger J. N. Fujita R. (2015). Embracing thresholds for better environmental management. Philos. Trans. R. Soc. B: Biol. Sci.370:20130276. doi: 10.1098/rstb.2013.0276
14
Li D. Cao W. Dou Y. Wu S. Liu J. Li S. (2022b). Non-linear effects of natural and anthropogenic drivers on ecosystem services: integrating thresholds into conservation planning. J. Environ. Manag.321:116047. doi: 10.1016/j.jenvman.2022.116047
15
Li L. Zeng Z. Zhang G. Duan K. Liu B. Cai X. (2022a). Exploring the individualized effect of climatic drivers on MODIS Net Primary Productivity through an explainable machine learning framework. Remote Sens.14:4401. doi: 10.3390/rs14174401
16
Li S. Li X. Dou H. Dang D. Gong J. (2021). Integrating constraint effects among ecosystem services and drivers on seasonal scales into management practices. Ecol. Indic.125:107425. doi: 10.1016/j.ecolind.2021.107425
17
Li T. Li M. Ren F. Tian L. (2022c). Estimation and spatio-temporal change analysis of NPP in subtropical forests: a case study of Shaoguan, Guangdong, China. Remote Sens.14:2541. doi: 10.3390/rs14112541
18
Li Z. Chen J. Chen Z. Sha Z. Yin J. Chen Z. (2023). Quantifying the contributions of climate factors and human activities to variations of net primary productivity in China from 2000 to 2020. Front. Earth Sci.11:1084399. doi: 10.3389/feart.2023.1084399
19
Lieth H. Whittaker R. H. (1975). Primary Productivity of the Biosphere. New York, NY: Springer-Verlag Press. doi: 10.1007/978-3-642-80913-2
20
Lin N. Li J. Jiang R. Li X. Liu S. (2023). Quantifying the spatiotemporal variation of NPP of different land cover types and the contribution of its associated factors in the Songnen Plain. Forests14:1841. doi: 10.3390/f14091841
21
Liu L. Jiang Y. Gao J. Feng A. Jiao K. Wu S. et al . (2022). Concurrent climate extremes and impacts on ecosystems in southwest China. Remote Sens.14:1678. doi: 10.3390/rs14071678
22
Liu X. Li H. Zhou Y. Wang X. (2025). Spatiotemporal dynamics of vegetation net primary productivity in Chinese eco-logical function conservation areas: the influences of climate and topography. J. Nat. Conserv.84:126846. doi: 10.1016/j.jnc.2025.126846
23
Liu Y. Yang Y. Wang Q. Khalifa M. Zhang Z. Tong L. et al . (2019). Assessing the dynamics of grassland net primary productivity in response to climate change at the global scale. Chin. Geogr. Sci.29, 725–740. doi: 10.1007/s11769-019-1063-x
24
Long B. Zeng C. Zhou T. Yang Z. Rao F. Li J. et al . (2024). Quantifying the relative importance of influencing factors on NPP in Hengduan Mountains of the Tibetan Plateau from 2002 to 2021: a dominance analysis. Ecol. Inform.81:102636. doi: 10.1016/j.ecoinf.2024.102636
25
Lundberg S. M. Lee S.-I. (2017) “A unified approach to interpreting model predictions,” in Proceedings of the 31st International Conference on Neural Information Processing Systems, 4–9 December 2017 (Long Beach, CA), 4768–4777. 10.48550/arXiv.1705.07874
26
Ma S. Wang L. J. Jiang J. Chu L. Zhang J. C. (2021). Threshold effect of ecosystem services in response to climate change and vegetation coverage change in the Qinghai-Tibet Plateau ecological shelter. J. Clean. Prod.318:128592. doi: 10.1016/j.jclepro.2021.128592
27
Molnar C. Casalicchio G. Bischl B. (2020). “Interpretable machine learning–a brief history, state-of-the-art and challenges,” in Joint European Conference on Machine Learning and Knowledge Discovery in Databases (Cham: Springer International Publishing), 417–431. doi: 10.1007/978-3-030-65965-3_28
28
Peng J. Shen H. Wu W. Liu Y. Wang Y. (2016). Net primary productivity (NPP) dynamics and associated urbanization driving forces in metropolitan areas: a case study in Beijing City, China. Landsc. Ecol.31, 1077–1092. doi: 10.1007/s10980-015-0319-9
29
Shao S. Pan Y. Huang A. (2025). Delineating ecological improvement zones based on impact thresholds of ecosystem health changes in Northwest Hubei, China. Ecol. Indic.178:113898. doi: 10.1016/j.ecolind.2025.113898
30
Shi S. Zhu L. Luo Z. Qiu H. (2023). Quantitative analysis of the contributions of climatic and anthropogenic factors to the variation in net primary productivity, China. Remote Sens.15:789. doi: 10.3390/rs15030789
31
Song L. Li M. Xu H. Guo Y. Wang Z. Li Y. et al . (2021). Spatiotemporal variation and driving factors of vegetation net primary productivity in a typical karst area in China from 2000 to 2010. Ecol. Indic.132:108280. doi: 10.1016/j.ecolind.2021.108280
32
Sun Y. Yang Y. Zhao X. Tang Z. Wang S. Fang J. (2021). Global patterns and climatic drivers of above- and belowground net primary productivity in grasslands. Sci. China Life Sci.64, 739–751. doi: 10.1007/s11427-020-1837-9
33
Tian D. Wang H. Sun J. Niu S. (2016). Global evidence on nitrogen saturation of terrestrial ecosystem net primary productivity. Environ. Res. Lett.11:024012. doi: 10.1088/1748-9326/11/2/024012
34
Tian Y. Zhang Q. Tao J. Zhang Y. Lin J. Bai X. (2024). Use of interpretable machine learning for understanding ecosystem service trade-offs and their driving mechanisms in karst peak-cluster depression basin, China. Ecol. Indic.166:112474. doi: 10.1016/j.ecolind.2024.112474
35
Wang M. Li Y. Yuan H. Zhou S. Wang Y. Ikram R. M. A. et al . (2023). An XGBoost-SHAP approach to quantifying morphological impact on urban flooding susceptibility. Ecol. Indic.156:111137. doi: 10.1016/j.ecolind.2023.111137
36
Wang S. Ma Y. Gong J. Jin T. (2025). Dynamic variation of vegetation NPP and its driving forces in the Yellow River Basin, China. Chin. Geogr. Sci.35, 24–37. doi: 10.1007/s11769-024-1477-y
37
Wang X. Tan K. Chen B. Du P. (2017). Assessing the spatiotemporal variation and impact factors of net primary productivity in China. Sci. Rep.7:44415. doi: 10.1038/srep44415
38
Wieland R. Lakes T. Nendel C. (2021). Using Shapley additive explanations to interpret extreme gradient boosting predictions of grassland degradation in Xilingol, China. Geosci. Model Dev.14, 1493–1510. doi: 10.5194/gmd-14-1493-2021
39
Wu X. Liu S. Cheng F. Hou X. Zhang Y. Dong S. et al . (2018). A regional strategy for ecological sustainability: a case study in Southwest China. Sci. Total Environ.616, 1224–1234. doi: 10.1016/j.scitotenv.2017.10.196
40
Xu Y. Wang M. Tang W. Li S. Ai W. Xu W. et al . (2026). Territorial spatial carbon balance governance from a spatially refined perspective: incorporating sub-regional differences in spatial driving effects into zoning regulation. Environ. Impact Assess. Rev.117:108222. doi: 10.1016/j.eiar.2025.108222
41
Xue H. Chen Y. Dong G. Li J. (2023). Quantitative analysis of spatiotemporal changes and driving forces of vegetation net primary productivity (NPP) in the Qimeng region of Inner Mongolia. Ecol. Indic.154:110610. doi: 10.1016/j.ecolind.2023.110610
42
Yang M. Chen Y. Yang Y. Yan Y. (2024). Nonlinear relationship and threshold-based zones between ecosystem service supply-demand ratio and land use intensity: a case study of the Beijing-Tianjin-Hebei region, China. J. Clean. Prod.481:144148. doi: 10.1016/j.jclepro.2024.144148
43
Yin C. Chen X. Luo M. Meng F. Sa C. Bao S. et al . (2023). Quantifying the contribution of driving factors on distribution and change of net primary productivity of vegetation in the Mongolian Plateau. Remote Sens.15:1986. doi: 10.3390/rs15081986
44
Yuan Y. Guo W. Tang S. Zhang J. (2024). Effects of patterns of urban green-blue landscape on carbon sequestration using XGBoost-SHAP model. J. Clean. Prod.476:143640. doi: 10.1016/j.jclepro.2024.143640
45
Zhang H. Li L. Zhao X. Chen F. Wei J. Feng Z. et al . (2024). Changes in vegetation NDVI and its response to climate change and human activities in the Ferghana Basin from 1982 to 2015. Remote Sens.16:1296. doi: 10.3390/rs16071296
46
Zhang J. Wang Y. Sun J. Zhang Y. Wang D. Chen J. et al . (2023). Trade-offs and synergies of ecosystem services and their threshold effects in the largest tableland of the Loess Plateau. Glob. Ecol. Conserv.48:e02706. doi: 10.1016/j.gecco.2023.e02706
47
Zheng H. Wang L. Peng W. Zhang C. Li C. Robinson B. E. et al . (2019). Realizing the values of natural capital for inclusive, sustainable development: informing China's new ecological development strategy. Proc. Nat. Acad. Sci. U. S. A.116, 8623–8628. doi: 10.1073/pnas.1819501116
48
Zhou B. Chen G. Yu H. Zhao J. Yin Y. (2024). Revealing the nonlinear impact of human activities and climate change on ecosystem services in the Karst Region of Southeastern Yunnan using the XGBoost–SHAP Model. Forests15:1420. doi: 10.3390/f15081420
Summary
Keywords
ecological zoning, machine learning, net primary productivity, restricted cubic splines, threshold identification
Citation
Jiang Y, Tang D, Yuan H and Zhang Y (2026) Eco-zoning management based on thresholds of NPP driving factors. Front. For. Glob. Change 8:1712019. doi: 10.3389/ffgc.2025.1712019
Received
24 September 2025
Accepted
02 December 2025
Published
07 January 2026
Volume
8 - 2025
Edited by
Ana Cristina Gonçalves, University of Evora, Portugal
Reviewed by
Le Li, Research Chinese Academy of Forestry, China
Yifei Xu, Yunnan University, China
Updates
Copyright
© 2026 Jiang, Tang, Yuan and Zhang.
This is an open-access article distributed under the terms of the Creative Commons Attribution License (CC BY). The use, distribution or reproduction in other forums is permitted, provided the original author(s) and the copyright owner(s) are credited and that the original publication in this journal is cited, in accordance with accepted academic practice. No use, distribution or reproduction is permitted which does not comply with these terms.
*Correspondence: Diwei Tang, jstdw@163.com
Disclaimer
All claims expressed in this article are solely those of the authors and do not necessarily represent those of their affiliated organizations, or those of the publisher, the editors and the reviewers. Any product that may be evaluated in this article or claim that may be made by its manufacturer is not guaranteed or endorsed by the publisher.