Abstract
Forestry productivity measurement increasingly incorporates ecological services, yet existing studies rarely quantify the structural role of forest carbon stock (FCS) or compare how its inclusion reshapes both static efficiency and dynamic productivity trends. Prior research typically relies on a single Data Envelopment Analysis (DEA) model or conventional total factor productivity (TFP) metrics, leaving a gap in understanding how ecological outputs alter efficiency structures and whether green productivity diverges from traditional measures. This study addresses these gaps by developing a multidimensional framework integrating static and dynamic perspectives to evaluate China’s forestry sector from 2000 to 2020. Using provincial panel data, market and ecological efficiencies are assessed through the slacks-based measure (SBM) and the non-radial directional distance function (NDDF), while green and traditional total factor productivity (GTFP and TFP) are examined via the Meta-frontier Malmquist–Luenberger Productivity Index (MMLPI). Results show that ecological efficiency substantially exceeds market efficiency, and that excluding FCS leads to significant underestimation of green performance. GTFP grows only 1% annually compared with 11% for traditional TFP, with pronounced regional heterogeneity driven by technology gaps and resource endowments. By identifying FCS as a structural determinant of forestry performance, the study clarifies long-standing measurement biases and provides policy-relevant evidence for optimizing ecological investment, guiding region-specific management, and aligning forestry development with China’s dual-carbon goals. The analytical framework offers transferable insights for countries facing similar challenges in balancing economic forestry outputs with carbon-efficiency and ecological service enhancement.
1 Introduction
Forests provide essential material goods and play a crucial role in regulating global ecosystems, with key functions including carbon stock (FCS), biodiversity conservation, water regulation, and support rural livelihoods. Among these functions, FCS has gained prominence for its strong mitigation potential and cost-effectiveness, positioning sustainable forestry as a key component of global climate and development goals (Dixon et al., 1994; Richards and Stokes, 2004; Busch et al., 2024). Nevertheless, the sector continues to face significant challenges, including overexploitation, climate risks, land-use pressures, and limited technological progress. Since 1990, global forests have lost 489 million hectares, with net annual losses of 6.97 million hectares between 2015 and 2025, and carbon stocks declined from 716 to 706 gigatons by 2000 before partially recovering to 714 gigatons in 2025 (FAO, 2025). These trends underscore the need to evaluate forestry efficiency and productivity by jointly considering economic and ecological outcomes, particularly FCS.
Building on these global trends, China offers a particularly instructive case for examining forestry development under rapid economic transition. Over the past four decades, industrialization and urbanization have intensified pressures on natural resources, prompting the government to implement a series of large-scale ecological restoration programs. These initiatives substantially increased forest cover; between 2010 and 2025, China achieved the fastest global forest growth, reaching 227 million hectares and 19.19 billion m3 of growing stock, according to FAO reports (FAO, 2010, 2020, 2025). In parallel with ecological restoration, the forestry sector has also achieved notable economic gains. According to official data from the China Forestry Statistical Yearbook (various years) and the National Forest Resources Inventory (multiple rounds), China’s forestry gross domestic product (GDP) grew at an average annual rate of 16.25% from 2000 to 2020, while FCS increased by 6.01% per year. By 2020, forestry GDP reached RMB 8.17 trillion and total FCS amounted to 898 million tons. Meanwhile, China officially announced its dual-carbon strategy in 2020, in which FCS constitutes a critical mitigation pathway. Consequently, evaluating the efficiency and productivity of China’s forestry sector has become an important research priority. Such analysis helps identify the sector’s underlying growth sources and provides insights for global forestry development by reducing deforestation, increasing FCS, and supporting the Paris Agreement’s temperature goals.
Total factor productivity (TFP) is a fundamental theoretical tool for analyzing economic growth and development quality (Hall and Jones, 1999). A foundational contribution to forestry TFP (FTFP) analysis is the study by De Borger and Buongiorno (1985), who examined productivity growth in the U.S. paper and paperboard industries using a variable-cost function approach. However, conventional TFP models typically account only for traditional inputs such as labor and capital, without considering resource and environmental constraints, including energy consumption and pollutant emissions. Such omissions can bias assessments of true economic performance, particularly in the forestry sector, which provides not only economic outputs but also multiple ecological services. To overcome these limitations, Chung et al. (1997) developed the Malmquist–Luenberger Productivity Index (MLPI) based on the Directional Distance Function (DDF), representing one of the first attempts to measure TFP in the presence of undesirable outputs. Using this framework, they calculated the green total factor productivity (GTFP) of Swedish paper mills, providing one of the earliest empirical estimates of the impact of pollution emissions on economic growth.
FTFP research has rapidly evolved, with Data Envelopment Analysis (DEA) as the main non-parametric approach. Within the DEA framework, different measures such as the Slack-Based Measure (SBM) and the Malmquist index are commonly used to assess multiple inputs and outputs without assuming a specific functional form. For instance, Yang et al. (2016) applied the Malmquist-DEA approach to 135 state-owned forestry enterprises in China, demonstrating that technological progress was the primary driver of FTFP growth. Similarly, Li et al. (2008) compared sawmill industries in the United States and Canada using non-parametric programming, finding that Canada exhibited higher efficiency while the United States experienced faster productivity growth. Recent methodological innovations, such as two-stage chance-constrained DEA and dynamic network SBM, have further incorporated ecological and contextual variables into efficiency analysis (Amirteimoori et al., 2023; Feng et al., 2023). Nevertheless, SBM has emerged as the dominant method due to its computational convenience and widespread adoption, whereas alternative non-parametric approaches, such as the Non-radial Directional Distance Function (NDDF), which theoretically offer a more rigorous treatment of directional ecological outputs, remain underutilized. This methodological imbalance underscores the need for studies that integrate NDDF alongside SBM to provide more nuanced and robust assessments of forestry efficiency and ecological performance.
In recent years, the integration of ecological values into forestry output assessments has given rise to GTFP as a central research theme. By treating FCS and other ecosystem services as desirable outputs, and emissions or degradation as undesirable outputs, GTFP provides a more comprehensive evaluation of sectoral performance. In China, Gao et al. (2020) evaluated the “Lucid Waters and Lush Mountains” initiative with a GTFP model, showing that forest coverage contributed to economic growth at levels comparable to capital and labor. Similarly, Liu et al. (2023) included carbon storage in provincial TFP accounts and found that FCS TFP grew at an average annual rate of 8.9% from 1999 to 2018, driven mainly by technological progress. Beyond China, GTFP studies have extended to forestry-related industries and cross-country comparisons. For instance, Xie et al. (2025), employing the SBM-Global Malmquist-Luenberger model, assessed low-carbon TFP in the paper sector of 42 countries and confirmed that technological progress accounted for most gains, although only advanced economies achieved improvements in technical efficiency. Song et al. (2020) highlighted how climate shocks reshape forestry productivity, further underscoring the ecological dimension of TFP dynamics. These findings suggest that while technology remains a consistent driver, ecological contributions are shaped by natural endowments and institutional settings. However, FCS is often omitted or inconsistently measured, which reduces cross-study comparability and limits understanding of its contribution to productivity growth. Furthermore, few studies systematically compare GTFP with conventional TFP, leaving the additional contribution of ecological performance largely unexplored.
FTFP exhibits substantial spatial and temporal heterogeneity, shaped by resource endowments, policy interventions, and local economic conditions. In China, regional variations are pronounced: Yang et al. (2016) reported that state-owned forestry enterprises in the northwest achieved faster TFP growth (10.7%) than those in the northeast (10.1%), reflecting the impact of the Western Development Strategy. At the provincial level, Cao et al. (2024) documented notable disparities among timber, economic, and mixed forests in Hunan, highlighting the positive effects of afforestation subsidies. Given such heterogeneity, it is essential to employ methods capable of capturing group-specific technological differences, such as Meta-frontier Malmquist–Luenberger Productivity Index (MMLPI). Decomposing efficiency and TFP is equally crucial, as it identifies the underlying drivers of productivity rather than merely observing external influences. Existing studies often highlight technological progress as the dominant driver of FTFP, with empirical evidence suggesting it contributes over 30% to China’s TFP growth (Shi et al., 2017). Improvements in technical efficiency through management and technology adoption also account for a substantial portion of TFP growth in many settings, while cross-country differences, such as between the United States and Canada, reflect variations in technological advancement and frontier convergence (Li et al., 2008; Song et al., 2020). However, most analyses focus on exogenous determinants, such as policy, foreign direct investment, or climate shocks, without systematically decomposing TFP into its underlying components, leaving a gap in understanding the precise internal mechanisms of TFP.
Taken together, the literature reveals a steady evolution from TFP to GTFP analyses that integrate ecological considerations. Technological progress consistently emerges as the central driver of FTFP, while regional disparities remain a persistent feature. Nevertheless, four key gaps can be identified. First, FCS is often excluded or inconsistently measured, undermining cross-study comparability. Second, the heavy reliance on SBM limits robustness, whereas alternative approaches such as NDDF and systematic efficiency–productivity decompositions remain underutilized. Third, many studies rely on a single TFP or GTFP index and focus primarily on external determinants, without sufficiently examining the internal structure of efficiency and productivity decomposition, thereby weakening mechanism identification. Fourth, although regional heterogeneity is widely documented, it is often treated in a descriptive manner, with limited decomposition-based analysis of its internal mechanisms, which constrains the precision of region-specific policy guidance.
Addressing these gaps is vital for sustainable forestry, green productivity measurement, and policy that reconciles economic and ecological objectives. This study systematically evaluates China’s forestry sector from 2000 to 2020, integrating labor, capital, forestland, and energy as inputs; forestry GDP and FCS as desirable outputs; and CO₂ and PM₂.₅ emissions as undesirable outputs. Efficiency is assessed using SBM and NDDF, and productivity is measured via MMLPI. The study aims to (i) quantify market and ecological efficiency, decomposed by input and output, (ii) compare GTFP with conventional TFP to assess ecological contributions, and (iii) decompose productivity growth to examine the roles of technological progress, technical efficiency, and regional heterogeneity.
Prior theory and empirical patterns motivate the following expectations: (H1) ecological efficiency exceeds market efficiency; (H2) incorporating FCS increases ecological efficiency; (H3) GTFP changes more slowly than conventional TFP due to gradual forest stock accumulation; and (H4) substantial regional heterogeneity exists in efficiency and productivity. The findings are expected to offer actionable insights for policy and management and provide a robust framework for evaluating FTFP. In particular, FCS functions as the central ecological service that distinguishes green productivity from conventional measures, and its interaction with market-oriented outputs is essential for understanding China’s forestry development trajectory.
2 Methods and data description
We first introduce the SBM, which evaluates market and ecological efficiency and decomposes inefficiencies into input- and output-specific components (Section 2.1). Next, we present the NDDF, a theoretically rigorous approach for measuring ecological efficiency that also allows sensitivity analysis of FCS contributions (Section 2.2). We then outline the MMLPI, used to assess dynamic changes in TFP and GTFP while accounting for regional technological heterogeneity (Section 2.3). Finally, Section 2.4 describes the input–output variables, data sources, and the construction of ecological outputs and undesirable emissions. Together, this framework provides a coherent methodological pathway linking static efficiency analysis with dynamic productivity measurement and ensures consistency and comparability across all evaluations.
2.1 Slacks-based measure
DEA, first introduced by Charnes et al. (1978), is a non-parametric method based on linear programming that evaluates the relative efficiency of decision-making units (DMUs) using multiple inputs and outputs. Traditional DEA models, such as the CCR model, adopt radial and oriented assumptions, meaning they measure efficiency only through proportional changes in inputs or outputs. However, these models neglect slack variables, which represent input redundancies and output shortfalls. To overcome this limitation, Tone (2001) proposed SBM, a non-radial and non-oriented model that directly incorporates slack variables into the objective function. This approach provides a more precise assessment of DMU efficiency, especially in contexts involving undesirable outputs, such as environmental pollutants or carbon emissions. Building on the formulations of Morita et al. (2005) and Chen (2012), the SBM model with undesirable outputs can be expressed as in Equation 1:
Here, N denotes the number of input factors, P the number of desirable outputs, and Q the number of undesirable outputs. Specifically, 、、represent the slack values associated with input factors, desirable outputs, and undesirable outputs, respectively. In this framework, the slack variables for input factors and undesirable outputs reflect the potential reductions that can be achieved, while those for desirable outputs indicate the potential increases attainable. Based on these slack variables, the efficiency of individual input factors and outputs, as well as the comprehensive efficiency, can be derived.
Following Managi and Kaneko (2006), efficiency calculated using only market-oriented inputs and desirable economic outputs is defined as market efficiency (ME). When energy inputs and undesirable outputs are included, the framework corresponds to the environmental-efficiency setting used in Wang et al. (2010). In this study, we further incorporate FCS as a desirable ecological output, enabling the assessment of ecological efficiency (EE), which reflects both environmental burdens and ecosystem service contributions. The VRS specification is adopted, consistent with the literature (Zheng et al., 1998; Wang et al., 2010).
2.2 Non-radial directional distance function
Chambers et al. (1996) pioneered the Directional Distance Function (DDF) to measure efficiency in simultaneous input reduction and output expansion. In modeling environmental production technologies, the DDF framework typically relies on two key axioms (Shephard, 1970; Chung et al., 1997). The weak disposability assumption states that reducing undesirable outputs requires either reducing desirable outputs or increasing inputs. The null jointness assumption further indicates that undesirable outputs cannot be eliminated without also reducing production. Building on these principles, Chung et al. (1997) extended the framework to environmental efficiency analysis by explicitly incorporating undesirable outputs.
Conventional DDF assumes radial and proportional adjustments, requiring all desirable outputs to expand and all undesirable outputs to contract at the same rate. This assumption may overestimate efficiency in the presence of slack. To address this limitation, Zhou et al. (2012) proposed the NDDF, which allows different adjustment rates for each input and output dimension.
In NDDF, the directional vector g determines the direction in which desirable outputs expand and undesirable outputs contract. Following Zhou et al. (2012), we set , so that inputs and undesirable outputs are reduced and desirable outputs are increased proportionally to their observed magnitudes. The weight vector w is specified as an equal-weight vector, a common practice in NDDF applications, which avoids subjective parameter choices and maintains consistency with SBM’s symmetric treatment of slacks. The technology set T(x) is constructed as a convex production possibility frontier using observed provincial data under variable returns to scale, ensuring that efficiency is evaluated relative to the best observed environmental performance each year (as in Equation 2).
where , , and denote inputs, desirable outputs and undesirable outputs of the (2) evaluated DMU, and are intensity variables.
The NDDF is defined as in Equation 3:
where is a standardized weight vector related to inputs and outputs, is the directional vector, and is the scale factor vector. The formula for calculating is as in Equation 4:
If , the evaluated DMU lies on the optimal production frontier defined by the direction vector g. The NDDF can compute inefficiency for each individual input and output, enabling the evaluation of both input- and output-specific inefficiency as well as overall environmental efficiency.
Unlike SBM, which adjusts inputs and outputs independently, NDDF evaluates the joint ecological transformation by simultaneously expanding desirable ecological services and reducing pollution along the same directional path. This approach provides a theoretically coherent framework for identifying ecological performance advantages and plays a central role in the robustness analysis of our study.
2.3 Meta-frontier Malmquist-Luenberger Productivity Index
Chung et al. (1997) introduced the directional distance function (DDF) and developed the Malmquist–Luenberger Productivity Index (MLPI) to incorporate undesirable outputs such as pollutant emissions into productivity measurement. This integration provides the conceptual foundation for assessing GTFP. To address technological heterogeneity across groups, Oh (2010) further developed the MMLPI, which compares each DMU against both its group-specific frontier and a common meta-frontier enveloping all group-specific technologies.
In this study, the 30 provinces are grouped into four regional technological regimes—Eastern, Central, Western, and Northeastern China, following the official classification of the National Bureau of Statistics. These groups reflect systematic differences in economic development, forest resource endowments, and technology adoption. For each region, a group-specific production frontier is estimated using the region’s own input–output technology, and the national meta-frontier is constructed as the convex hull that envelopes all group frontiers. This hierarchical structure allows the decomposition of productivity changes into within-group technological progress and shifts in the technological gap relative to the national best-practice frontier.
The MMLPI decomposes into three components (Zhang and Du, 2023): technical efficiency change (EC), best-practice gap change (BPC), and technical gap change (TGC), as formally expressed in Equation 5:
where x denotes factor inputs, y represents desirable outputs, and b signifies undesirable outputs. The superscripts carry distinct technological references: G indicates the meta-frontier technology, I denotes the inter-temporal group-specific frontier technology, and t signifies period-specific production technology.
-
Technical efficiency change (EC) measures the extent to which DMU approaches its group-specific best practice frontier, capturing the “catching-up” effect relative to the group frontier. Values greater than 1 indicate an improvement in efficiency, a value of 1 indicates no change, and values less than 1 indicate a decline.
-
Best-practice gap change (BPC) describes how the gap between the contemporaneous group frontier and the inter-temporal group frontier evolves from period t to t + 1. It indicates whether the group’s currently observed best-practice technology is advancing toward its long-run technological potential or falling behind it. A value of BPC greater than 1 implies that the group’s best-practice frontier is moving closer to its inter-temporal benchmark, a value equal to 1 implies stability, and a value less than 1 indicates a deterioration in the group’s best-practice position.
-
Technical gap change (TGC) captures the change, from period t to t + 1, in the ratio between the inter-temporal group frontier and the common meta-frontier. It reflects the dynamic evolution of the technological gap between a specific group and the overall best-practice technology. A TGC value greater than 1 indicates that the group is moving closer to the meta-frontier, a value equal to 1 indicates no change, and a value less than 1 indicates a growing distance from the meta-frontier.
Collectively, EC, BPC, and TGC contribute to MMLPI, representing overall green total factor productivity change. For MMLPI, values greater than 1 indicate improvement, values equal to 1 indicate no change, and values less than 1 indicate decline. The adoption of a common meta-frontier accounts for technological heterogeneity across different groups, providing a framework that aligns with the practical realities of China’s forestry economy.
Although both TFP and GTFP are evaluated within the same MMLPI framework, the two indices are constructed based on different production technologies. The TFP index relies solely on a market-output technology set, while the GTFP index accounts for ecological output (FCS) and undesirable emissions. Consequently, the two MMLPI indices are numerically comparable because they share an identical meta-frontier structure, decomposition system, and benchmarking method. However, they must be interpreted separately, as each represents a distinct definition of productivity. This comparability enables an analysis of the divergence between conventional productivity and green productivity, which is central to this study.
2.4 Data and variable description
To construct the provincial panel dataset for the period 2000–2020, this study incorporates input and output variables that reflect both the production performance and environmental externalities of China’s forestry sector. Owing to data constraints, Hong Kong, Macau, Taiwan, and Tibet were excluded from the sample. The remaining 30 provinces are grouped into four regions. A detailed list of provinces and municipalities within each region is provided in Table A1.
The input set comprises capital (K), labor (L), forest land (FL), and energy (E), while the outputs consist of desirable outputs including forestry GDP(Y) and FCS and undesirable outputs including CO₂ and PM2.5 emissions. All data are drawn from authoritative statistical yearbooks, official forest resources inventory reports, and internationally recognized databases such as CEADS (Shan et al., 2016; Shan et al., 2018; Shan et al., 2020; Guan et al., 2021; Xu et al., 2024) and TAP (Xiao et al., 2020; Geng et al., 2021; TAP, 2025), thereby ensuring reliability, consistency, and comparability across provinces. A detailed summary of the variables, definitions, and data sources is provided in Table A2.
Due to the absence of officially reported sector-level energy consumption and pollutant emissions for forestry at the provincial scale, this study adopts a proportional allocation approach that has been widely used in the literature. Specifically, forestry energy use and emissions are estimated as provincial totals multiplied by the share of forestry GDP in regional GDP. This approach assumes that sectoral energy use and emissions are proportional to economic output and provides a feasible approximation under current data constraints. While this method may introduce measurement uncertainty, it allows consistent interprovincial and intertemporal comparisons within a unified framework.
FCS is constructed based on provincial forest growing stock data following the stock-based carbon accounting framework recommended by the IPCC (2006). Forest growing stock data are obtained primarily from successive rounds of China’s National Forest Resources Inventories, which follow unified national technical standards and ensure consistency and comparability across provinces and forest types. In particular, the Ninth National Forest Resources Inventory reports both forest growing stock and provincial forest carbon stock, allowing the derivation of province-specific biomass carbon conversion coefficients. These coefficients are then applied to the growing stock series to estimate FCS over time. This approach has been widely adopted in forest carbon assessment studies (Fang et al., 2001; Pan et al., 2011; Zhang et al., 2022). A detailed description of the estimation procedure for forest carbon stock (FCS) is provided in Supplementary section 1, while the descriptive statistics of forest resources and carbon conversion coefficients are reported in Supplementary Table S2.
Figure 1 synthesizes the core concepts, variables, and methodologies outlined in this chapter into a cohesive analytical framework. It visually depicts the transition from a conventional economic growth model, constrained by resources and environment, to a green growth paradigm central to this study.
Figure 1

Analytical framework for evaluating forestry green development.
2.5 Methodological integration: rationale for using SBM, NDDF, and MMLPI
The three methodological components used in this study (SBM, NDDF, and MMLPI) provide complementary insights into forestry efficiency and productivity. The SBM model identifies market versus ecological efficiency by estimating slack variables for each input and output and aggregating the corresponding inefficiency measures into a composite inefficiency index. It offers an intuitive benchmark for separating economic performance from ecological performance.
The NDDF model extends the analysis by jointly expanding desirable outputs and contracting undesirable outputs along a directional vector. This framework is theoretically consistent with environmentally oriented production technology and allows a direct assessment of ecological efficiency.
Importantly, NDDF also supports a key robustness exercise: by re-estimating ecological efficiency with and without FCS, it becomes possible to quantify the incremental ecological contribution of FCS. This design ensures that FCS is not treated as merely one output among many, but rather as a structural mechanism shaping ecological efficiency.
The MMLPI captures dynamic productivity changes and regional differences in technological regimes. By decomposing TFP and GTFP into efficiency change and technological progress under heterogeneous frontiers, it connects static efficiency patterns with long-term productivity trajectories.
Together, these methods form an integrated analytical system: SBM provides baseline efficiency and input–output diagnostics; NDDF refines ecological evaluation and explicitly quantifies the contribution of FCS; and MMLPI links static performance to dynamic productivity while capturing regional heterogeneity. This integration enables a systematic and robust assessment of China’s forestry green development. Across all methods, FCS functions as the ecological pivot: it enlarges slack-based ecological efficiency in SBM, enables a targeted robustness test in NDDF through the with/without-FCS comparison, and drives the divergence between TFP and GTFP in the MMLPI decomposition. All empirical estimations in this study, including SBM, NDDF, and MMLPI, were implemented in Stata 18 using the computational procedure of Wang et al. (2022).
3 Empirical research results
3.1 Descriptive analysis
3.1.1 Inputs characteristics
The descriptive statistics of input factors across provinces during 2000–2020 are presented in Supplementary Table S3 and Figures 2, 3. Overall, K expanded markedly (32.1%), E consumption rose steadily (14.19%), and FL showed mild growth (2.08%), while L input declined persistently (−1.64%). This input structure indicates a rising share of capital and energy relative to labor across provinces.
Figure 2
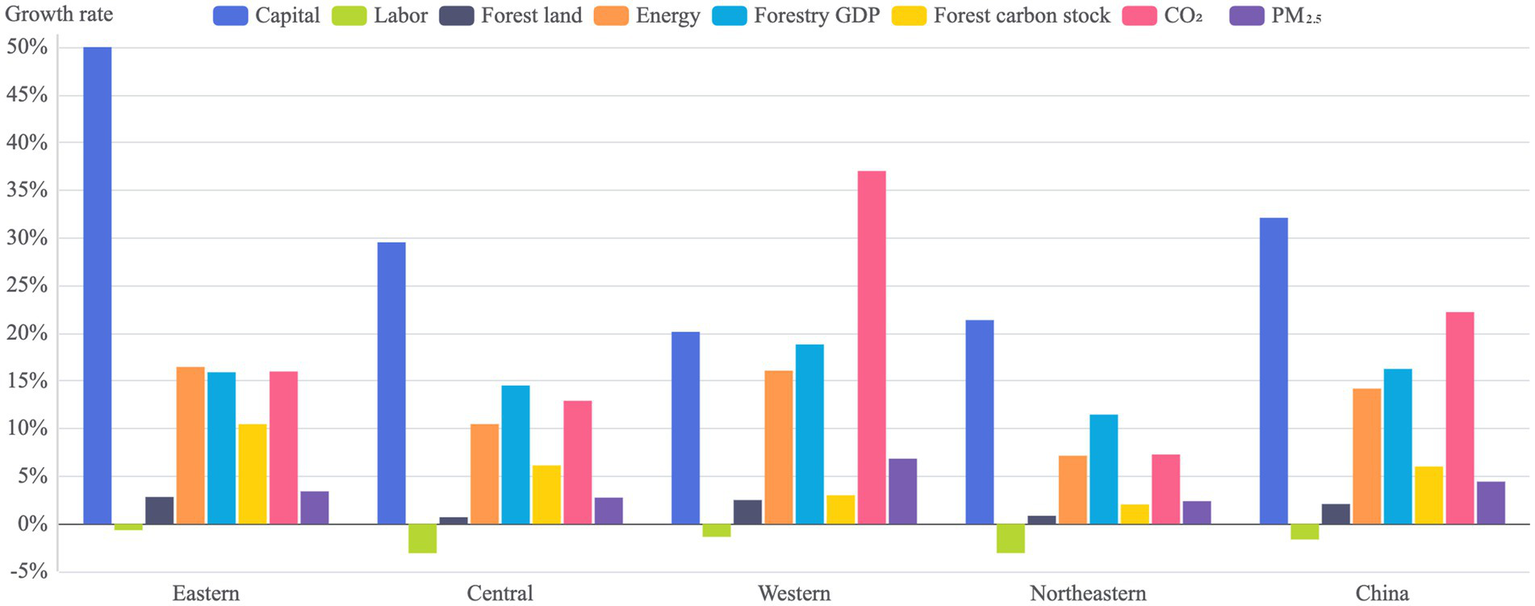
Average growth rates of inputs and outputs, 2000–2020.
Figure 3

Proportions in the national total of inputs and outputs, 2000–2020.
Regionally, the most rapid capital growth occurred in the eastern provinces (50.02%), while the western provinces absorbed nearly half of national K investment (49.53%). L contraction was concentrated in the central and northeastern regions, which together accounted for nearly 70% of national forestry employment, with annual declines exceeding 3%. FL expansion in these regions remained below 1%, suggesting that cultivable forestland resources are nearing saturation. E consumption growth in the central and western regions exceeded the national average by more than two percentage points, whereas the northeastern region showed only marginal increases. These patterns summarize the input allocation characteristics of China’s forestry sector across regions.
3.1.2 Outputs characteristics
Outputs exhibited simultaneous economic and ecological growth, accompanied by rising environmental pressures (Supplementary Table S3 and Figure 2). Y increased by 16.25%, FCS rose by 6.01%, while CO₂ emissions surged by 22.21% and PM2.5 emissions by 4.43%. The disparity between economic growth, ecological gains, and emissions growth indicates differing trends among desirable and undesirable outputs.
The western region recorded the fastest expansion in Y, exceeding the national average by over 2%, but also experienced disproportionate CO₂ emission growth of 37.01%, which is 66.6% above the mean. This pattern indicates potential relocation of pollution-intensive industries and relatively weaker environmental governance. Encouragingly, FCS increased at nearly three times the rate of forest land expansion (6.01% versus 2.08%), reflecting improvements in forest stocking and quality. Eastern provinces exhibited above-average FCS growth, 42.5% higher than the national mean, while the western and northeastern regions contributed 50.01 and 23.28% of national FCS, respectively, highlighting their ecological significance. Although PM2.5 emissions grew more moderately than CO₂, they represent a notable environmental externality, particularly in the eastern and central regions where industrial activities are concentrated. These patterns summarize the regional characteristics of forestry outputs.
3.1.3 Descriptive analysis from an input–output perspective
From a combined input and output perspective (Figures 2, 3), the eastern region exhibited markedly higher efficiency. It utilized only 22.03% of K, 13.18% of L, and 14.59% of FL, yet generated 49.02% of Y and achieved the fastest growth in FCS. In contrast, the western region relied on 55.18% of FL and nearly half of total K, but contributed just 20.05% of Y while showing relatively high emission intensity. These disparities reflect interregional factor misallocation and highlight potential inefficiencies associated with policy-driven K allocation. Patterns in PM2.5 emissions further emphasize this contrast: The east achieved strong growth in Y and FCS while maintaining moderate increases in emissions, whereas the west faced rising PM2.5 burdens despite lagging economic performance. The combined input–output perspective outlines the relative levels of inputs, outputs, and emissions across regions.
3.2 Efficiency analysis (H1–H2)
3.2.1 Market efficiency versus ecological efficiency (SBM)
SBM was used to calculate market efficiency (ME) and ecological efficiency (EE) for 30 provinces in eastern, central, western, and northeastern China from 2000 to 2020. Efficiency scores were obtained under both constant returns to scale (CRS) and variable returns to scale (VRS) assumptions, with VRS results reported in the main text. Provincial values are provided in the Supplementary material. ME and EE scores range between 0 and 1, where higher values indicate closer proximity to the production frontier. The efficiency measures were also decomposed to identify the contribution of individual inputs and outputs. Summary national and regional results are presented below.
As shown in Table 1 and Figure 4, the national average ME under VRS was 0.34, compared to EE, which averaged 0.67. Overall, efficiency was suboptimal, with ME particularly low. In contrast, EE showed substantial improvement. Decomposition analysis indicated that this increase was driven primarily by reduced E input, enhanced FCS, and lower CO₂ and PM2.5 emissions (as shown in Supplementary Table S6). These findings provide preliminary support for the Porter Hypothesis, suggesting that accounting for environmental factors is linked to improved efficiency scores, which may reflect the compensatory effects of green innovation.
Table 1
| Region | ME (SBM) | EE (SBM) | EE with FCS (NDDF) | EE without FCS (NDDF) |
|---|---|---|---|---|
| Eastern | 0.73 | 0.89 | 0.87 | 0.87 |
| Central | 0.24 | 0.42 | 0.70 | 0.65 |
| Western | 0.1 | 0.56 | 0.73 | 0.54 |
| Northeastern | 0.15 | 0.80 | 0.90 | 0.61 |
| China | 0.34 | 0.67 | 0.79 | 0.68 |
Regional market efficiency (ME) and ecological efficiency (EE) under SBM and NDDF with and without forest carbon stock.
Figure 4

Comparison between market efficiency (ME) and ecological efficiency (EE) based on SBM. (a) Market efficiency (ME); (b) Ecological efficiency (EE).
Regionally, the east demonstrated the highest ME, setting the national benchmark in factor utilization and output efficiency, followed by the west, central, and northeast. Inefficiency in the west was mainly due to poor performance in K and Y, whereas market inefficiency in the northeast stemmed primarily from ineffective use of L. This is notable given that the northeast employs 36.54% of the national L, suggesting that institutional factors in state-owned forest farms likely contribute to inefficiency.
Relative to ME, overall efficiency under EE nearly doubled, with particularly high efficiency observed in FCS and Y. This implies that conventional assessments may underestimate forestry value if environmental benefits are omitted, emphasizing the importance of Green GDP and Gross Ecosystem Product accounting. The primary limitation of ME lies in the inefficiency of K and L, indicating that optimizing the allocation and utilization of these factors is a key pathway to improving EE.
At the regional level, the east maintained its lead, particularly in Y, while the northeast exhibited EE nearly 5.3 times higher than ME, driven by optimal FCS efficiency. The west also recorded notable gains due to its substantial contribution to national FCS (50.01%), though Y efficiency remained below the national average. The central region’s low EE was mainly attributable to inefficiencies in K and L, combined with suboptimal performance in energy use and emissions control.
3.2.2 Robustness check of ecological efficiency (NDDF)
The NDDF, characterized by non-radial adjustments and incorporating the assumptions of weak disposability and null jointness, explicitly models the trade-off between desirable and undesirable forest outputs while recognizing the inevitability of pollutant emissions in economic production. These assumptions are more consistent with the realities of forestry production. In this way, the NDDF addresses a limitation of the SBM, which lacks explicit economic foundations, while also serving as a robustness check for the SBM-based results. Unlike SBM, where inefficiency is derived from independent slack adjustments, NDDF evaluates the joint expansion of ecological outputs and the contraction of undesirable emissions along a theoretically grounded directional vector. This mechanism allows NDDF to capture ecological performance advantages that remain muted or undetected in the SBM framework.
At the national level, the average ecological efficiency (EE) estimated by the NDDF reached 0.79 (Table 1), considerably higher than the EE of 0.67 derived from the SBM. This indicates that the NDDF framework provides a more optimistic assessment of forestry efficiency once environmental constraints are taken into account. More importantly, the difference is not only numerical: NDDF explicitly considers the joint expansion of ecological outputs, such as FCS, and the contraction of undesirable emissions, thereby capturing systematic ecological advantages that SBM, which treats all outputs symmetrically, does not emphasize.
Regional comparisons reveal several important differences between the two approaches. Under the SBM framework, the eastern region recorded the highest EE (0.89), while the central region performed the worst at 0.42. In contrast, the NDDF results show that the northeastern region achieved the highest EE of 0.90, overtaking the eastern region (0.87). This shift is largely explained by higher efficiencies in FL utilization and FCS output in the northeast. Although the east maintained strong performance in Y, its relatively lower FCS and PM2.5 efficiencies reduced its overall advantage. The central region’s EE of 0.70 remained the lowest among the four regions, though it was only slightly lower than the western region’s 0.73. This suggests that regional disparities in efficiency are substantially smaller under the NDDF framework than under the SBM. These systematic rank reversals highlight that NDDF is more sensitive to ecological output intensity and pollutant reduction capacity, whereas SBM tends to favor regions with strong market output performance.
The decomposition of single inputs and outputs further illustrates the structural differences between the two methods. According to SBM results (see Supplementary Table S7), the primary contributors to EE at the national level were Y and FCS, both with efficiency scores close to unity. CO₂ and PM2.5 also exceeded 0.8, reflecting relatively effective pollution control. By contrast, K recorded the lowest efficiency (0.66), suggesting the presence of ineffective investment or resource misallocation. L and E efficiency were also below 0.8, thereby constraining overall performance.
The NDDF decomposition (see Supplementary Table S8) presents a different pattern. EE was mainly supported by FL, E, and Y, with average efficiencies of 0.93, 0.89, and 0.85, respectively. However, K efficiency remained weak at 0.64, and PM2.5 efficiency was also low at 0.65, indicating persistent challenges in capital allocation and particulate pollution control. Collectively, these patterns demonstrate that NDDF highlights ecological strengths, such as forestland and carbon-related outputs, more prominently than SBM. This confirms that NDDF does not merely replicate SBM results but adds a theoretically consistent ecological perspective that clarifies regional structural differences in green performance.
3.2.3 Comparison of ecological efficiency with and without FCS (NDDF)
To further clarify the role of FCS, it was excluded as a desirable output in an alternative specification (Table 1). The national average EE then declined markedly to 0.68 (Figure 5). This exclusion led to an overestimation of E efficiency (0.96) and a systematic underestimation of other inputs and outputs, particularly FL (0.61) and Y (0.63). Regionally, the northeastern region’s EE fell sharply from 0.90 to 0.61, underscoring its heavy reliance on FCS. As China’s primary natural forest region, the Northeast China (encompassing Liaoning, Jilin, and Heilongjiang provinces) harbors a forest area of 5.86 × 10⁶ km2, which accounts for 27% of the total national forest area. Additionally, the forest growing stock in this region reaches 4.6 × 10⁸ m3, contributing 26% to the national total forest growing stock. Given this ecological significance, neglecting FCS would lead to a serious underestimation of forestry efficiency in this region. These results confirm the pivotal role of FCS: the ecological services provided by forests not only enhance economic efficiency but also improve overall environmental performance.
Figure 5
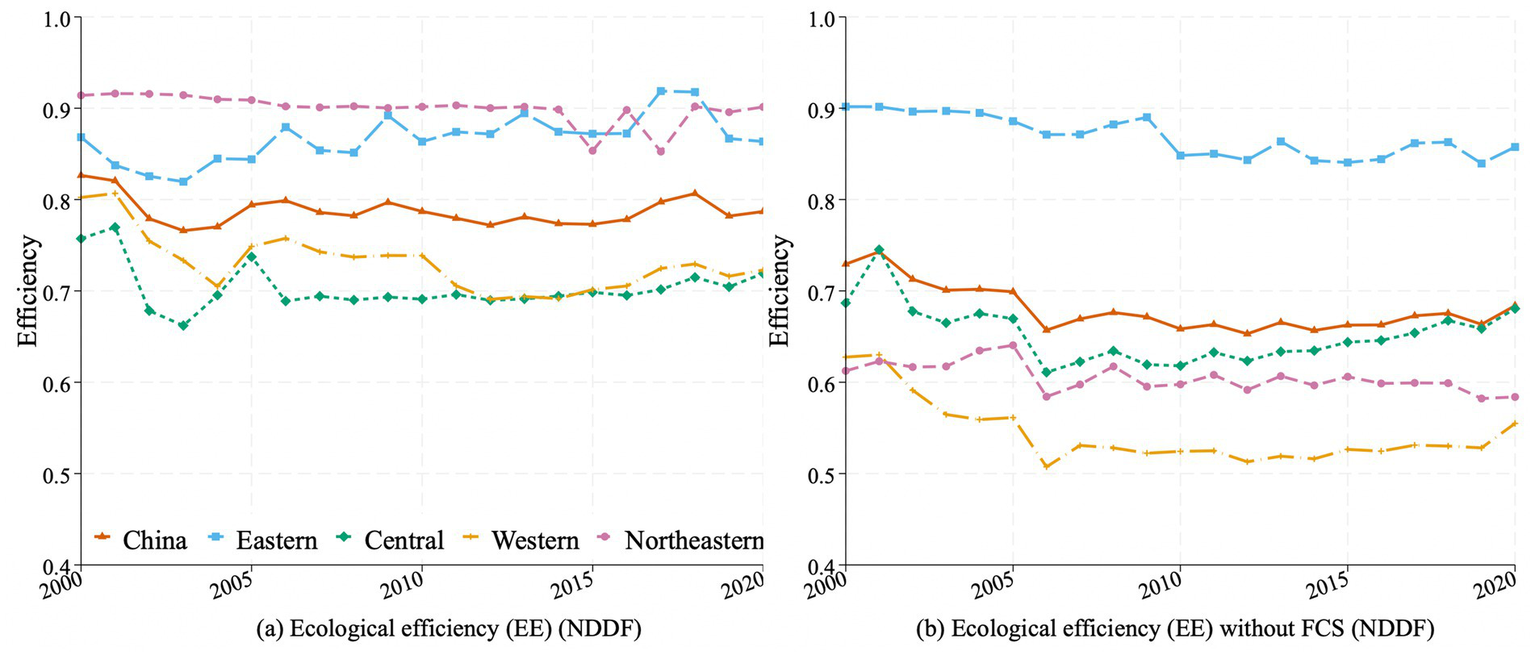
Comparison of ecological efficiency with and without forest carbon stock (FCS) based on NDDF. (a) Ecological efficiency (EE); (b) Ecological efficiency (EE) without FCS.
Despite methodological differences, both the SBM and NDDF approaches offer complementary insights into forestry efficiency. Each confirms that the environmental efficiency of the forestry sector exceeds its market efficiency, underscoring the significant contribution of forest carbon sinks to environmental performance. These findings reflect the critical role of the forestry sector in FCS, energy conservation and emission reduction. Moreover, both methods consistently identify inefficient forestry investment in China as a key factor limiting efficiency.
At the same time, these approaches are limited to static efficiency assessments, as they measure provincial deviations from contemporaneous production frontiers without accounting for technological progress or shifts in the frontier over time. To address this limitation, the following section applies the MMLPI to evaluate dynamic changes in GTFP and TFP.
3.3 Productivity analysis (H3–H4)
3.3.1 National-level trends in GTFP and TFP
To address interregional technological heterogeneity in China, the MMLPI was used to measure GTFP and compare it with conventional TFP. In TFP, inputs are K, L, and FL with Y as the output. GTFP expands this by including E as an input, adding FCS as a desirable output, and treating CO₂ and PM2.5 as undesirable outputs. This approach yields a productivity measure that explicitly accounts for ecological factors.
As shown in Table 2 and Figure 6, China’s GTFP in the forestry sector exhibited only modest growth between 2000 and 2020, with the MMLPI index fluctuating around unity, indicating limited environmentally sensitive productivity improvements. In contrast, conventional TFP increased by roughly 11% annually over the same period, highlighting that measured productivity gains decline substantially when environmental factors are incorporated. This aggregate trend, however, masks significant regional heterogeneity. For a detailed breakdown of provincial MMLPI and its components over time, see Supplementary Tables S10–13.
Table 2
| Area | GTFP | TFP | ||||||
|---|---|---|---|---|---|---|---|---|
| MMLPI | EC | BPC | TGC | MMLPI | EC | BPC | TGC | |
| Eastern | 1.02 | 1.00 | 1.02 | 1.00 | 1.10 | 1.01 | 1.14 | 1.00 |
| Central | 1.01 | 1.00 | 1.01 | 1.01 | 1.08 | 1.00 | 1.04 | 1.09 |
| Western | 1.00 | 1.00 | 1.01 | 1.00 | 1.15 | 1.05 | 1.09 | 1.11 |
| Northeastern | 1.00 | 1.00 | 1.00 | 1.00 | 1.07 | 1.03 | 1.04 | 1.05 |
| China | 1.01 | 1.00 | 1.01 | 1.00 | 1.11 | 1.03 | 1.09 | 1.06 |
Means of Meta-frontier Malmquist–Luenberger Productivity Index (MMLPI) and its components, 2000–2020.
Figure 6
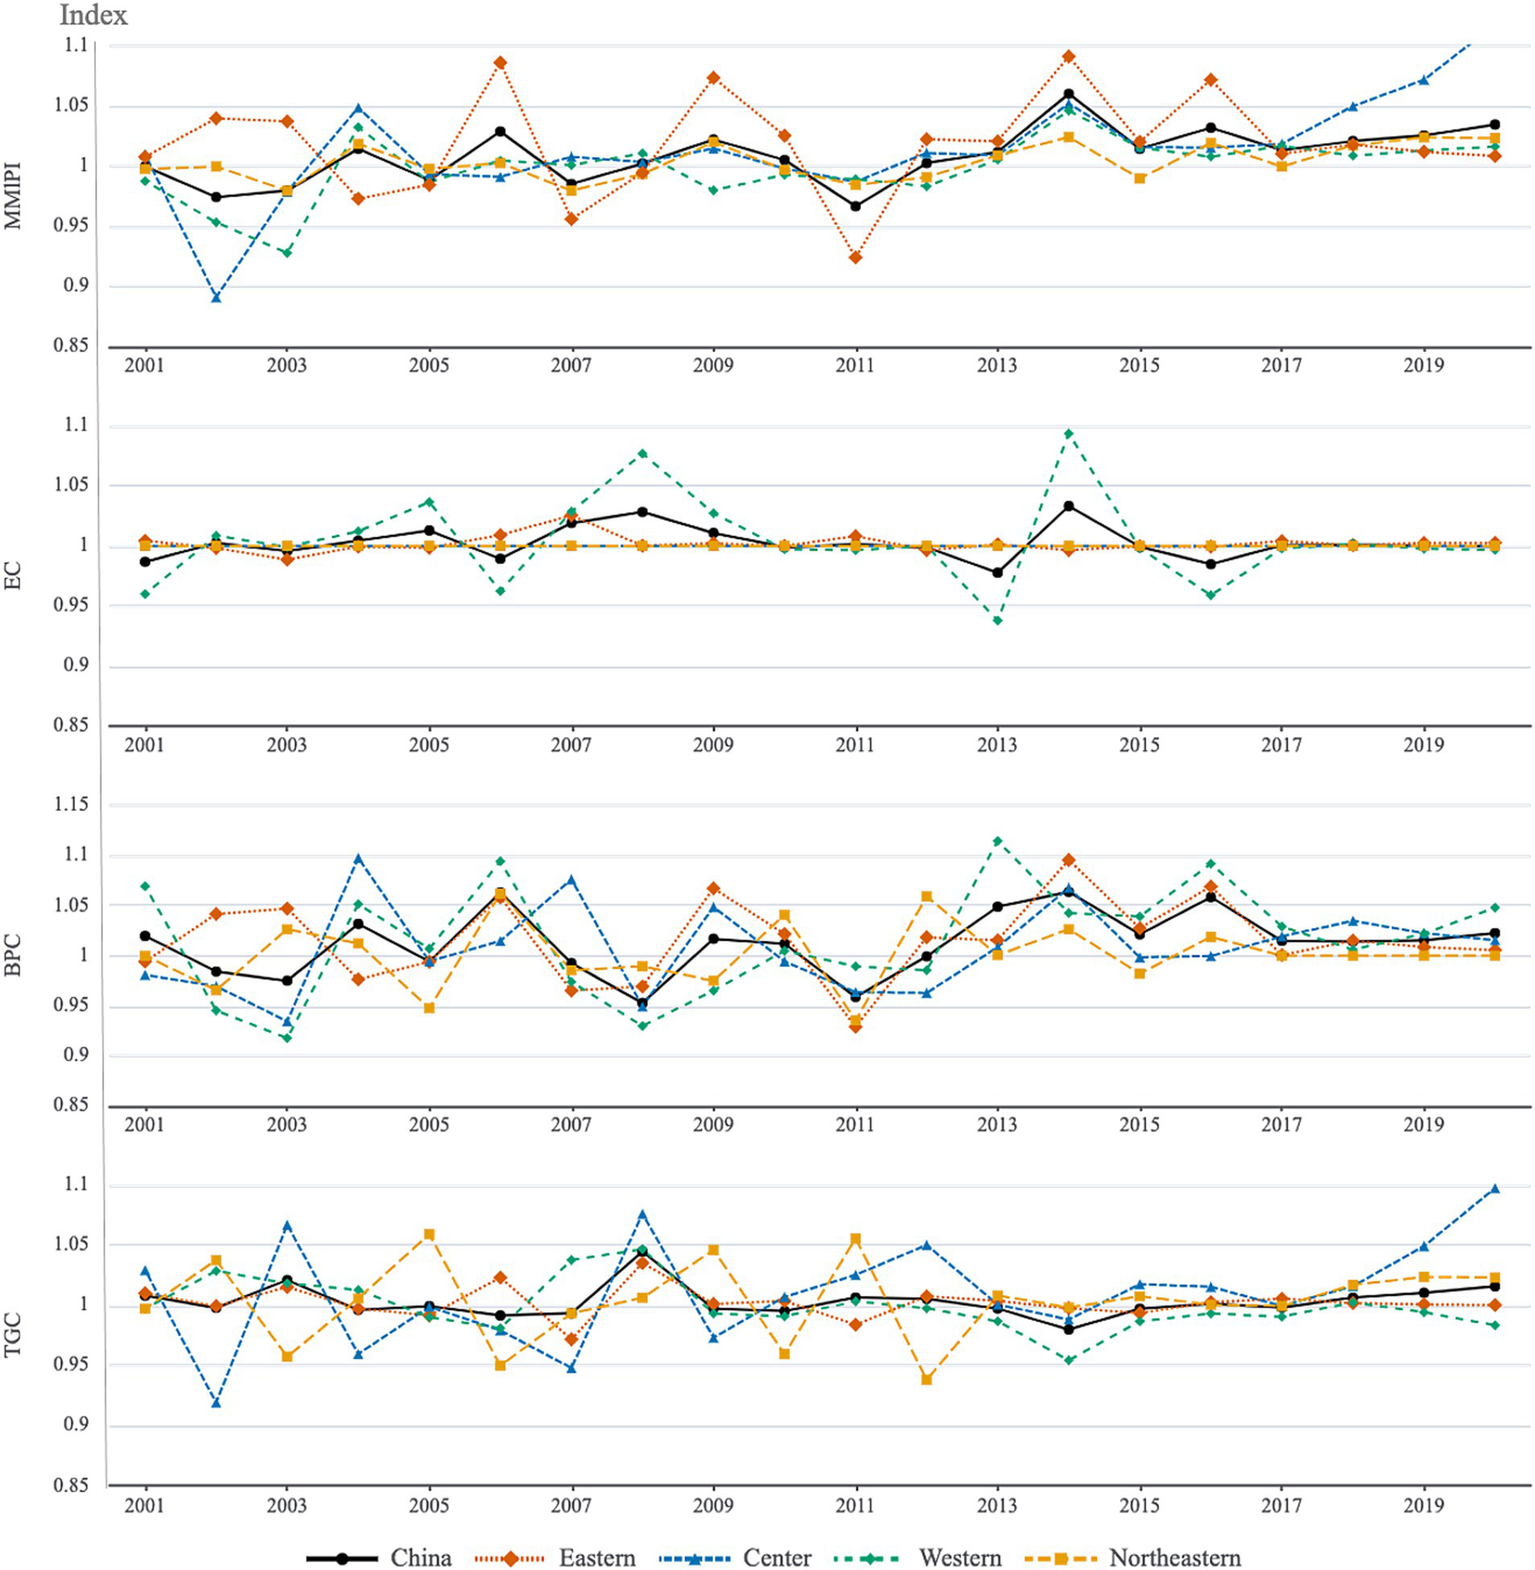
Average Meta-frontier Malmquist–Luenberger Productivity Index (MMLPI) of green total factor productivity (GTFP) and its decomposition by region, 2000–2020.
Decomposition of conventional TFP (Table 2; Figure 7) reveals that its growth was driven by EC, BPC and TGC, with BPC representing technological progress contributing approximately 9%. In the GTFP framework, however, growth is almost entirely attributable to frontier shifts, with BPC contributing only around 1% and EC being negligible. This pattern indicates that while technological advancement at the frontier plays a key role, efficiency improvements fail to translate into environmentally sensitive productivity gains. The growth rate of China’s forestry GTFP is therefore markedly lower than that of conventional TFP. Several factors may help explain this underperformance in the Chinese context.
Figure 7
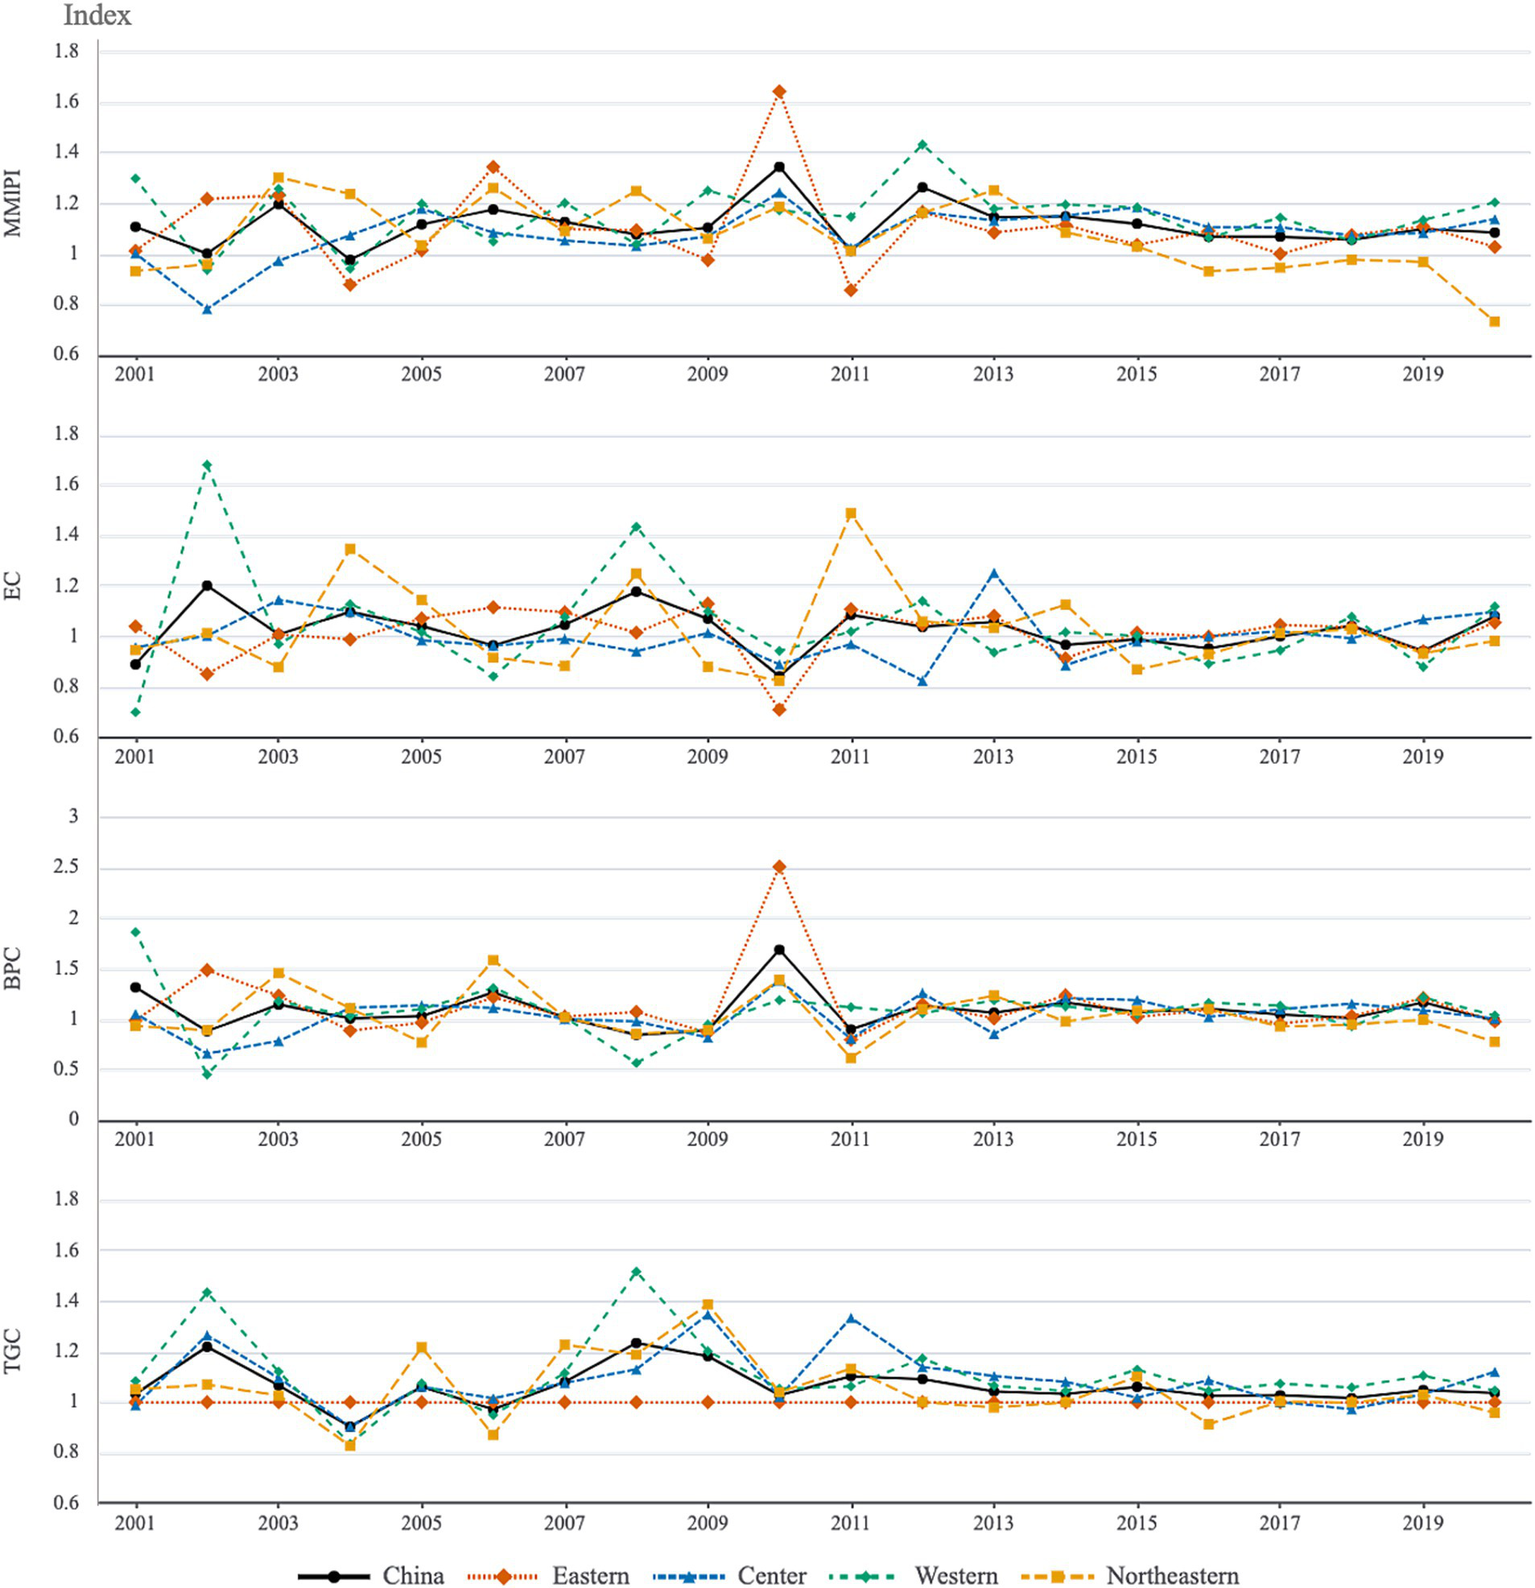
Average Meta-frontier Malmquist–Luenberger Productivity Index (MMLPI) of conventional total factor productivity (TFP) and its decomposition by region, 2000–2020.
First, ecological outputs are inherently rigid and slow to develop. From 2000 to 2020, Y grew on average about 16% per year, driven by strong technological progress and investment. By comparison, FCS increased at roughly 6% per year, far below the economic growth rate. This disparity reflects the long time horizons of forest growth and resource constraints that delay increases in ecological outputs. Under these conditions, the environmental production frontier advances only slowly relative to the economic output frontier.
Second, compliance and ecological investments can crowd out production inputs. In our data, K grew about 32% per year, roughly double the output growth rate. This suggests that a large share of resources went to pollution control and ecosystem restoration rather than to immediate market output. Such spending, while environmentally necessary, has limited productivity returns and effectively reallocates inputs away from conventional production. The resulting crowding effect suppresses productivity.
Third, green technological innovation and efficiency gains appear insufficient. Our decomposition shows almost no efficiency change in GTFP, indicating limited improvement in factor allocation given each region’s technology. The large gap between GTFP’s BPC (around 1.01) and conventional TFP’s (around 1.09) further confirms that advances in clean forestry technologies have lagged far behind overall technical progress. Concurrently, trends in energy use and emissions indicate rising energy and carbon intensity in forestry, highlighting shortcomings in energy saving and emission reduction innovation.
Finally, institutional and measurement limitations may bias GTFP estimates downward. Market mechanisms for valuing forest ecosystem services are still immature, and current accounting systems tend to understate ecological outputs. Forest carbon monitoring and ecological benefit estimation are improving but remain imperfect. These factors likely cause us to undercount true environmental outputs.
3.3.2 Regional disparities in forestry productivity
As shown in Figure 6, significant regional disparities are also evident. The Eastern region consistently led GTFP growth, whereas the Western and Northeastern regions experienced stagnation or even decline in the late 2010s. These dynamics indicate that GTFP gains are mainly concentrated in technologically advanced provinces, while lagging regions remain constrained by limited efficiency improvements and weaker environmental performance.
Our results show that Eastern provinces achieved about 2% annual GTFP growth, driven by strong BPC shifts, effectively defining the national meta-frontier. Central China saw about 1% GTFP growth, indicating balanced gains in efficiency and ecological output. In contrast, Western and Northeastern regions exhibited near zero GTFP change. Notably, Western China’s approximately 15% TFP growth coincided with a 37% rise in carbon emissions and only a small share of national Y output, reflecting an extensive, emission-intensive development model. These patterns suggest that less developed provinces have followed an extensive growth path with weaker environmental regulation, possibly relocating pollution intensive activities to those regions.
To further substantiate regional disparities and identify their sources, Kruskal–Wallis tests were conducted (Table 3). Results confirm significant regional variation in both GTFP and TFP indices at the 1% level. Their TGC components also displayed significant disparities (5 and 1% levels, respectively), whereas EC and BPC did not differ significantly across regions. This suggests that productivity disparities, whether green or conventional, are not driven by differences in efficiency change or frontier shifts, but rather by uneven capacities to narrow the technology gap. Such divergence likely reflects heterogeneity in regional innovation endowments, policy support, and the diffusion of green technologies. Moreover, GTFP appears particularly dependent on policy incentives and market-driven adoption of ecological technologies, such as FCS. This dependency may exacerbate disparities in TGC, thereby amplifying regional imbalances in green productivity. Advancing regional TGC, especially through the assimilation and diffusion of frontier green technologies, thus emerges as a critical pathway for narrowing disparities in both GTFP and conventional TFP.
Table 3
| Indicator | GTFP | TFP | ||||||
|---|---|---|---|---|---|---|---|---|
| MMLPI | EC | BPC | TGC | MMLPI | EC | BPC | TGC | |
| KW statistics | 30.33*** | 1.78 | 5.46 | 10.19** | 18.00*** | 2.16 | 5.46 | 48.23*** |
| p-value | 0.000 | 0.62 | 0.14 | 0.02 | 0.00 | 0.54 | 0.14 | 0.00 |
Kruskal–Wallis test for regional green total factor productivity (GTFP) and conventional total factor productivity (TFP) and their components.
H0: The Eastern Area = The Central Area = The Western Area = The Northeastern Area; ***, **, and * represent significance at the 1%, 5%, and 10% level, respectively.
Analysis of provincial-level average MMLPI values of GTFP and TFP (Figure 8) reveals distinct developmental trajectories across China’s forestry sector. The figure reports the mean GTFP MMLPI for each province over 2000–2020, highlighting substantial interprovincial variation. Provinces with relatively higher GTFP performance include Shanxi and several eastern provinces such as Jiangsu, Anhui, Shanghai, Zhejiang, and Shandong. By contrast, Ningxia and Qinghai exhibit persistently low GTFP levels, consistent with their long-term stagnation. Shanxi, Jiangsu, Shandong, Beijing, Anhui, and Shanghai show the strongest GTFP improvements over the sample period (Table 4), reflecting sustained green productivity gains.
Figure 8
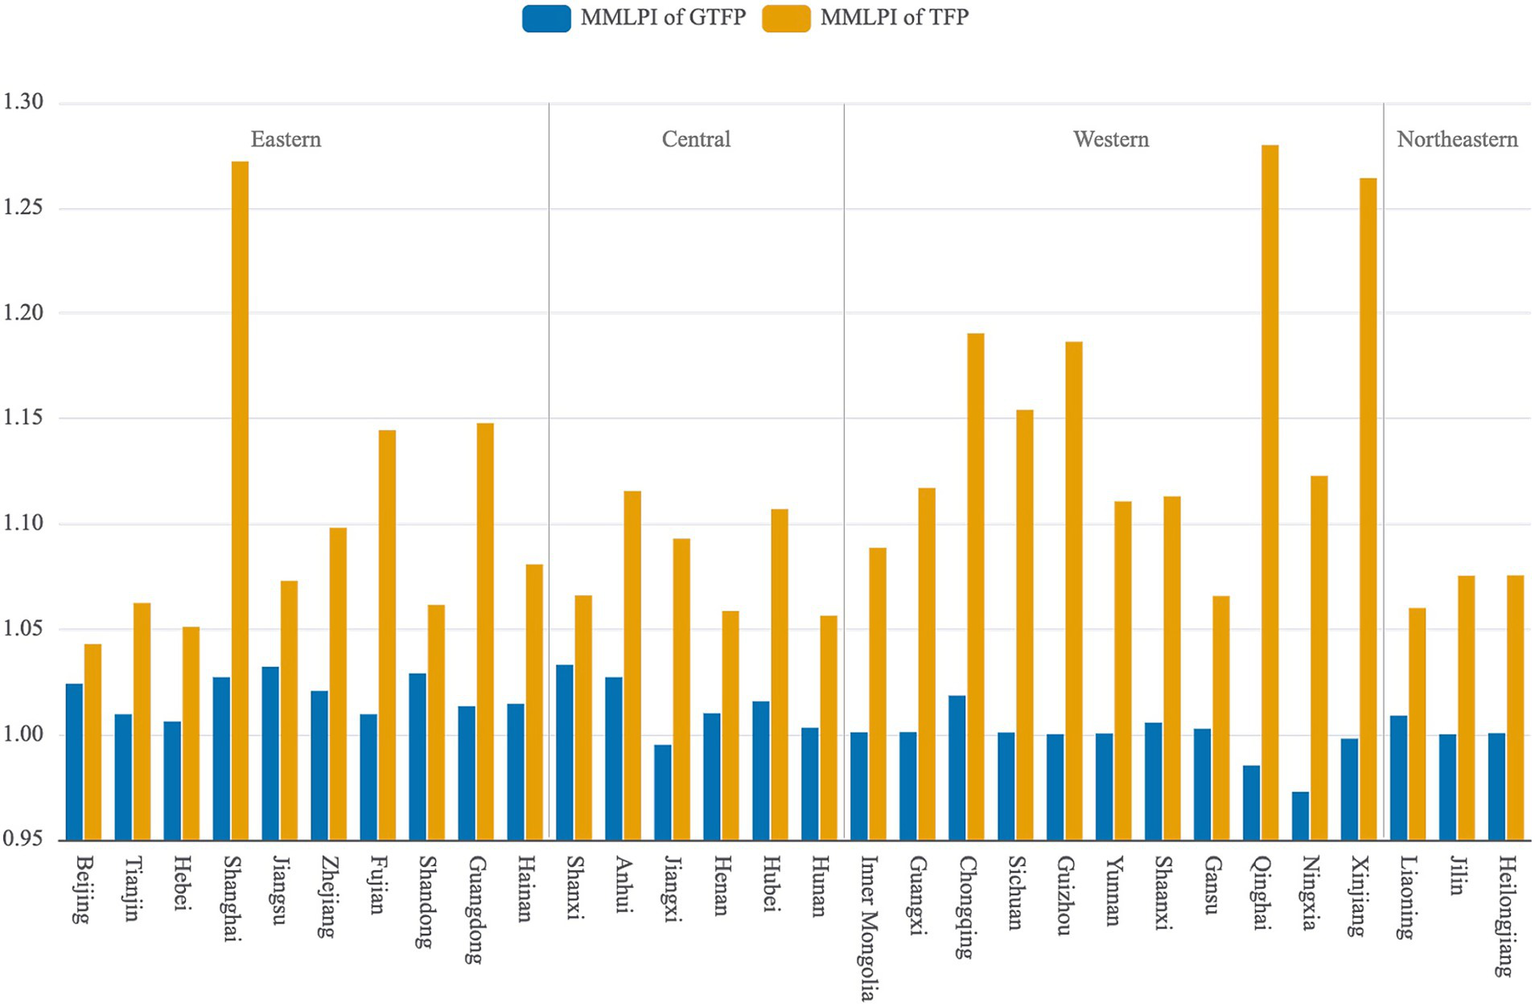
Average provincial MMLPI of green and conventional total factor productivity in China’s forestry sector, 2000–2020.
Table 4
| Rank | Top10 | GTFP | Bottom10 | GTFP | Top10 | TFP | Bottom10 | TFP |
|---|---|---|---|---|---|---|---|---|
| 1 | Shanxi | 1.03 | Ningxia | 0.97 | Qinghai | 1.28 | Beijing | 1.04 |
| 2 | Jiangsu | 1.03 | Qinghai | 0.99 | Shanghai | 1.27 | Hebei | 1.05 |
| 3 | Shandong | 1.03 | Jiangxi | 1.00 | Xinjiang | 1.26 | Hunan | 1.06 |
| 4 | Anhui | 1.03 | Xinjiang | 1.00 | Chongqing | 1.19 | Henan | 1.06 |
| 5 | Shanghai | 1.03 | Jilin | 1.00 | Guizhou | 1.19 | Liaoning | 1.06 |
| 6 | Beijing | 1.02 | Guizhou | 1.00 | Sichuan | 1.15 | Shandong | 1.06 |
| 7 | Zhejiang | 1.02 | Yunnan | 1.00 | Guangdong | 1.15 | Tianjin | 1.06 |
| 8 | Chongqing | 1.02 | Heilongjiang | 1.00 | Fujian | 1.14 | Gansu | 1.07 |
| 9 | Hubei | 1.02 | Sichuan | 1.00 | Ningxia | 1.12 | Shanxi | 1.07 |
| 10 | Hainan | 1.01 | Inner Mongolia | 1.00 | Guangxi | 1.12 | Jiangsu | 1.07 |
Top and bottom 10 provinces by average Meta-frontier Malmquist–Luenberger Productivity Index (MMLPI) for green and conventional total factor productivity (GTFP and TFP), 2000–2020.
Figure 8 also reports provincial average MMLPI values of conventional TFP. Compared with GTFP, TFP displays a wider and more dispersed distribution across provinces. Table 4 shows that provinces with persistently low TFP are concentrated in certain regions, whereas high TFP is observed in Xinjiang, Qinghai, Sichuan, Guizhou, and several southern provinces. This pattern indicates that some provinces have achieved substantial gains in conventional productivity, even though their progress in environmental efficiency, as reflected in GTFP, remains limited. These provinces therefore exhibit a typical economy-driven growth pattern.
A direct comparison between provincial GTFP and TFP averages in Figure 8 reveals a clear structural mismatch. Some provinces rank highly in green productivity but only moderately in traditional productivity, while others exhibit strong TFP growth with relatively weak GTFP performance. This heterogeneity highlights the diversity of development paths within China’s forestry sector and underscores the necessity of adopting differentiated policy strategies to balance ecological and economic objectives.
Based on these differences, three development patterns can be identified. First, Shanghai and Chongqing achieved dual enhancement, with simultaneous improvements in both forestry market productivity and environmental efficiency. Second, Jiangsu, Beijing, Shanxi, and Shandong exemplify green transformation, showing strong gains in GTFP alongside sustained TFP growth. Beijing is particularly notable because it ranked among the top 10 in GTFP while appearing in the bottom 10 for TFP. Its TFP value, however, still exceeded unity, which indicates that productivity continued to grow although at a slower pace relative to other provinces. This outcome reflects a policy orientation that prioritizes ecological benefits and green development over rapid economic expansion. Third, provinces such as Ningxia, Qinghai, Xinjiang, Sichuan, and Guizhou demonstrate economy-driven growth, characterized by robust increases in conventional productivity but limited progress in environmental efficiency.
Taken together, this typology aligns with the literature on sustainable development and the coordination between economic growth and green transition. It highlights the heterogeneity of provincial trajectories and offers a valuable framework for guiding differentiated policies. Leading provinces can serve as demonstration zones for green innovation and technology diffusion, while regions with imbalances require targeted support either to convert ecological gains into economic value or to accelerate the green upgrading of traditional growth models.
In summary, the MMLPI analysis indicates that China’s forestry sector made only modest green productivity gains from 2000 to 2020, driven primarily by technological progress at the frontier. However, GTFP growth remains far below conventional TFP growth, highlighting inefficiencies in balancing ecological objectives with production. The decomposition results underscore that only frontier shifts (BPC) contributed to GTFP gains, and their effect is much smaller than in traditional TFP. Eastern provinces, which exhibited relatively stronger GTFP performance, illustrate the potential for achieving dual ecological and economic progress, while lagging regions continue to face trade-offs. These findings underscore the importance of strengthening green innovation and accelerating technology diffusion to enhance forestry sustainability.
4 Discussion and conclusion
4.1 Discussion
4.1.1 Interpretation of H1–H4
As summarized in Table 5, the empirical evidence aligns well with the hypotheses proposed in the Introduction. Rather than reiterating the numerical findings reported in Section 3, the discussion below focuses on the mechanisms that underpin these patterns.
Table 5
| Hypothesis | Empirical finding | Supporting evidence |
|---|---|---|
| H1. Ecological efficiency exceeds market efficiency | Supported | Mean ecological efficiency (EE = 0.67) exceeds market efficiency (ME = 0.34) under SBM; NDDF-estimated ecological efficiency is also consistently higher than market efficiency. |
| H2. Incorporating FCS increases ecological efficiency | Supported | Removing FCS reduces NDDF ecological efficiency by 14% at the national level and 32% in Northeast China, indicating that FCS is a structural driver of ecological performance. |
| H3. GTFP changes more slowly than TFP | Supported | GTFP grows at 1% annually, compared with 11% for TFP; slow forest stock accumulation and a low BPC (1.01) constrain GTFP growth. |
| H4. Significant regional heterogeneity exists | Supported | Eastern provinces exhibit the highest EE and GTFP, followed by the Northeast, West, and Central regions; Kruskal–Wallis tests attribute disparities primarily to TGC. |
Summary of hypotheses and supporting empirical evidence.
First, the finding that ecological efficiency exceeds market efficiency (H1) reflects the intrinsic characteristics of forestry production, where ecological services such as carbon sequestration and pollutant mitigation are jointly generated with market outputs. When these services are omitted, overall performance is underestimated, which may lead to misguided policy conclusions.
Second, the NDDF-based sensitivity analysis demonstrates that FCS is a fundamental component of ecological performance (H2). The substantial reduction in ecological efficiency when FCS is excluded indicates that it plays a central role in shaping regional outcomes, particularly in provinces with abundant forest resources.
Third, the slower growth of GTFP relative to conventional TFP (H3) stems from both biological and institutional factors. Forest stock accumulates gradually, limiting the pace at which ecological outputs can expand, while improvements in GTFP rely mainly on technological progress at the production frontier rather than on short-term adjustments in input use or management practices, and are partly constrained by the crowding-out of production inputs caused by ecological investments.
Finally, the strong regional heterogeneity observed in both efficiency and productivity (H4) reflects differences in natural resource endowments, technological access, policy orientation, and management capacity. Eastern provinces benefit from stronger market linkages and advanced technologies, whereas resource-rich regions exhibit higher ecological efficiency due to the dominant contribution of forest-based environmental services.
Taken together, these mechanisms underscore the need for policies that integrate short-term economic objectives with long-term investments in ecological assets and region-specific development strategies. To further illustrate how these mechanisms manifest across regions, we classify provinces into three development patterns based on the relative contributions of FCS and market outputs. Provinces where both ecological and market efficiency are high are characterized as balanced dual-enhancement, reflecting simultaneous gains in economic output and ecological services. Provinces in which ecological outputs, especially FCS, constitute the primary source of efficiency gains, despite weaker market performance, are characterized as following a green-transformation pattern. Conversely, regions where productivity is driven mainly by economic output and ecological contributions remain limited are identified as economy-driven growth. This typology is grounded in the empirical tension between FCS-based ecological services and market-oriented outputs, and it uses FCS as the key ecological reference point for interpreting the heterogeneous green development trajectories observed across regions.
4.1.2 International comparative perspective
China’s forestry GTFP shows a growth pattern primarily driven by BPC, while improvements in EC remain limited, a trend also observed in other countries. European forestry studies have shown similar trends, where productivity gains stem primarily from technological improvements rather than technical efficiency enhancements (Amirteimoori et al., 2023). However, significant differences in driving mechanisms exist. In Northern Europe, green transformation has been driven by mature markets, strict regulations, and demand for high value products (Nebasifu, 2024). By contrast, China’s GTFP growth has been shaped by state-led interventions and large-scale ecological programs, such as the Natural Forest Protection Program and nationwide afforestation campaigns.
Compared with other developing countries, this state-driven pathway is distinctive. In Brazil and Indonesia, forestry development responds mainly to global raw material demand but is constrained by weak governance and infrastructure. China, through sustained policy-driven investments, has achieved notable ecological gains, especially in FCS (Tong et al., 2020). Nonetheless, China shares common challenges with other emerging economies, including the need to upgrade value chains and reduce environmental impacts from harvesting and processing (Sun, 2022).
Cross-country evidence further underscores systematic differences between OECD and BRICS countries. While GTFP has improved in BRICS countries, it remains below OECD averages (Sun, 2022). This suggests that, although China has made remarkable ecological progress, efficiency improvement remains a bottleneck, echoing broader trends in emerging economies. Overall, these comparisons highlight that China’s forestry sector embodies both the opportunities and constraints typical of emerging economies, while also demonstrating the unique impact of large-scale policy interventions.
4.1.3 Limitations and future research
In summary, this study not only confirms several stylized facts established in the international literature but also enriches the global evidence base by providing detailed decomposition of China’s regional performance and systematic comparison between green and traditional TFP. Nonetheless, several limitations remain. The analysis is confined to the provincial level, which restricts the ability to capture heterogeneity across enterprises and forest farms. In addition, the set of ecological indicators is incomplete, as key ecosystem services such as biodiversity and hydrological regulation are not incorporated. Finally, the estimation of FCS is based on forest stock volumes, an approach that provides only a coarse approximation and overlooks more fine-grained dynamics. Moreover, while digitalization is increasingly recognized as a critical input for modern productivity, our current framework lacks the capacity to effectively quantify its specific contribution to forestry GTFP, representing a significant methodological challenge.
Future studies should prioritize integrating remote sensing data, firm or county level observations, and causal inference strategies to better capture green productivity dynamics. Developing measurable digital input indicators and incorporating them into green total factor productivity assessment frameworks will be essential for understanding the role of digital transformation in forestry developments.
4.2 Policy implications
The findings of this study generate several important policy implications. First, ecological accounting systems must be improved by establishing robust mechanisms to value forest ecosystem services, including both forest carbon sequestration (FCS) and other non-market ecological services, while incorporating environmental costs into green GDP assessments. This process should be supported by digital technologies such as remote sensing, big data analytics, and artificial intelligence to enhance the precision and dynamics of monitoring and valuation. This would help mitigate the risk of GTFP underestimation or traditional TFP overestimation and provide a more accurate scientific basis for policymaking. At the same time, forestry investment should be reoriented toward green and digital innovation by prioritizing research and development in energy conservation, emission reduction, FCS enhancement, and clean processing technologies. Strategic investment in digital innovations such as the Internet of Things for intelligent forest monitoring and digital systems for transparent carbon credit traceability can further enhance operational efficiency and facilitate the spillover of green technologies from eastern to less developed regions, thereby narrowing interregional disparities. In addition, regionally differentiated strategies are essential. The east should position itself as a hub for green technological innovation, the central and western regions should accelerate green transition and ecological restoration, while the northeast should capitalize on its FCS advantage while stimulating economic vitality through institutional innovation in forest property rights, financing, and carbon markets. Finally, international cooperation should be strengthened through active participation in global dialogues to harmonize forest carbon accounting and GTFP measurement methodologies, which will ensure transparency, prevent double counting, and help establish trusted and comparable environmental metrics in international markets.
4.3 Conclusion
This study yields three core insights into China’s forestry green development. First, the rapid growth of traditional TFP likely overestimates productivity because conventional measures do not account for environmental costs. Second, FCS is an indispensable driver of forestry efficiency, excluding it results in a significant underestimation, underscoring its necessity in productivity assessment. Third, regional heterogeneity in green development pathways is substantial, with long-term trajectories determined by technological progress and institutional arrangements.
More importantly, the divergence between traditional TFP and GTFP stems not only from the omission of ecological costs in the former but also from the incomplete accounting of ecosystem services in the latter. Current measures of GTFP may underestimate forestry productivity by excluding biodiversity, hydrological regulation, and other services. Thus, the true level of productivity likely lies between the “overestimation” of traditional TFP and the “underestimation” of current GTFP. This gap highlights the necessity of establishing and improving ecological payment mechanisms to translate non-market ecological services into quantifiable economic outputs, which is fundamental for accurately assessing forestry’s ecological contributions and obtaining a more comprehensive evaluation of GTFP.
The significance of these findings lies in two aspects. On the one hand, they correct prior studies’ tendency to overestimate forestry performance by ignoring environmental costs, while also highlighting the potential underestimation embedded in current GTFP measures. On the other hand, they provide a stronger scientific basis for differentiated green policies. Practically, the results can inform policy instruments for advancing China’s “dual-carbon” goals and sustainable forestry development. Academically, they point toward future research priorities: expanding ecological service accounting, refining measurement accuracy, integrating broader dimensions of ecosystem value into productivity evaluation, and incorporating digital input factors into productivity models.
Statements
Data availability statement
The original contributions presented in the study are included in the article/Supplementary material, further inquiries can be directed to the corresponding author.
Author contributions
XJ: Writing – original draft, Writing – review & editing. LL: Conceptualization, Methodology, Writing – review & editing.
Funding
The author(s) declared that financial support was received for this work and/or its publication. This work was supported by the Zhejiang Philosophy and Social Sciences Planning Project (grant no. 26NDJC168YB).
Conflict of interest
The author(s) declared that this work was conducted in the absence of any commercial or financial relationships that could be construed as a potential conflict of interest.
Generative AI statement
The author(s) declared that Generative AI was not used in the creation of this manuscript.
Any alternative text (alt text) provided alongside figures in this article has been generated by Frontiers with the support of artificial intelligence and reasonable efforts have been made to ensure accuracy, including review by the authors wherever possible. If you identify any issues, please contact us.
Publisher’s note
All claims expressed in this article are solely those of the authors and do not necessarily represent those of their affiliated organizations, or those of the publisher, the editors and the reviewers. Any product that may be evaluated in this article, or claim that may be made by its manufacturer, is not guaranteed or endorsed by the publisher.
Supplementary material
The Supplementary material for this article can be found online at: https://www.frontiersin.org/articles/10.3389/ffgc.2025.1714695/full#supplementary-material.
- DEA
Data envelopment analysis
- DMU
Decision-making unit
- TFP
Total factor productivity
- FTFP
Forestry total factor productivity
- GTFP
Green total factor productivity
- MMLPI
Meta-frontier Malmquist-Luenberger Productivity Index
- CRS
Constant returns to scale
- VRS
Variable returns to scale
- ME
Market efficiency
- EE
Ecological efficiency
- EC
Technical efficiency change
- BPC
Best-practice gap change
- TGC
Technical gap change
- K
Capital
- L
Labor
- FL
Forest land
- Y
Forestry GDP
- FCS
Forest carbon stock
- FRA
Global Forest Resources Assessment
Glossary
References
1
Amirteimoori A. Banker R. D. Zadmirzaei M. Susaeta A. (2023). Managerial ability and productivity growth in the European forest sector. Eur. J. Forest Res.142, 1029–1043. doi: 10.1007/s10342-023-01572-x
2
Busch J. Bukoski J. J. Cook-Patton S. C. Griscom B. Kaczan D. Potts M. D. et al . (2024). Cost-effectiveness of natural forest regeneration and plantations for climate mitigation. Nat. Clim. Chang.14, 996–1002. doi: 10.1038/s41558-024-02068-1
3
Cao L. Jiang C. Xiao Q. Xu T. Lan S. He J. et al . (2024). Forestry subsidies, forestry regulatory policies, and total factor productivity in forestry-plot-scale micro-survey data from a heterogeneous forest types perspective. Forests15:692. doi: 10.3390/f15040692
4
Chambers R. G. Chung Y. Fare R. (1996). Benefit and distance functions. J. Econ. Theory70, 407–419.
5
Charnes A. Cooper W. W. Rhodes E. (1978). Measuring the efficiency of decision-making units. Eur. J. Oper. Res.2, 429–444.
6
Chen S. Y. (2012). Evaluation of the process of low-carbon economic transformation in various regions of China. Econ. Res. J., 8:32–44.
7
Chung Y. H. Färe R. Grosskopf S. (1997). Productivity and undesirable outputs: a directional distance function approach. J. Environ. Manag.51, 229–240.
8
De Borger B. Buongiorno J. (1985). Productivity growth in the paper and paperboard industries: a variable cost function approach. Can. J. For. Res.15, 1013–1020.
9
Dixon R. K. Solomon A. M. Brown S. Houghton R. A. Trexier M. C. Wisniewski J. (1994). Carbon pools and flux of global forest ecosystems. Science263, 185–190. doi: 10.1126/science.263.5144.18,
10
Fang J. Chen A. Peng C. Zhao S. Ci L. (2001). Changes in forest biomass carbon storage in China between 1949 and 1998. Science292, 2320–2322. doi: 10.1126/science.1058629,
11
FAO (2010). Global Forest Resources Assessment 2010. Available online at: https://openknowledge.fao.org/handle/20.500.14283/i1757e (Accessed August 5, 2025).
12
FAO (2020). Global Forest Resources Assessment 2020. doi: 10.4060/ca9825en
13
FAO (2025). Global Forest Resources Assessment 2025. doi: 10.4060/cd6709en
14
Feng Y. Lu C. C. Lin I. F. Lin J. Y. (2023). Dynamic assessment of agro-industrial sector efficiency and productivity changes among G20 nations. Energy Environ.34, 255–282. doi: 10.1177/0958305X211056030
15
Gao H. Ye W. L. Peng S. J. Zhang W. J. (2020). A method of measuring conversion efficiency from ‘lucid waters and lush mountains’ to ‘invaluable assets’ based on green total factor productivity. Res Environ Sci, 33, 2639–2646. doi: 10.13198/j.issn.1001-6929.2020.06.23
16
Geng G. Xiao Q. Liu S. Liu X. Cheng J. Zheng Y. et al . (2021). Tracking air pollution in China: Near real-time PM2.5 retrievals from multiple data sources. arXiv. Available online at: https://arxiv.org/abs/2103.06520 (Accessed 14 August 2025).
17
Guan Y. Shan Y. Huang Q. Chen H. Wang D. Hubacek K. (2021). Assessment to China's recent emission pattern shifts. Earth’s Future9:e2021EF002241. doi: 10.1029/2021EF002241
18
Hall R. E. Jones C. I. (1999). Why do some countries produce so much more output per worker than others?Q. J. Econ.114, 83–116. doi: 10.1162/003355399555954
19
IPCC (2006). 2006 IPCC guidelines for National Greenhouse gas Inventories. Japan: IGES.
20
Li Y. S. Zhang D. W. Nagubadi R. V. (2008). Productivity in the US and Canadian sawmill industries: a nonparametric programming analysis. For. Prod. J.58, 33–40.
21
Liu X. Huang J. Zhou H. Sun J. Wang Q. Cheng X. (2023). Dynamic analysis of provincial forest carbon storage efficiency in China based on DEA Malmquist index. Forests14:1629. doi: 10.3390/f14081629
22
Managi S. Kaneko S. (2006). Economic growth and the environment in China: an empirical analysis of productivity. Int. J. Global Environ. Issues6, 89–133. doi: 10.1504/IJGENVI.2006.009402,
23
Morita H. Hirokawa K. Zhu J. (2005). A slack-based measure of efficiency in context-dependent data envelopment analysis. Omega33, 357–362. doi: 10.1016/j.omega.2004.06.001
24
Nebasifu A. (2024). An outlook on modalities in Nordic forest governance. Forests Monit.1, 16–38. doi: 10.62320/fm.v1.i1.7
25
Oh D. (2010). A global Malmquist-Luenberger productivity index. J. Prod. Anal.34:183-197. doi: 10.1007/s11123-010-0178-y
26
Pan Y. Birdsey R. A. Fang J. Houghton R. Kauppi P. E. Kurz W. A. et al . (2011). A large and persistent carbon sink in the world’s forests. Science333, 988–993. doi: 10.1126/science.1201609,
27
Richards K. R. Stokes C. (2004). A review of forest carbon sequestration cost studies: a dozen years of research. Clim. Chang.63, 1–48. doi: 10.1023/B:CLIM.0000018503.10080.89
28
Shan Y. Guan D. Zheng H. Ou J. Li Y. Meng J. et al . (2018). China CO2 emission accounts 1997-2015. Sci. Data5:170201. doi: 10.1038/sdata.2017.201,
29
Shan Y. Huang Q. Guan D. Hubacek K. (2020). China CO2 emission accounts 2016-2017. Sci. Data7:54. doi: 10.1038/s41597-020-0393-y,
30
Shan Y. Liu J. Liu Z. Xu X. Shao S. Wang P. et al . (2016). New provincial CO2 emission inventories in China based on apparent energy consumption data and updated emission factors. Appl. Energy184, 742–750. doi: 10.1016/j.apenergy.2016.03.073
31
Shephard R. W. (1970). Theory of cost and production functions. Princeton, NJ: Princeton University Press, 64–78.
32
Shi C. Jie C. Shi F. Wen Y. (2017). Estimation of the technical efficiency and the decomposition of TFP of Chinese forestry: basing on SFA-Malmquist method. Sci. Silvae Sin.53, 126–135. doi: 10.11707/j.1001-7488.20171214
33
Song M. L. Zhao X. Choi Y. (2020). Technical efficiency of Chinese forestry and its total factor productivity for the adaption of the climate change. J. Forest Econ.35, 149–175. doi: 10.1561/112.00000508
34
Sun X. (2022). Analysis of green total factor productivity in OECD and BRICS countries: based on the super-SBM model. J. Water Clim. Change13, 3400–3415. doi: 10.2166/wcc.2022.149
35
TAP (2025).Tracking air pollution in China. Available online at: http://tapdata.org (Accessed August 14, 2025).
36
Tone K. (2001). A slacks-based measure of efficiency in data envelopment analysis. Eur. J. Oper. Res.130, 498–509. doi: 10.1016/S0377-2217(99)00407-5
37
Tong X. Brandt M. Yue Y. Ciais P. Rudbeck J. M. Penuelas J. et al . (2020). Forest expansion dominates China’s land carbon sink since 1980. Nat. Commun.13:5374. doi: 10.1038/s41467-022-32961-2
38
Wang D. Du K. Zhang N. (2022). Measuring technical efficiency and total factor productivity change with undesirable outputs in Stata. Stata J. Promoting Commun. Stat. Stata22, 103–124. doi: 10.1177/1536867X221083886
39
Wang B. Wu Y. R. Yan P. F. (2010). Regional environmental efficiency and growth of environmental total factor productivity in China. Econ. Res. J.15, 95–109.
40
Xiao Q. Geng G. Cheng J. Liang F. Li R. Meng X. et al . (2020). Evaluation of gap-filling approaches in satellite-based daily PM2.5 prediction models. Atmos. Environ.244:117921. doi: 10.1016/j.atmosenv.2020.117921
41
Xie X. W. Li H. J. Cheng B. D. Li F. F. Mikkilae M. (2025). Global value chain embedding and total factor productivity in carbon emission reduction: a multi - country analysis of the paper industry. Forests16:222. doi: 10.3390/f16020222
42
Xu J. Guan Y. Oldfield J. Guan D. Shan Y. (2024). China carbon emission accounts 2020-2021. Appl. Energy360:122837. doi: 10.1016/j.apenergy.2024.122837
43
Yang H. Yuan T. Zhang X. Li S. (2016). A decade trend of total factor productivity of key state-owned forestry enterprises in China. Forests7:97. doi: 10.3390/f7050097
44
Zhang N. Du K. R. (2023). Tutorial on efficiency and productivity analysis: theory, application, and programming. Shandong, China: Shandong University Press.
45
Zhang Y. Li X. G. Wen Y. L. (2022). Forest carbon sequestration potential in China under the background of carbon emission peak and carbon neutralization. J. Beijing For. Univ.44, 38–47. doi: 10.12171/j.1000−1522.20210143
46
Zheng J. Liu X. Bigsten A. (1998). Ownership structure and deteminants of technical efficiency analysis: an application of envelopment analysis to Chinese enterprises (1986-1990). J. Comp. Econ.26, 465–484. doi: 10.1006/jcec.1998.1540
47
Zhou P. Ang B. Wang H. (2012). Energy and CO2 emission performance in electricity generation: a non-radial directional distance function approach. Eur. J. Oper. Res.221, 625–635. doi: 10.1016/j.ejor.2012.04.022
Appendix
Table A1
| Region | Provinces included |
|---|---|
| Eastern | Beijing, Tianjin, Hebei, Shanghai, Jiangsu, Zhejiang, Fujian, Shandong, Guangdong, Hainan |
| Central | Shanxi, Anhui, Jiangxi, Henan, Hubei, Hunan |
| Western | Inner Mongolia, Guangxi, Chongqing, Sichuan, Guizhou, Yunnan, Tibet, Shaanxi, Gansu, Qinghai, Ningxia, Xinjiang |
| Northeastern | Liaoning, Jilin, Heilongjiang |
List of Chinese provinces and municipalities by region.
Table A2
| Category | Variable | Definition/measurement | Source |
|---|---|---|---|
| Inputs | K | Capital: forestry fixed asset investment | China Forestry Statistical Yearbook; National Bureau of Statistics; China Forestry and Grassland Statistical Yearbook |
| L | Labor: year-end employment in regional forestry system units | China Forestry Statistical Yearbook; National Bureau of Statistics; China Forestry and Grassland Statistical Yearbook | |
| FL | Forest land: annual forestland area | China Forestry Statistical Yearbook; National Bureau of Statistics; Ninth National Forest Resources Inventory Report | |
| E | Energy: provincial total energy consumption × (forestry GDP/regional GDP) | China Energy Statistical Yearbook | |
| Desirable outputs | Y | Forestry GDP: value of forestry GDP | China Forestry Statistical Yearbook; China Forestry and Grassland Statistical Yearbook |
| FCS | Forest carbon stock: estimated via forest stock expansion method, using conversion parameters from 2006 IPCC Guidelines for National Greenhouse Gas Inventories | China Forestry Statistical Yearbook; National Bureau of Statistics; Ninth National Forest Resources Inventory Report | |
| Undesirable outputs | CO2 | CO2: regional total carbon emissions × (forestry GDP/regional GDP) | China Emission Accounts and Datasets (CEADS) |
| PM2.5 | PM2.5: regional total PM2.5 emissions × (forestry GDP/regional GDP) | Tracking Air Pollution in China (TAP) |
Variables, definitions, and data sources.
Summary
Keywords
forest carbon stock, green total factor productivity, Meta-frontier Malmquist-Luenberger Productivity Index, non-radial directional distance function, slacks-based measure, total factor productivity
Citation
Jiang X and Li L (2026) China’s forestry green total factor productivity (2000–2020): a multidimensional analysis from static efficiency to dynamic growth. Front. For. Glob. Change 8:1714695. doi: 10.3389/ffgc.2025.1714695
Received
09 October 2025
Revised
09 December 2025
Accepted
12 December 2025
Published
29 January 2026
Volume
8 - 2025
Edited by
Chandra Prakash Kala, Indian Institute of Forest Management, India
Reviewed by
Seyed Mohammad Moein Sadeghi, Northern Arizona University, United States
Chuandi Fang, Wuhan Institute of Technology, China
Updates
Copyright
© 2026 Jiang and Li.
This is an open-access article distributed under the terms of the Creative Commons Attribution License (CC BY). The use, distribution or reproduction in other forums is permitted, provided the original author(s) and the copyright owner(s) are credited and that the original publication in this journal is cited, in accordance with accepted academic practice. No use, distribution or reproduction is permitted which does not comply with these terms.
*Correspondence: Lanying Li, llycds@zafu.edu.cn
Disclaimer
All claims expressed in this article are solely those of the authors and do not necessarily represent those of their affiliated organizations, or those of the publisher, the editors and the reviewers. Any product that may be evaluated in this article or claim that may be made by its manufacturer is not guaranteed or endorsed by the publisher.