Abstract
Forestry enterprises operate with forest resources as their business object, their environmental responsibilities are inherently distinctive. This paper defines such unique responsibilities as “corporate ecological and environmental responsibilities (CEER)”, a specificity that limits the direct applicability of existing research conclusions of ordinary enterprises to forestry contexts. To address this issue, this study explores the relationships among forestry enterprises' CEER, green innovation (GI), and operating performance. The findings reveal three key insights: First, CEER in forestry enterprises exerts a positive impact on operating performance, with significant positive effects explicitly observed in the dimensions of pollution prevention responsibility and green product responsibility, whereas forest sustainability responsibility shows no significant impact. Second, CEER can influence operating performance through green innovation, and this mediating effect is primarily driven by pollution prevention responsibility. Third, the mediating role of green innovation exhibits ownership heterogeneity: private forestry enterprises can enhance their operating performance via green innovation, while state-owned forestry enterprises do not demonstrate this effect. Overall, this research offers empirical implications for promoting the coordinated development of corporate environmental responsibility (CER) and operating performance.
1 Introduction
With the proposal of China's carbon neutrality goal and the deepening of ecological civilization construction, the strategic value of forestry in environmental protection has been further highlighted. It is estimated that each hectare of forest can absorb about 15 tons of carbon dioxide per year, and this carbon sequestration function is incomparable to other ecosystems (Mori et al., 2017). China's forest area has reached 220 million hectares, with a forest coverage rate of 23.04%. The total forest carbon storage has been increasing annually (Figure 1), and it is predicted that China's forest carbon sinks will be 9.25 Pg (peta-grams) in 2030 and 14.76 Pg in 2060 (Ke et al., 2023). Forest carbon storage is important in maintaining climate and ecological security.
Figure 1
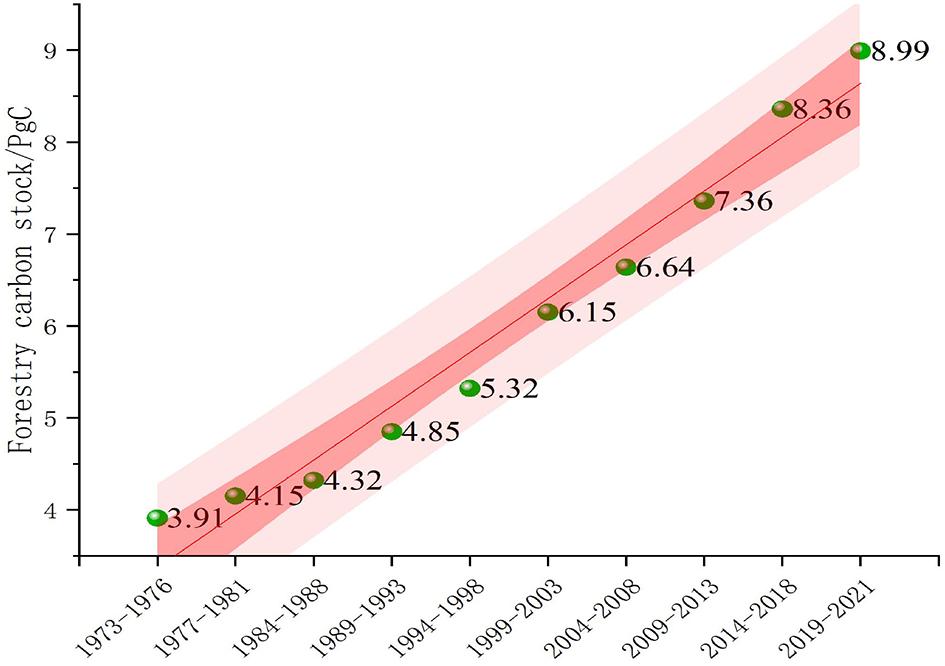
Forestry carbon stock of China.
Forestry enterprises take forest resources as their primary business object, and their production and operation activities directly impact forest resources. This makes forestry enterprises a key subject connecting ecological protection and economic development (Cherchyk et al., 2019). Forestry enterprises not only bear the inherent mission of maintaining the balance of forest ecosystems and providing ecological services, but also face the practical demand of improving operational performance under market competition. However, in actual operations, many forestry enterprises face a dilemma: On the one hand, strictly fulfilling ecological and environmental responsibilities may increase their operating costs, such as investing funds in forest tending and ecological monitoring (Villamor and Wallace, 2024). On the other hand, ignoring ecological and environmental responsibilities and over-exploiting forest resources will destroy the ecological balance and affect their long-term development.
In recent years, with the proposal of China's dual carbon goals and the deepening of ecological civilization construction, the sense of responsibility of forestry enterprises in ecological environment protection has been further strengthened. Achieving sustainable operational performance growth while fulfilling ecological and environmental responsibilities has become an urgent issue for forestry enterprises.
Back in the 1970s, scholars were already diving into systematic studies on how a company's environmental responsibilities impact its operational performance, and they have built up a sizeable body of research since then. Most scholars generally agree that a company's fulfillment of environmental responsibility can positively promote its operational performance (Peng et al., 2021; Jo et al., 2015; Coelho et al., 2023). The core logic behind this lies in the following: by establishing systematic environmental protection practices, enterprises can optimize their operation from multiple dimensions such as cost control, risk aversion, market expansion, and innovation-driven strategies, ultimately achieving the dual improvement of short-term benefits and long-term competitiveness (Wong et al., 2018).
Positive environmental management can yield multiple benefits for enterprises, which can be elaborated from the following dimensions: First, enterprises can enhance resource utilization efficiency (Gao and Wan, 2023), additionally, they may generate extra revenue by selling waste (Suganthi, 2020). Second, eco-friendly products help attract environmentally conscious consumers and enhance their ability to command premium prices (Wahba, 2008; Hu et al., 2018; Chung et al., 2018). Third, firms with high ESG are more likely to secure financing at lower costs as global investors increasingly focus on enterprises' environmental performance (Ratajczak and Mikołajewicz, 2021; Xu et al., 2020; Ding et al., 2022). Fourth, environmental responsibilities drive enterprises to upgrade their technologies and processes (Hao et al., 2023; González-Ramos et al., 2018), which in turn improves production efficiency and product value (Le, 2022; Nguyen and Vu, 2023; Luo et al., 2022). Finally, sound environmental management can strengthen employees' sense of belonging, reduce the loss of core talents, and lower recruitment and training costs (Dögl and Holtbrügge, 2014; Kunapatarawong and Martínez-Ros, 2016; Lee et al., 2013; Sobaih et al., 2022).
Regrettably, scholars have paid insufficient attention to industry heterogeneity in their research on corporate environmental responsibility (CER; Holtbrügge and Dögl, 2012; Coelho et al., 2023). In fact, corporate environmental responsibility is highly dependent on their industry characteristics (Testa and D'Amato, 2017), especially for forestry enterprises (Villamor and Wallace, 2024; Wang and Juslin, 2013). On the one hand, like ordinary enterprises, they cause resource consumption, environmental pollution, and increased carbon dioxide emissions, thus generating negative environmental externalities (Nishitani et al., 2011). On the other hand, due to their ownership of forest resources, the biological attributes of such resources, such as absorbing carbon dioxide and regulating the climate, generate positive environmental externalities (Zhang and Xu, 2022). This positive environmental externality is a unique feature of forestry enterprises, which means their environmental responsibility must differ from that of ordinary enterprises that only generate negative externalities (Long et al., 2022). However, the ecological protection effectiveness of forestry enterprises has not yet received sufficient attention from the academic community.
Li and Toppinen (2011) argue that the social responsibility of forestry enterprises should focus more on environmental rather than economic indicators. Forestry enterprises should focus their social responsibility on sustainable forest harvesting (Matilainen, 2013). Forestry firms' environmental responsibility should go beyond conventional environmental protection efforts to include ecological building. This broader responsibility is more accurately referred to as corporate ecological and environmental responsibility (CEER) instead of the more general corporate environmental responsibility (CER) (Long et al., 2022). Hart and Ahuja (1996) proposed the Natural Resource-Based View (NRBV), which emphasizes that enterprises should positively implement environmental management strategies to achieve their sustainable development goals. The Natural Resource-Based View includes three strategies: Pollution Prevention Strategy, Product Stewardship Strategy, and Sustainable Development Strategy (Hart and Dowell, 2011). By integrating the Natural Resource-Based View, this paper proposes that the forestry CEER should cover the following three dimensions:
-
(1) Pollution Prevention Responsibility: Reducing damage to the natural environment through pollution prevention;
-
(2) Green Product Responsibility: Minimizing the consumption of non-renewable resources throughout the product life cycle; and
-
(3) Forest Sustainability Responsibility: Changing or exiting businesses that damage the environment.
The specific contents are shown in Figure 2.
Figure 2
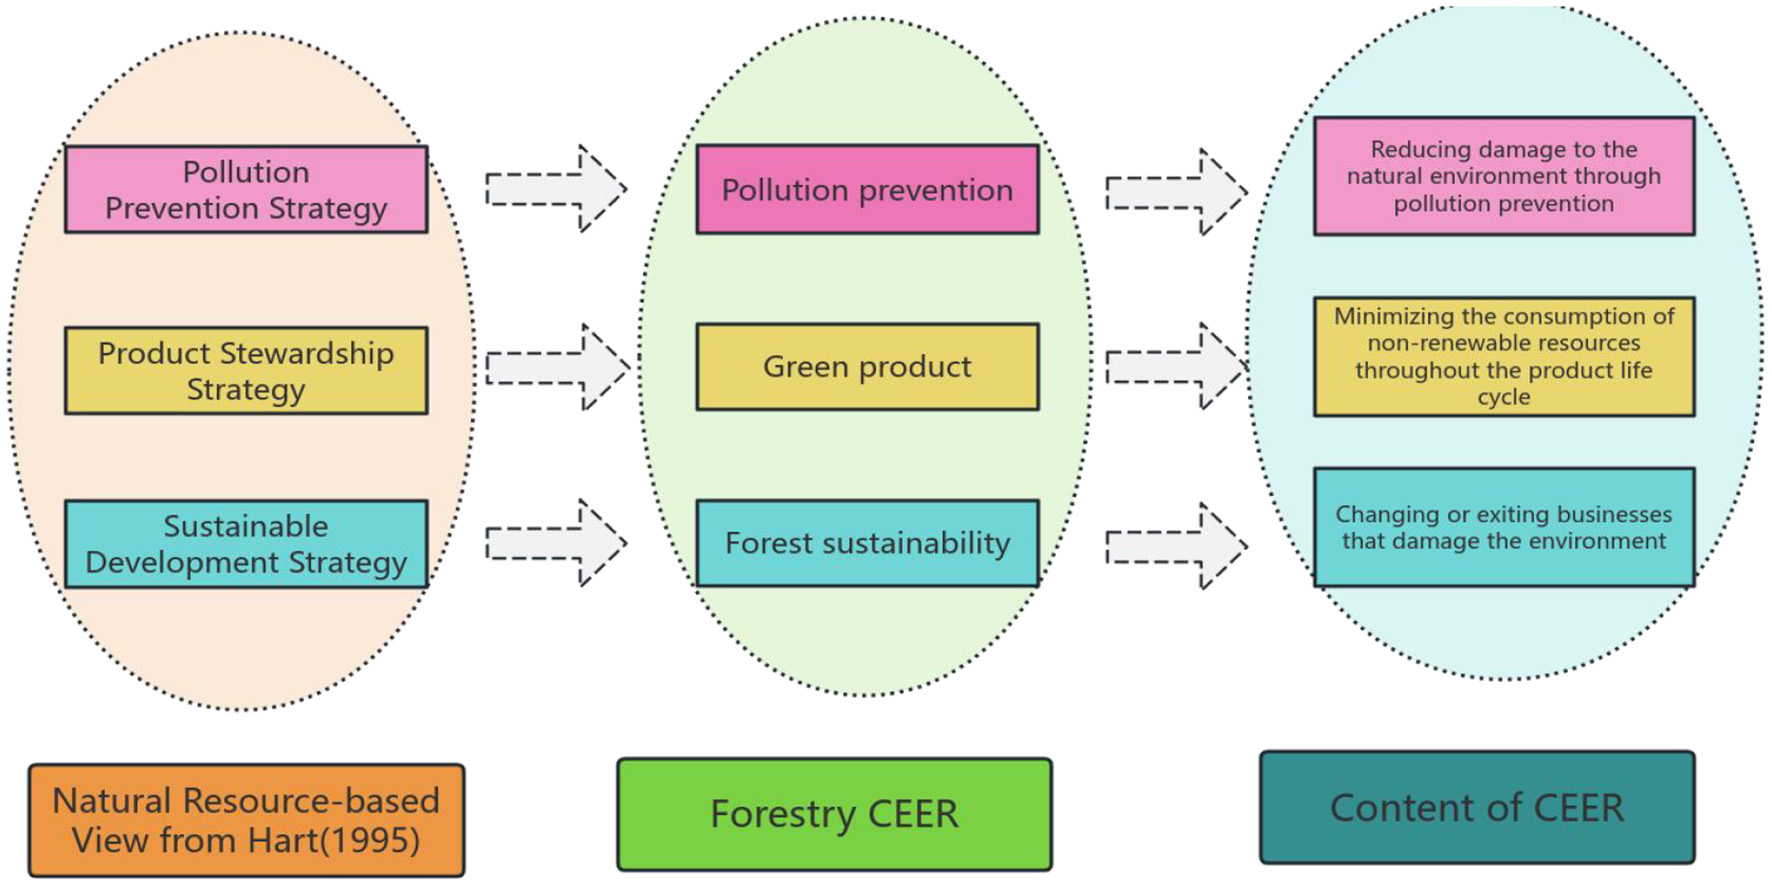
Corporate ecological and environmental responsibility.
In addition, existing literature has mostly analyzed “whether environmental responsibility affects operational performance”, while the core issue of “how environmental responsibility acts on operational performance”, that is, the transmission mechanism between the two, has been insufficiently explored (Holtbrügge and Dögl, 2012; Gillan et al., 2021). Green innovation is not only a core path for forestry enterprises to balance ecological environmental responsibility and economic interests, but also a key intermediary for the transformation of the two: Ecological environmental responsibility, such as pollution prevention, sustainable forest management, will drive green technology development and optimize production processes, and these innovations will ultimately promote the growth of operational performance by reducing costs and improving resource efficiency. However, existing literature has not sorted out the specific action paths of green innovation (GI). Based on this, this paper takes forestry enterprises as the research object to analyze the green innovation transmission mechanism of CEER on operational performance. The marginal contributions of this paper may lie in:
First, it puts forward the conceptual framework of Ecological and Environmental Responsibility for the first time. It extends the responsibility boundary from traditional environmental protection to ecological construction and sustainable development, broadens the scope of environmental responsibility, and provides a new theoretical framework for developing corporate environmental responsibility under the dual-carbon goals.
Second, existing studies are mostly concentrated in heavy-polluting industries, where environmental protection responsibilities are more of “passive responsibilities”. In contrast, forestry enterprises' ecological and environmental responsibilities are “active responsibilities”. Therefore, existing conclusions on the relationship between environmental responsibility and operational performance do not apply to forestry enterprises. This paper, which conducts research from the perspective of forestry enterprises, constitutes an innovative supplement to the exploration of this relationship.
Third, this paper explores the impact mechanism of CEER on operational performance from the perspective of green innovation, and further analyzes the sources of the mediating effect of green innovation. This is rarely involved in existing studies, which enriches and expands the research on the mechanism of environmental responsibility on operational performance.
The remainder of this paper is organized as follows: Section 2 reviews existing literature and proposes hypotheses. Section 3 specifies the empirical model encompassing data sources and econometric methods. Section 4 reports core analytical outcomes, while Section 5 concludes the findings and proposes policy recommendations.
2 Theoretical analysis
2.1 Relationship between CEER and operational performance
Forestry enterprises' fulfillment of environmental responsibilities can enable them to obtain tangible and intangible resources (Branco and Rodrigues, 2006), and it is a means of differentiated competition (Husted and Allen, 2009). Therefore, it can enhance enterprises' competitive advantages and improve operational performance, which is specifically reflected in the following aspects:
First, the impact of pollution prevention responsibility on operational performance. China's environmental policies are becoming increasingly strict, with significantly improved coverage and enforceability of regulations, leading to a substantial increase in the cost of enterprises' environmental violations. Under the dual supervision of environmental law and the public, environmental violations are more likely to be detected (Lin and Chen, 2020). Forestry enterprises that abide by environmental regulations can avoid high environmental penalties, reduce environmental risks, and thereby improve operational performance.
Second, the impact of green product responsibility on operational performance. Ecological and environmental responsibility requires forestry enterprises to provide green forest products that meet social needs. As the market pays greater attention to environmental attributes, green forest products can not only meet green consumption demands but also form differentiated competition with ordinary products, thereby helping enterprises expand their market share. Dangelico (2016) research confirms that green product innovation can help enterprises achieve multiple positive outcomes, including cost reduction, competitive advantage, expanded market share, increased sales and revenue, higher profits, better reputation, growing exports, and improved productivity.
Third, the impact of forest sustainability responsibility on operational performance. Forest sustainability responsibility requires forestry enterprises to ensure the sustainable use of forest resources, which prompts enterprises to reasonably control the amount of forest resource harvesting. This enables enterprises to obtain long-term and stable production raw materials, avoiding operational interruptions caused by resource depletion. At the same time, enterprises will pay more attention to the refined utilization of existing forest resources, improve the utilization rate of wood, reduce resource waste, and indirectly reduce the raw material cost of unit products.
Based on the above analysis, the following hypothesis is proposed:
Hypothesis 1: CEER has a positive impact on operational performance.
2.2 Mechanism of how CEER affects operational performance
The fulfillment of CEER by forestry companies will trigger enterprises' green innovation behaviors. First of all, when forestry enterprises fulfill their CEER, they need to reduce pollution and emissions and achieve clean production in the production process, all of which must be realized through innovation (Shao et al., 2020). Secondly, with the improvement of consumers' environmental awareness, the ecological attributes of forestry products have become part of the core competitiveness. The market demand for green products such as formaldehyde-free boards and non-toxic antiseptic wood has surged. The development of such products requires enterprises to make targeted R&D in raw material screening, production formulas, and other aspects. Finally, the responsibility for forestry sustainability requires forestry enterprises to increase R&D investment, improve the utilization efficiency of forest resources, or explore alternative raw materials, all of which need to be realized through green innovation. Most existing literature also supports the relationship between environmental responsibility and green innovation. The stronger an enterprise's awareness of environmental protection, the higher its enthusiasm and intensity of investment in environmental protection. Wu et al. (2020) find that CER positively affects firm innovation performance, and these relationships are stronger for firms with greater visibility. Xiong et al. (2025) demonstrate that CER can influence green innovation through firms' knowledge inflow and knowledge outflow. Based on the above analysis, the following research hypothesis is proposed:
Hypothesis 2: Ecological and environmental responsibility positively impacts green innovation.
Green innovation driven by ecological and environmental responsibility (CEER) of forestry enterprises can enhance their operational performance in multiple ways. First, resource conservation and raw material recycling achieved through green innovation can significantly improve the comprehensive utilization rate of wood resources and reduce costs. Second, developing eco-friendly green products through innovation can meet the needs of consumers with growing environmental awareness, enabling enterprises to gain higher product premiums and thus enhance economic benefits. Third, green patents can help enterprises secure an inimitable and sustainable competitive advantage in the market, establish a positive corporate image, and ultimately boost their economic performance. These perspectives are supported by existing literature. For instance, Dangelico et al. (2017) found that enterprises' implementation of environmental initiatives focusing on energy and pollution has a positive impact on their market performance. Using Italian enterprises as a case study, Vasileiou et al. (2022) demonstrated that environmental innovation can be profitable, as improvements in a firm's environmental performance lead to higher profits. Therefore, this paper proposes the following hypothesis:
Hypothesis 3: CEER positively affects operational performance through green innovation.
Based on the above analysis, the transmission mechanism of CEER on operational performance in forestry enterprises can be roughly depicted, as shown in Figure 3.
Figure 3
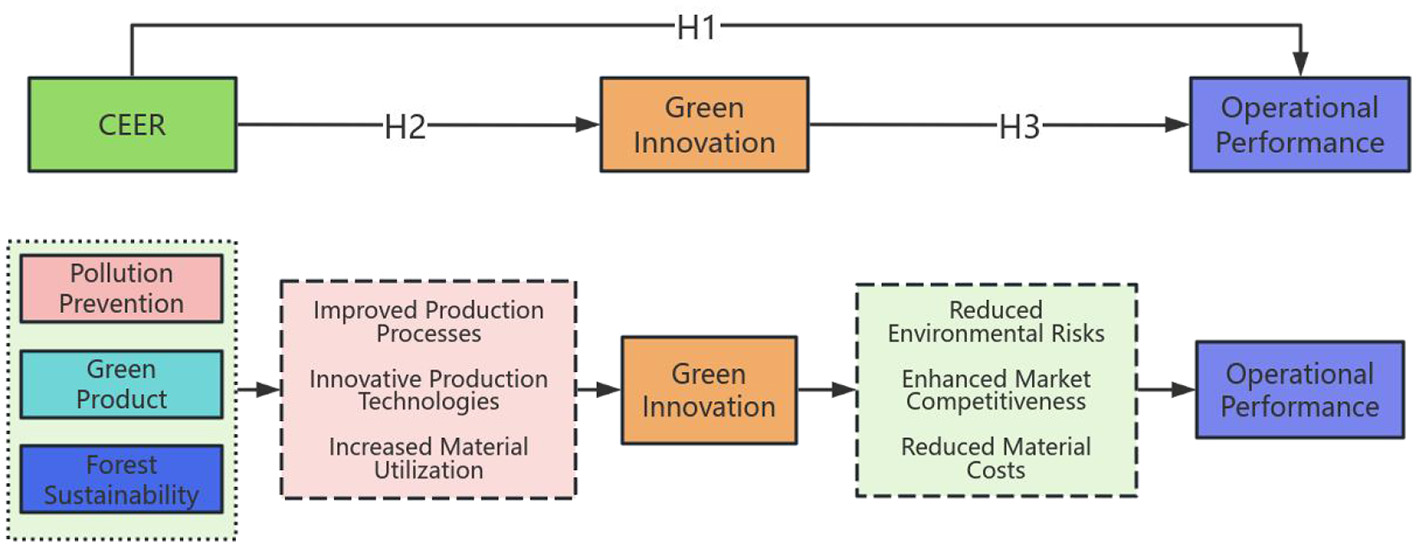
Theoretical framework and research hypothesis.
3 Research design
3.1 Samples and data resources
Based on industry classification results provided by the China Securities Regulatory Commission, this study selected listed companies in the forestry, wood processing, and paper industries from 2009 to 2021 as the research sample, with the following screening criteria applied: (1) Exclude forestry enterprises that do not own forest resources and only carry out subsequent processing; (2) Exclude ST and *ST enterprises; (3) Exclude samples with serious data missing. After the above screenings, 215 unbalanced panel data sets were obtained. Data on ecological and environmental responsibility and operational performance are derived from the China Stock Market Accounting Research (CSMAR) databases and corporate annual reports, and data on green innovation are obtained from the State Intellectual Property Office of the People's Republic of China website.
3.2 Variable definitions
3.2.1 Independent and dependent variables
This study's independent variable is the CEER of forestry enterprises. Drawing from Hart's natural resource-based view (Hart and Ahuja, 1996), as mentioned earlier, this paper constructs an index system of ecological and environmental responsibility for forestry enterprises based on the Natural Resource-Based View (Figure 4), and adopts a combined evaluation method to assign weights to the indicators, and finally obtains the measured value of CEER. The specific calculation method has been published and described in detail in Long et al. (2022); hence, it is not repeated here.
Figure 4
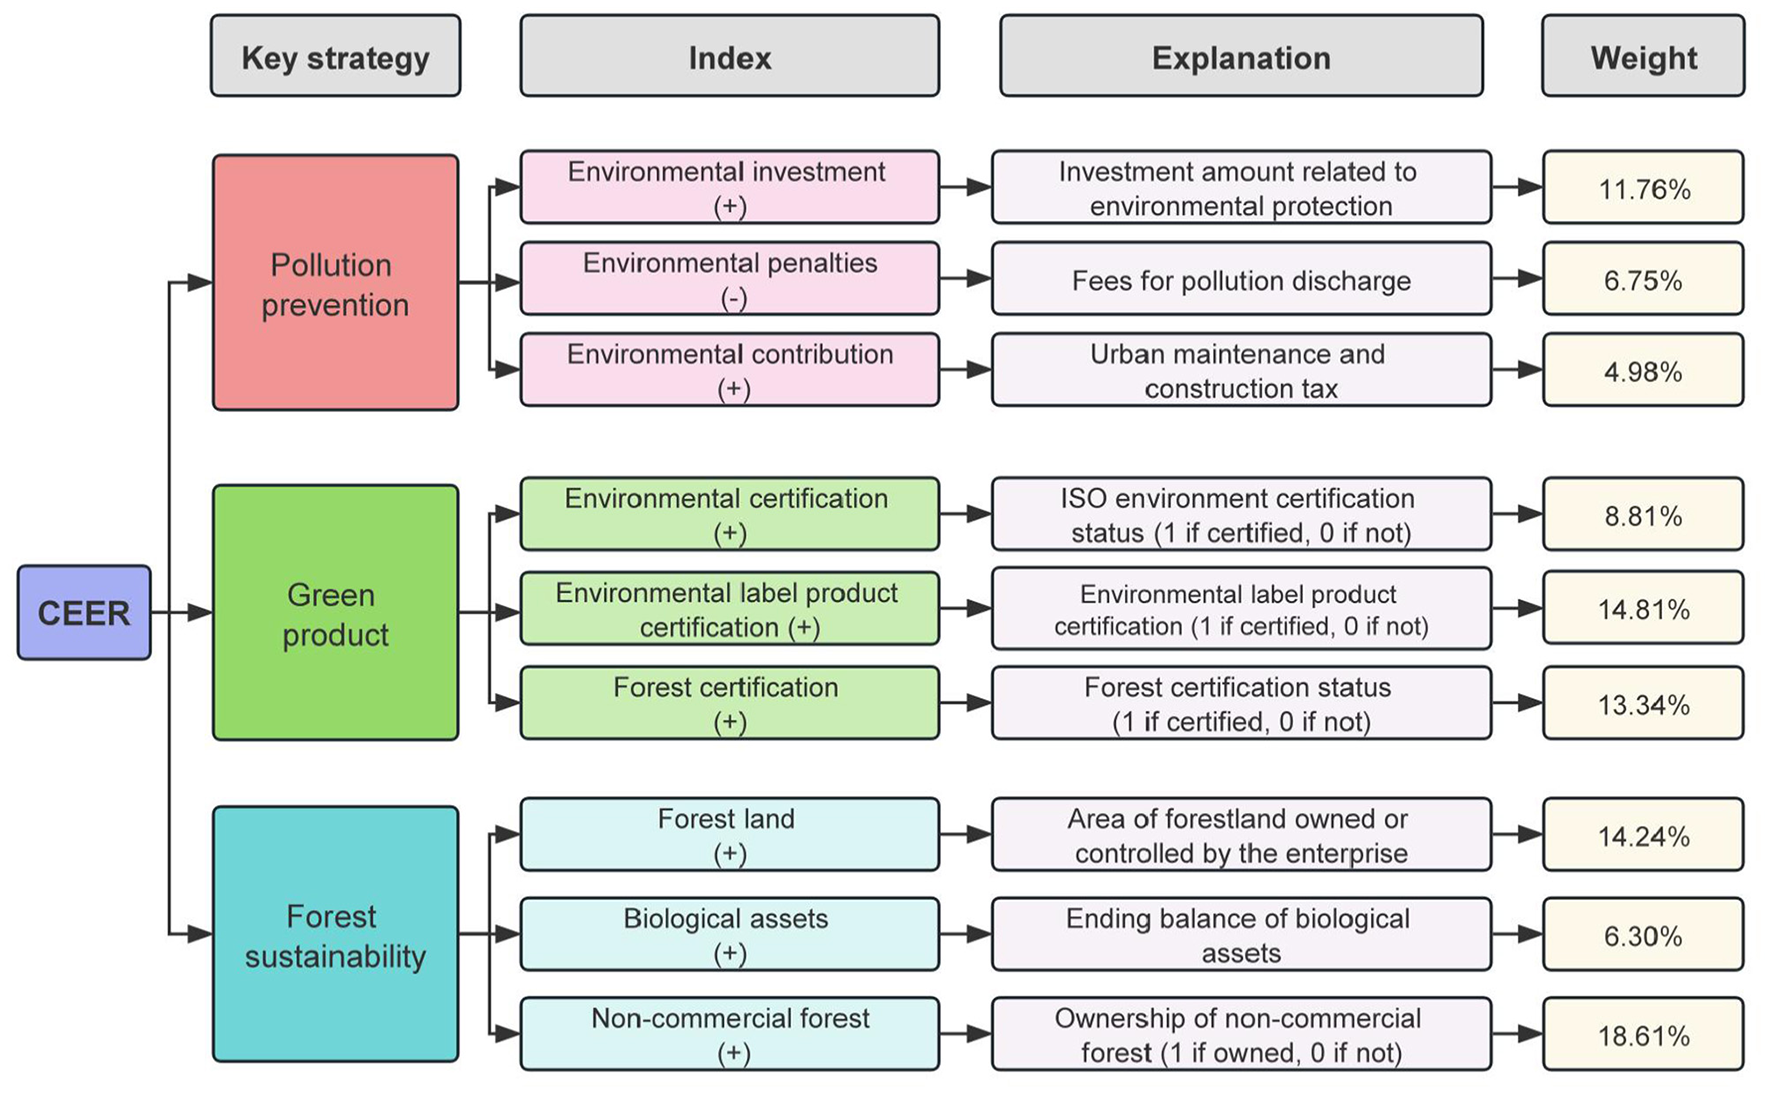
The index of CEER. The + in brackets represents a positive indicator and the – indicates a negative indicator.
The dependent variable of this paper is operational performance, and the return on total assets (ROA) is selected as the measurement indicator of operational performance.
3.2.2 Mediating variable
The mediating variable is green innovation. An enterprise's green innovation is mainly measured from two dimensions: green innovation input and green innovation output. Green innovation input is generally measured by indicators such as R&D funds, the number of scientific research personnel, new product development funds, or pollution control investment. Green innovation output is generally measured by the number of green patent applications, the number of green patent authorizations of the enterprise, or the output value of new products of the enterprise. Since green R&D input is difficult to separate from enterprise R&D expenses (Takalo and Tooranloo, 2021), this paper measures the innovation level of the enterprise through the enterprise's green innovation output, that is, the number of green patent applications of the enterprise.
3.2.3 Control variables
Drawing on previous research (Liu et al., 2021; Jo et al., 2015; Ji et al., 2024), this study selected firm size, firm growth rate, capital structure, nature of property rights, cash holdings, ownership concentration, and executive compensation as control variables. Additionally, the study year was included as a dummy variable. The details of these variables are listed in Table 1.
Table 1
| Variable type | Variable name | Variable symbol | Definition |
|---|---|---|---|
| Independent variable | Corporate ecological and environmental responsibility | CEER | Total score of CEER |
| Pollution prevention responsibility | Pollution | Pollution prevention score of CEER | |
| Green product responsibility | Product | Green product score of CEER | |
| Forest sustainability responsibility | Forest | Forest sustainability score of CEER | |
| Dependent variable | Operational performance | OP | Earnings before interest and tax/Average total assets |
| Mediating variable | Green innovation | GI | Ln (number of enterprise green patent applications + 1) |
| Control variable | Firm size | Size | Natural logarithm of total assets |
| Firm growth rate | Growth | Growth rate of total assets | |
| Capital structure | Leverage | Liabilities/owner's equity | |
| Nature of property rights | State | State-owned enterprises are 1, otherwise 0 | |
| Cash holdings | Cash | Natural logarithm of ending cash | |
| Ownership concentration | Top1 | Share proportion of the top 1 shareholder | |
| Executive compensation | Salary | Total executive compensation/total revenue | |
| Year | Year | Set the year as a dummy variable |
Definition of variables.
3.3 Models and methods
This paper adopts the sequential regression method and constructs the following model to test the influence mechanism of forestry enterprises' ecological and environmental responsibilities on their operating performance:
-
(1) Model to test the impact of forestry CEER on operating performance:
-
(2) Model to test the impact of CEER on green innovation:
-
(3) Model to test the impact of green innovation on operating performance:
-
(4) Model to test the mediating effect of green innovation:
Where OP refers to operating performance, GI is the mediating variable green innovation, CEER refers to ecological and environmental responsibility, control denotes the control variables, μ, ε, and β0 represents the fixed effect, random disturbance term, and constant term, respectively.
4 Empirical results
4.1 Descriptive statistics and correlation test
Figure 5 shows the box plots of the annual CEER level and its three dimensions, showing the data distribution. The dispersion of the data points to a significant gap in forestry CEER performance, which might result from the varied strategies adopted by forestry enterprises. The CEER showed a fluctuating upward trend from 2009 to 2021, this trend may be related to the deepening of China's policies on ecological civilization construction. For example, the “13th Five-Year Plan” (2016–2020) explicitly required enterprises to improve their environmental performance. The growth rate of CEER accelerated after 2017, but the degree of variation increased simultaneously, reflecting the inconsistent response speeds of enterprises under policy promotion.
Figure 5
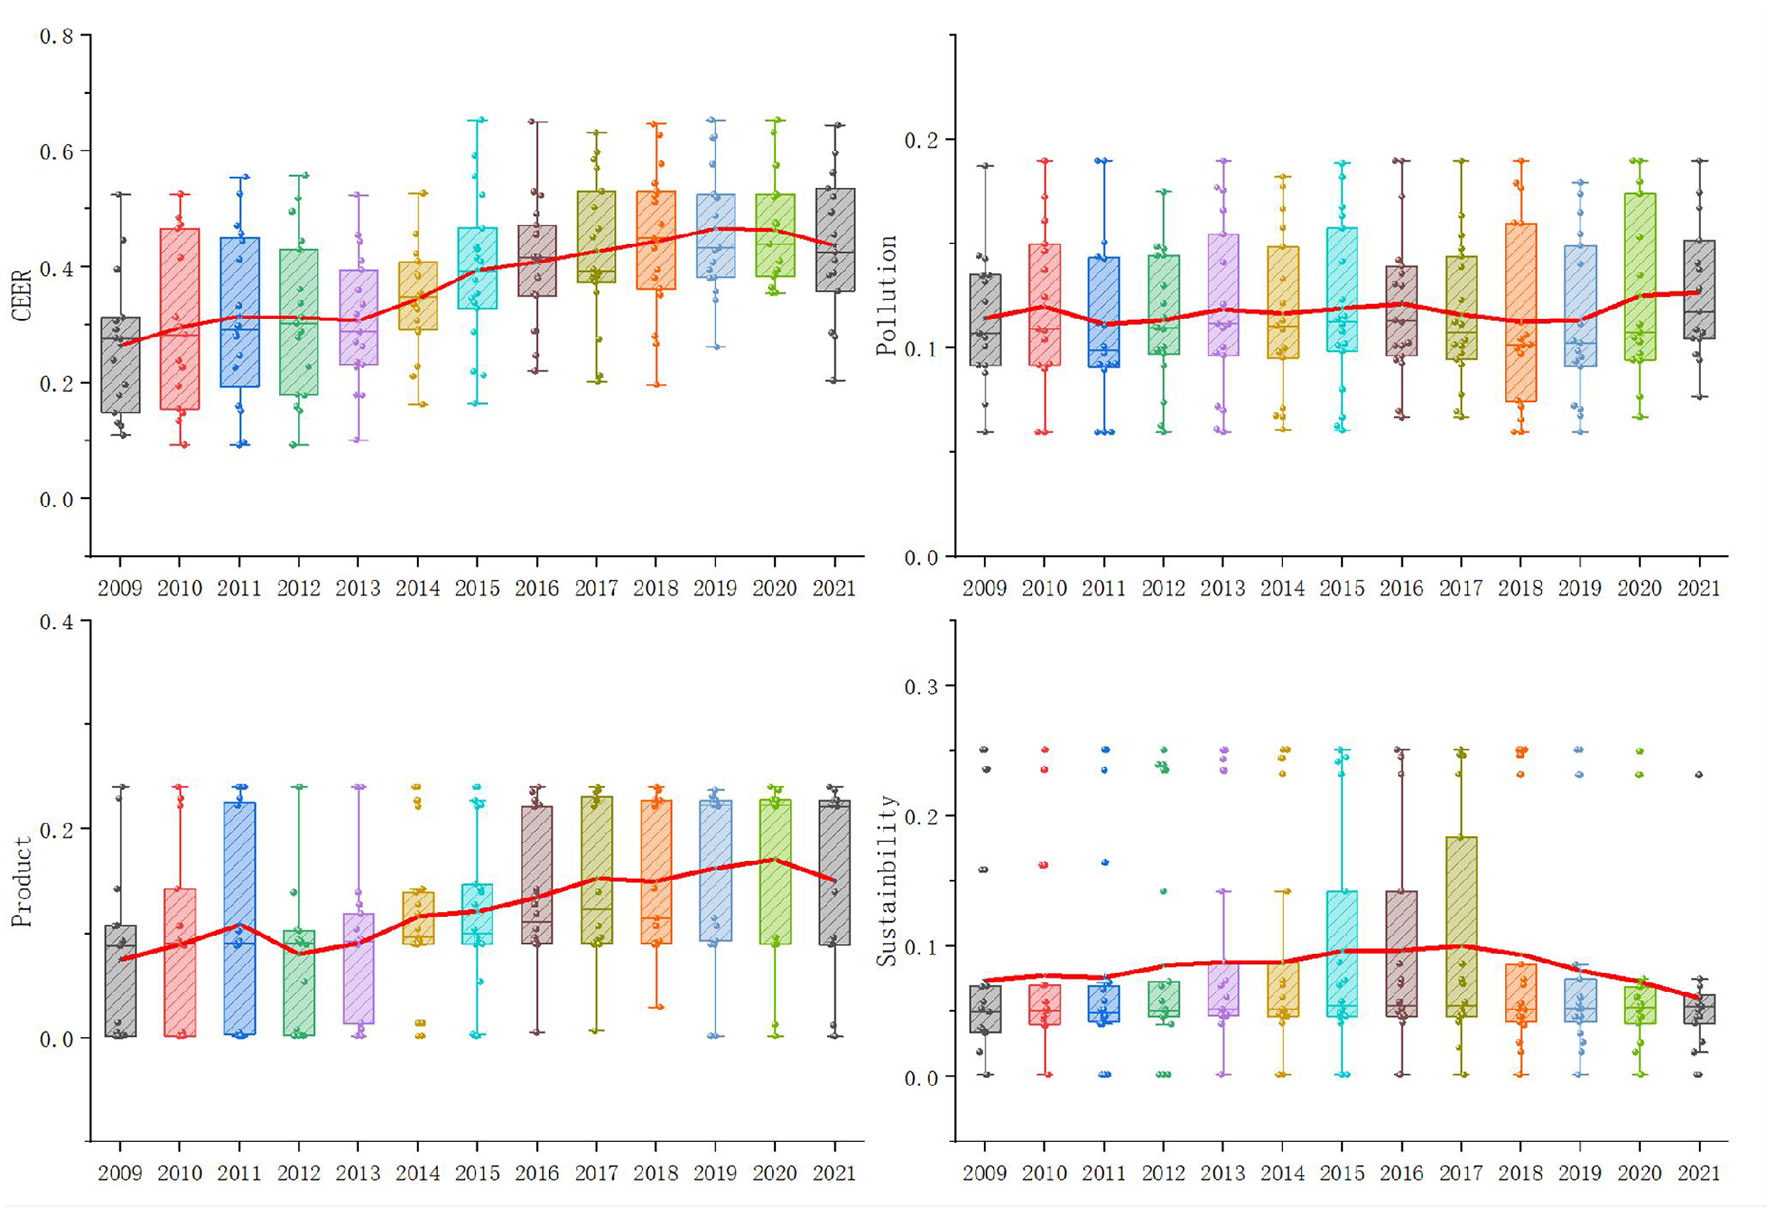
Description of CEER.
In terms of specific dimensions, the Pollution component shows marked fluctuations. The Product dimension follows a trend comparable to the overall CEER levels, while the Forest dimension exhibits an inverted U-shaped pattern. These changes reflect the dynamic nature of forestry environmental responsibility. The upward trend in CEER indicates that forestry companies are becoming more aware of the importance of forests and environmental protection. This aligns with growing attention from society and the government toward ecological sustainability.
As shown in Table 2, the average operational performance of forestry enterprises is 2.828%, indicating that their overall operating performance is less than satisfactory and there is significant variability in operational performance across the sample. For CEER, only 45 samples' CEER scores are above 0.5, accounting for less than a quarter of the total, suggesting that the CEER of forestry enterprises is still relatively low. The average values of pollution prevention, green product, and forest sustainability responsibility are 0.117, 0.128, and 0.085, respectively. This shows that forestry enterprises focus more on pollution prevention and green products while paying less attention to forest sustainability. The average value of GI is 1.337, this indicates that forestry enterprises maintain a certain number of green patent applications, which is closely related to the industry characteristics of forestry enterprises.
Table 2
| Variable | Obs | Mean | Std. Dev. | Min | Max |
|---|---|---|---|---|---|
| OP | 215 | 2.828 | 4.124 | −8.826 | 13.53 |
| CEER | 215 | 0.377 | 0.138 | 0.093 | 0.653 |
| Pollution | 215 | 0.117 | 0.039 | 0.038 | 0.213 |
| Product | 215 | 0.128 | 0.092 | 0.000 | 0.364 |
| Sustainable | 215 | 0.085 | 0.078 | 0.000 | 0.258 |
| GI | 215 | 1.337 | 0.787 | 0.000 | 2.303 |
| Size | 215 | 22.482 | 1.066 | 20.662 | 25.308 |
| Growth | 215 | 0.108 | 0.244 | −0.326 | 1.489 |
| Leverage | 215 | 1.216 | 0.919 | 0.109 | 4.544 |
| State | 215 | 0.405 | 0.492 | 0.000 | 1.000 |
| Cash | 215 | 19.859 | 1.160 | 16.877 | 21.957 |
| Top1 | 215 | 34.327 | 15.228 | 8.069 | 70.317 |
| Salary | 215 | 14.019 | 0.797 | 12.414 | 16.049 |
Descriptive statistics.
Table 3 presents the results of the Pearson correlation analysis of variables. CEER is positively correlated with green innovation and is significant at the 1%. Pollution prevention and green product responsibility are significantly and positively correlated with green innovation at the 1% and 5%, respectively. This indicates a significant positive correlation between forestry CEER and its green innovation. green innovation is also positively correlated with operating performance at the 1% significance level. The hypotheses of this paper are preliminarily verified. It is found from the table that the correlation coefficients between variables are all lower than 0.6, indicating that there is no serious multicollinearity between variables, and regression analysis can be conducted.
Table 3
| Variable | OP | CEER | Pollution | Product | Sustainable | Innovation |
|---|---|---|---|---|---|---|
| OP | 1 | |||||
| CEER | 0.072 | 1 | ||||
| Pollution | 0.159* | 0.384*** | 1 | |||
| Product | 0.167* | 0.570*** | 0.253*** | 1 | ||
| Sustainable | −0.295*** | 0.392*** | 0.032 | 0.073 | 1 | |
| GI | 0.407*** | 0.260*** | 0.341*** | 0.143** | 0.051 | 1 |
| Size | 0.013 | 0.200** | 0.026 | 0.433*** | −0.034 | −0.287*** |
| Growth | 0.416*** | −0.089 | 0.027 | −0.034 | −0.152* | 0.012 |
| Leverage | −0.270*** | −0.098 | −0.050 | 0.035 | −0.090 | 0.056 |
| State | −0.447*** | 0.364*** | 0.176** | 0.135 | 0.565*** | 0.598*** |
| Cash | 0.421*** | 0.088 | 0.192** | 0.458*** | −0.057 | −0.375*** |
| Top1 | 0.333*** | −0.116 | 0.142 | 0.051 | −0.576*** | −0.194*** |
| Salary | 0.067 | 0.167* | −0.062 | 0.223** | −0.040 | −0.314*** |
Correlation test.
***, **, and * indicate statistical significance at the 1%, 5%, and 10% levels, respectively.
4.2 Regression results of CEER, OP, and GI
To test the relationship among CEER, green innovation, and operational performance of forestry companies, this paper conducts a regression analysis on Models 1–4. It uses the fixed-effect model (FE) for verification. The regression results are presented in Table 4.
Table 4
| Variables | (1) | (2) | (3) | (4) |
|---|---|---|---|---|
| OP | Innovation | OP | OP | |
| CEER | 6.044** | 1.133** | 5.013* | |
| (2.845) | (2.469) | (1.929) | ||
| Innovation | 1.591*** | 1.471*** | ||
| (6.143) | (5.370) | |||
| Size | −2.980* | −0.275 | −1.232 | −1.836 |
| (−1.900) | (−1.087) | (−1.017) | (−1.448) | |
| Growth | 4.374*** | 0.533** | 3.213*** | 3.178*** |
| (5.460) | (2.613) | (3.824) | (3.796) | |
| Leverage | 0.0265 | −0.00424 | −0.481 | −0.334 |
| (0.0309) | (−0.0253) | (−0.656) | (−0.474) | |
| State | −8.107*** | −0.140 | −8.236*** | −8.212*** |
| (−8.051) | (−0.727) | (−9.238) | (−9.662) | |
| Cash | 0.956** | 0.0617 | 0.919* | 0.992* |
| (2.342) | (0.860) | (1.885) | (2.042) | |
| Top1 | 0.101 | 0.0220 | 0.0337 | 0.0436 |
| (1.461) | (1.625) | (0.515) | (0.794) | |
| Salary | 0.611 | −0.0158 | 1.172 | 0.997 |
| (0.994) | (−0.0993) | (1.625) | (1.553) | |
| Year | Control | Control | Control | Control |
| Constant | 38.84 | 5.087 | −3.854 | 8.448 |
| (1.075) | (0.926) | (−0.152) | (0.307) | |
| Observations | 215 | 215 | 215 | 215 |
| R-squared | 0.373 | 0.179 | 0.380 | 0.400 |
| Number of code | 18 | 18 | 18 | 18 |
Regression result of CEER, OP, and GI.
***, **, and * indicate statistical significance at the 1%, 5%, and 10% levels, respectively.
The regression coefficient of CEER in Column 1 is 6.044, which is statistically significant at the 5% significance level. This result suggests that CEER exerts a significant positive effect on operational performance. Specifically, fulfilling ecological and environmental responsibilities necessitates enterprises to implement resource-saving measures, reduce operational costs, and enhance operational efficiency—all of which can positively impact operational performance. This research result is consistent with the conclusion of Xu et al. (2021), who demonstrate that corporate environmental responsibility can increase the firms' return on equity and economic added value margin by 2.62% and 0.10%, respectively. Thus, H1 is supported.
The regression coefficient of CEER in Column 2 is 1.133, and it has passed the 5% significance test, which indicates that the fulfillment of CEER can motivate enterprises to carry out green innovation and improve their green innovation level. The forestry CEER aims to reduce environmental pollution and increase the positive environmental externalities. To achieve these goals, forestry enterprises must make efforts in green innovation. They must implement innovations in technologies such as advanced wastewater treatment, energy-saving and low-carbon manufacturing technologies, and clean production technologies. Forestry enterprises' fulfillment of CEER and their development of green technological innovation share a common goal: to reduce resource input, minimize environmental damage, alleviate the rising pressure of resource costs, and promote a virtuous cycle of economic development. This research conclusion is consistent with the aforementioned research conclusions, that is, corporate ecological and environmental responsibility can enhance the level of corporate green innovation. Thus, H2 is supported.
Column 3 examines the impact of green innovation (GI) on operational performance. The regression coefficient of GI is 1.591, which is significant at the 1% level. This indicates that green innovation has a significant positive impact on operational performance. Column 4 tests the joint impact of the independent variable CEER and the mediating variable GI on operational performance. The regression results show that the coefficients of the independent and mediating variables are positive, and they have passed the significance tests at the 1% and 10% levels, respectively. CEER's regression coefficient in Column 4 is lower than that in Column 1 after including the mediating variable, but remains significant. This indicates that green innovation partially mediates between the independent variable CEER and the dependent variable OP, that is, forestry enterprises can improve their operational performance by enhancing their green innovation capabilities. Thus, H3 is supported.
4.3 Further analysis based on the content of CEER
The mediating effect of forestry green innovation on CEER and operating performance has been confirmed in the above analysis. To clarify which type of CEER affects operating performance through the mediating variable of green innovation, this paper conducts a mediating effect test for three specific types of CEER, respectively. The regression results are shown in Tables 5–7.
Table 5
| Variables | (1) | (2) | (3) | (4) |
|---|---|---|---|---|
| OP | Innovation | OP | OP | |
| Pollution | 13.45** | 7.044*** | 3.852 | |
| (2.704) | (3.959) | (0.734) | ||
| Innovation | 1.429*** | 1.362*** | ||
| (4.164) | (3.989) | |||
| Size | −2.477 | −0.165 | −2.252 | −2.252 |
| (−1.511) | (−0.651) | (−1.568) | (−1.554) | |
| Growth | 4.538*** | 0.537*** | 3.790*** | 3.806*** |
| (5.567) | (2.900) | (4.955) | (5.037) | |
| Leverage | −0.0543 | −0.00324 | −0.0617 | −0.0498 |
| (−0.0692) | (−0.0253) | (−0.0907) | (−0.0761) | |
| State | −8.595*** | −0.405** | −7.885*** | −8.043*** |
| (−7.659) | (−2.148) | (−8.668) | (−8.344) | |
| Cash | 0.826* | 0.0268 | 0.795* | 0.789* |
| (2.032) | (0.314) | (1.987) | (1.988) | |
| Top1 | 0.109 | 0.0264* | 0.0695 | 0.0734 |
| (1.316) | (1.806) | (1.033) | (1.060) | |
| Salary | 0.676 | −0.0114 | 0.698 | 0.692 |
| (0.955) | (−0.0847) | (0.945) | (0.932) | |
| Year | Control | Control | Control | Control |
| Constant | 29.51 | 2.747 | 26.02 | 25.77 |
| (0.790) | (0.553) | (0.781) | (0.767) | |
| Observations | 215 | 215 | 215 | 215 |
| R-squared | 0.364 | 0.262 | 0.429 | 0.430 |
The mediating effect of green innovation on pollution prevention responsibility and operating performance.
***, **, and * indicate statistical significance at the 1%, 5%, and 10% levels, respectively.
Table 6
| Variables | (1) | (2) | (3) | (4) |
|---|---|---|---|---|
| OP | Innovation | OP | OP | |
| Product | 7.291* | 0.949 | 4.559 | |
| (1.880) | (1.011) | (1.547) | ||
| Innovation | 1.429*** | 1.381*** | ||
| (4.164) | (4.079) | |||
| Size | −1.383 | −0.215 | −2.252 | −2.384 |
| (−0.906) | (−0.808) | (−1.568) | (−1.616) | |
| Growth | 4.050*** | 0.579*** | 3.790*** | 3.822*** |
| (4.508) | (3.017) | (4.955) | (5.189) | |
| Leverage | −0.656 | −0.0265 | −0.0617 | −0.0540 |
| (−0.737) | (−0.158) | (−0.0907) | (−0.0816) | |
| State | −8.721*** | −0.144 | −7.885*** | −7.940*** |
| (−8.114) | (−0.737) | (−8.668) | (−8.704) | |
| Cash | 0.781 | 0.0287 | 0.795* | 0.728* |
| (1.560) | (0.368) | (1.987) | (1.879) | |
| Top1 | 0.0640 | 0.0223 | 0.0695 | 0.0724 |
| (0.840) | (1.584) | (1.033) | (1.144) | |
| Salary | 1.281* | −0.00309 | 0.698 | 0.679 |
| (1.790) | (−0.0194) | (0.945) | (0.955) | |
| Year | Control | Control | Control | Control |
| Constant | 1.213 | 4.468 | 26.02 | 26.02 |
| (0.0348) | (0.770) | (0.781) | (0.781) | |
| Observations | 215 | 215 | 215 | 215 |
| R-squared | 0.290 | 0.168 | 0.429 | 0.429 |
| Number of code | 18 | 18 | 18 | 18 |
The mediating effect of green innovation on green product responsibility and operating performance.
***, **, and * indicate statistical significance at the 1%, 5%, and 10% levels, respectively.
Table 7
| Variables | (1) | (2) | (3) | (4) |
|---|---|---|---|---|
| OP | Innovation | OP | OP | |
| Sustainable | 10.82 | 2.247 | 7.665 | |
| (0.999) | (0.845) | (0.785) | ||
| Innovation | 1.429*** | 1.405*** | ||
| (4.164) | (3.883) | |||
| Size | −2.836 | −0.254 | −2.252 | −2.478 |
| (−1.663) | (−0.893) | (−1.568) | (−1.628) | |
| Growth | 4.607*** | 0.576*** | 3.790*** | 3.797*** |
| (5.566) | (2.936) | (4.955) | (4.986) | |
| Leverage | −0.0352 | −0.0145 | −0.0617 | −0.0148 |
| (−0.0386) | (−0.0830) | (−0.0907) | (−0.0212) | |
| State | −6.978*** | 0.0939 | −7.885*** | −7.110*** |
| (−4.353) | (0.265) | (−8.668) | (−5.036) | |
| Cash | 0.907** | 0.0536 | 0.795* | 0.832** |
| (2.308) | (0.723) | (1.987) | (2.213) | |
| Top1 | 0.101 | 0.0219 | 0.0695 | 0.0700 |
| (1.208) | (1.397) | (1.033) | (1.049) | |
| Salary | 0.730 | 0.00719 | 0.698 | 0.720 |
| (1.056) | (0.0437) | (0.945) | (0.998) | |
| Year | Control | Control | Control | Control |
| Constant | 35.35 | 4.514 | 26.02 | 29.01 |
| (0.929) | (0.783) | (0.781) | (0.843) | |
| Observations | 215 | 215 | 215 | 215 |
| R-squared | 0.352 | 0.165 | 0.429 | 0.432 |
| Number of code | 18 | 18 | 18 | 18 |
The mediating effect of green innovation on forest sustainability responsibility and operating performance.
***, **, and * indicate statistical significance at the 1%, 5%, and 10% levels, respectively.
Column 1 of Table 5 shows that the pollution prevention responsibility of forestry enterprises has a positive impact on their operating performance at the 5% significance level. Column 2 indicating that the pollution prevention behaviors of forestry enterprises can effectively promote the improvement of their innovation capabilities. Environmental policies will regulate the pollution behaviors of forestry companies. Although enterprises can cope with environmental regulations by paying pollution emission fines in the short term, in the long run, as environmental policies become increasingly stringent, enterprises will make a more rational choice to increase green innovation. The coefficient of Pollution in Column 4 is 3.852, which has decreased significantly compared with its coefficient in Column 1 and is no longer significant. Therefore, green innovation fully mediates the relationship between pollution prevention responsibility and operating performance. In other words, forestry enterprises' pollution prevention responsibility can promote the level of operating performance by improving green innovation capabilities.
Table 6 shows that the green product responsibility positively impacts operational performance at the 10% significance level. Although the green innovation has a significant impact on operational performance, the effect of green product responsibility on green innovation is positive yet statistically insignificant. Thus, the mediating effect is not supported. Specifically, green product responsibility in forestry enterprises fails to enhance operating performance through green innovation. The disruption of this mediating effect chain can be explained by the following two aspects:
On the one hand, the behaviors of forestry enterprises in fulfilling green product responsibility are mostly concentrated in basic compliance links such as product environmental certification and raw material traceability. Although such behaviors can meet the basic requirements of green products, they do not go deep into innovative aspects such as technological research and process upgrading. Such superficial fulfillment of responsibilities naturally cannot have a significant pulling effect on green innovation.
On the other hand, the core competitiveness of green products in the forestry field relies more on the quality of raw materials rather than technological breakthroughs in the production process. Therefore, enterprises' investment mainly focuses on improving the environmental standards of raw materials, which has a weak correlation with green technologies, making it difficult for the former to drive the improvement of the latter significantly.
Column 1 of Table 7 presents the total effect of forest sustainability on the operational performance. Forest sustainability responsibility positively impacts financial performance, but it is not significant. Column 2 shows that forest sustainability responsibility positively impacts green innovation but fails to pass the significance test. Column 3 indicates that green innovation positively impacts operating performance at the 1% significance level. Column 4 examines the joint impact of the independent variable and the mediating variable on the dependent variable, which shows that the coefficient of green innovation is positive and significant at the 1% level. In contrast, the coefficient of Sustainable remains insignificant. Thus, the mediating effect does not hold: Forest sustainability responsibility cannot improve operating performance through green innovation.
The non-significant relationship merits in-depth discussion, and two plausible explanations are proposed here. First, forest sustainability responsibility is characterized by long-term investment cycles and public-good attributes. Unlike general environmental management practices, forest land conservation and biological asset maintenance require continuous capital and labor input over an extended period, while their ecological and economic benefits are often difficult to materialize in the short term. Given that this study measures OP using short-term financial indicators (ROA), the lagged benefits of forest sustainability responsibility cannot be captured effectively, leading to the non-significant statistical results. Second, the measurement approach of forest sustainability responsibility in this study may have limitations in reflecting the quality of sustainable management. A larger forest land area or biological asset scale does not necessarily equate to high-standard sustainable practices. If enterprises merely expand the scale of forest resources without optimizing management efficiency, such input may fail to drive technological innovation or improve operational performance, resulting in the observed non-significant relationship.
4.4 Heterogeneity test
Forestry enterprises can be divided into state-owned and private enterprises according to their property rights. Due to the differences in property rights, there are specific differences in the governance models of enterprises. Compared with private enterprises, state-owned enterprises undertake more social functions besides production and operation. Then, does the mediating effect of green innovation on CEER and operating performance vary due to differences in property rights? This paper divides the sample enterprises into state-owned and private groups and tests the property right heterogeneity of the mediating effect of green innovation.
The regression results of state-owned group are shown in Table 8. The impact of CEER of state-owned forestry enterprises on operating performance is positive and passes the 5% significance test. The impact of green innovation of state-owned forestry enterprises on operating performance is positive and passes the 5% significance test, however, CEER has a positive impact on green innovation but fails to pass the significance test. Thus, the mediating effect is not established. This may be related to the characteristics of state-owned enterprises. The innovation motivation of enterprises mainly comes from the pressure of survival and development: if enterprises do not engage in continuous innovation activities, they will not be able to survive in the fierce market competition environment, nor will they be able to grow and develop. Due to the guarantee from the state, state-owned enterprises lack a sense of survival crisis, have insufficient awareness of innovation, and thus lack the motivation to carry out innovation activities (Liu et al., 2022). Besides, state-owned enterprises managers often face multiple political objectives such as employment stability and regional economic development, which may lead them to prioritize short-term policy compliance over long-term green innovation efficiency (Wu et al., 2020).
Table 8
| Variables | (1) | (2) | (3) | (4) |
|---|---|---|---|---|
| OP | Innovation | OP | OP | |
| CEER | 8.280** | 1.105 | 5.555 | |
| (2.736) | (1.502) | (1.394) | ||
| Innovation | 1.295** | 1.215** | ||
| (2.901) | (2.387) | |||
| Size | −5.330*** | −0.484 | −2.574 | −3.227* |
| (−5.288) | (−1.261) | (−1.843) | (−2.267) | |
| Growth | 3.340** | 0.745** | 2.049** | 2.001** |
| (3.482) | (3.079) | (3.070) | (2.835) | |
| Leverage | 0.488 | 0.0445 | 0.111 | 0.224 |
| (0.479) | (0.225) | (0.143) | (0.281) | |
| Cash | 1.808* | 0.120 | 1.697* | 1.738** |
| (2.114) | (0.750) | (2.315) | (2.485) | |
| Top1 | 0.0549 | 0.0343 | −0.0239 | −0.0194 |
| (0.790) | (1.334) | (−0.295) | (−0.285) | |
| Salary | 0.239 | −0.238 | 1.231 | 1.072 |
| (0.300) | (−1.202) | (1.231) | (1.268) | |
| Year | Control | Control | Control | Control |
| Constant | 73.95*** | 11.25 | 7.018 | 20.51 |
| (6.103) | (1.445) | (0.278) | (0.752) | |
| Observations | 87 | 87 | 87 | 87 |
| R-squared | 0.321 | 0.241 | 0.294 | 0.316 |
| Number of code | 8 | 8 | 8 | 8 |
Test of the mediating effect of green innovation: state-owned group.
***, **, and * indicate statistical significance at the 1%, 5%, and 10% levels, respectively.
Table 9 shows that the impact of CEER on operating performance is significant positive, indicating that the private enterprises' CEER can significantly improve their operating performance. The impact of green innovation on operating performance is positive significant. Compared with Column 1, CEER's coefficient in column has decreased and become insignificant. This indicates that green innovation of private enterprises has a full mediating effect on CEER and operating performance. That is, private forestry enterprises can improve operating performance by enhancing green innovation. Compared with state-owned enterprises, private enterprises rely on a highly market-oriented operation mechanism to survive in competition. As the external environment becomes more complex, private enterprises face many challenges (Vasileiou et al., 2022). More and more private enterprises have realized that innovation is the key to turning crises into opportunities, which makes them increase investment in innovation. Under the fierce market competition and strict environmental regulations, the management teams have formulated targeted incentive policies to encourage innovation. Consequently, employees of private enterprises are more motivated to engage in green innovation practices. These practices not only create sustainable competitive advantages for them, but also enhance their corporate reputation, and finally improve their operational performance.
Table 9
| Variables | (1) | (2) | (3) | (4) |
|---|---|---|---|---|
| OP | Innovation | OP | OP | |
| CEER | 4.773* | 1.559** | 3.169 | |
| (1.829) | (2.461) | (1.241) | ||
| Innovation | 1.524*** | 1.458*** | ||
| (4.429) | (4.324) | |||
| Size | 0.432 | −0.403 | 0.583 | 0.190 |
| (0.221) | (−1.144) | (0.378) | (0.118) | |
| Growth | 4.932*** | 0.395 | 5.209*** | 5.149*** |
| (3.573) | (1.629) | (5.443) | (5.285) | |
| Leverage | −2.969*** | −0.5343* | −2.617*** | −2.380*** |
| (−5.991) | (−2.16) | (−4.160) | (−4.627) | |
| Cash | 0.397 | 0.164 | 0.123 | 0.186 |
| (0.601) | (1.463) | (0.219) | (0.311) | |
| Top1 | 0.165 | 0.0104 | 0.117 | 0.120 |
| (1.661) | (0.671) | (1.564) | (1.759) | |
| Salary | 1.521 | 0.379 | 1.218 | 1.027 |
| (1.669) | (1.093) | (1.242) | (1.185) | |
| Year | Control | Control | Control | Control |
| Constant | −39.13 | 0.795 | −33.10 | −24.17 |
| (−0.744) | (0.142) | (−0.871) | (−0.619) | |
| Observations | 128 | 128 | 128 | 128 |
| R-squared | 0.482 | 0.128 | 0.484 | 0.493 |
| Number of code | 11 | 11 | 11 | 11 |
Test of the mediating effect of green innovation: private group.
***, **, and * indicate statistical significance at the 1%, 5%, and 10% levels, respectively.
4.5 Robustness test
To ensure the robustness and reliability of the results, this paper draws on the approach of Wang et al. (2023) and Zheng et al. (2021) to replace the variable of green innovation (Creativity). If a company has applications for green invention patents, green utility model patents, or green design patents, the value is set to 1; otherwise, it is set to 0. After replacing the variable, the model is regressed again to further conduct a robustness test on the research hypotheses. The regression results are shown in Table 10. It can be seen that CEER has a significant positive impact on both operating performance and green innovation. In Column 4, after adding the mediating variable (Creativity) based on Column 1, the regression coefficient of Creativity is significantly positive at the 1% level, while the coefficient of CEER has decreased compared with Column 1 but remains significantly positive. This indicates that green innovation partially mediates CEER and operating performance in forestry enterprises, proving that the research conclusions are robust.
Table 10
| Variables | (1) | (2) | (3) | (4) |
|---|---|---|---|---|
| OP | Innovation | OP | OP | |
| CEER | 6.044** | 0.934** | 4.575** | |
| (2.845) | (2.673) | (2.212) | ||
| Creativity | 1.742*** | 1.572*** | ||
| (4.260) | (3.917) | |||
| Size | −2.980* | −0.107 | −2.460 | −2.812* |
| (−1.900) | (−0.665) | (−1.699) | (−1.966) | |
| Growth | 4.374*** | 0.202 | 4.198*** | 4.056*** |
| (5.460) | (1.449) | (5.108) | (5.099) | |
| Leverage | 0.0265 | −0.0128 | −0.0453 | 0.0466 |
| (0.0309) | (−0.172) | (−0.0565) | (0.0594) | |
| State | −8.107*** | −0.131 | −7.856*** | −7.900*** |
| (−8.051) | (−0.928) | (−8.432) | (−8.751) | |
| Cash | 0.956** | 0.0312 | 0.829* | 0.907** |
| (2.342) | (0.493) | (1.995) | (2.220) | |
| Top1 | 0.101 | 0.0133 | 0.0778 | 0.0804 |
| (1.461) | (1.399) | (1.108) | (1.339) | |
| Salary | 0.611 | −0.0004 | 0.676 | 0.611 |
| (0.994) | (−0.00311) | (0.915) | (0.913) | |
| Year | Control | Control | Control | Control |
| Constant | 12.72 | 1.854 | 30.82 | 36.60 |
| (0.339) | (0.583) | (0.894) | (1.079) | |
| Observations | 215 | 215 | 215 | 215 |
| R-squared | 0.416 | 0.173 | 0.402 | 0.417 |
| Number of code | 18 | 18 | 18 | 18 |
Robustness test of the mediating effect of green innovation.
***, **, and * indicate statistical significance at the 1%, 5%, and 10% levels, respectively.
5 Discussions
5.1 Conclusions and policy implications
This study aims to explore the path through which forestry companies' ecological and environmental responsibilities affect operating performance. By introducing green innovation as a mediating variable, it thoroughly reveals the internal process and mechanism through which CEER influences operational performance via green innovation. Based on the empirical analysis, the key findings and conclusions are summarized as follows:
First, forestry companies' CEER serves as a critical driver of green innovation. The core objective of CEER is to mitigate negative environmental externalities while amplifying positive ecological impacts. This goal can be attained through pollution reduction, improved forest resource utilization, and green product development, all of which are inherently dependent on green innovation. For forestry enterprises, green innovation is not only a necessary pathway to fulfilling CEER obligations, but also a fundamental means of improving ecological conditions in step with operational development.
Second, forestry CEER influences operational performance by affecting green innovation levels, indicating that green innovation plays a mediating role in CEER and operational performance. Specifically, the fulfillment of CEER drives forestry enterprises to enhance their green innovation capacity, a process that further facilitates the accumulation of green knowledge, technologies, and capabilities for addressing the environmental uncertainties inherent to forestry operations, such as resource constraints and ecological regulatory requirements. These core elements in turn enable forestry enterprises to build competitive advantages through cleaner production technology adoption and waste recycling during forestry operations, while such advantages are subsequently translated into productivity gains, enhanced sustainable competitiveness, and ultimately, improved operational performance.
Third, the mediating effect of green innovation exclusively derived from pollution prevention responsibility, while green product responsibility and forest sustainability responsibility do not influence operating performance through green innovation levels. Specifically, under stringent environmental policies, enterprises are compelled to invest in end-of-pipe treatment, cleaner production and waste recycling to mitigate risks and cut costs, thereby boosting performance. In contrast, green product responsibility only involves basic compliance practices such as environmental certification and raw material traceability with weak links to technological innovation, while forest sustainability responsibility focuses on forestland protection and logging restrictions, crowding out green innovation investment and failing to drive performance improvements through this channel.
Fourth, the mediating effect of green innovation exhibits ownership heterogeneity. It is significant only for private forestry enterprises but is insignificant for state-owned ones. Private enterprises, facing greater market competition pressures, are more inclined to transform CEER into operational advantages through green innovation. In contrast, under relatively lower operational pressures and lacking innovation incentives, state-owned enterprises struggle to enhance operational performance effectively via green innovation.
Based on the above research conclusions, this study proposes the following policy recommendations:
First, relevant authorities need to consider strengthening policy support for the CEER of forestry enterprises to promote sustainable development. The research results show that forestry CEER can improve operating performance through green innovation, so relevant authorities are advised to further enhance support for enterprises in fulfilling CEER obligations. On one hand, it is recommended that industry-specific CEER standards be promptly established, clarifying the specific obligations, implementation methods, and supporting measures required of forestry enterprises to better guide compliance. On the other hand, a practical evaluation mechanism for CEER should be developed, encompassing data collection methods, assessment indicators, scoring methodologies, and the application of evaluation results. These evaluation outcomes can then serve as a key reference for government funding support and investor decision-making.
Second, forestry enterprises need to boost their environmental awareness to support sustainable development. Empirical results show that meeting CEER can lift operational performance. But at present, these enterprises tend to take a passive approach: they mainly act because of pressure from the government and society, and don't pay enough attention to the potential benefits and competitive edges that CEER can bring. So, enterprises have to change their thinking and take the initiative to shoulder ecological responsibilities. To start with, they should weave CEER into their corporate culture, ensuring everyone from management to staff has a strong, all-around sense of ecological responsibility. Then, they need to work out environmental responsibility strategies that fit their features. This includes setting up special departments to handle environmental strategy, with the goal of balancing environmental, social, and economic benefits.
Third, policymakers should prioritize strengthening policy incentives for CEER, particularly pollution prevention responsibilities, to promote green innovation. The research reveals that green innovation transmission pathway originates only from pollution prevention responsibilities. Consequently, policymakers should implement environmental regulations and elevate emission standards to compel enterprises to proactively pursue green innovation solutions. Simultaneously, enterprises should apply pollution prevention technologies, such as establishing pollution prevention R&D funds to support corporate technological breakthroughs. In addition, support systems for green products and forest sustainability responsibilities should be strengthened, as research shows that neither green product responsibility nor forest sustainability responsibility can drive operational performance through green innovation. So, government involvement is needed to encourage companies to take on these responsibilities.
Last, differentiated green innovation support policies should be put in place based on enterprise ownership, since the research finds that mediating effect of green innovation is significant only for private forestry enterprises but is insignificant for state-owned ones. For private enterprises, focus on market-oriented support, set up special green innovation funds, offer R&D subsidies, and build green technology trading platforms to make it easier to commercialize technologies. For state-owned enterprises, emphasize institutional reforms, such as adding green innovation indicators to executive performance evaluations. By taking these targeted steps, we can boost green innovation in all types of enterprises and help turn CEER into better operational performance.
5.2 Limitations and future research directions
This study has several limitations that should be acknowledged when interpreting its findings. First, the final sample consists of 215 firm-year observations, and the relatively small sample size may restrict the statistical power of the empirical tests and limit the generalizability of the conclusions. Specifically, the sample is dominated by listed forestry enterprises, which typically have stronger resource endowments, more standardized environmental management systems, and higher compliance with ecological regulations compared to unlisted or smaller forestry firms. Therefore, the observed relationships between CEER, green innovation, and operational performance may not fully reflect the reality of smaller or non-listed forestry enterprises in China. Second, this study faces the potential for reverse causality and omitted variable bias, which are inherent challenges in observational research designs. For instance, more profitable enterprises may have greater resources to invest in CEER and green innovation, and there may exist confounding variables (e.g., regional environmental regulation intensity, industry competition, corporate governance) that jointly influence CEER, green innovation, and operational performance.
Future research could address these limitations by expanding the sample size to include a more diverse range of forestry enterprises, covering both listed and unlisted firms, as well as small and medium-sized enterprises across different regions of China. Additionally, future studies could adopt more rigorous methods, such as instrumental variable techniques or natural experiment designs, to mitigate issues of reverse causality and omitted variable bias. Furthermore, exploring heterogeneous effects across firm scales, industries, and regional regulatory contexts could provide more targeted insights for policy formulation and corporate sustainable development practices.
Statements
Data availability statement
The raw data supporting the conclusions of this article are available from the authors on reasonable request.
Author contributions
FL: Writing – original draft, Writing – review & editing. YT: Writing – review & editing, Conceptualization. NC: Supervision, Writing – review & editing, Investigation, Conceptualization.
Funding
The author(s) declared that financial support was received for this work and/or its publication. This work was funded by the Natural Science Foundation of Fujian Province (Grant No. 2025J08131).
Conflict of interest
The author(s) declared that this work was conducted in the absence of any commercial or financial relationships that could be construed as a potential conflict of interest.
Generative AI statement
The author(s) declared that generative AI was not used in the creation of this manuscript.
Any alternative text (alt text) provided alongside figures in this article has been generated by Frontiers with the support of artificial intelligence and reasonable efforts have been made to ensure accuracy, including review by the authors wherever possible. If you identify any issues, please contact us.
Publisher’s note
All claims expressed in this article are solely those of the authors and do not necessarily represent those of their affiliated organizations, or those of the publisher, the editors and the reviewers. Any product that may be evaluated in this article, or claim that may be made by its manufacturer, is not guaranteed or endorsed by the publisher.
References
1
Branco M. C. Rodrigues L. L. (2006). Corporate social responsibility and resource-based perspectives. J. Bus. Ethics69, 111–132. doi: 10.1007/s10551-006-9071-z
2
Cherchyk L. Shershun M. Khumarova N. Mykytyn T. Cherchyk A. (2019). Assessment of forest enterprises' performance: integrating economic security and ecological impact. Entrep. Sustain. Issues6:1784. doi: 10.9770/jesi.2019.6.4(17)
3
Chung C. Y. Jung S. Young J. (2018). Do CSR activities increase firm value? Evidence from the Korean market. Sustainability10:3164. doi: 10.3390/su10093164
4
Coelho R. Jayantilal S. Ferreira J. J. (2023). The impact of social responsibility on corporate financial performance: a systematic literature review. Corp. Soc. Responsib. Environ. Manag.30, 1535–1560. doi: 10.1002/csr.2446
5
Dangelico R. M. (2016). Green product innovation: where we are and where we are going. Bus. Strateg. Environ.25, 560–576. doi: 10.1002/bse.1886
6
Dangelico R. M. Pujari D. Pontrandolfo P. (2017). Green product innovation in manufacturing firms: a sustainability-oriented dynamic capability perspective. Bus. Strateg. Environ.26, 490–506. doi: 10.1002/bse.1932
7
Ding X. Appolloni A. Shahzad M. (2022). Environmental administrative penalty, corporate environmental disclosures and the cost of debt. J. Clean. Prod.332:129919. doi: 10.1016/j.jclepro.2021.129919
8
Dögl C. Holtbrügge D. (2014). Corporate environmental responsibility, employer reputation and employee commitment: an empirical study in developed and emerging economies. Int. J. Hum. Resour. Manag.25, 1739–1762. doi: 10.1080/09585192.2013.859164
9
Gao L. Wan L. (2023). Does corporate environmental responsibility contribute to financial performance? A dual path analysis through operational efficiency and the cost of debt. Corp. Soc. Responsib. Environ. Manag.30, 308–323. doi: 10.1002/csr.2356
10
Gillan S. L. Koch A. Starks L. T. (2021). Firms and social responsibility: a review of ESG and CSR research in corporate finance. J. Corp. Fin.66:101889. doi: 10.1016/j.jcorpfin.2021.101889
11
González-Ramos M. I. Donate M. J. Guadamillas F. (2018). An empirical study on the link between corporate social responsibility and innovation in environmentally sensitive industries. Eur. J. Int. Manage.12, 402–422. doi: 10.1504/EJIM.2018.10012420
12
Hao X. Fu W. Albitar K. (2023). Innovation with ecological sustainability: does corporate environmental responsibility matter in green innovation?Journal of Econ. Anal.2, 21–42. doi: 10.58567/jea02030002
13
Hart S. L. Ahuja G. (1996). Does it pay to be green? An empirical examination of the relationship between emission reduction and firm performance. Bus. Strateg. Environ.5, 30–37. doi: 10.1002/(SICI)1099-0836(199603)5:1<30::AID-BSE38>3.0.CO;2-Q
14
Hart S. L. Dowell G. (2011). A natural-resource-based view of the firm: fifteen years after. J. Manage.37, 1464–1479. doi: 10.1177/0149206310390219
15
Holtbrügge D. Dögl C. (2012). How international is corporate environmental responsibility? A literature review. J. Int. Manage.18, 180–195. doi: 10.1016/j.intman.2012.02.001
16
Hu J. Wang S. Xie F. (2018). Environmental responsibility, market valuation, and firm characteristics: evidence from China. Corp. Soc. Responsib. Environ. Manage.25, 1376–1387. doi: 10.1002/csr.1646
17
Husted B. W. Allen D. B. (2009). Strategic corporate social responsibility and value creation: a study of multinational enterprises in Mexico. Manage. Int. Rev.49, 781–799. doi: 10.1007/s11575-009-0016-5
18
Ji C. Feng Y. Guo X. (2024). Environmental social responsibility, local environmental protection strategy, and corporate financial performance-empirical evidence from heavy pollution industry. Economics18:20220066. doi: 10.1515/econ-2022-0066
19
Jo H. Kim H. Park K. (2015). Corporate environmental responsibility and firm performance in the financial services sector. J. Bus. Ethics131, 257–284. doi: 10.1007/s10551-014-2276-7
20
Ke S. Zhang Z. Wang Y. (2023). China's forest carbon sinks and mitigation potential from carbon sequestration trading perspective. Ecol. Indic.148:110054. doi: 10.1016/j.ecolind.2023.110054
21
Kunapatarawong R. Martínez-Ros E. (2016). Towards green growth: how does green innovation affect employment?Res. Policy45, 1218–1232. doi: 10.1016/j.respol.2016.03.013
22
Le T. T. (2022). How do corporate social responsibility and green innovation transform corporate green strategy into sustainable firm performance?J. Clean. Prod.362:132228. doi: 10.1016/j.jclepro.2022.132228
23
Lee E. M. Park S. Y. Lee H. J. (2013). Employee perception of CSR activities: its antecedents and consequences. J. Bus. Res.66, 1716–1724. doi: 10.1016/j.jbusres.2012.11.008
24
Li N. Toppinen A. (2011). Corporate responsibility and sustainable competitive advantage in forest-based industry: complementary or conflicting goals?For. Policy Econ.13, 113–123. doi: 10.1016/j.forpol.2010.06.002
25
Lin B. Chen X. (2020). Environmental regulation and energy-environmental performance—empirical evidence from China's non-ferrous metals industry. J. Environ. Manage.269:110722. doi: 10.1016/j.jenvman.2020.110722
26
Liu R. Zhao M. Ren J. Ren J. (2022). The influence mechanism of corporate environmental responsibility on corporate performance: the mediation effect of green innovation. Sustainability14:10975. doi: 10.3390/su141710975
27
Liu Y. Xi B. Wang G. (2021). The impact of corporate environmental responsibility on financial performance based on Chinese listed companies. Environ. Sci. Pollut. Res.28, 7840–7853. doi: 10.1007/s11356-020-11069-4
28
Long F. Strielkowski W. Liu X. Uppal R. S. Chen Q. (2022). Combined evaluation of corporate ecological and environmental responsibility: evidence for forest preservation from Chinese forestry companies. Front. Ecol. Evol.10:1088804. doi: 10.3389/fevo.2022.1088804
29
Luo Y. Xiong G. Mardani A. (2022). Environmental information disclosure and corporate innovation: the “inverted U-shaped” regulating effect of media attention. J. Bus. Res.146, 453–463. doi: 10.1016/j.jbusres.2022.03.089
30
Matilainen A. M. (2013). Forest companies, corporate social responsibility, and company stakeholders in the Russian forest sector. For. Policy Econ.31, 44–49. doi: 10.1016/j.forpol.2011.12.006
31
Mori A. S. Lertzman K. P. Gustafsson L. (2017). Biodiversity and ecosystem services in forest ecosystems: a research agenda for applied forest ecology. J. Appl. Ecol.54, 12–27. doi: 10.1111/1365-2664.12669
32
Nguyen V. H. Vu N. H. (2023). Corporate environmental responsibility and innovation: empirical evidence from Vietnam. Int. J. Emerg. Mark.18, 4524–4544. doi: 10.1108/IJOEM-05-2021-0689
33
Nishitani K. Kaneko S. Fujii H. Komatsu S. (2011). Effects of the reduction of pollution emissions on the economic performance of firms: an empirical analysis focusing on demand and productivity. J. Clean. Prod. 19,1956–1964. doi: 10.1016/j.jclepro.2011.06.021
34
Peng B. Chen S. Elahi E. Wan A. (2021). Can corporate environmental responsibility improve environmental performance? An inter-temporal analysis of Chinese chemical companies. Environ. Sci. Pollut. Res.28, 12190–12201. doi: 10.1007/s11356-020-11636-9
35
Ratajczak P. Mikołajewicz G. (2021). The impact of environmental, social and corporate governance responsibility on the cost of short-and long-term debt. Econ. Bus. Rev.7, 74–96. doi: 10.18559/ebr.2021.2.6
36
Shao S. Hu Z. Cao J. Yang L. Guan D. (2020). Environmental regulation and enterprise innovation: a review. Bus. Strateg. Environ.29, 1465–1478. doi: 10.1002/bse.2446
37
Sobaih A. E. E. Hasanein A. Gharbi H. Abu Elnasr A. E. (2022). Going green together: effects of green transformational leadership on employee green behaviour and environmental performance in the Saudi food industry. Agriculture12:1100. doi: 10.3390/agriculture12081100
38
Suganthi L. (2020). Investigating the relationship between corporate social responsibility and market, cost and environmental performance for sustainable business. S. Afr. J. Bus. Manage.51, 1–13. doi: 10.4102/sajbm.v51i1.1630
39
Takalo S. K. Tooranloo H. S. (2021). Green innovation: a systematic literature review. J. Clean. Prod.279:122474. doi: 10.1016/j.jclepro.2020.122474
40
Testa M. D'Amato A. (2017). Corporate environmental responsibility and financial performance: does bidirectional causality work? Empirical evidence from the manufacturing industry. Soc. Responsib. J.13, 221–234. doi: 10.1108/SRJ-02-2016-0031
41
Vasileiou E. Georgantzis N. Attanasi G. Llerena P. (2022). Green innovation and financial performance: a study on Italian firms. Res. Policy51:104530. doi: 10.1016/j.respol.2022.104530
42
Villamor G. B. Wallace L. (2024). Corporate social responsibility: current state and future opportunities in the forest sector. Corp. Soc. Responsib. Environ. Manage.31, 3194–3209. doi: 10.1002/csr.2743
43
Wahba H. (2008). Does the market value corporate environmental responsibility? An empirical examination. Corp. Soc. Responsib. Environ. Manage.15, 89–99. doi: 10.1002/csr.153
44
Wang L. Juslin H. (2013). Corporate social responsibility in the Chinese forest industry: understanding multiple stakeholder perceptions. Corp. Soc. Responsib. Environ. Manage.20, 129–145. doi: 10.1002/csr.286
45
Wang L. Li M. Wang W. Gong Y. Xiong Y. (2023). Green innovation output in the supply chain network with environmental information disclosure: an empirical analysis of Chinese listed firms. Int. J. Prod. Econ.256:108745. doi: 10.1016/j.ijpe.2022.108745
46
Wong C. W. Miao X. Cui S. Tang Y. (2018). Impact of corporate environmental responsibility on operating income: moderating role of regional disparities in China. J. Bus. Ethics149, 363–382. doi: 10.1007/s10551-016-3092-z
47
Wu W. Liang Z. Zhang Q. (2020). Effects of corporate environmental responsibility strength and concern on innovation performance: the moderating role of firm visibility. Corp. Soc. Responsib. Environ. Manage.27, 1487–1497. doi: 10.1002/csr.1902
48
Xiong D. Liu H. Yang M. Duan Y. (2025). Does corporate environmental responsibility make firms greener in innovation? The role of knowledge flows. J. Knowl. Manage.29, 393–414. doi: 10.1108/JKM-09-2023-0896
49
Xu F. Yang M. Li Q. Yang X. (2020). Long-term economic consequences of corporate environmental responsibility: evidence from heavily polluting listed companies in China. Bus. Strateg. Environ.29, 2251–2264. doi: 10.1002/bse.2500
50
Xu Q. Lu Y. Lin H. Li B. (2021). Does corporate environmental responsibility (CER) affect corporate financial performance? Evidence from the global public construction firms. J. Clea. Prod.315:128131. doi: 10.1016/j.jclepro.2021.128131
51
Zhang X. Xu D. (2022). Assessing the eco-efficiency of complex forestry enterprises using LCA/time-series DEA methodology. Ecol. Indic.142:109166. doi: 10.1016/j.ecolind.2022.109166
52
Zheng M. Feng G. F. Jang C. L. Chang C. P. (2021). Terrorism and green innovation in renewable energy. Energy Econ.104:105695. doi: 10.1016/j.eneco.2021.105695
Summary
Keywords
China, corporate ecological and environmental responsibility, forestry companies, green innovation, operating performance
Citation
Long F, Tan Y and Chen N (2026) How forestry companies' ecological and environmental responsibilities affect operating performance: green innovation as a mediator. Front. For. Glob. Change 8:1723012. doi: 10.3389/ffgc.2025.1723012
Received
28 October 2025
Revised
23 December 2025
Accepted
29 December 2025
Published
22 January 2026
Volume
8 - 2025
Edited by
Otilia Manta, Romanian Academy, Romania
Reviewed by
Kamal Gnanaweera, University of Sri Jayewardenepura, Sri Lanka
Qurat-Ul-Ain Abro, University of International Business and Economics, China
Updates
Copyright
© 2026 Long, Tan and Chen.
This is an open-access article distributed under the terms of the Creative Commons Attribution License (CC BY). The use, distribution or reproduction in other forums is permitted, provided the original author(s) and the copyright owner(s) are credited and that the original publication in this journal is cited, in accordance with accepted academic practice. No use, distribution or reproduction is permitted which does not comply with these terms.
*Correspondence: Yunshu Tan, 22415032001@fafu.edu.cn; Niandong Chen, 171944938@qq.com
Disclaimer
All claims expressed in this article are solely those of the authors and do not necessarily represent those of their affiliated organizations, or those of the publisher, the editors and the reviewers. Any product that may be evaluated in this article or claim that may be made by its manufacturer is not guaranteed or endorsed by the publisher.