Abstract
Virgin oriental beech (Fagus orientalis L.) forests of the Hyrcanian region in northern Iran are among the last remnants of temperate old-growth ecosystems worldwide, yet their ecological benchmarks remain poorly defined. We conducted an integrated, multiscale assessment of three virgin 1-ha pure oriental beech stands located in the Hyrcanian forests of Guilan Province, with 60 randomly distributed plots capturing a suite of 62 structural and functional indicators. These encompassed forest structure, herbaceous diversity, humus chemistry, and soil physical, chemical, and biological properties, together with fine root traits. Results revealed exceptionally high basal area, abundant large-diameter trees, and broad crowns that collectively typify structurally mature, late-successional stands. The understory was dominated by shade-tolerant, Euro-Siberian taxa, highlighting long-term ecological continuity with minimal disturbance. Humus layers stored substantial carbon and nitrogen, while soils showed moderate fertility and evidence of constrained phosphorus availability, indicated by low microbial P and enzymatic activity. Fine root traits suggested conservative strategies optimized for stable nutrient acquisition under mature closed-canopy conditions. Multivariate analyses identified two dominant nutrient pathways: (i) a tightly coupled humus–microbial–soil C–N continuum that stabilizes long-term fertility, and (ii) a partially decoupled P cycle driven by enzymatic and fine root processes. This study provides the first quantitative, multiscale ecological indicator ranges for virgin oriental beech forests, establishing a comprehensive benchmark for these globally rare ecosystems. The integration of structural, biological, and chemical indicators provides a functional reference framework for detecting nutrient imbalance, soil degradation, or canopy disturbance in managed beech forests. These reference values support forest managers in identifying early signs of structural or functional degradation, designing long-term monitoring programs, and evaluating restoration success. For policy makers and silviculturists, these benchmarks provide measurable targets for adaptive management, biodiversity conservation, and ecosystem-based planning under changing climatic and anthropogenic pressures. More broadly, these results emphasize the importance of preserving intact forest systems to better understand how ecosystem structure and nutrient dynamics co-evolve under minimal human disturbance, with direct relevance for temperate beech forest management worldwide.
1 Introduction
Virgin forests represent some of the most ecologically valuable and structurally complex ecosystems on Earth (Jones, 1945; Kisin et al., 2025). As undisturbed reference systems, they provide rare insight into the spontaneous processes that sustain forest health (Abraham, 2015), carbon sequestration (Knohl et al., 2003), biodiversity (Boncina, 2000), and resilience (Petritan et al., 2015). Because they develop under natural disturbance regimes and without direct human intervention, their structure typically encompasses all life stages–from seedlings and saplings to mature and old-growth trees–together with standing and down deadwood in various decay stages. Such features generate high vertical and horizontal heterogeneity shaped by biogeographic history, natural dynamics, and interactions with local abiotic conditions including topography, elevation, climate, and resource availability (Veen et al., 2010). These natural laboratories are critical not only for understanding long-term ecosystem dynamics, but also for informing sustainable forest management and restoration strategies worldwide (Veen et al., 2010). Characterized by high structural complexity shaped by natural disturbance regimes and regeneration dynamics, virgin forests provide essential ecological baselines for close-to-nature silviculture and offer rare opportunities to study ecosystem functions under undisturbed conditions (Frey et al., 2016). Virgin forests, representing the most intact form of old-growth ecosystems, therefore serve as benchmark systems for assessing how human activities alter forest dynamics and natural processes (Frey et al., 2016). Despite this significance, comprehensive knowledge of virgin forests remains limited in many regions, particularly in the temperate zones of Asia.
The Hyrcanian forests of northern Iran represent one of the most important remnants of ancient temperate broadleaf forests. These ecosystems contain several Arcto-Tertiary relict species–such as Pterocarya fraxinifolia, Parrotia persica, and Zelkova carpinifolia–that survived Quaternary climate oscillations in refugial areas along the southern Caspian Sea (Zohary, 1973). As a result, the region provides a rare window into the long-term continuity of temperate forest vegetation (Akhani et al., 2010). The Hyrcanian forests also form the largest remaining tract of old-growth deciduous forest in the Middle East and are widely recognized for their high conservation value (Hosseini, 2019). However, despite early protection efforts, these ecosystems continue to face pressure from fragmentation and human activities (Zarandian et al., 2016). Although much of the Hyrcanian forest belt has experienced historical logging and management, small, spatially restricted remnants of truly virgin forest persist, retaining intact structure and ecological processes and therefore providing the most defensible reference conditions. Yet, detailed ecological data from undisturbed Hyrcanian forests remain limited, and multiscale benchmarks for truly virgin stands are still lacking.
In particular, most existing studies in the Hyrcanian region have focused on isolated ecosystem components (e.g., vegetation structure, soil properties, or biodiversity) rather than adopting an integrated, multiscale perspective on ecosystem functioning. This gap constrains our ability to define comprehensive reference conditions for virgin forests and to evaluate the magnitude and direction of human-induced change. For example, Mirahmadi et al. (2023) investigated the structural mosaic of developmental phases in mixed Fagus orientalis (Lipsky; oriental beech) stands, revealing notable deviations from managed forests. Habashi (2019) analyzed the spatial correlation between pit-mound microtopography and canopy gaps, showing that windthrow events initiate microscale succession consistent with gap-phase dynamics. Likewise, Sagheb-Talebi et al. (2015) highlighted the importance of deadwood, reporting considerable variation in stem number and volume among both living and dead trees. However, no previous study has simultaneously evaluated key ecological indicators–such as forest structure, root system characteristics, soil properties, and herbaceous layer biodiversity–in virgin beech forests of the temperate region. This gap underscores the need for a comprehensive approach capable of linking above- and belowground processes to the structural, functional, and biogeochemical attributes of these ancient ecosystems.
The overarching aim of this study is to provide a quantitative, multiscale assessment of above- and belowground ecological indicators in virgin F. orientalis stands. Specifically, we tested the hypothesis that (i) ecological indicators exhibit coordinated variation across forest layers, reflecting coupled structural–functional organization, and (ii) multivariate linkages among physical, chemical, and biological indicators reveal trade-offs and synergies that underpin old-growth forest stability. Accordingly, we addressed two guiding questions: (1) How do structural, biological, and chemical indicators vary within and among forest layers? and (2) Which multivariate relationships among these indicators best explain the internal regulation and resilience of Hyrcanian virgin beech ecosystems?
2 Materials and methods
2.1 Study area and site selection
The study was conducted in three virgin F. orientalis stands located in the Asalem Forest of Guilan Province, northern Iran (37°39′ N, 48°45′ E), within the Hyrcanian temperate forest region. These stands were identified during national inventories of natural and old-growth forests undertaken by the Research Institute of Forests and Rangelands (RIFR) in the 1990s, and were classified as virgin forest based on the absence of historical logging, road construction, grazing, or silvicultural intervention. Their long-term protection and historical remoteness have allowed them to remain among the most structurally intact beech-dominated forests in the Hyrcanian landscape.
The climate is humid temperate, characterized by 1,290 mm of mean annual precipitation and a mean annual temperature of 8.5 °C; mean monthly temperature extremes average 4.8 °C (minimum) and 16.4 °C (maximum) (Hashemi et al., 2019). The area records ∼132 frost days annually. The Ombrothermic diagram confirms the absence of a dry season for the study area. It is situated on a north-facing slope with gradients ranging from 30% to 60%, at elevations between 1000 and 1120 m asl. Soils are derived from calcareous parent material and range in texture from loam to sandy loam. According to the USDA soil taxonomy, the dominant soil type is classified as Inceptisols (Esfandiari et al., 2023). Geologically, the area belongs to the Mesozoic era. Sedimentary deposits from the Cretaceous period include impure limestone, sandstone, and granite. The terrain consists of relatively gentle slopes underlain by both sedimentary and metamorphic rocks, including impure limestone, sandstone, granite, schist, and mica-schist. These geological conditions result in well-drained, deep soils with high permeability (Amanzadeh, 2015).
Virgin-forest designation followed strict criteria from national and international frameworks (Brünig and Mayer, 1980; Schuck and Bücking, 1994; Parviainen, 2005; Carpathian Convention, 2014; Zeibig et al., 2005; Sefidi et al., 2013; Mirahmadi et al., 2023), referring exclusively to stands with no evidence of direct or long-term anthropogenic disturbance. These forests escaped historical logging largely because they were not located near transportation corridors or traditional harvesting zones. Prior to modern forestry operations, the combination of limited accessibility, low timber extraction efficiency, and early administrative restrictions reduced economic incentives for exploitation, allowing these stands to persist in an undisturbed state.
To ensure comparability among the three 1-ha plots, we selected stands that met the virgin-forest criteria above and shared similar environmental conditions, including elevation, slope, aspect, soil type, and dominant canopy composition (F. orientalis with minor Carpinus betulus). Because research access to officially designated virgin beech forests is extremely limited, these three stands represent the only available ecological replicates of this forest type in the region.
A nested hierarchical sampling design was implemented within each 1-ha plot. Twenty 2 m × 2 m microplots were randomly distributed across each stand and served as standardized locations for herb-layer assessment, humus sampling, mineral soil coring, and fine root collection. This layout ensured consistent measurement of above- and below-ground indicators across comparable microhabitats prior to field sampling described in Section “2.2 Field sampling.”
2.2 Field sampling
Three permanent 1-ha plots (3 ha total) were established in environmentally comparable and undisturbed locations within the protected stands. All plots are dominated by pure F. orientalis, with occasional C. betulus in the subcanopy. Although the stands may represent different positions in the natural developmental trajectory of beech forest, fine-scale developmental phase classification was not feasible at this spatial resolution. Instead, structural attributes such as tree size and species composition were used as indicators of natural dynamics and disturbance history (Leibundgut, 1978; Mayer, 1986; Korpel, 1995). Because these stands constitute the only accessible virgin beech forests in the region, the plots were treated as ecological replicates rather than as independent treatments for statistical comparison.
Given the multiscale nature of our research objectives, data collection was structured vertically, starting from the forest canopy and extending down to the root zone. This top-down perspective allowed us to assess key ecological indicators across five components: forest structure, herbaceous diversity, humus layer, soil properties, and tree fine roots.
2.2.1 Forest structure
Forest structure was quantified through complete stem inventories and detailed tree-level measurements within each 1-ha plot. Standing and downed deadwood were surveyed and classified as snags (standing deadwood) or coarse woody debris (downed logs). Because the species identity of dead stems could not always be reliably determined, deadwood was analyzed using structural attributes independent of taxonomy, including its frequency, total volume, and decay-class distribution. Each deadwood piece was assigned to one of four decay classes based on external characteristics of bark retention, wood color, branch persistence, and the degree of structural decomposition, following protocols widely applied in temperate old-growth forests (Amanzadeh et al., 2013; Sefidi and Etemad, 2015; Rahanjam et al., 2018) and the criteria summarized in Supplementary Table 1. When a log or snag exhibited multiple decay conditions along its length, the dominant decay class was assigned following standard Hyrcanian forest procedures (Sefidi and Etemad, 2015).
To characterize tree architecture, all trees within each of the 1-ha study areas were measured (full calipering). For these individuals, total height, DBH, crown width, and crown height were measured. From these variables, we calculated the height-to-DBH ratio, crown ratio (crown height divided by total height), crown projection area, crown height-to-width ratio, and the bole-to-crown projection ratio. Crown radius was measured using the vertical sighting method, defined as the distance from the center of the trunk to the outer edge of the crown in each cardinal direction (Pretzsch et al., 2014). Crown eccentricity was computed as the stem–crown centroid offset divided by DBH, yielding a dimensionless index of crown asymmetry (Krajnc et al., 2019). To assess vertical structural allocation, we calculated the bole-to-crown projection area ratio (trunk-to-crown footprint ratio) for each tree as the ratio of the trunk cross-sectional area at breast height to the crown projection area on the ground surface. To evaluate tree stability and vertical growth form, we computed the slenderness coefficient (slenderness quotient) for each tree as the ratio of total height to DBH (Wang et al., 1998).
In addition, diameter-class distributions (5-cm DBH intervals) and live-tree volume distributions were calculated for all trees ≥ 7.5 cm DBH in each plot to provide a detailed representation of size structure and biomass allocation.
2.2.2 Herbaceous sampling and analysis
To assess the diversity and composition of the herbaceous layer, we employed a nested hierarchical sampling design within each of the three 1-hectare virgin beech forest plots. Following the Cain (1938) nested-area method, preliminary field observations indicated that species–area curves reached an asymptote at approximately 4 m2 (2 m × 2 m), confirming that this plot size was sufficient to capture local herbaceous diversity. Within each 1-ha plot, twenty 2 m × 2 m microplots were randomly established, resulting in a total of 60 microplots across the three 1-ha study area. Sampling was conducted during the peak of the growing season (spring 2018) to ensure maximal herb-layer development. Within each microplot, all non-woody vascular plant species were identified and their percent cover visually estimated. For each microplot, we calculated species richness (SR), Shannon diversity (Shannon, 1948), and Pielou’s evenness (Pielou, 1966). All soil, humus, and fine root samples were collected from these same microplots to ensure spatial correspondence among vegetation and belowground measurements across the three 1-ha plots.
To capture diversity patterns at multiple scales, we computed alpha (α), beta (β), and gamma (γ) diversity using Whittaker’s framework (Whittaker, 1972). Alpha diversity (α) was defined as the mean species richness across microplots. Gamma diversity (γ) represented the total number of unique species observed across all 60 subplots. Beta diversity (β) was calculated as the multiplicative turnover: β = γ/α (Whittaker, 1972). In addition, we applied the Hill numbers framework to quantify diversity across different sensitivity orders (q = 0, 1, 2), which provides a unified and robust interpretation of species richness (q = 0), the exponential of Shannon entropy (q = 1), and the inverse Simpson index (q = 2) (Chao et al., 2014). These metrics were computed using the iNEXT4.steps and vegan packages in R 4.3.2, allowing for standardized interpolation and extrapolation of diversity profiles across sample sizes.
All identified herbaceous species were grouped into three growth habits–fern, forb, and grass–and further classified according to Raunkiaer life-form categories (Raunkiaer, 1934). Species distribution data were primarily obtained from Flora Iranica (Rechinger, 1963–2010) and Flora of Turkey (Davis, 1970). The classification of phytogeographical regions follows the concepts outlined by Zohary (1973), Takhtajan (1986), and Léonard (1988). In this study, the following abbreviations are used: ES (species occurring in the Euro-Siberian region), IT (species of the Irano-Turanian region), M (species of the Mediterranean region), PL (pluriregional taxa extending across three phytogeographical regions), and COS (cosmopolitan species with a worldwide distribution).
2.2.3 Humus sampling and analysis
To characterize humus chemistry, we used the same 2 m × 2 m microplots established for herbaceous layer sampling to ensure spatial correspondence among above- and belowground measurements. Within each microplot, surface litter was carefully removed, and underlying humus was collected during dry, sunny conditions to minimize moisture variability. In total, 60 humus samples (20 per 1-ha plot) were obtained across the study area. In the laboratory, samples were oven-dried at 60 °C for 24 h and ground for analysis. Humus pH was determined in a 1:1 (w/v) soil-to-water suspension after 1 h of shaking using a digital pH meter (MTT 65, Japan). Electrical conductivity (EC) was measured in a saturated extract with an EC meter (Model AZ-86503, Taiwan). Organic carbon (%) was measured by the Walkley–Black wet oxidation method (Walkley and Black, 1934). Total nitrogen content was determined via Kjeldahl digestion (Kjeldahl, 1883; Jahangard et al., 2024), and available phosphorus was extracted using the Olsen method (Olsen, 1954). Concentrations of K, Ca, Mg, Cu, Zn, Fe, and Mn were determined by flame atomic absorption spectrophotometry (AAS).
2.2.4 Soil sampling and analysis
From each 2 m × 2 m microplot, soil was sampled from the upper 0–20 cm of the mineral horizon after carefully removing surface litter. Soil samples were collected using a cylindrical soil corer (5 cm diameter), extracting a single core to 20 cm depth from the center of each microplot, resulting in a total of 60 samples (20 per 1-ha plot). Immediately after collection, samples were sealed in airtight plastic bags, stored in insulated coolers, and transported to the laboratory on the same day. Upon arrival, a subsample from each core was weighed fresh and oven-dried at 105 °C for 24 h to determine gravimetric soil moisture (ASTM D 2216-19, 2019). The remaining soil was air-dried under shade, gently crushed, and passed through a 2-mm sieve prior to analysis. Physical properties were analyzed first. Soil texture was determined using the hydrometer method (Ge and Bauder, 1986), bulk density was measured by the clod method (Grossman and Reinsch, 2002), and total porosity was calculated based on bulk and particle densities.
Soil pH was determined potentiometrically in a saturated paste using a digital pH meter (Model MTT65, Japan). EC was measured in a saturated extract with an EC meter (Model AZ-86503, Taiwan). Organic carbon was quantified using the Walkley–Black oxidation method (Walkley and Black, 1934), total nitrogen by Kjeldahl digestion (Kjeldahl, 1883), and available phosphorus using the Olsen method (Olsen, 1954). Exchangeable K, Ca, and Mg were extracted with ammonium acetate and measured via atomic absorption spectrophotometry. Micronutrients–Fe, Mn, Cu, and Zn–were extracted using DTPA (diethylenetriaminepentaacetic acid) and analyzed by the same method.
To characterize soil biological activity, we used fresh field-moist soil samples collected directly from each microplot prior to any drying or sieving. These undisturbed samples were used to quantify microbial respiration, microbial biomass (C, N, and P), and enzyme activities. Microbial respiration was measured using the closed-jar alkali absorption method (Chandra et al., 2016), where NaOH absorbed CO2 over a 7-days incubation. The remaining NaOH was treated with BaCl2 and titrated with dilute HCl to estimate CO2 released per gram of dry soil (mg CO2 g–1 24 h–1). Microbial biomass carbon (MBC) was estimated via chloroform fumigation–extraction (Monz et al., 1991), using 0.5 M K2SO4 as the extractant and the Walkley–Black method for carbon quantification. Microbial biomass nitrogen (MBN) followed a similar fumigation protocol, with total N measured by the Kjeldahl method (Brookes et al., 1985). Microbial biomass phosphorus (MBP) was determined using chloroform fumigation followed by 0.5 M NaHCCO3 extraction and Olsen phosphorus quantification (Vance et al., 1987). Enzymatic activity of acid and alkaline phosphatases was measured using para-nitrophenyl phosphate (pNPP) as a substrate, with product formation (ρNP) quantified by spectrophotometry (Tabatabai and Bremner, 1969), and expressed as μg ρNP g–1 dry soil h–1.
2.2.5 Fine roots sampling and analysis
To obtain fine root samples for subsequent trait analysis, one soil core (8 cm inner diameter, 20 cm depth) was extracted from each 2 m × 2 m microplot, resulting in 20 cores per 1-ha plot and 60 cores in total. In this study, fine roots were defined as roots with a diameter < 2 mm, following standard classifications used in temperate forest ecology (e.g., Montagnoli et al., 2012, 2018, 2019; Deljouei et al., 2023; Fantozzi et al., 2024). The 0–20 cm depth was selected because, in non-urban temperate forests, most fine root biomass is concentrated in the upper soil layers (Matamala and Schlesinger, 2000; Deljouei et al., 2023), whereas studies along temperate urbanization gradients show a shift of fine root biomass toward deeper soil layers (Sferra et al., 2025). Immediately after extraction, soil cores were sealed in airtight plastic bags, stored in insulated coolers in the field, and subsequently refrigerated at 4 °C upon arrival at the laboratory to maintain root integrity until processing (Lin et al., 2024).
In the laboratory, soil cores were washed through a 2-mm mesh sieve (Graf and Frei, 2013) to remove mineral particles. Fine roots were then hand-sorted under a stereomicroscope to exclude debris and visible ectomycorrhizae. Root samples were scanned at 500 dpi using a flatbed scanner and analyzed with WinRHIZO Pro 2007d (Regent Instruments Inc., Quebec, Canada). The following morphological traits were quantified: fine root density, fine root biomass, specific root length (SRL), and specific root surface area (SRA). SRL and SRA were calculated as the ratio of root length and surface area to dry mass, respectively (Himmelbauer et al., 2004).
2.3 Statistical analysis
As our study was observational and focused on multiscale ecological indicators within officially recognized virgin forest stands, no formal statistical comparisons were made between the three 1-ha plots. Although the plots differ somewhat in canopy structure, they were not treated as independent experimental units. Instead, we considered them ecological replicates of the same virgin beech forest type within the broader Hyrcanian landscape. Results are therefore reported in two ways: (i) means and standard errors for each individual 1-ha plot, and (ii) overall means (±standard error) across all three plots. This dual reporting characterizes both within-plot conditions and pooled patterns while avoiding unsupported inferential comparisons among plots.
To explore linear relationships among ecological indicators, we applied Pearson product–moment correlation analyses using the cor.test() function in base R (Ver. 4.3.2; R Core Team, 2023). Correlations were calculated only for variables measured at the microplot scale (herb layer, humus, soil, microbial, and fine root indicators), using the 60 microplots as sampling units. Plot-level canopy structural metrics (n = 3) were summarized descriptively and deliberately excluded from the correlation matrices to avoid misleading inference. Prior to analysis, variables were inspected for outliers and tested for normality; strongly skewed variables were log-transformed, and only continuous variables that met Pearson assumptions after transformation were retained. Correlation matrices were visualized with the corrplot package (Wei et al., 2017) and interpreted strictly as patterns of association, not as evidence of causation.
To identify multivariate patterns and major ecological gradients, we conducted a principal component analysis (PCA) on standardized (z-transformed) values of humus chemistry, soil physicochemical and biological properties, and fine root traits. Variables with strongly skewed distributions were log-transformed prior to analysis, and all retained variables were standardized (mean = 0, SD = 1) to ensure comparability across measurement units. To reduce collinearity, we first removed variables with pairwise correlations of |r| ≥ 0.9 and then applied a sequential variance inflation factor (VIF) procedure: VIFs were calculated from a multiple-regression model including all remaining predictors, the variable with the highest VIF was removed, and this process was iterated until all predictors had VIF ≤ 10 (Quinn and Keough, 2002; Zuur et al., 2010; Dormann et al., 2013). Deterministic variables, such as soil texture fractions (sand, silt, and clay) and the bulk density–porosity pair, were simplified by retaining only one representative from each set. Herb-layer richness and diversity indices (Shannon and Pielou) were not included in the PCA because they represent response variables rather than predictors. Canopy structural parameters were analyzed separately and excluded from the PCA due to differences in sampling resolution. The final set of predictors thus represented independent ecological indicators spanning the humus, soil, microbial, and root compartments. PCA was performed using the prcomp() function, and ordinations were visualized with the factoextra package (Kassambara and Mundt, 2017) in R version 4.3.2 (R Core Team, 2023).
3 Results
The results are organized into five subsections corresponding to the major ecological layers examined: (1) forest structure, (2) herbaceous layer diversity, (3) humus layer chemistry, (4) soil physical, chemical, and biological properties, and (5) fine-root traits. For each component, descriptive statistics (mean ± standard error) are reported at both the 1-ha plot level and across the aggregated dataset. Because the study was not designed for treatment contrasts, no statistical comparisons among plots were performed. Section “3.6 Multivariate relationships among ecological variables and indicators” integrates multivariate analyses. Pearson correlation analyses were conducted for 43 ecological variables and indicators across humus, soil, herbaceous, and root compartments; canopy structural parameters were excluded due to differences in sampling resolution. PCA was then applied to a reduced set of belowground variables, after excluding herbaceous diversity indices, which represent response variables rather than predictor variables, to identify dominant ecological gradients across humus, soil, and root variables and indicators.
3.1 Forest structure
Structural attributes of overstory oriental beech trees are reported separately for each 1-ha plot without statistical interpretation (Figure 1). Stand density ranged from 185 to 195 sph (mean = 192 sph; Figure 1a), with mean DBH spanning 38–46 cm (Figure 1b), and average tree height varying between 17.8 and 19.2 m (Figure 1c). Trunk height (height from ground to the crown base) ranged from 9.6 to 11.9 m (Figure 1d). Crown projection areas (CPA) averaged 54.3 m2 (Figure 1e), crown widths (Cw) was approximately 7.4 m (Figure 1f), and mean crown height (Ch) across the 3-ha study area was 7.7 m (Figure 1g). The Ch:Cw ratio was 1.06 (Figure 1h), and Ch:h ratio averaged 0.42 (Figure 1i). Crown eccentricity remained low (≤0.19; Figure 1j). The mean bole-to-CPA ratio (trunk-to-crown footprint ratio) was 0.005 (Figure 1k). Basal area ranged from 35.4 to 53.2 m2 ha–1, with a pooled mean of 45.2 m2 ha–1 (Figure 1l), and the slenderness coefficient averaged 54.6 (Figure 1m).
FIGURE 1

Structural attributes of overstory trees across the three 1-ha virgin pure beech forest plots and their overall mean (±SE). Panels show: (a) stand density, (b) diameter at breast height (DBH), (c) tree height (h), (d) trunk height, (e) crown projection area (CPA), (f) crown width, (g) crown height, (h) crown height-to-width ratio (Ch:Cw), (i) crown height-to-tree height ratio (Ch:h), (j) crown eccentricity, (k) bole-to-CPA ratio, (l) basal area, and (m) slenderness coefficient. Data represent plot-level means and overall mean across plots.
Pearson correlation (r) analysis among structural variables (Supplementary Table 2) revealed strong positive correlations among DBH, tree height, and CPA (r ≥ 0.87, p < 0.001). Crown height showed strong relationships with both DBH and total height (Supplementary Table 2). Conversely, slenderness coefficient and canopy eccentricity were negatively correlated with most other variables (Supplementary Table 2).
DBH-class distributions were dominated by small diameter classes (7.5–20 cm), with stem density declining steadily toward larger classes in all three plots (Supplementary Figure 1). Live tree volume exhibited a contrasting pattern, with the highest volumes concentrated in the 70–100 cm DBH classes (Supplementary Figure 2).
Table 1 summarizes the key deadwood characteristics of the three virgin beech stands, including abundance, volume, and decay-class structure. Deadwood abundance ranged from 21 to 25 pieces per hectare, with a mean of 23 n ha–1, and downed logs consistently comprising the majority of pieces. Deadwood volume averaged 7.1 m3 ha–1 for standing deadwood and 26.2 m3 ha–1 for downed coarse woody debris, resulting in a total mean deadwood volume of 33.3 m3 ha–1 across plots. The decay-class distribution was dominated by early decay stages, with decay class 1 accounting for approximately 32% of all recorded pieces (Table 1).
TABLE 1
| Parameter | Attribute | Plot 1 | Plot 2 | Plot 3 | Mean (±SE) |
|---|---|---|---|---|---|
| Abundance (n ha–1) | Standing deadwood (snag) | 11 | 12 | 18 | 13.67 (±1.78) |
| Downed deadwood (coarse woody debris) | 12 | 9 | 7 | 9.33 (±1.19) | |
| Total deadwood | 23 | 21 | 25 | 23.00 (±0.94) | |
| Volume (m3 ha–1) | Standing deadwood (snag) | 8.00 | 7.48 | 5.81 | 7.10 (±0.54) |
| Downed deadwood (coarse woody debris) | 35.03 | 27.82 | 15.86 | 26.24 (±4.56) | |
| Total deadwood | 43.03 | 35.30 | 21.67 | 33.33 (±5.10) | |
| Decay class distribution (%)* | Decay class 1 | 13.0 | 33.3 | 48.0 | 31.8 (±5.3) |
| Decay class 2 | 17.4 | 23.8 | 28.0 | 23.2 (±1.7) | |
| Decay class 3 | 17.4 | 23.8 | 8.0 | 16.0 (±2.0) | |
| Decay class 4 | 52.2 | 19.1 | 16.0 | 29.0 (±8.0) |
Deadwood abundance, volume, and decay-class distribution in three 1-ha virgin pure oriental beech (Fagus orientalis) stands.
*Decay class distribution is expressed as the percentage of total deadwood volume within each decay class. Details of decay-class criteria are provided in Supplementary Table 1.
3.2 Herbaceous layer
A total of 52 herbaceous species belonging to 27 families were recorded across the virgin oriental beech forest (Supplementary Table 3). Chorological spectra were diverse, with Euro-Siberian taxa being the most frequent (40.4%), and only one species classified as cosmopolitan (Supplementary Table 3). The majority of species (65.4%) were forbs, and hemicryptophytes were the most common life form (48.1%) (Supplementary Table 3). Herbaceous layer diversity metrics were similar among three 1-ha plots (Supplementary Table 4). Shannon diversity (H’) ranged from 1.81 to 1.88, while Pielou’s evenness (E) varied little among plots (0.77–0.79) (Supplementary Table 4). Hill number diversity profiles (qD) for the herbaceous layer in virgin beech forests of the Hyrcanian region showed a clear decline from species richness (0D) to Shannon (1D) and Simpson diversity (2D) across all plots (Figure 2). Plot 1 (Figure 2a) showed the highest richness but strong dominance effects, while Plot 2 (Figure 2b) had slightly lower richness yet similar effective diversity. Plot 3 (Figure 2c) exhibited comparable richness but greater evenness, with dominant species exerting less influence. When all 60 subplots (3 ha) were pooled (Figure 2d), total richness increased to 0D = 52, while common and dominant species were represented by 1D = 22.5 and 2D = 13.9, respectively. Also, species accumulation curves approached saturation within individual 1-ha plots (Supplementary Figure 3), suggesting adequate sampling of the herbaceous assemblages at the subplot scale.
FIGURE 2
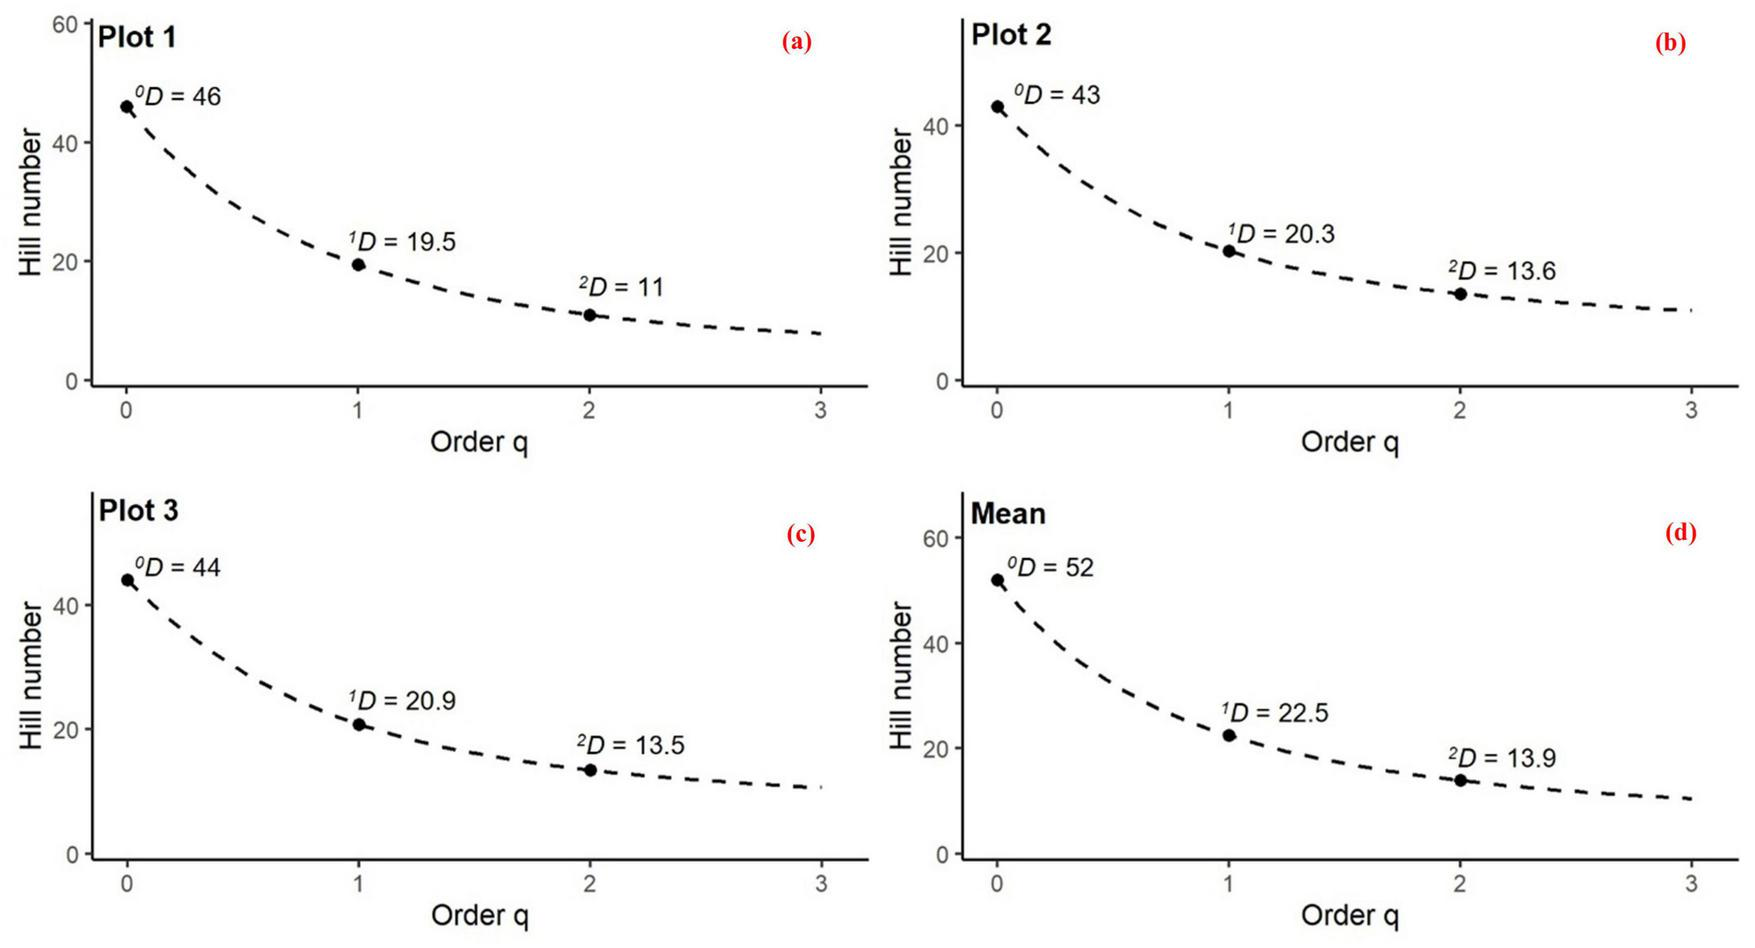
Hill number diversity profiles (qD, q = 0, 1, 2) for herbaceous assemblages across three forest plots (1-ha each with 20 subplots) and the pooled community: (a) Plot 1, (b) Plot 2, (c) Plot 3, and (d) mean values across all plots (pooled community, 60 subplots, 3 ha total). Dashed curves show the decline of Hill numbers with increasing order q, with solid points marking observed values. 0D corresponds to species richness, 1D to the exponential of Shannon entropy (effective number of common species), and 2D to the inverse Simpson index (effective number of dominant species). The decreasing values from 0D to 2D illustrate the impact of species unevenness and dominance on community diversity.
3.3 Humus layer
Chemical properties of the humus layer are reported separately for the three sampling plots without statistical interpretation (Figure 3). Humus pH was slightly acidic, ranging from 5.8 to 6.2 (Figure 3a), while electrical conductivity (EC) varied between 380 and 420 μS cm–1 (Figure 3b). Carbon and nitrogen contents were relatively stable, with humus C ranging from 42% to 46% and total N from 1.4% to 1.6% (Figures 3c, d). Total P concentrations were 70–80 μg g–1, and K ranged between 350 and 400 μg g–1 (Figures 3e, f). Among the base cations, Mg dominated at 4200–4500 μg g–1 followed by Ca (250–270 μg g–1) (Figures 3g, h). Micronutrients were present in smaller but stable quantities: Fe ranged from 2700 to 3000 μg g–1, Mn from 350 to 400 μg g–1, Cu from 14 to 16 μg g–1, and Zn from 28 to 32 μg g–1 (Figures 3i–l).
FIGURE 3
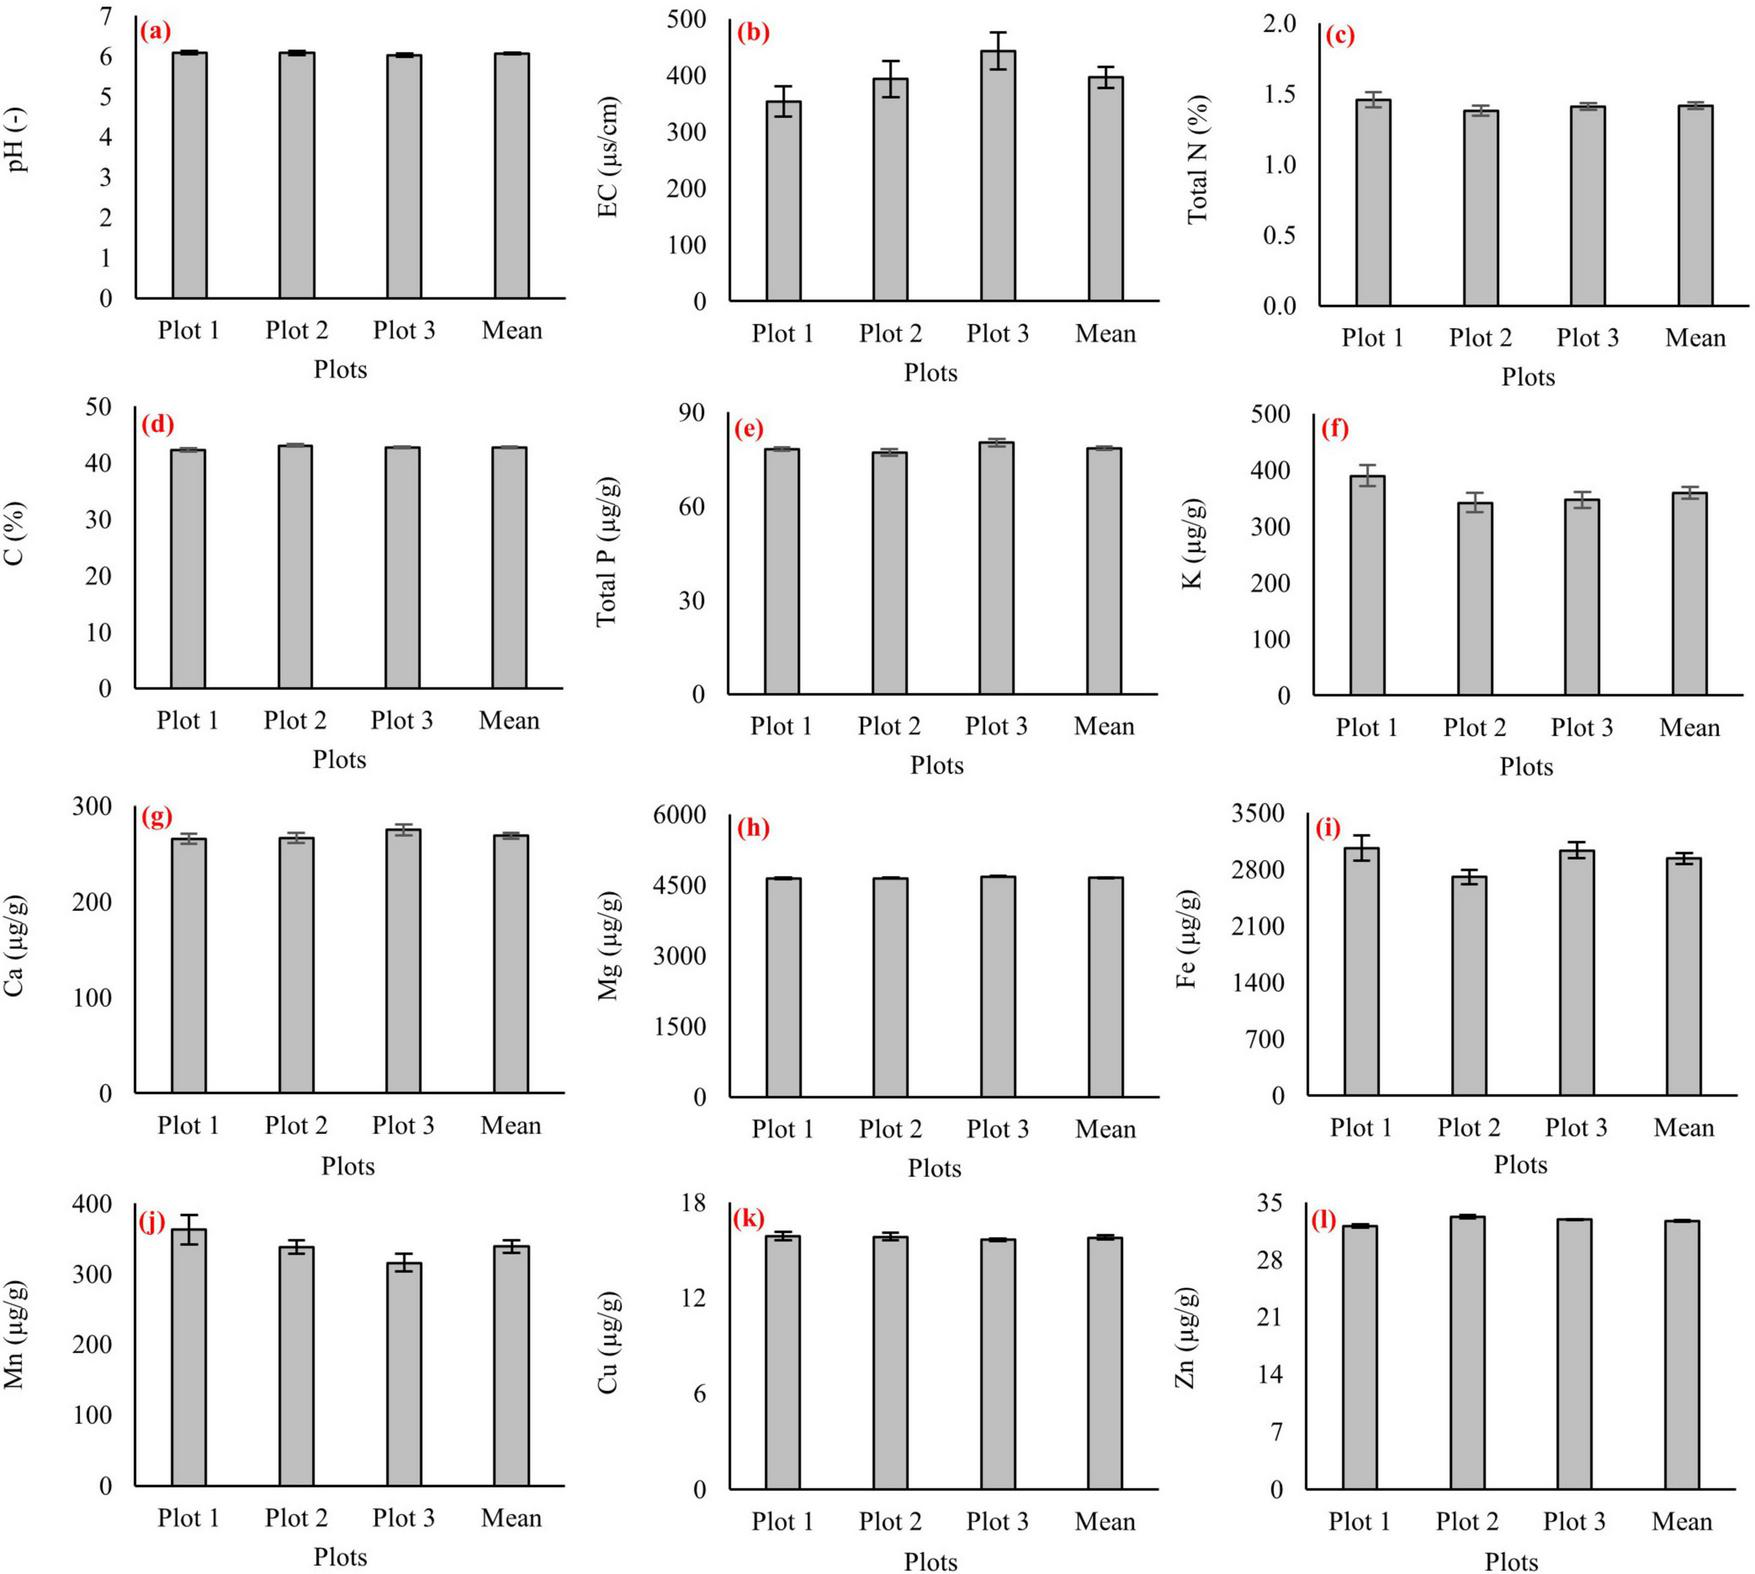
Chemical properties of the humus layer in three virgin pure beech forest plots (Plot 1, Plot 2, and Plot 3) and their overall mean values. Panels show humus: (a) pH, (b) electrical conductivity (EC), (c) total nitrogen, (d) carbon, (e) total phosphorus, (f) potassium, (g) calcium, (h) magnesium, (i) iron, (j) manganese, (k) copper, and (l) zinc. Error bars indicate standard errors.
3.4 Soil layer
Figure 4 presents the soil physicochemical measurements for each of the three 1-ha plots, along with the pooled mean values for every variable. Soil moisture varied between 31% and 35%, bulk density remained within 1.4–1.5 g cm–3, and porosity ranged from 55% to 60% (Figures 4a–c). Clay content ranged from 8% to 11% (Figure 4d), silt from 22% to 26% (Figure 4f), and sand from 63% to 68% (Figure 4e), confirming a sand-dominated texture. Chemical conditions were characterized by slightly acidic pH values (5.4–5.6) and EC of 170–200 μS cm–1 (Figures 4g, h). Soil organic carbon was ranged from 2.5% to 2.9%, while total nitrogen ranged from 0.33% to 0.37% (Figures 4i, j). Available phosphorus was 14–16 μg g–1, and exchangeable potassium was 280–320 μg g–1 (Figures 4k, l). Among base cations, magnesium exhibited the highest concentrations (290–310 μg g–1), followed by calcium at 240–270 μg g–1 (Figures 4m, n). Micronutrients occurred at lower levels, with iron ranging from 55 to 65 μg g–1, manganese from 18 to 22 μg g–1, copper from 0.3 to 0.4 μg g–1, and zinc from 0.45 to 0.55 μg g–1 (Figures 4o–r). Soil biological indicators showed similarly narrow ranges across plots (Figure 5). Microbial respiration values were comparable among plots (Figure 5a). Microbial biomass carbon and nitrogen ranged within close intervals (Figures 5b, c). Microbial biomass phosphorus showed a wider range among plots (Figure 5d). Enzyme activities displayed greater variability relative to microbial biomass indicators: acid phosphatase ranged more widely across plots (Figure 5e), while alkaline phosphatase ranged within a narrower interval (Figure 5f).
FIGURE 4
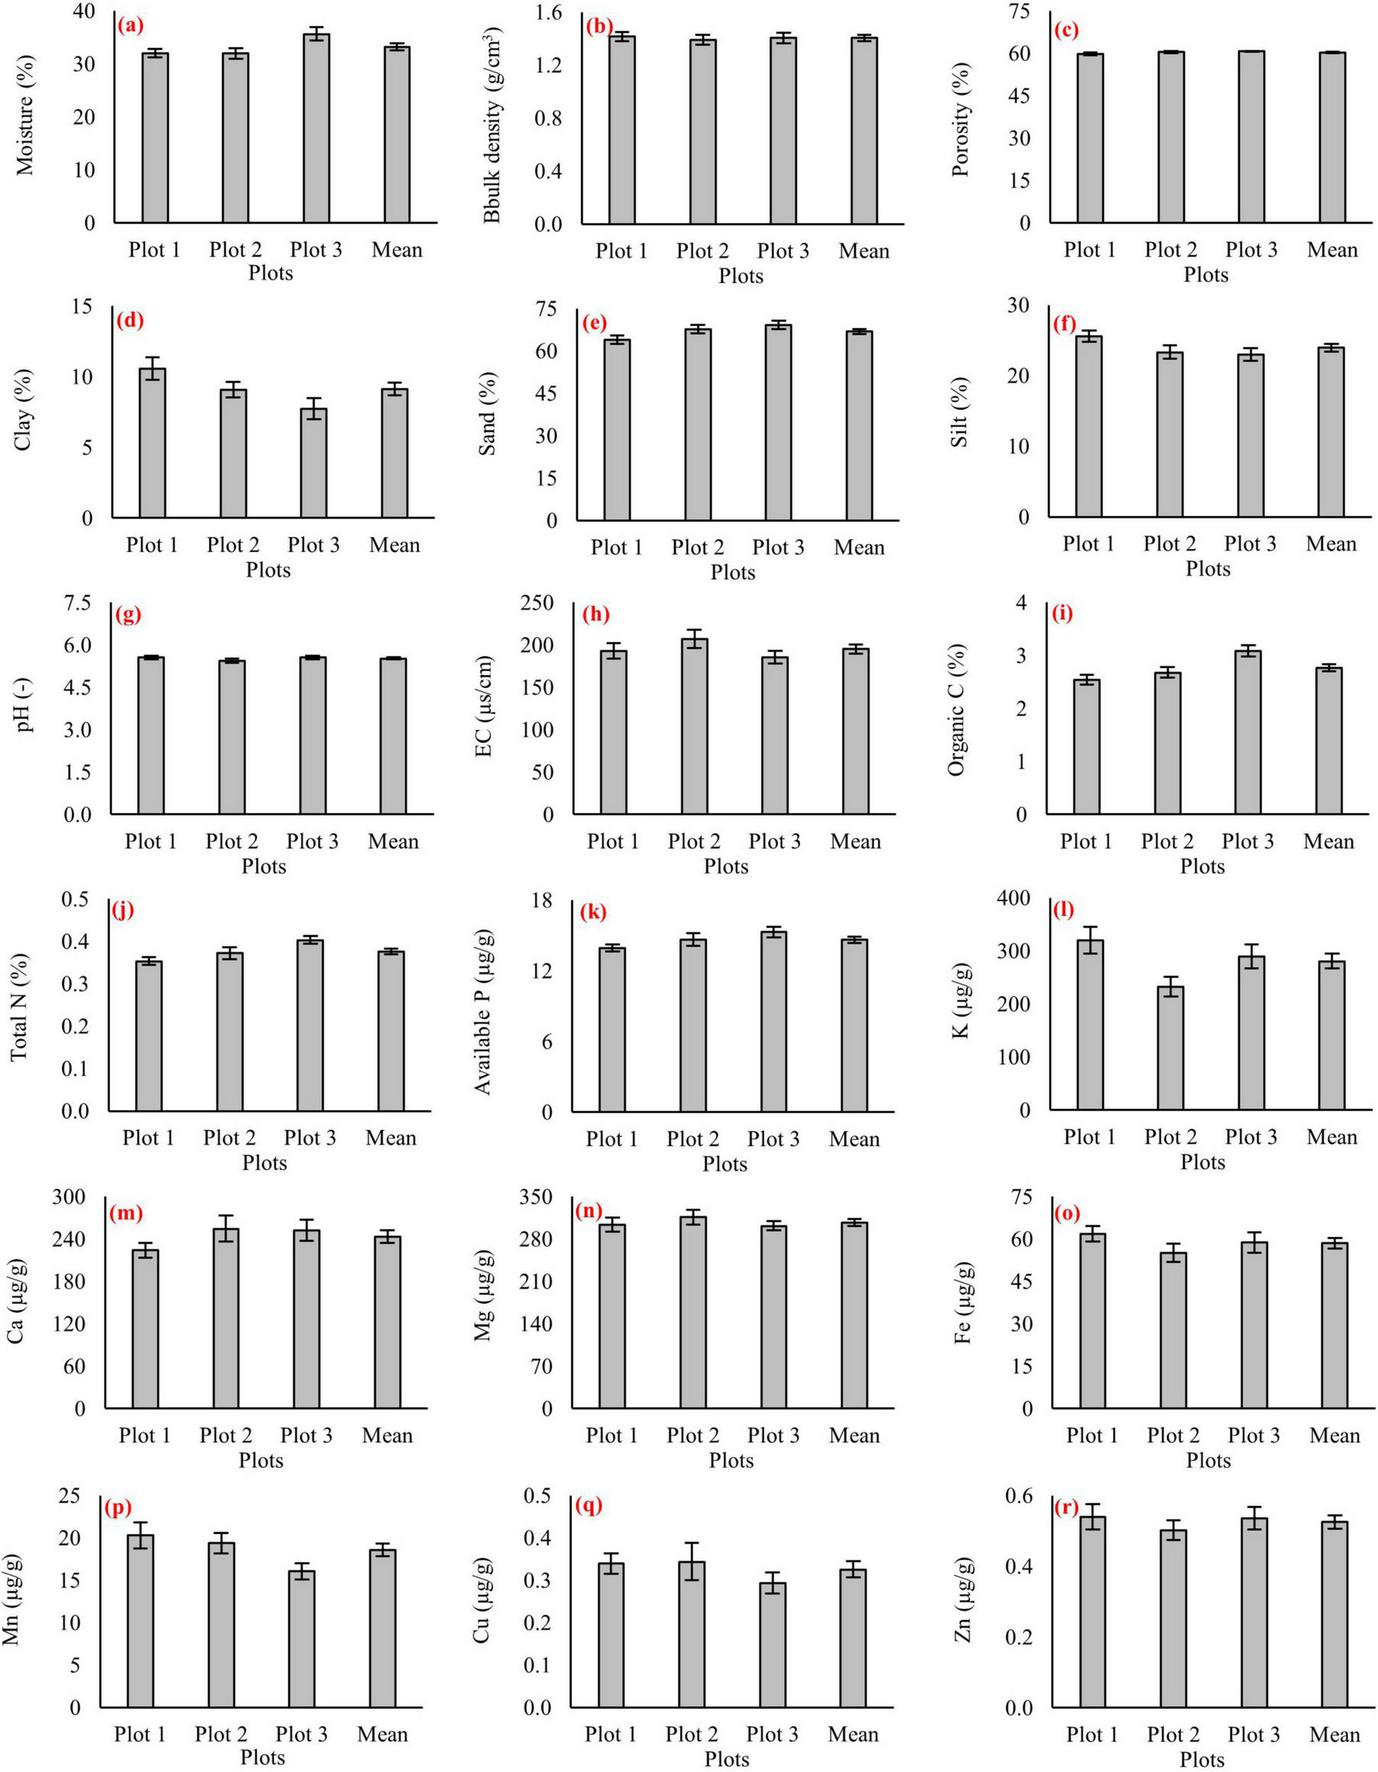
Soil physicochemical properties in three virgin pure beech forest plots (Plot 1, Plot 2, and Plot 3) and their overall mean values. Panels represent: (a) soil moisture, (b) bulk density, (c) porosity, (d) clay, (e) sand, (f) silt, (g) pH, (h) electrical conductivity (EC), (i) soil organic carbon, (j) total nitrogen, (k) available phosphorus, (l) potassium, (m) calcium, (n) magnesium, (o) iron, (p) manganese, (q) copper, and (r) zinc. Error bars indicate standard errors.
FIGURE 5
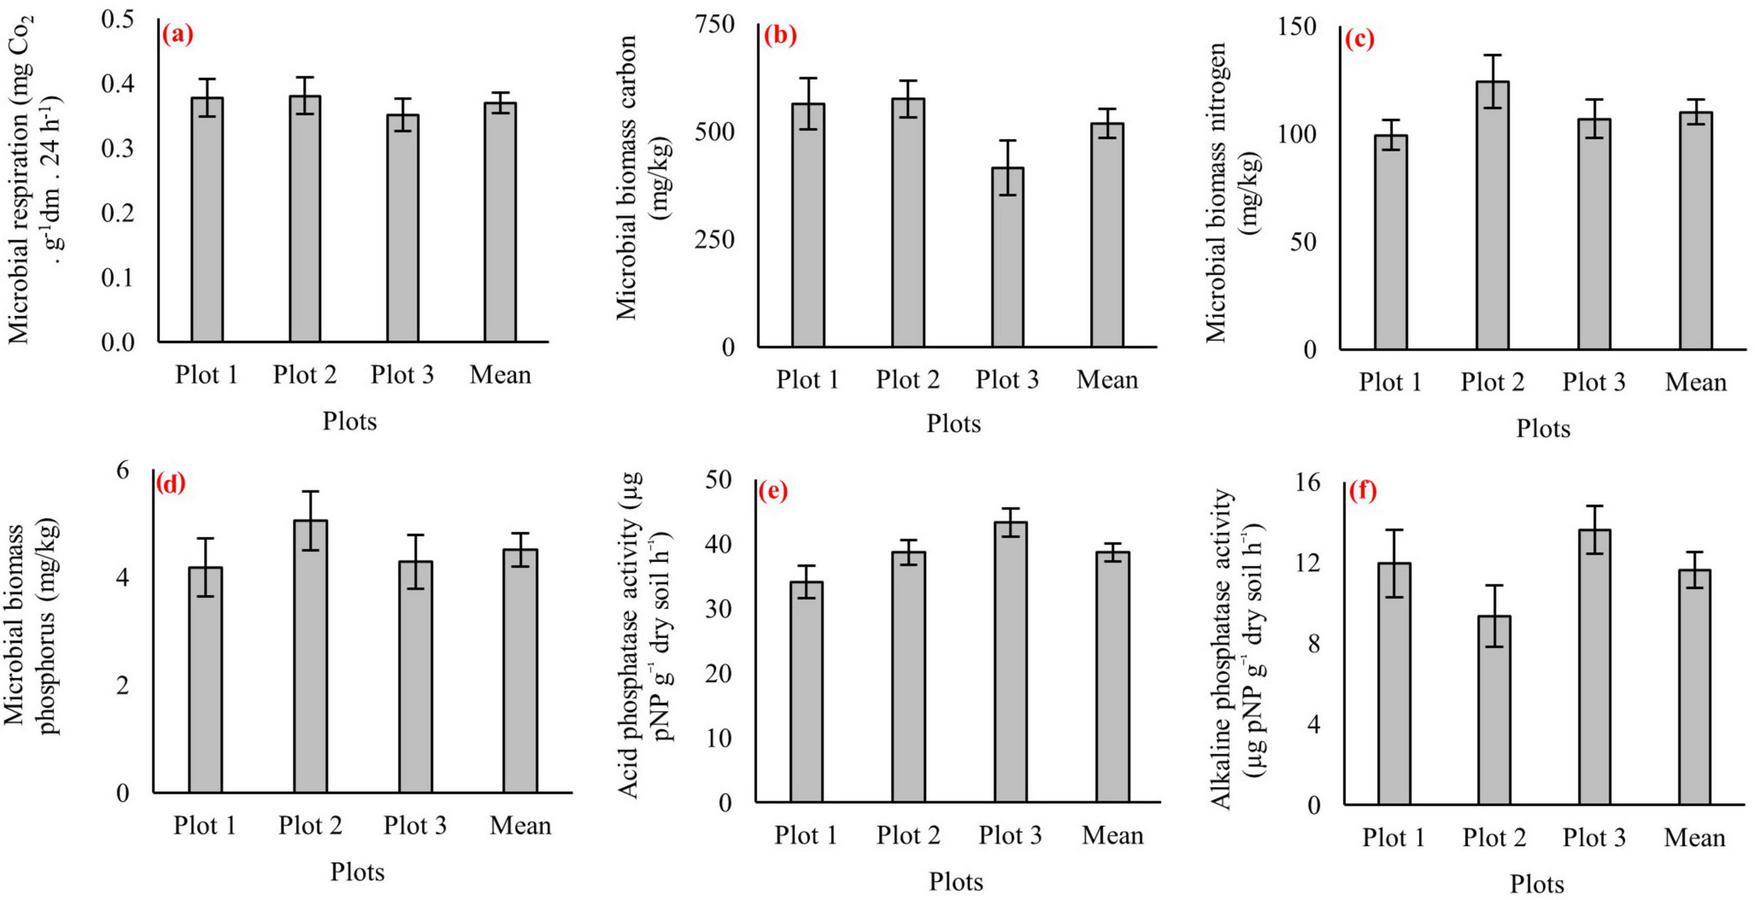
Soil biological indicators in three virgin pure beech forest plots (Plot 1, Plot 2, and Plot 3) and their overall mean values. Panels represent: (a) microbial respiration, (b) microbial biomass carbon, (c) microbial biomass nitrogen, (d) microbial biomass phosphorus, (e) acid phosphatase activity, and (f) alkaline phosphatase activity. Error bars indicate standard errors.
3.5 Tree fine roots
Fine-root indicators measured across the three virgin beech forest plots fell within overlapping value ranges (Figure 6). Fine-root density values from all plots occurred within a similar interval (Figure 6a). Fine-root biomass values also fell within an overlapping range among plots, with Plot 3 showing the highest values within the observed interval (Figure 6b). Morphological traits showed comparable distributions: specific root length (SRL) values overlapped across the three plots (Figure 6c), and specific root area (SRA) values likewise occurred within overlapping intervals among plots (Figure 6d). These values represent total fine-root pools (<2 mm diameter) obtained following the 2-mm sieve procedure described in Section “2.2.5 Fine roots sampling and analysis.”
FIGURE 6
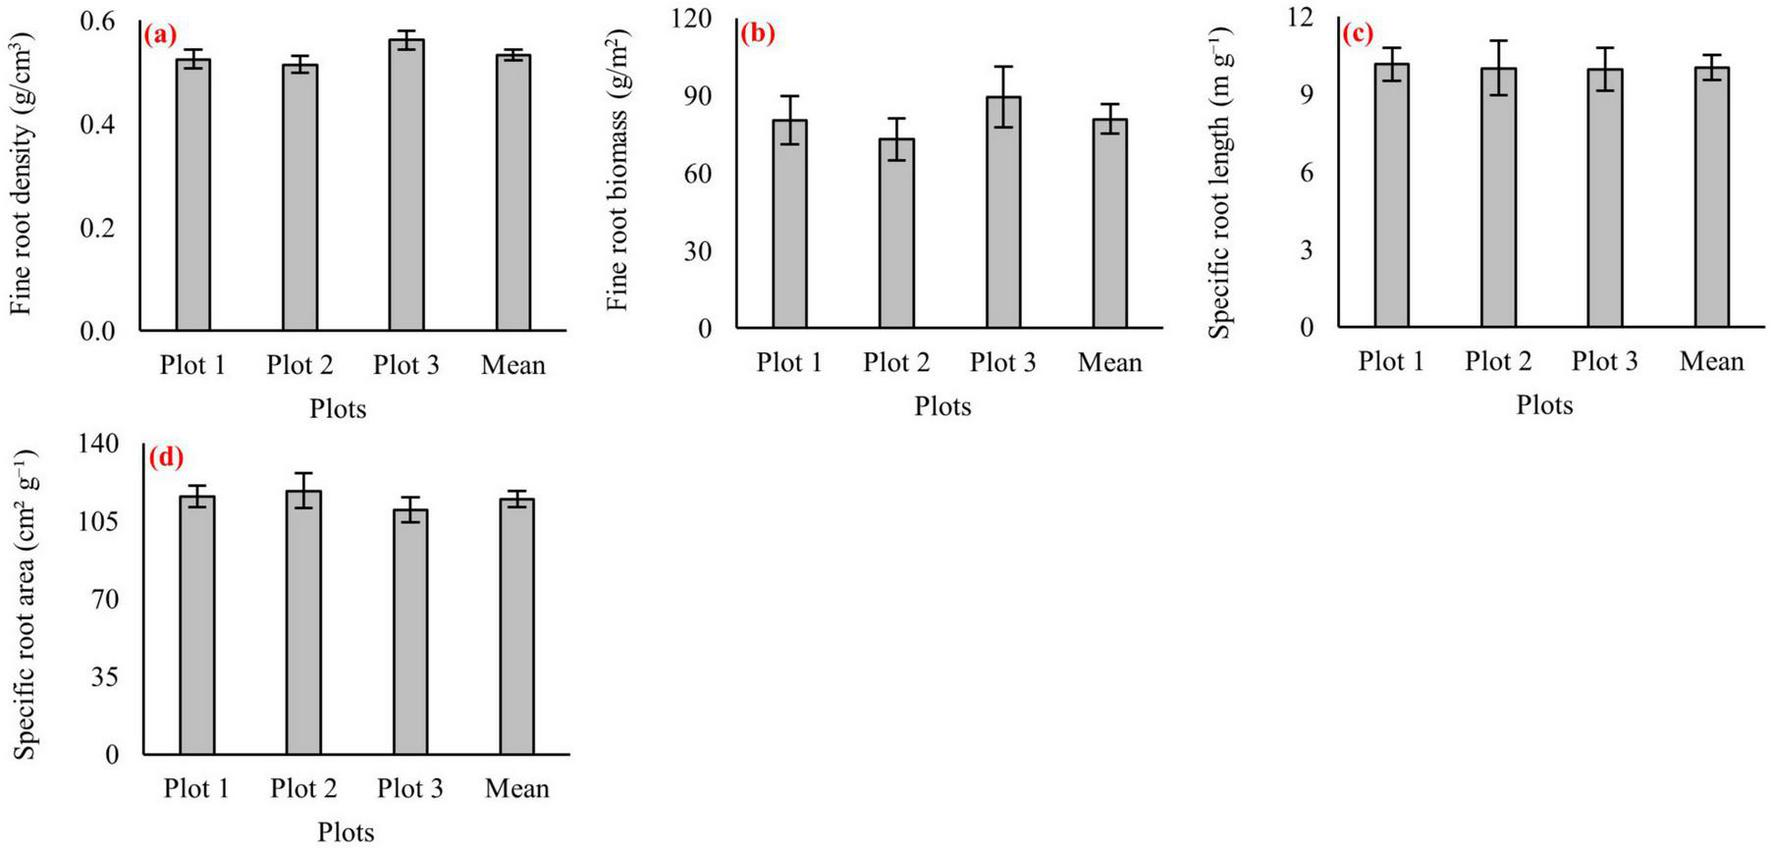
Fine root traits in three virgin pure beech forest plots (Plot 1, Plot 2, and Plot 3) and their overall mean values. Panels represent: (a) fine-root density, (b) fine-root biomass, (c) specific root length (SRL), and (d) specific root area (SRA). Error bars indicate standard errors.
3.6 Multivariate relationships among ecological variables and indicators
The correlation matrix for 43 ecological variables and indicators showed several numerical associations across humus, soil, herbaceous, and fine root compartments (Figure 7). Strong positive correlations were observed among soil organic carbon, total nitrogen, and microbial biomass pools (MBC and MBN), reflecting the tight coupling of soil C–N status with microbial activity. Microbial biomass phosphorus (MBP) was moderately correlated with MBC and MBN, but showed stronger associations with soil available phosphorus and phosphatase activities. Both acid (APA) and alkaline phosphatase (ALP) were positively associated with available phosphorus. Soil texture fractions (sand, silt, and clay) were highly intercorrelated, as expected, but remained largely independent from microbial and root traits. Bulk density and porosity showed strong negative correlation, but neither exhibited strong linkages to microbial or root indicators. Fine-root traits displayed weaker correlations with soil and microbial properties. Specific root length (SRL) and specific root area (SRA) showed limited positive associations with microbial biomass pools. In contrast, root biomass was largely independent from microbial or soil chemical variables. Humus chemical properties exhibited a mixture of strong and weak associations. For example, humus pH and EC were moderately correlated with soil pH and EC, while humus Ca and Mg aligned with their soil counterparts. Trace elements (humus Fe, Mn, Cu, and Zn) showed strong internal correlations but were not tightly linked to microbial or root traits. Herbaceous diversity indices (richness, Shannon, and Pielou) displayed only limited correlations with belowground variables.
FIGURE 7
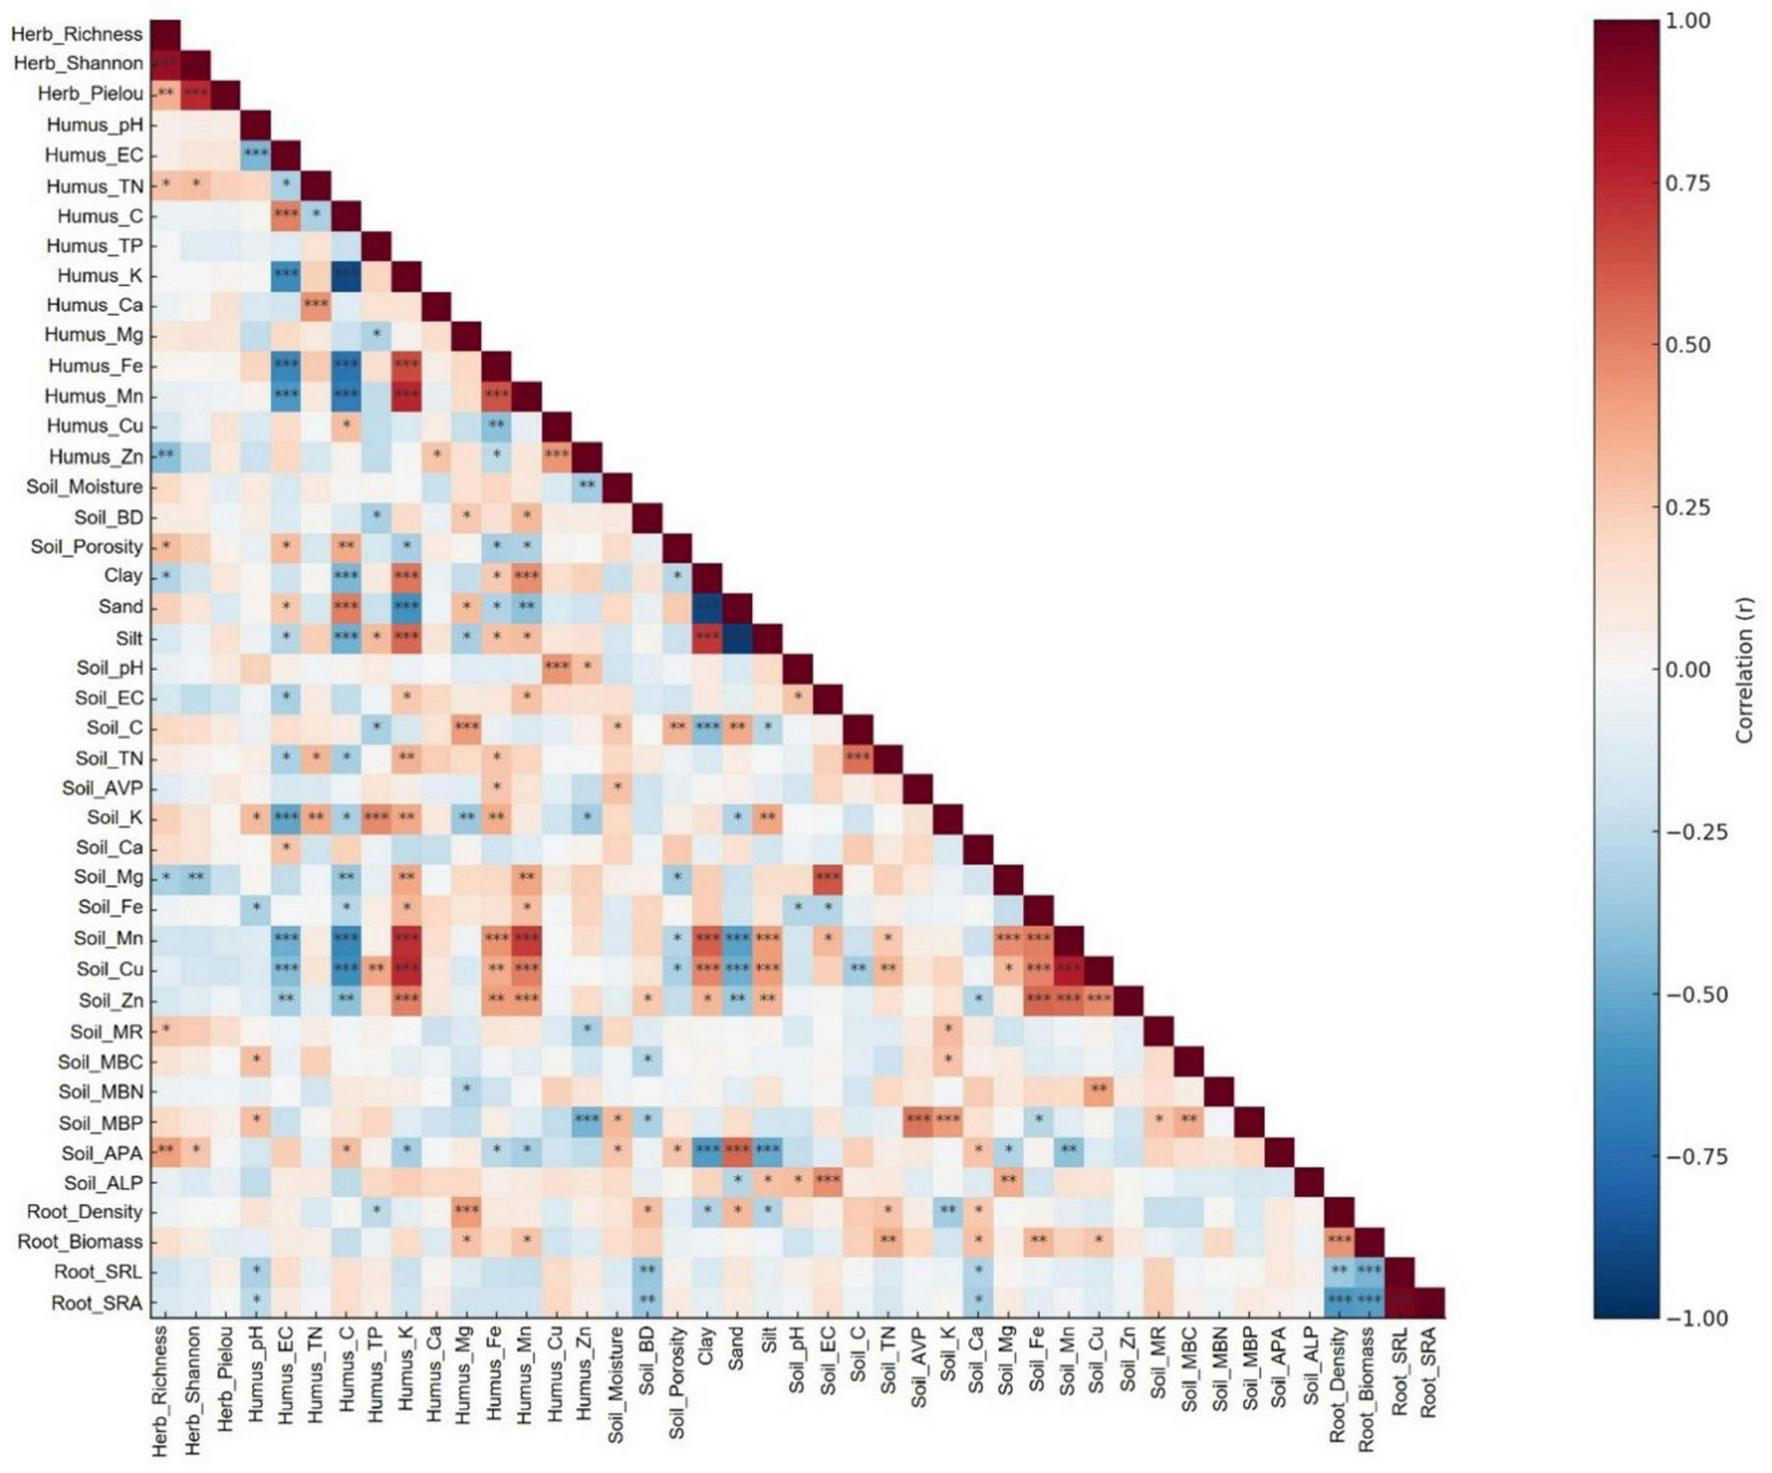
Pearson correlation matrix of belowground ecological indicators across 60 microplots in the virgin Hyrcanian beech forest. Variables include herbaceous diversity indices, humus chemistry, soil physicochemical properties, soil biological indicators, and fine root traits. Colors represent the strength and direction of correlations (blue = negative, red = positive). Significance levels are denoted as p < 0.05 (*), p < 0.01 (**), and p < 0.001 (***). Only the lower triangular matrix is displayed. BD, bulk density; AVP, available phosphorus; MBC, microbial biomass carbon; MBN, microbial biomass nitrogen; MBP, microbial biomass phosphorus; APA, acid phosphatase activity; ALP, alkaline phosphatase activity; SRL, specific root length; SRA, specific root area.
Prior to PCA ordination, herbaceous diversity indices (richness, Shannon, and Pielou) were excluded as response variables–that is, variables describing vegetation outcomes rather than environmental predictors. Deterministic predictors, such as soil texture fractions and the bulk density–porosity pair were reduced by retaining only one representative from each group. To further reduce redundancy, highly correlated predictors (| r| ≥ 0.9) were screened, but no variable pairs exceeded this threshold. A sequential VIF procedure (cutoff = 10) was then applied, iteratively removing collinear variables until only eight independent predictors remained for the final PCA. PCA of the reduced dataset (eight predictors after collinearity filtering) revealed two dominant ecological gradients (Figure 8). Together, PC1 and PC2 explained 38.9% of the variance (PC1 = 20.0%, PC2 = 18.9%; Supplementary Tables 5, 6). PC1 was associated with microbial biomass phosphorus (MBP, loading +0.56) and microbial biomass carbon (MBC, +0.47), contrasted by fine-root biomass (−0.49). PC2 was characterized by specific root length (SRL, +0.57), along with contributions from humus electrical conductivity (EC, +0.35) and soil alkaline phosphatase activity (ALP, +0.32).
FIGURE 8
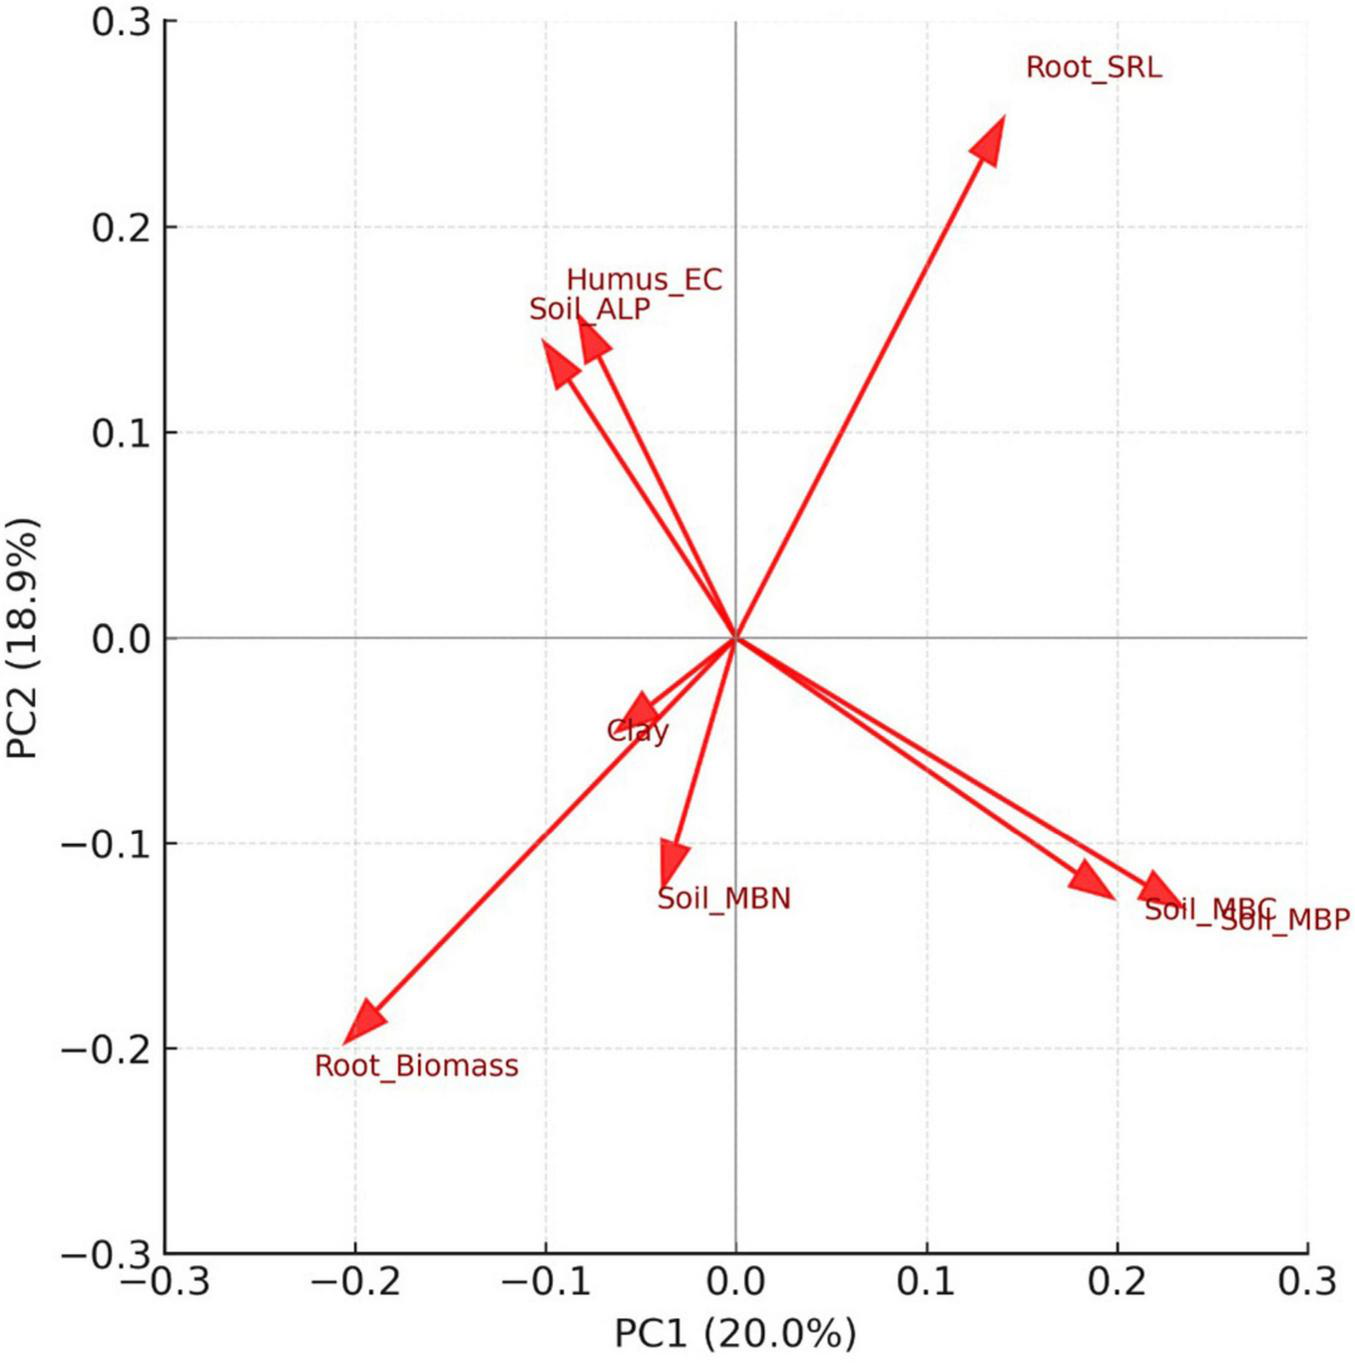
Principal component analysis (PCA) loadings biplot of belowground ecological variables after collinearity filtering (| r| ≥ 0.9 and VIF ≤ 10). Arrows represent standardized variable loadings on the first two principal components (PC1 = 20.0%, PC2 = 18.9%), which together explain 38.9% of the variance. PC1 is associated with positive loadings for microbial biomass phosphorus (Soil_MBP) and microbial biomass carbon (Soil_MBC) and a negative loading for fine-root biomass. PC2 is characterized by positive loadings for specific root length (Root_SRL), with additional contributions from humus electrical conductivity (Humus_EC) and soil alkaline phosphatase activity (Soil_ALP).
4 Discussion
4.1 Forest structure
Structural attributes of the virgin F. orientalis stands clearly exhibit the hallmarks of old-growth development. Mean stand density was 192 stems ha–1, a value that falls within the range reported for other unmanaged oriental beech stands in the region. Published densities span 116 stems ha–1 (Abrari Vajari, 2021) to 364 stems ha–1 (Akhavan et al., 2012). This positioning in the lower–mid portion of the virgin-forest density spectrum (Supplementary Table 7) suggests a mature stand where competition-driven self-thinning has already removed many smaller stems, leaving a cohort dominated by large, long-lived individuals. In old, undisturbed Hyrcanian beech forests, densities typically decline as stands age and canopy trees monopolize growing space (Sefidi, 2012); the density observed here is therefore consistent with a late-successional canopy structure shaped primarily by natural mortality rather than management.
Mean DBH in our study (43 cm) falls within the upper portion of the range reported for unmanaged F. orientalis stands in the Hyrcanian region, where published values span from 31 cm (Sagheb-Talebi et al., 2020) to 93 cm (Abbasian et al., 2015). This concentration of trees in the larger diameter classes indicates an advanced developmental stage (Sefidi, 2012), where long-term canopy occupancy has allowed individual trees to accumulate substantial radial growth. In undisturbed oriental beech forests, diameter enlargement is the principal pathway to biomass accumulation, as height growth slows markedly after canopy closure (Sagheb-Talebi et al., 2020). Therefore, the dominance of large-diameter stems in our plots reflects a long period of uninterrupted growth, low recent disturbance intensity, and minimal human interference. Moreover, large DBH classes are a widely recognized hallmark of old-growth structure in both Hyrcanian and European beech systems (Moradi et al., 2012; Chivulescu et al., 2014; Meyer et al., 2021), as they integrate age, competitive success, and long-term stability of canopy dominants.
Basal area in the study plots averaged 45.2 m2 ha–1, within the range reported for other undisturbed pure F. orientalis stands in the Hyrcanian region (Supplementary Table 7), spans from 15.4 m2 ha–1 (Fazlollahi Mohammadi et al., 2022) to 133 m2 ha–1 (Abbasian et al., 2015) (Supplementary Table 7). Values above 40 m2 ha–1 generally indicate a long-standing dominance of large canopy trees and a high degree of structural saturation of the growing space. In unmanaged Hyrcanian stands, basal area increases steadily through the optimum and terminal phases until it stabilizes under a balance of natural mortality and gap formation (Sefidi, 2023). When compared with European F. sylvatica old-growth forests–where typical basal area values range between 30 and 50 m2 ha–1 (Bilek et al., 2011; Feldmann et al., 2018)–our findings position these Hyrcanian stands well within the structural envelope of temperate beech old-growth ecosystems worldwide. This coexistence of high basal area and numerous large individuals suggests long-term structural continuity under minimal disturbance, likely facilitated by fertile Inceptisols, moderate mean annual temperature (8.5 °C), and ∼1,300 mm precipitation–site conditions known to support sustained biomass accumulation in mature beech forests.
Tree height averaged 18.5 m, within the range documented for F. orientalis (9.5–34 m; Abbasian et al., 2015; Abrari Vajari, 2021) but lower than F. sylvatica in central Europe (30 m; Bilek et al., 2011; Supplementary Table 7). This moderate height is best explained by local site conditions–shallow soils, slope position, and wind exposure–that constrain vertical growth while still supporting large DBH and substantial crown expansion. Furthermore, F. orientalis generally exhibits lower height growth potential than F. sylvatica, consistent with findings that European beech stores about 33% more carbon than oriental beech under comparable conditions (Fuchs et al., 2025). Thus, the observed height values are consistent with species-specific growth limits and reflect the influence of local conditions–such as shallow calcareous soils, slope exposure, and wind stress–which tend to constrain vertical growth while still allowing large diameters and crown expansion.
The average trunk height is ∼11 m in our three plots, indicating long-term self-pruning under persistent canopy closure. Such self-pruning is a well-documented process in dense, late-successional beech (and other shade-tolerant) stands, where competition for light causes lower branches to die and be shed over decades – elevating the live-crown base and gradually producing tall, clean boles and an open understorey (Abrari Vajari, 2023). The consistency of trunk height across all plots suggests that these stands have experienced similar competitive histories and sustained canopy saturation, with no evidence of recent large-scale disturbance or canopy disruption.
The crown architecture of these F. orientalis stands reveals a forest that has operated under long-term competitive equilibrium–exactly what we expect in a mature, disturbance-limited system. Our plots averaged 54.3 m2 CPA, which falls within the wide range reported for pure beech stands worldwide–from 33.4 m2 in F. crenata in Japan (Yamamoto and Nishimura, 1999) to 144.2 m2 in F. orientalis in Iran (Abrari Vajari, 2021). Such crown areas indicate that dominant trees have long occupied their growing space, gradually expanding laterally in stable canopy condition. The crown height-to-width ratio (Ch:Cw ∼1.06) indicates moderately elongated crowns, while the crown height-to-tree height ratio (Ch:h ∼0.35) shows that crowns occupy about one-third of total tree height–values characteristic of mature, shade-tolerant beech under closed-canopy conditions (Martin-Ducup et al., 2018; Bartkowicz and Paluch, 2023). Low crown eccentricity (≤0.19) is particularly important for management interpretation: it signals a stand with little directional stress (wind, slope-driven asymmetry, or edge effects). For managers seeking to emulate natural conditions, such symmetry provides a benchmark for the spacing and light environment needed to maintain crown balance. Finally, the extremely low bole-to-CPA ratio reinforces that these trees invest heavily in crown development relative to stem footprint–an expected trait of late-seral beech. In applied silviculture, this ratio gives a concrete growing-space target (Pretzsch, 2014; Ishii and Asano, 2010; Pretzsch et al., 2015): dominant oriental beech in natural stands require approximately 50–60 m2 of horizontal crown space to maintain their full structural expression. Managers aiming to replicate natural stand structure–whether through selection thinning or single-tree retention–can treat this as a practical reference for determining residual spacing, crown release, and long-term stand density trajectories.
The slenderness coefficient averaged 54.6, well below the commonly cited wind-risk threshold of 85 (Slodicak and Novak, 2006; Kontogianni et al., 2011; Yücesan et al., 2015). This low slenderness indicates the biomechanical stability of these unmanaged stands, as trees with balanced height–diameter ratios are less prone to windthrow and snow damage (Peltola et al., 2000). Comparative data reinforce this conclusion: Matović et al. (2018) reported slenderness coefficients of 88 in managed F. sylvatica stands versus 60 in virgin stands in Serbia, with the higher values in managed forests reflecting the prevalence of thinner trees due to silvicultural interventions. Similarly, Kianmehr et al. (2022) reported mean slenderness coefficients of 46.9 and 50.1 for pure and mixed oriental beech stands, respectively, in the eastern part of the Hyrcanian forests. Our results show that natural stand dynamics favor stable height–diameter relationships, producing trees that are both wind-firm and long-lived. For managers, maintaining slenderness values below ∼85 (Yücesan et al., 2015) in mature stands could serve as a practical guideline for ensuring stability while promoting natural crown development.
The DBH-class distribution follows a reverse-J pattern, a structural configuration widely documented in uneven-aged beech forests that have developed under prolonged low disturbance (Meyer et al., 2003; Fallah et al., 2005; Kucbel et al., 2012; Mighi et al., 2021; Azaryan et al., 2025). Although demographic mechanisms cannot be inferred from DBH data alone, the predominance of small stems and the gradual decline toward larger size classes closely resemble the size structures characteristic of old-growth beech stands across Europe and the Hyrcanian region (Meyer et al., 2003; Kucbel et al., 2012). In contrast, the volume distribution is strongly shifted toward the upper diameter classes, with trees ≥ 70 cm DBH contributing the largest share of stand-level volume. Such concentration of biomass in a limited number of large individuals is a recognized feature of unmanaged beech forests, where long-lived dominant trees account for a disproportionate fraction of total growing stock (Amanzadeh, 2015; Amiri, 2018). Taken together, the coexistence of a reverse-J diameter structure and high volume storage in large stems aligns with structural profiles typical of old-growth beech ecosystems shaped by slow turnover and extended biomass accumulation under minimal anthropogenic disturbance.
The deadwood attributes of the three stands further reinforce their structural maturity. Mean deadwood volume (33.3 m3 ha–1) lies within the lower–intermediate range reported for unmanaged oriental beech forests in the Hyrcanian region–from 8 m3 ha–1in early-stage stands (Eslami and Hoseini, 2015) to more than 100 m3 ha–1in late-decay stages (Amanzadeh, 2015). These values also fall well within the spectrum documented for old-growth beech forests in Europe, which span from modest accumulations in Italy (14 m3 ha–1; Piovesan et al., 2005) to large stores associated with long undisturbed periods in Slovakia (up to 345 m3 ha–1; Kucbel et al., 2012). The predominance of coarse woody debris over snags is consistent with disturbance regimes dominated by windthrow and mechanical stem failure, a pattern widely observed in late-successional beech systems where mortality progresses more frequently through uprooting or breakage than standing dieback (Etemad et al., 2019). The decay-class structure, characterized by a higher share of early decay classes, suggests continuous but low-intensity recruitment of new deadwood, reflecting chronic fine-scale mortality rather than recent severe disturbance. Collectively, these characteristics indicate that the studied stands have likely experienced long-term structural continuity, with deadwood dynamics shaped by gradual canopy turnover rather than episodic stand-initiating events–an ecological signature consistent with old-growth F. orientalis forests.
4.2 Herbaceous layer
The herbaceous layer in the virgin F. orientalis stands exhibits the characteristic composition and diversity structure of late-successional beech forests under closed canopies. The dominance of forbs and hemicryptophytes is fully consistent with understory communities in mature oriental beech systems, where persistent shade and a cool–humid microclimate favor perennial taxa with conservative growth strategies (Gholizadeh et al., 2017; Bidar Lord et al., 2021; Pavlović et al., 2024). The prevalence of hemicryptophytes, in particular, aligns with their adaptive advantage under deep litter, seasonal snow cover, and reduced winter light availability (Archibold, 1995; Bidar Lord et al., 2021).
Chorological analysis revealed a strong dominance of Euro-Siberian elements (40%) and an extremely low proportion of cosmopolitan species (<2%), a combination typically associated with low human disturbance and long-term ecological continuity in Hyrcanian beech forests (Amanzadeh, 2015; Gholizadeh et al., 2017). Similar patterns have been reported only in the least altered remnants of the region, whereas managed or degraded stands tend to show reduced Euro-Siberian affinity and higher representation of ruderal species (Esmailzadeh et al., 2014; Bidar Lord et al., 2021). The prominence of Euro-Siberian species is ecologically significant because these climate-sensitive taxa persist mainly under stable, closed-canopy conditions, making their prevalence a strong indicator of prolonged naturalness and intact old-growth structure.
The diversity structure across the three stands is characteristic of mature Hyrcanian beech forests, where community dominance rests with a small suite of long-lived, shade-adapted woodland herbs. These include hemicryptophytes and mesic forest forbs such as Viola, Galium, Cardamine, and Campanula, along with geophytes like Polygonatum, Cyclamen, and Asarum–all species groups known to persist under deep litter, low light, and stable soil moisture regimes (Scolastri et al., 2017; Deljouei et al., 2018). Although minor differences in richness and evenness occurred among plots, all stands converged functionally around this same understory guild, a pattern widely reported in late-successional beech ecosystems where asymmetric light competition suppresses light-demanding herbs and favors a limited number of stress-tolerant dominants (Gilliam, 2007; Barbier et al., 2008). Such convergence indicates that the three stands share comparable canopy conditions and resource environments, consistent with long-term structural stability and minimal disturbance.
4.3 Humus layer
Humus chemistry in the virgin F. orientalis stands reflects a nutrient regime shaped by slow organic matter turnover and long-term canopy stability–features characteristic of old-growth temperate forests. The slightly acidic pH of 6.0–6.1, positioned within the documented range for oriental beech humus (5.7–6.2; Bayranvand et al., 2017; Azaryan et al., 2021) and for southern beech (Nothofagus) forests (3.7–4.7; Ross and Täte, 1993), illustrates the balance between organic acid production during litter decay and the acidifying effects of beech throughfall and stemflow (Staelens et al., 2007; Berger et al., 2008; Abbasian et al., 2015). In these stands, the persistence of moderately acidic conditions indicates a well-buffered organic horizon where litter-derived acids are counteracted by canopy-mediated return of base cations, maintaining pH stability through time.
Electrical conductivity values of 350–440 μS cm–1, far below the general 2000 μS cm–1 salinity threshold (Brady et al., 2008), reflect humus with inherently low ionic strength. Comparable EC values (260–340 μS cm–1) in oriental beech stands in Turkey (Babur et al., 2022) suggest that ionic availability is controlled mainly by the pace of organic matter turnover rather than by exogenous nutrient inputs (Parsapour et al., 2018; Babur et al., 2022)–consistent with the internal nutrient regulation expected in long-undisturbed Hyrcanian forests. Such low conductivity indicates that nutrient mobility is dominated by biologically mediated cycling rather than leaching or external deposition, a hallmark of closed-canopy, late-successional systems.
Total C concentrations of ∼43% and total N of 1.4% yield a C:N ratio of ∼31, falling squarely within ranges reported for undisturbed temperate beech forests (21–35; Finzi et al., 1998; Vesterdal et al., 2013; Babur et al., 2022). Ratios in this interval indicate moderately slow decomposition, yet sufficient N mineralization to support canopy nutrient demand in closed-canopy stands (Prescott, 2002). This C:N balance suggests efficient microbial immobilization–mineralization dynamics (Dalias and Christou, 2022), which help stabilize nutrient supply during long intervals without disturbance. In this context, the humus layer functions as a long-term nutrient reservoir, buffering nutrient supply and contributing to the high structural stability of mature oriental beech ecosystems.
Macronutrient concentrations were similarly stable across stands. Total P (77–80 μg g–1) lies within the upper mid-range of reported oriental beech values–ranging from 28 μg g–1 in nutrient-poor, high-altitude forests (Bayranvand et al., 2017) to 94 μg g–1 in more fertile Hyrcanian sites (Azaryan et al., 2021). This level of P availability, coupled with the absence of outlier values, indicates a tightly closed P cycle dominated by litter retention and ectomycorrhizal uptake rather than by geogenic supply (Zavišić et al., 2016). Exchangeable K (340–390 μg g–1) exceeds lower Hyrcanian values (∼250 μg g–1; Azaryan et al., 2021), yet remains well below the maxima reported for European F. sylvatica (up to 3500 μg g–1; Meiwes et al., 1998). This positions oriental beech humus within a moderate K regime–adequate for stomatal regulation and osmotic control but conservative relative to more fertile European sites.
Among base cations, the exchange complex was markedly Mg-dominated (∼4700 μg g–1) relative to Ca (∼270 μg g–1). This diverges from many European F. sylvatica forests, where Ca often dominates (Turpault et al., 2019), but aligns closely with oriental beech stands rooted in Mg-rich Hyrcanian parent materials (Azaryan et al., 2021). Reported Mg concentrations in beech forests span 4500–4700 μg g–1 in Hyrcanian stands (Azaryan et al., 2021) and 4200–6600 μg g–1 in European forests (Meiwes et al., 1998), situating our values within the lower European but typical local range. By contrast, our Ca concentration (∼270 μg g–1) is close to the lowest European values [2400 μg g–1 (Khanna et al., 2009)] and far below higher Ca levels reported elsewhere [14,700 μg g–1 (Turpault et al., 2019); 12,450 μg g–1 in Turkey (Çakır and Akburak, 2017)]. This Mg-rich, Ca-poor signature is consistent with carbonate-poor substrates and with sustained biological retention of Mg in the organic horizon, reinforcing a soil environment that favors ectomycorrhizal activity and efficient N and P foraging. Ecologically, Mg dominance supports chlorophyll formation and photosynthetic efficiency (Marschner, 2011), while even lower Ca concentrations are sufficient for cell-wall stabilization and ectomycorrhizal function (White and Broadley, 2003; Nguyen et al., 2017).
Micronutrient concentrations showed similarly coherent patterns. Fe ranged 2700–3100 μg g–1, matching Hyrcanian benchmarks (1600–3200 μg g–1; Azaryan et al., 2021) but exceeding values reported for Turkey (∼200 μg g–1; Çakır and Akburak, 2017) and Bulgaria (∼140 μg g–1; Dimitrova and Damyanova, 2023). Mn concentrations (320–360 μg g–1) align with Hyrcanian values (200–400 μg g–1; Azaryan et al., 2021) but are lower than Bulgaria (∼1300 μg g–1) or Turkey (∼1900 μg g–1), differences tied to parent material and redox conditions. Functionally, both Fe and Mn regulate lignin-degrading pathways essential for humus turnover (Marschner, 2011; Sariyildiz and Anderson, 2003). Cu (∼15 μg g–1) fits within Hyrcanian ranges (13–16 μg g–1; Azaryan et al., 2021) and falls comfortably within broader temperate beech ranges (7–50 μg g–1; Lasota et al., 2020), while Zn (∼33 μg g–1) matches both regional (30–38 μg g–1; Azaryan et al., 2021) and global temperate beech values (3–38 μg g–1; Çakır and Akburak, 2017). These micronutrient levels support essential enzymatic processes–including those governing oxidative stress, lignin decay, and fine-root activity (Marschner, 2011; Baldrian, 2017; Bastakoti, 2023). Together, these micronutrient levels indicate a stable redox environment and sustained enzymatic capacity for organic matter breakdown–conditions typical of mature, well-oxygenated forest floors with minimal disturbance.
4.4 Soil layer
Soil physical properties were remarkably consistent across the three virgin F. orientalis plots, reflecting the stability of long-undisturbed forest soils. Bulk density averaged 1.4 g cm–3 and porosity 60%, indicating moderate compaction yet high void space typical of coarse-textured, well-aerated substrates. Texture analysis confirmed a sand-dominated matrix (sand ∼ 67%, silt ∼ 24%, clay ∼ 9%), well within the regional range reported for oriental beech soils (28%–73% sand; Kooch and Bayranvand, 2017; Azaryan et al., 2022; Sadeghi et al., 2024). Such textures facilitate rapid infiltration but limit the soil’s capacity to retain water, providing a mechanistic explanation for the moderate moisture levels (∼33%) observed in these plots. Compared with previously published Hyrcanian values for porosity (21%–46%; Supplementary Table 8), the higher porosity recorded here points to the persistence of intact macropores and minimal historical soil disturbance.
Chemical attributes (Supplementary Table 9) showed moderately acidic conditions (pH ∼ 5.5), consistent with values reported for pure oriental beech stands (5.3–6.8) but less acidic than European F. sylvatica soils (4.0–4.4) (Supplementary Table 9). EC was also moderate (195 μS cm–1), comparable to other Hyrcanian studies (110 μS cm–1: Haghverdi et al., 2020 to 290 μS cm–1: Karimiyan Bahnemiri et al., 2020), indicating ion concentrations governed largely by internal organic cycling rather than mineral inputs or atmospheric deposition. Organic C (2.8%) and total N (0.38%) fell in the mid-range of Hyrcanian values (2.3%–7.0% C; 0.13%–1.7% N) and produced a narrow C:N ratio (∼7), reflecting rapid microbial turnover and efficient mineralization in the mineral soil. In contrast, the humus horizon exhibited a C:N ∼ 31 (Section “4.3 Humus layer”), highlighting a vertically stratified nutrient economy in which the forest floor serves as a long-term reservoir while the mineral soil supports fast nutrient recycling.
Available P averaged ∼15 μg g–1, matching the central tendency of Hyrcanian studies (Supplementary Table 9), with reported values ranging from 4 μg g–1 in pure and mixed stands (Kianmehr et al., 2022) to an outlier of 563 μg g–1 in pure stands (Mohabbati et al., 2024). Excluding this outlier, mean and median values for pure oriental beech converge around 20 and 16 μg g–1, confirming that the P availability observed here falls squarely within the expected range for undisturbed conditions. Exchangeable K (281 μg g–1) was moderate (Supplementary Table 9), consistent with sandy-loam textures where limited clay content reduces K fixation and maintains a stronger dependence on litterfall inputs for surface K renewal (Tripler et al., 2006).
Base cations showed a clear Mg dominance (∼307 μg g–1 Mg vs. ∼243 μg g–1 Ca), a pattern that reflects both the geochemical signature of Hyrcanian parent materials and the long-term cation cycling characteristic of mature oriental beech forests (Deljouei et al., 2018). The underlying bedrock in the Asalem region contains Mg-rich metamorphic and calcareous substrates (Amanzadeh, 2015), and this lithogenic signal is mirrored in both the mineral soil (Supplementary Table 9) and the humus layer (Section “4.3 Humus layer”), indicating a vertically coherent cation cycle maintained by litter return and slow-weathering mineral inputs. Compared with many European beech forests–where Ca typically dominates the exchange complex (Turpault et al., 2019)–the lower Ca concentrations in our stands suggest limited replenishment from parent material and modest Ca inputs via throughfall and stemflow, conditions characteristic of the humid, Caspian-Sea–influenced Hyrcanian climate. Despite lower Ca supply, concentrations remain well within the functional range needed for cell-wall stabilization and ectomycorrhizal activity (White and Broadley, 2003). By contrast, sustained Mg availability provides the principal cation support for photosynthetic machinery and chlorophyll formation (Marschner, 2011), reinforcing the physiological stability of these old-growth oriental beech stands.
Biological indicators reveal a microbial community operating under clear nutrient constraints rather than simply “conservative” cycling. Microbial respiration (0.37 mg CO2 g–1 24 h–1) and microbial biomass C (∼518 mg kg–1) and N (∼110 mg kg–1) fall squarely within reported Hyrcanian ranges (Supplementary Table 10), indicating that decomposer activity is sustained, but not elevated, under the moderately acidic, sand-dominated soils of these stands. These values are consistent with rapid mineralization of labile substrates and efficient conversion of organic inputs into microbial biomass, reflecting stable moisture and aeration conditions. In contrast, microbial P (∼4.5 mg kg–1) and phosphatase activities (acid ∼39 μg pNP g–1 h–1; alkaline ∼12 μg pNP g–1 h–1) were low relative to regional benchmarks (Supplementary Table 10), demonstrating that the microbial community maintains minimal internal P storage and instead depends on continuous enzymatic cleavage of organic P compounds to meet demand. This pattern is typical of P-limited yet organic-rich forest floors, where microbes must rely on extracellular enzymes to access P bound in humic complexes (Yanai, 1998). The combination of modest biomass, low microbial P, and subdued phosphatase activity therefore points to a system where P availability is controlled more by slow litter-derived inputs than by microbial turnover, consistent with the nutrient economy of mature oriental beech stands.
4.5 Tree fine roots
Fine root traits in the virgin F. orientalis stands were strikingly uniform across the three study plots, with only modest variability in biomass and morphology. Mean fine root density (FRD = 0.53 g cm–3; Figure 6) varied little among sites, reflecting a trait that is largely genetically canalized and only weakly modified by short-term edaphic heterogeneity (Abdi and Deljouei, 2019; Deljouei et al., 2020, 2023). This uniformity contrasts with the broader variation observed in aboveground structure and soil chemistry, suggesting that root mechanical stability and construction costs are maintained across microsites irrespective of localized differences in texture or moisture. The values closely match earlier measurements from pure oriental beech forests in the Hyrcanian region (0.49–0.56 g cm–3; Azaryan et al., 2021, 2022), emphasizing the conservative nature of this trait across undisturbed beech ecosystems.
Fine root biomass averaged 70–90 g m–2 across plots, consistent with previous reports for old-growth beech forests (21–56 g m–2, Kooch et al., 2021; 83 g m–2, Azaryan et al., 2022; 89 g m–2) and comparable to values from European old-growth beech stands in Slovakia (60–110 g m–2; Klingenberg and Leuschner, 2018), though lower than those reported from Germany (107–531 g m–2; Meier and Leuschner, 2008). The slightly higher fine root biomass in Plot 3 likely reflects microscale differences in moisture or nutrient accessibility rather than broader site-level contrasts, given the narrow overall range. This stability is ecologically significant: fine root production and turnover supply a steady annual flux of particulate and dissolved organic matter that fuels microbial biomass and maintains soil aggregation (Heinze et al., 2018). Disturbances that compact soil, remove litter inputs, or reduce coarse woody debris typically curtail fine root development (Picchio et al., 2019), lowering carbon inputs and slowing nutrient cycling (Lewandowski et al., 2019)–highlighting why belowground continuity is a key component of long-term oriental beech stand resilience.
Morphological traits showed similarly constrained variability across the three stands. Specific root length (SRL ∼10 m g–1) and specific root area (SRA ∼115 cm2 g–1) were consistently lower than values reported from old-growth European F. sylvatica forests (SRL 19–32 m g–1; SRA 200–500 cm2 g–1; Klingenberg and Leuschner, 2018; Meier and Leuschner, 2008). This pattern indicates that beech allocates proportionally more carbon to denser, more structurally robust fine roots rather than maximizing absorptive surface area per unit mass (Meier and Leuschner, 2008; Terzaghi et al., 2013). Such morphology is characteristic of resource-conservative foraging strategies in forests where nutrient availability is moderate but stable (Roumet et al., 2016; Gribbe et al., 2025; Wang et al., 2025), and where competition for belowground resources is governed more by long-term persistence than by rapid exploratory growth (Leuschner et al., 2001). In these conditions, maintaining long-lived, mechanically durable fine roots (Bischetti et al., 2009; Vergani et al., 2016; Moresi et al., 2019; Deljouei et al., 2020) enhances sustained nutrient uptake (Göransson et al., 2006) under a closed canopy with relatively steady but spatially heterogeneous nutrient inputs. Accordingly, the fine-root system of F. orientalis operates as a low-turnover, reliability-oriented network, optimized for stable nutrient acquisition in mature, undisturbed Hyrcanian stands rather than for rapid opportunistic exploitation of transient nutrient patches.
4.6 Multivariate relationships among belowground indicators
The multivariate analyses indicate that belowground functioning in virgin F. orientalis stands is structured by a few dominant ecological gradients rather than diffuse correlations across compartments. This pattern is consistent with observations in other temperate old-growth forests, where a limited set of nutrient axes governs ecosystem functioning (Luyssaert et al., 2008). The co-loading of soil organic carbon, total nitrogen, and microbial biomass pools (MBC and MBN) on the same ordination axis highlights the tight coupling between humus inputs and microbial metabolism. Similar integration between organic matter quality and microbial C–N dynamics has been reported for European beech forests (Rennenberg and Dannenmann, 2015; Soong et al., 2020).
A key additional insight emerging from our data is that the strong C–N coupling corresponds well with the vertically stratified nutrient economy characteristic of old-growth beech ecosystems. Klingenberg and Leuschner (2018) reported that primeval and production F. sylvatica forests share similar fine-root nutrient concentrations in the upper mineral soil because the microbial community tightly retains N and rapidly incorporates C from fresh litter inputs. The same pattern appears in our system: the contrast between humus C:N (∼31) and mineral soil C:N (∼7) mirrors this rapid microbial assimilation and subsequent mineralization, explaining why soil microbial biomass loads so strongly onto the primary PCA axis.
Microbial biomass phosphorus (MBP) was only weakly associated with C–N pools but strongly aligned with available P and phosphatase activity, suggesting that P cycling in oriental beech forests is locally regulated by enzymatic mobilization rather than by bulk microbial turnover. This partial decoupling of P from C–N dynamics mirrors nutrient-limited strategies described for P-poor temperate forests (Vitousek et al., 2010; Talkner et al., 2015). The strong association between MBP, alkaline phosphatase, and humus EC suggests a mechanism also described by Bayranvand et al. (2021), where microbial communities in Hyrcanian beech forests invest disproportionately in P-acquiring enzymes when mineral-bound P is low but organic-P inputs remain stable. Our PCA captures this enzymatic emphasis: ALP loads toward the same quadrant as humus EC, indicating that P mobilization is concentrated in microsites with higher ionic turnover, likely reflecting hotspots of root–microbe interactions beneath dense litter layers.
Fine root traits (biomass, SRL, and SRA) showed only modest covariance with soil and microbial variables, implying that variation in root morphology contributes less to nutrient acquisition than mycorrhizal mediation and microbial processing in these stands (Ostonen et al., 2007; Meier and Leuschner, 2008). This finding aligns with Klingenberg and Leuschner (2018), who showed that fine-root morphological variation in beech is surprisingly small even between primeval and production forests, because nutrient foraging is dominated by ectomycorrhizal partners rather than plasticity in SRL or SRA. Our PCA thus reflects this phylogenetically conserved pattern: root morphological axes remain orthogonal to the major microbial nutrient gradients.
Principal component analysis identified two major axes summarizing these interactions. PC1 separated plots with high microbial nutrient pools (MBC, MBN, MBP) from those with greater fine-root biomass, reflecting a gradient from microbially dominated nutrient cycling to greater investment in root biomass, a relationship also observed in temperate broadleaf systems (Bardgett et al., 2014; Liu et al., 2022). PC2 contrasted high SRL with low root biomass and was influenced by humus EC and soil alkaline phosphatase activity, indicating a coordinated phosphorus-foraging strategy in which root morphology and enzymatic activity are co-regulated.
Taken together, the multivariate results support a dual belowground strategy in virgin oriental beech forests: (i) conservative C and N storage with steady microbial turnover, and (ii) tightly regulated P cycling jointly mediated by microbial enzymes and fine-root traits. This configuration stabilizes nutrient availability over time and helps sustain the large-crowned, shade-tolerant canopies that characterize old-growth F. orientalis ecosystems.
4.7 Research limitations and management implications
This study provides one of the most detailed ecological assessments of virgin F. orientalis stands in the Hyrcanian region, but several limitations should be acknowledged. First, measurements were conducted in three 1-ha virgin stands–among the few remaining old-growth beech forests accessible for research. While this sample size limits broad regional inference, the plots were structurally homogeneous (basal area 35–53 m2 ha–1, canopy closure > 90%), allowing internally coherent interpretation. Given that fewer than 1% of Hyrcanian beech forests remain undisturbed (Marvie Mohadjer, 2018), these stands constitute rare reference ecosystems rather than experimental replicates. Second, certain mechanistic processes were inferred rather than directly measured. Mycorrhizal colonization, nutrient leaching, and long-term root turnover were approximated through microbial biomass, phosphatase activity, and fine root traits, which are established functional proxies in temperate forest ecology.
Management implications of this study apply specifically to virgin F. orientalis forests of the Hyrcanian region. The humus horizon–containing ∼43% C, 1.4% N, and a C:N ratio of ∼31–functions as the principal nutrient reservoir; its disturbance would likely reduce available P (15 μg g–1) and K (280 μg g–1), disrupting microbial and fine-root nutrient supply. Protecting the litter layer and avoiding fire or litter removal are therefore essential. Mineral soil conditions (bulk density 1.4 g cm–3; porosity ∼60%) support high infiltration but are highly prone to compaction, reinforcing the need to restrict machinery to permanent trails and operate under dry or frozen conditions. Stable microbial C and N pools contrast with low microbial P and phosphatase activity, indicating persistent P limitation and the importance of continuous litter inputs to sustain nutrient cycling. Fine-root traits–root density (∼0.53 g cm–3) and SRL (∼10 m g–1)–showed little variability, suggesting limited capacity for rapid belowground adjustment; minimizing soil disturbance is thus critical. Microbial P, phosphatase activity, and SRL emerged as sensitive indicators of nutrient imbalance and should be incorporated into long-term monitoring and close-to-nature silvicultural planning.
5 Conclusion
This study provides the most detailed ecological characterization to date of virgin pure F. orientalis forests in the Hyrcanian region, integrating 62 indicators and variables that encompass forest structure, understory composition, humus and soil chemistry, microbial activity, and fine root traits. The results reveal a dual functional strategy underpinning ecosystem stability: (i) conservative C and N storage in humus coupled with steady microbial turnover, and (ii) tightly regulated P cycling governed by enzymatic activity and fine root morphology. Carbon and nitrogen dynamics are buffered across layers, whereas phosphorus availability remains the key limiting factor shaping belowground processes. The dominance of Euro-Siberian, shade-tolerant herbs and the scarcity of cosmopolitan species further confirm the long-term continuity and low disturbance of these stands.
From a silvicultural perspective, the quantified benchmarks–humus C:N ∼ 31, soil C:N ∼ 7, bulk density ∼ 1.4 g cm3, SRL ∼ 10 m g–1, and microbial P ∼ 4–5 mg kg–1–define functional thresholds for sustaining nutrient cycling and regeneration. Conservation of the humus layer, avoidance of soil compaction, and retention of continuous litter inputs are critical to maintain productivity and biodiversity. These findings establish a quantitative reference for close-to-nature management and long-term monitoring of Hyrcanian old-growth beech ecosystems.
Statements
Data availability statement
The original contributions presented in this study are included in this article/Supplementary material, further inquiries can be directed to the corresponding author.
Author contributions
MA: Data curation, Conceptualization, Methodology, Investigation, Writing – review & editing. KAV: Investigation, Writing – review & editing. MVM: Writing – review & editing. SMMS: Writing – original draft, Supervision, Formal analysis, Writing – review & editing, Software, Visualization, Data curation, Methodology, Investigation, Conceptualization, Validation.
Funding
The author(s) declared that financial support was not received for this work and/or its publication.
Conflict of interest
The author(s) declared that this work was conducted in the absence of any commercial or financial relationships that could be construed as a potential conflict of interest.
Generative AI statement
The author(s) declared that generative AI was not used in the creation of this manuscript.
Any alternative text (alt text) provided alongside figures in this article has been generated by Frontiers with the support of artificial intelligence and reasonable efforts have been made to ensure accuracy, including review by the authors wherever possible. If you identify any issues, please contact us.
Publisher’s note
All claims expressed in this article are solely those of the authors and do not necessarily represent those of their affiliated organizations, or those of the publisher, the editors and the reviewers. Any product that may be evaluated in this article, or claim that may be made by its manufacturer, is not guaranteed or endorsed by the publisher.
Supplementary material
The Supplementary Material for this article can be found online at: https://www.frontiersin.org/articles/10.3389/ffgc.2025.1726336/full#supplementary-material
References
1
Abbasian P. Attarod P. Sadeghi S. M. M. Van Stan J. T. Hojjati S. M. (2015). Throughfall nutrients in a degraded indigenous Fagus orientalis forest and a Picea abies plantation in the of North of Iran.Forest Syst.24:e035. 10.5424/fs/2015243-06764
2
Abdi E. Deljouei A. (2019). Seasonal and spatial variability of root reinforcement in three pioneer species of the Hyrcanian forest.Austrian J. For. Sci.136175–198.
3
Abraham J. (2015). Soil health in different land use systems in comparison to a virgin forest in a tropical region of Kerala.Rubber Sci.288–21. 10.5555/20153234737
4
Abrari Vajari K. (2021). Assessing the intra-specific competition and its relation with tree structure in a beech forest (Fagus orientalis Lipsky).Brazilian J. Bot.44957–961. 10.1007/s40415-021-00752-6
5
Abrari Vajari K. (2023). Self-pruning and its relation to trees structural attributes in Oriental beech (Fagus orientalis L.) forest stand. (Case study: Beech forest of Alandan, Mazandaran).J. Plant Ecosyst. Conserv.11160–167.
6
Akhani H. Djamali M. Ghorbanalizadeh A. Ramezani E. (2010). Plant biodiversity of Hyrcanian relict forests, N Iran: An overview of the flora, vegetation, palaeoecology and conservation.Pak. J. Bot.42231–258.
7
Akhavan R. Sagheb-Talebi K. Zenner E. K. Safavimanesh F. (2012). Spatial patterns in different forest development stages of an intact old-growth Oriental beech forest in the Caspian region of Iran.Eur. J. For. Res.1311355–1366. 10.1007/s10342-012-0603-z
8
Amanzadeh B. (2015). Investigation of stand structure, developmental stages, and ecological characteristics of gaps in the mixed broadleaf forest of Asalem.PhD dissertation.Faculty of Natural Resources, Sari University of Agricultural Sciences and Natural Resources, 208.
9
Amanzadeh B. Sagheb-Talebi Kh Foumani B. Fadaie F. J. Camarero J. Linares J. (2013). Spatial distribution and volume of dead wood in unmanaged Caspian beech (Fagus orientalis) forests from northern Iran.Forests4751–765. 10.3390/f4040751
10
Amiri M. (2018). Silvicultural characteristics of an unlogged mixed oriental beech stand in the Golestan Province.J. Plant Res.31539–555.
11
Archibold O. W. (1995). Ecology of world vegetation.Berlin: Springer Science & Business Media. 10.1007/978-94-011-0009-0
12
ASTM D 2216-19 (2019). Standard Test Methods for Laboratory Determination of Water (Moisture) Content of Soil and Rock by Mass.West Conshohocken, PA: Annual Book of ASTM Standards ASTM International.
13
Azaryan M. Abrari Vajari K. Amanzadeh B. (2021). Variations in humus and fine root properties related to development stages in a temperate natural Beech forest.Eur. J. For. Res.140307–316. 10.1007/s10342-020-01331-2
14
Azaryan M. Aghajani H. Etemad V. Sadeghi S. M. M. (2025). Relative proportion of dominant tree species across diameter classes in less-disturbed mid-elevation forests of the western Hyrcanian region.J. For. Wood Product78333–346. 10.22059/jfwp.2025.400354.1363
15
Azaryan M. Vajari K. A. Amanzadeh B. (2022). Soil properties and fine root morphological traits in relation to soil particle-size fractions in a broad-leaved beech (Fagus orientalis Lipsky) forest.Acta Oecol.117:103852. 10.1016/j.actao.2022.103852
16
Babur E. Dindaroðlu T. Riaz M. Uslu O. S. (2022). Seasonal variations in litter layers’ characteristics control microbial respiration and microbial carbon utilization under mature pine, cedar, and beech forest stands in the Eastern Mediterranean Karstic Ecosystems.Microbial Ecol.84153–167. 10.1007/s00248-021-01842-4
17
Baldrian P. (2017). Forest microbiome: Diversity, complexity and dynamics.FEMS Microbiol. Rev.41109–130. 10.1093/femsre/fuw040
18
Barbier S. Gosselin F. Balandier P. (2008). Influence of tree species on understory vegetation diversity and mechanisms involved—A critical review for temperate and boreal forests.For. Ecol. Manag.2541–15. 10.1016/j.foreco.2007.09.038
19
Bardgett R. D. Mommer L. De Vries F. T. (2014). Going underground: Root traits as drivers of ecosystem processes.Trends Ecol. Evol.29692–699. 10.1016/j.tree.2014.10.006
20
Bartkowicz L. Paluch J. (2023). Morphological plasticity of six tree species with different light demands growing in multi-layered deciduous forests in Central Europe.Eur. J. For. Res.1421177–1195. 10.1007/s10342-023-01584-7
21
Bastakoti S. (2023). Role of zinc in management of plant diseases: A review.Cogent Food Agric.9:2194483. 10.1080/23311932.2023.2194483
22
Bayranvand M. Akbarinia M. Salehi Jouzani G. Gharechahi J. Baldrian P. (2021). Distribution of soil extracellular enzymatic, microbial, and biological functions in the C and N-cycle pathways along a forest altitudinal gradient.Front. Microbiol.12:660603. 10.3389/fmicb.2021.660603
23
Bayranvand M. Kooch Y. Hosseini S. M. Alberti G. (2017). Humus forms in relation to altitude and forest type in the Northern mountainous regions of Iran.For. Ecol. Manag.38578–86. 10.1016/j.foreco.2016.11.035
24
Berger T. W. Untersteiner H. Schume H. Jost G. (2008). Throughfall fluxes in a secondary spruce (Picea abies), a beech (Fagus sylvatica) and a mixed spruce–beech stand.For. Ecol. Manag.255605–618. 10.1016/j.foreco.2007.09.030
25
Bidar Lord M. Dehdar Dargahi M. Jalili A. (2021). The vegetation in Hyrcanian submountain forests: The case of Tuli-Nesa forest in Gilan.Iran. Taxon. Biosyst.1357–78. 10.22108/tbj.2021.127896.1156
26
Bilek L. Remes J. Zahradnik D. (2011). Managed vs. unmanaged. Structure of beech forest stands (Fagus sylvatica L.) after 50 years of development, Central Bohemia.For. Syst.20122–138. 10.5424/fs/2011201-10243
27
Bischetti G. B. Chiaradia E. A. Epis T. Morlotti E. (2009). Root cohesion of forest species in the Italian Alps.Plant Soil32471–89. 10.1007/s11104-009-9941
28
Boncina A. (2000). Comparison of structure and biodiversity in the Rajhenav virgin forest remnant and managed forest in the Dinaric region of Slovenia.Glob. Ecol. Biogeogr.9201–211. 10.1046/j.1365-2699.2000.00155.x
29
Brady N. C. Weil R. R. Weil R. R. (2008). The nature and properties of soils, Vol. 13. Upper Saddle River, NJ: Prentice Hall, 662–710.
30
Brookes P. C. Landman A. Pruden G. Jenkinson D. S. (1985). Chloroform fumigation and the release of soil nitrogen: A rapid direct extraction method to measure microbial biomass nitrogen in soil.Soil Biol. Biochem.17837–842. 10.1016/0038-0717(85)90144-0
31
Brünig E. Mayer H. (1980). Waldbauliche terminologie [Silvicultural terminology].Vienna: Institut für Waldbau, Universität für Bodenkultur. German
32
Cain S. A. (1938). The species-area curve.Am. Midl. Nat.19573–581. 10.2307/2420468
33
Çakır M. Akburak S. (2017). Litterfall and nutrients return to soil in pure and mixed stands of oak and beech.J. Faculty For. Istanbul Univer.67185–200. 10.17099/jffiu.301602
34
Carpathian Convention (2014). Criteria and indicators for identification of virgin forests in the Carpathians. Available online at: http://www.carpathianconvention.org/tl_files/carpathiancon/Downloads/03%20Meetings%20and%20Events/COP/2014_COP4_Mikulov/Follow%20Up/DOC13_Criteria_Indicators_virginforests_FINAL_26SEP.pdf (accessed May 21, 2024).
35
Chandra L. R. Gupta S. Pande V. Singh N. (2016). Impact of forest vegetation on soil characteristics: A correlation between soil biological and physico-chemical properties.3 Biotech6:188. 10.1007/s13205-016-0510-y
36
Chao A. Gotelli N. J. Hsieh T. C. Sander E. L. Ma K. H. Colwell R. K. et al (2014). Rarefaction and extrapolation with Hill numbers: A framework for sampling and estimation in species diversity studies.Ecol. Monogr.8445–67. 10.1890/13-0133.1
37
Chivulescu S. Badea O. Tomescu R. O. M. I. C. Silaghi D. I. A. N. A. Leca S. Turcu D. (2014). Structural features of virgin beech forests in Semenic mountains. The dynamic structure of virgin beech forest P20 Semenic between 2005–2013.Proc. Romanian Acad. Ser. B Chem. Life Sci. Geosci.16115–124. 10.15177/seefor.19-13
38
Dalias P. Christou A. (2022). Secondary immobilization as a phase of N mineralization dynamics of soil organic inputs.Nitrogen3600–607. 10.3390/nitrogen3040039
39
Davis P. H. (1970). Flora of Turkey and the East Aegean Islands, Vol. 3. Edinburgh: Edinburgh University Press.
40
Deljouei A. Abdi E. Schwarz M. Majnounian B. Sohrabi H. Dumroese R. K. (2020). Mechanical characteristics of the fine roots of two broadleaved tree species from the Temperate Caspian Hyrcanian Ecoregion.Forests11:345. 10.3390/f11030345
41
Deljouei A. Cislaghi A. Abdi E. Borz S. A. Majnounian B. Hales T. C. (2023). Implications of hornbeam and beech root systems on slope stability: From field and laboratory measurements to modelling methods.Plant Soil483547–572. 10.1007/s11104-022-05764-z
42
Deljouei A. Sadeghi S. M. M. Abdi E. Bernhardt-Römermann M. Pascoe E. L. Marcantonio M. (2018). The impact of road disturbance on vegetation and soil properties in a beech stand, Hyrcanian forest.Eur. J. For. Res.137759–770. 10.1007/s10342-018-1138-8
43
Dimitrova V. Damyanova S. (2023). Chemical composition of litterfall in beech (Fagus sylvatica L.) forests.Wseas Trans. Environ. Dev.19412–417. 10.37394/232015.2023.19.38
44
Dormann C. F. Elith J. Bacher S. Buchmann C. Carl G. Carré G. et al (2013). Collinearity: A review of methods to deal with it and a simulation study evaluating their performance.Ecography3627–46. 10.1111/j.1600-0587.2012.07348.x
45
Esfandiari H. Sefidi K. Ghavidel A. Esmaeilpour M. Amanzadeh B. Sadeghi S. M. M. (2023). Effect of forestry practices on the biological characteristics of soils (Case study: Beech Forest of Asalem).Water Soil Manag. Modeling316–28. 10.22098/mmws.2022.11641.1149
46
Eslami A. Hoseini S. M. T. (2015). The dynamics of different developmental stages in natural oriental beech (Fagus orientalis Lipsky) stands in northern Iran.Agric. For.61207–217. 10.22092/ijfpr.2014.10672
47
Esmailzadeh O. Nourmohammadi K. Asadi H. Yousefzadeh H. (2014). A floristic study of Salaheddinkola forests, Nowshahr, Iran.Taxon. Biosyst.637–54.
48
Etemad V. Javanmiri Pour M. Foolady Z. (2019). The importance of coarse woody debris in dynamic phases exposure in the beech (Fagus orientalis L.) stands of Hyrcanian forests.J. For. Sci.65408–422. 10.17221/56/2019-JFS
49
Fallah A. Zobeyri M. Marvie Mohadjer M. R. (2005). An appropriate model for distribution of diameter classes of natural beech stands in the Sangdeh & Shastkolateh forests.Ir. J. Natural Resour.58813–822.
50
Fantozzi D. Montagnoli A. Trupiano D. Di Martino P. Scippa G. S. Agosto G. et al (2024). A systematic review of studies on fine and coarse root traits measurement: Towards the enhancement of urban forests monitoring and management.Front. For. Glob. Change7:1322087. 10.3389/ffgc.2024.1322087
51
Fazlollahi Mohammadi M. Tobin B. Jalali S. G. Kooch Y. Riemann R. (2022). Fine-scale topographic influence on the spatial distribution of tree species diameter in old-growth beech (Fagus orientalis Lipsky.) forests, northern Iran.Sci. Rep.12:7633. 10.1038/s41598-022-10606-0
52
Feldmann E. Glatthorn J. Hauck M. Leuschner C. (2018). A novel empirical approach for determining the extension of forest development stages in temperate old-growth forests.Eur. J. For. Res.137321–335. 10.1007/s10342-018-1105-4
53
Finzi A. C. Canham C. D. Van Breemen N. (1998). Canopy tree–soil interactions within temperate forests: Species effects on pH and cations.Ecol. Appl.8447–454. 10.2307/2641083
54
Frey S. J. Hadley A. S. Johnson S. L. Schulze M. Jones J. A. Betts M. G. (2016). Spatial models reveal the microclimatic buffering capacity of old-growth forests.Sci. Adv.2:e1501392. 10.1126/sciadv.1501392
55
Fuchs Z. Vacek Z. Vacek S. Černý J. Cukor J. Šimůnek V. et al (2025). Growth responses of European beech (Fagus sylvatica L.) and oriental beech (Fagus orientalis Lipsky) along an elevation Gradient Under Global climate change.Forests16:655. 10.3390/f16040655
56
Ge G. W. Bauder J. W. (1986). “Particle-size analysis,” in Methods of Soil Analysis Part I, Physical and Mineralogical Methods, ed.ArnoldK. (Wisconsin: SSSA Madison), 383–411.
57
Gholizadeh H. Saeidi Mehrvarz S. H. Naqinezhad A. (2017). Floristic study of the pure beech (Fagus orientalis Lipsky) stands in eastern Guilan, Iran.Nova Biol. Reperta4271–280. 10.21859/acadpub.nbr.4.3.271
58
Gilliam F. S. (2007). The ecological significance of the herbaceous layer in temperate forest ecosystems.BioScience57845–858. 10.1641/B571007
59
Göransson H. Wallander H. Ingerslev M. Rosengren U. (2006). Estimating the relative nutrient uptake from different soil depths in Quercus robur, Fagus sylvatica and Picea abies.Plant Soil28687–97. 10.1007/s11104-006-9028-0
60
Graf F. Frei M. (2013). Soil aggregate stability related to soil density, root length, and mycorrhiza using site-specific Alnus incana and Melanogaster variegatus s.l.Ecol. Eng.57314–323. 10.1016/j.ecoleng.2013.04.037
61
Gribbe S. Enderle L. Coners H. Hertel D. Leuschner C. (2025). Fine root morphological traits and root dynamics of beech, oak, pine and Douglas fir along a climatic aridity gradient.Plant Soil5152073–2099. 10.1007/s11104-025-07706-x
62
Grossman R. B. Reinsch T. G. (2002). 2.1 Bulk density and linear extensibility.Methods Soil Anal. Part 4 Phys. Methods5201–228. 10.2136/sssabookser5.4.c9
63
Habashi H. (2019). Spatial correlation of pit and mound topography with canopy gaps in a virgin mixed beech forest, northern Iran.J. For. Res.30295–303. 10.1007/s11676-018-0604-y
64
Haghverdi K. Samadzadeh B. Kooch Y. (2020). The effect of different forest types on litter quality and soil enzyme activity in the Vaz Forest of Noor-Mazandaran Province.Ecol. Iranian For.872–80. 10.30466/jfrd.2023.54505.1648
65
Hashemi M. Naghdi R. Nikooy M. Hemmati V. (2019). Assessment of forest road pavement materials one year after restoration (case study: Asalem forest in northern Iran).J. For. Sci.65113–119. 10.17221/68/2018-JFS
66
Heinze S. Ludwig B. Piepho H. P. Mikutta R. Don A. Wordell-Dietrich P. et al (2018). Factors controlling the variability of organic matter in the top-and subsoil of a sandy Dystric Cambisol under beech forest.Geoderma31137–44. 10.1016/j.geoderma.2017.09.028
67
Himmelbauer M. L. Loiskandl A. W. Kastanek A. F. (2004). Estimating length, average diameter and surface area of roots using two different image analyses systems.Plant Soil260111–120. 10.1023/B:PLSO.0000030171.28821.55
68
Hosseini S. M. (2019). Outstanding universal values of Hyrcanian Forest, the newest Iranian property, inscribed in the UNESCO’s World Heritage List.Tourism Res.11–17.
69
Ishii H. Asano S. (2010). The role of crown architecture, leaf phenology and photosynthetic activity in promoting complementary use of light among coexisting species in temperate forests.Ecol. Res.25715–722. 10.1007/s11284-009-0668-4
70
Jahangard S. Jahangard S. Saraji M. (2024). Combination of headspace single-drop microextraction with smartphone-based on-drop colorimetric dmetric detection for determination of ammonia and total nitrogen in environmental and food samples.Microchem. J.199:109965. 10.1016/j.microc.2024.109965
71
Jones E. W. (1945). The structure and reproduction of the virgin forest of the north temperate zone.New Phytol.44130–148. 10.1111/j.1469-8137.1945.tb05026.x
72
Karimiyan Bahnemiri A. Taheri Abkenar K. Kooch Y. Salehi A. (2020). The effect of canopy combination in over story on nutrient Contentand microbial indices of soil in Korkoroud forests of Noshahr.Ir. J. For.11547–558.
73
Kassambara A. Mundt F. (2017). Package ‘factoextra’. Extract and visualize te results of multivariate data analyses.Available online at: https://CRAN.R-project.org/package=factoextra (accessed August 2025).
74
Khanna P. K. Fortmann H. Meesenburg H. Eichhorn J. Meiwes K. J. (2009). “Biomass and element content of foliage and aboveground litterfall on the three long-term experimental beech sites: Dynamics and significance,” in Functioning and Management of European Beech Ecosystems. Ecological Studies, Vol. 208edsBrummeR.KhannaP. K. (Springer: Heidelberg). 10.1007/b82392_12
75
Kianmehr A. Hojati M. Mahmoodi M. B. (2022). Study of tree quantitative and qualitative characteristics and soil fertility in pure and mixed stands of beech and hornbeam.J. For. Res. Dev.881–95. 10.30466/jfrd.2021.53798.1566
76
Kisin B. Vasic V. Bakovic Z. (2025). Management of virgin beech forests in Serbia and the dynamics of changes in their basic structural elements.Nova Geodesia5309–309. 10.55779/ng52309
77
Kjeldahl J. (1883). Medd Carlsberg Lab, 2, 1.Z. Anal. Chem22:366.
78
Klingenberg E. Leuschner C. (2018). A belowground perspective of temperate old-growth forests: Fine root system structure in beech primeval and production forests.For. Ecol. Manag.42568–74. 10.1016/j.foreco.2018.05.035
79
Knohl A. Schulze E. D. Kolle O. Buchmann N. (2003). Large carbon uptake by an unmanaged 250-year-old deciduous forest in Central Germany.Agric. For. Meteorol.118151–167. 10.1016/S0168-1923(03)00115-1
80
Kontogianni A. Tsitsoni T. Goudelis G. (2011). An index based on silvicultural knowledge for tree stability assessment and improved ecological function in urban ecosystems.Ecol. Eng.37914–919. 10.1016/j.ecoleng.2011.01.015
81
Kooch Y. Bayranvand M. (2017). Effect of canopy gaps area on soil biological activities and organic matter fractions in a Beech forest stand.Ir. J. For.8533–546. 10.22092/ijfpr.2019.119185
82
Kooch Y. Parsapour M. K. Egli M. Moghimian N. (2021). Forest floor and soil properties in different development stages of Oriental beech forests.Appl. Soil Ecol.161:103823. 10.1016/j.apsoil.2020.103823
83
Korpel S. (1995). Die urwalder der westkarpaten [The primeval forests of the Western Carpathians].Stuttgart: Gustav Fischer Verlag. German.
84
Krajnc L. Farrelly N. Harte A. M. (2019). The influence of crown and stem characteristics on timber quality in softwoods.For. Ecol. Manag.4358–17. 10.1016/j.foreco.2018.12.043
85
Kucbel S. Saniga M. Jaloviar P. Vencurik J. (2012). Stand structure and temporal variability in old-growth beech-dominated forests of the northwestern Carpathians: A 40-years perspective.For. Ecol. Manag.264125–133. 10.1016/j.foreco.2011.10.011
86
Lasota J. Błońska E. Łyszczarz S. Tibbett M. (2020). Forest humus type governs heavy metal accumulation in specific organic matter fractions.Water Air Soil Pollut.231:80. 10.1007/s11270-020-4450-0
87
Leibundgut H. (1978). Über die Dynamik europäischer Urwälder [On the dynamics of European primeval forests].Allgemeine Forstzeitschrift33686–690. German.
88
Léonard J. (1988). Contribution à I’etude la flore et de la végétation des desert d’Iran, Fascicule 8: Etude des aries de distribution, Les phytochories, Les chorotypes [Contribution to the study of the flora and vegetation of the Iranian deserts, Booklet 8: Study of distribution areas, Phytochories, Chorotypes].Meise: Bulletin of the Jardin Botanique Nacional de Belgique, 190. French.
89
Leuschner C. Hertel D. Coners H. Büttner V. (2001). Root competition between beech and oak: A hypothesis.Oecologia126276–284. 10.1007/s004420000507
90
Lewandowski T. E. Forrester J. A. Mladenoff D. J. Marin-Spiotta E. D’Amato A. W. Palik B. J. et al (2019). Long term effects of intensive biomass harvesting and compaction on the forest soil ecosystem.Soil Biol. Biochem.137:107572. 10.1016/j.soilbio.2019.107572
91
Lin D. Shen R. Lin J. Zhu G. Yang Y. Fanin N. (2024). Relationships between rhizosphere microbial communities, soil abiotic properties and root trait variation within a pine species.J. Ecol.1121275–1286. 10.1111/1365-2745.14297
92
Liu B. Han F. Ning P. Li H. Rengel Z. (2022). Root traits and soil nutrient and carbon availability drive soil microbial diversity and composition in a northern temperate forest.Plant Soil479281–299. 10.1007/s11104-022-05516-z
93
Luyssaert S. Schulze E. D. Börner A. Knohl A. Hessenmöller D. Law B. E. et al (2008). Old-growth forests as global carbon sinks.Nature455213–215. 10.1038/nature07276
94
Marschner H. (2011). Marschner’s mineral nutrition of higher plants.Cambridge, MA: Academic press. 10.1016/C2009-0-63043-9
95
Martin-Ducup O. Schneider R. Fournier R. A. (2018). Analyzing the vertical distribution of crown material in mixed stand composed of two temperate tree species.Forests9:673. 10.3390/f9110673
96
Marvie Mohadjer M. R. (2018). Silviculture.Tehran: University of Tehran press (in Persian).
97
Matamala R. Schlesinger W. H. (2000). Effects of elevated atmospheric CO2 on fine root production and activity in an intact temperate forest ecosystem.Glob. Change Biol.6967–979. 10.1046/j.1365-2486.2000.00374.x
98
Matović B. Koprivica M. Kisin B. Stojanović D. Kneginjić I. Stepanovic S. (2018). Comparison of stand structure in managed and virgin European beech forests in Serbia.Šumarski List14247–57. 10.31298/sl.142.1-2.4
99
Mayer H. (1986). Europäische Urwälder [European jungles].Stuttgart: UTB, Fischer Verlag.
100
Meier I. C. Leuschner C. (2008). Belowground drought response of European beech: Fine root biomass and carbon partitioning in 14 mature stands across a precipitation gradient.Glob. Change Biol.142081–2095. 10.1111/j.1365-2486.2008.01634.x
101
Meiwes K. J. Merino A. Beese F. O. (1998). Chemical composition of throughfall, soil water, leaves and leaf litter in a beech forest receiving long term application of ammonium sulphate.Plant Soil201217–230. 10.1023/A:1004315513482
102
Meyer P. Aljes M. Culmsee H. Feldmann E. Glatthorn J. Leuschner C. et al (2021). Quantifying old-growthness of lowland European beech forests by a multivariate indicator for forest structure.Ecol. Indicators125:107575. 10.1016/j.ecolind.2021.107575
103
Meyer P. Tabaku V. Lüpke B. (2003). Die Struktur albanischer Rotbuchen-Urwälder–Ableitungen für eine naturnahe Buchenwirtschaft: Structural Characteristics of Albanian Beech (Fagus sylvatica L.) Virgin Forests–Deductions for Semi-Natural Forestry [The structure of Albanian beech virgin forests – deductions for near-natural beech forestry: Structural Characteristics of Albanian Beech (Fagus sylvatica L.) Virgin Forests – Deductions for Semi-Natural Forestry].Forstwissenschaftliches Centralblatt12247–58. 10.1046/j.1439-0337.2003.02041.xGerman.
104
Mighi A. Taheri Abkenar K. Amanzadeh N. (2021). Fitting frequency distributions of trees diameter at breast height in different growth stages in Asalem mixed forests of Guilan.For. Wood Products74291–300. 10.22059/jfwp.2021.314216.1144
105
Mirahmadi S. B. Mataji A. Kafaki S. B. Akhavan R. (2023). Investigating the structure of the mosaics of developmental phases in mixed oriental Beech virgin forests in northern Iran.Austrian J. For. Sci.140213–238. 10.53203/fs.2303.3
106
Mohabbati F. Eshaghi Rad J. Parhizkar P. (2024). The effect of gap size on herbaceous biodiversity and soil properties in the Beech forest with different management background in Mazandran and Guilan provinces.For. Res. Dev.10343–361. 10.30466/jfrd.2023.54856.1688
107
Montagnoli A. Dumroese R. K. Terzaghi M. Onelli E. Scippa G. S. Chiatante D. (2019). Seasonality of fine root dynamics and activity of root and shoot vascular cambium in a Quercus ilex L. forest (Italy).For. Ecol. Manag.43126–34. 10.1016/j.foreco.2018.06.044
108
Montagnoli A. Terzaghi M. Di Iorio A. Scippa G. S. Chiatante D. (2012). Fine-root morphological and growth traits in a Turkey-oak stand in relation to seasonal changes in soil moisture in the Southern Apennines.Italy. Ecol. Res.271015–1025. 10.1007/s11284-012-0981-1
109
Montagnoli A. Terzaghi M. Giussani B. Scippa G. S. Chiatante D. (2018). An integrated method for high-resolution definition of new diameter-based fine root sub-classes of Fagus sylvatica L.Ann. For. Sci.75:76. 10.1007/s13595-018-0758-y
110
Monz C. A. Reuss D. E. Elliott E. T. (1991). Soil microbial biomass carbon and nitrogen estimates using 2450 MHz microwave irradiation or chloroform fumigation followed by direct extraction.Agric. Ecosyst. Environ.3455–63. 10.1016/0167-8809(91)90093-D
111
Moradi M. Marvie Mohadjer M. R. Sefidi K. Zobiri M. Omidi A. (2012). Over-mature beech trees (Fagus orientalis Lipsky) and close-to-nature forestry in northern Iran.J. For. Res.23289–294. 10.1007/s11676-012-0254-4
112
Moresi F. V. Maesano M. Matteucci G. Romagnoli M. Sidle R. C. Scarascia Mugnozza G. (2019). Root biomechanical traits in a montane Mediterranean forest watershed: Variations with species diversity and soil depth.Forests10:341. 10.3390/f10040341
113
Nguyen D. Q. Pena R. Polle A. (2017). Impact of ectomycorrhizal community composition and soil treatment on inorganic nitrogen nutrition and performance of beech (Fagus sylvatica L.) provenances.Trees311891–1904. 10.1007/s00468-017-1594-7
114
Olsen S. R. (1954). Estimation of available phosphorus in soils by extraction with sodium bicarbonate (No. 939).Washington, DC: US Department of Agriculture.
115
Ostonen I. Püttsepp Ü Biel C. Alberton O. Bakker M. R. Lõhmus K. et al (2007). Specific root length as an indicator of environmental change.Plant Biosyst.141426–442. 10.1080/11263500701626069
116
Parsapour M. K. Kooch Y. Hosseini S. M. Alavi S. J. (2018). Litter and topsoil in Alnus subcordata plantation on former degraded natural forest land: A synthesis of age-sequence.Soil Tillage Res.1791–10. 10.1016/j.still.2018.01.008
117
Parviainen J. (2005). Virgin and natural forests in the temperate zone of Europe.For. Snow Landsc. Res.789–18.
118
Pavlović B. Babić V. Stajić S. Poduška Z. Rakonjac L. Vukin M. et al (2024). Phytogeographical and biological spectrum of vascular flora as an indicator of ecological changes following clear-cutting in Eastern Serbian beech forest sites.Notulae Botanicae Horti Agrobotanici Cluj-Napoca5213905–13905. 10.15835/nbha52313905
119
Peltola H. Kellomäki S. Hassinen A. Granander M. (2000). Mechanical stability of Scots pine, Norway spruce and birch: An analysis of tree-pulling experiments in Finland.For. Ecol. Manag.135143–153. 10.1016/S0378-1127(00)00306-6
120
Petritan I. C. Commarmot B. Hobi M. L. Petritan A. M. Bigler C. Abrudan I. V. et al (2015). Structural patterns of beech and silver fir suggest stability and resilience of the virgin forest Sinca in the Southern Carpathians, Romania.For. Ecol. Manag.356184–195. 10.1016/j.foreco.2015.07.015
121
Picchio R. Tavankar F. Nikooy M. Pignatti G. Venanzi R. Lo Monaco A. (2019). Morphology, growth and architecture response of beech (Fagus orientalis Lipsky) and maple tree (Acer velutinum Boiss.) seedlings to soil compaction stress caused by mechanized logging operations.Forests10:771. 10.3390/f10090771
122
Pielou E. C. (1966). The measurement of diversity in different types of biological collections.J. Theoretical Biol.13131–144. 10.1016/0022-5193(66)90013-0
123
Piovesan G. Di Filippo A. Alessandrini A. E. A. Biondi F. Schirone B. (2005). Structure, dynamics and dendroecology of an old-growth Fagus forest in the Apennines.J. Vegetation Sci.1613–28. 10.1111/j.1654-1103.2005.tb02334.x
124
Prescott C. E. (2002). The influence of the forest canopy on nutrient cycling.Tree Physiol.221193–1200. 10.1093/treephys/22.15-16.1193
125
Pretzsch H. (2014). Canopy space filling and tree crown morphology in mixed-species stands compared with monocultures.For. Ecol. Manag.327251–264. 10.1016/j.foreco.2014.04.027
126
Pretzsch H. Biber P. Schütze G. Uhl E. Rötzer T. (2014). Forest stand growth dynamics in Central Europe have accelerated since 1870.Nat. Commun.6:6965. 10.1038/ncomms5967
127
Pretzsch H. Biber P. Uhl E. Dahlhausen J. Rötzer T. Caldentey J. et al (2015). Crown size and growing space requirement of common tree species in urban centres, parks, and forests.Urban For. Urban Greening14466–479. 10.1016/j.ufug.2015.04.006
128
Quinn G. P. Keough M. J. (2002). Experimental design and data analysis for biologists.Cambridge: Cambridge university press. 10.1017/CBO9780511806384
129
R Core Team. (2023). R: A language and environment for statistical computing. Version 4.3.2.Vienna: R Foundation for Statistical Computing.
130
Rahanjam S. Marvie Mohadjer M. R. Zobeiri M. Sefidi K. (2018). Quantitative and qualitative assessment of deadwood in natural stands of Hyrcanian forests (Case study: Gorazbon district of Kheyrud, Nowshahr).Ir. J. For. Poplar Res.25656–666. 10.22092/ijfpr.2017.113871
131
Raunkiaer C. (1934). The life forms of plants and statistical plant geography.Oxford: Clarendon Press.
132
Rechinger K. (1963). Flora Iranica. Akademische Druck-U [Flora Iranica. Academic Print-U], Vol. 1–178. Verlagsanstalt: Graz. German.
133
Rennenberg H. Dannenmann M. (2015). Nitrogen nutrition of trees in temperate forests—the significance of nitrogen availability in the pedosphere and atmosphere.Forests62820–2835. 10.3390/f6082820
134
Ross D. J. Täte K. R. (1993). Microbial C and N, and respiratory activity, in litter and soil of a southern beech (Nothofagus) forest: distribution and properties.Soil Biol. Biochem.25477–483. 10.1016/0038-0717(93)90073-K
135
Roumet C. Birouste M. Picon-Cochard C. Ghestem M. Osman N. Vrignon-Brenas S. et al (2016). Root structure–function relationships in 74 species: Evidence of a root economics spectrum related to carbon economy.New Phytol.210815–826. 10.1111/nph.13828
136
Sadeghi A. Salehi A. Pourbabaei H. Kooch Y. (2024). Investigation of changes in soil properties in pure and mixed beech type in the western forests of Guilan.For. Res. Dev.9571–591. 10.30466/jfrd.2023.54767.1672
137
Sagheb-Talebi K. Amanzadeh B. Parhizkar P. Hassani M. Amini M. Mirkazemi Z. et al (2015). “Importance of deadwood in the virgin oriental beech stands of they Caspian Forests,” in Proceedings of the 10th International Beech Symposium, Kastamonu, (Turkey).
138
Sagheb-Talebi K. Parhizkar P. Hassani M. Amanzadeh B. Hemmati A. Khanjani S. B. et al (2020). Preliminary results of survey on stand structure in permanent research plots of Hyrcanian intact beech (Fagus orientalis Lipsky) forests.Ir. J. For. Poplar Res.28163–179. 10.22059/jfwp.2021.301031.1102
139
Sariyildiz T. Anderson J. M. (2003). Interactions between litter quality, decomposition and soil fertility: A laboratory study.Soil Biol. Biochem.35391–399. 10.1016/S0038-0717(02)00290-0
140
Schuck P. Bücking W. (1994). A review of approaches to forestry research on structure, succession and biodiversity of undisturbed and semi-natural forests and woodlands in Europe. EFI Working paper 3.Finland: Joensuu.
141
Scolastri A. Cancellieri L. Iocchi M. Cutini M. (2017). Old coppice versus high forest: The impact of beech forest management on plant species diversity in central Apennines (Italy).J. Plant Ecol.10271–280. 10.1093/jpe/rtw034
142
Sefidi K. (2012). Late Successional Stage Dynamics in Mixed Beech Stands.Doctoral dissertation, Ph.D dissertation. Tehran: University of Tehran.
143
Sefidi K. (2023). Comparison of structural complexity index (SCI) in the developmental stages of Hyrcanian mixed beech forests.Ir. J. For.14389–405. 10.22034/ijf.2022.327756.1845
144
Sefidi K. Etemad V. (2015). Dead wood characteristics influencing macrofungi species abundance and diversity in Caspian natural beech (Fagus orientalis Lipsky) forests.For. Syst.24eSC03–eSC03. 10.5424/fs/2015242-06039
145
Sefidi K. Mohadjer M. R. M. Mosandl R. Copenheaver C. A. (2013). Coarse and fine woody debris in mature Oriental beech (Fagus orientalis Lipsky) forests of northern Iran.Natural Areas J.33248–255. 10.3375/043.033.0303
146
Sferra G. Montagnoli A. Bucci P. Monaco G. Agosto D. Trupiano G. et al (2025). An integrated perspective on the interactions between Quercus cerris fine roots and microbial community in top-and sub-layers of urban rhizosphere.Plant Biosyst. Int. J. Dealing With All Aspects Plant Biol.1591630–1648. 10.1080/11263504.2025.2554074
147
Shannon C. (1948). A mathematical theory of communication.Bell. Syst. Tech. J.27379–423. 10.1002/j.1538-7305.1948.tb01338.x
148
Slodicak M. Novak J. (2006). Silvicultural measures to increase the mechanical stability of pure secondary Norway spruce stands before conversion.For. Ecol. Manag.224252–257. 10.1016/j.foreco.2005.12.037
149
Soong J. L. Fuchslueger L. Marańon-Jimenez S. Torn M. S. Janssens I. A. Penuelas J. et al (2020). Microbial carbon limitation: The need for integrating microorganisms into our understanding of ecosystem carbon cycling.Glob. Change Biol.261953–1961. 10.1111/gcb.14962
150
Staelens J. De Schrijver A. Verheyen K. (2007). Seasonal variation in throughfall and stemflow chemistry beneath a European beech (Fagus sylvatica) tree in relation to canopy phenology.Can. J. For. Res.371359–1372. 10.1139/X07-003
151
Tabatabai M. A. Bremner J. M. (1969). Use of p-nitrophenyl phosphate for assay of soil phosphatase activity.Soil Biol. Biochem.1301–307. 10.1016/0038-0717(69)90012-1
152
Takhtajan A. (1986). Floristic regions of the World.Berkeley: University of California Press, 522. 10.1126/science.236.4797.100
153
Talkner U. Meiwes K. J. Potoèić N. Seletković I. Cools N. De Vos B. et al (2015). Phosphorus nutrition of beech (Fagus sylvatica L.) is decreasing in Europe.Ann. For. Sci.72919–928. 10.1007/s13595-015-0459-8
154
Terzaghi M. Montagnoli A. Di Iorio A. Scippa G. S. Chiatante D. (2013). Fine-root carbon and nitrogen concentration of European beech (Fagus sylvatica L.) in Italy Prealps: possible implications of coppice conversion to high forest.Front. Plant Sci.4:192. 10.3389/fpls.2013.00192
155
Tripler C. E. Kaushal S. S. Likens G. E. Todd Walter M. (2006). Patterns in potassium dynamics in forest ecosystems.Ecol. Lett.9451–466. 10.1111/j.1461-0248.2006.00891.x
156
Turpault M. P. Calvaruso C. Dincher M. Mohammed G. Didier S. Redon P. O. et al (2019). Contribution of carbonates and oxalates to the calcium cycle in three beech temperate forest ecosystems with contrasting soil calcium availability.Biogeochemistry14651–70. 10.1007/s10533-019-00610-4
157
Vance E. D. Brookes P. C. Jenkinson D. S. (1987). Microbial biomass measurements in forest soils: The use of the chloroform fumigation-incubation method in strongly acid soils.Soil Biol. Biochem.19697–702. 10.1016/0038-0717(87)90051-4
158
Veen P. Fanta J. Raev I. Biriş I. A. de Smidt J. Maes B. (2010). Virgin forests in Romania and Bulgaria: Results of two national inventory projects and their implications for protection.Biodiver. Conserv.191805–1819. 10.1007/s10531-010-9804-2
159
Vergani C. Schwarz M. Soldati M. Corda A. Giadrossich F. Chiaradia E. A. et al (2016). Root reinforcement dynamics in subalpine spruce forests following timber harvest: A case study in Canton Schwyz.Switzerland. Catena143275–288. 10.1016/j.catena.2016.03.038
160
Vesterdal L. Clarke N. Sigurdsson B. D. Gundersen P. (2013). Do tree species influence soil carbon stocks in temperate and boreal forests?For. Ecol. Manag.3094–18. 10.1016/j.foreco.2013.01.017
161
Vitousek P. M. Porder S. Houlton B. Z. Chadwick O. A. (2010). Terrestrial phosphorus limitation: Mechanisms, implications, and nitrogen–phosphorus interactions.Ecol. Appl.205–15. 10.1890/08-0127.1
162
Walkley A. Black I. A. (1934). An examination of the Degtjareff method for determining soil organic matter, and a proposed modification of the chromic acid titration method.Soil Sci.3729–38. 10.1097/00010694-193401000-00003
163
Wang S. Comas L. H. Reich P. B. McCormack M. L. Phillips R. P. Gu J. et al (2025). Variation of root resource acquisition and conservation strategies in a temperate forest is linked with plant growth forms.Tree Physiol.45:taf027. 10.1093/treephys/tpaf027
164
Wang Y. Titus S. J. LeMay V. M. (1998). Relationships between tree slenderness coefficients and tree or stand characteristics for major species in boreal mixedwood forests.Can. J. For. Res.281171–1183. 10.1139/cjfr-28-8-1171
165
Wei T. Simko V. Levy M. Xie Y. Jin Y. Zemla J. (2017). Package ‘corrplot’.Statistician56:e24.
166
White P. J. Broadley M. R. (2003). Calcium in plants.Ann. Bot.92487–511. 10.1093/aob/mcg164
167
Whittaker R. H. (1972). Evolution and measurement of species diversity.Taxon21213–251. 10.2307/1218190
168
Yamamoto S. Nishimura N. (1999). Canopy gap formation and replacement pattern of major tree species among developmental stages of beech (Fagus crenata) stands.Japan. Plant Ecol.140167–176. 10.1023/A:1009713002039
169
Yanai R. D. (1998). The effect of whole-tree harvest on phosphorus cycling in a northern hardwood forest.For. Ecol. Manag.104281–295. 10.1016/S0378-1127(97)00256-9
170
Yücesan Z. Özçelik S. Oktan E. (2015). Effects of thinning on stand structure and tree stability in an afforested oriental beech (Fagus orientalis Lipsky) stand in northeast Turkey.J. For. Res.26123–129. 10.1007/s11676-015-0028-x
171
Zarandian A. Baral H. Yavari A. R. Jafari H. R. Stork N. E. Ling M. A. et al (2016). Anthropogenic decline of ecosystem services threatens the integrity of the unique Hyrcanian (Caspian) forests in Northern Iran.Forests7:51. 10.3390/f7030051
172
Zavišić A. Nassal P. Yang N. Heuck C. Spohn M. Marhan S. et al (2016). Phosphorus availabilities in beech (Fagus sylvatica L.) forests impose habitat filtering on ectomycorrhizal communities and impact tree nutrition.Soil Biol. Biochem.98127–137. 10.1016/j.soilbio.2016.04.006
173
Zeibig A. Diaci J. Wagner S. (2005). Gap disturbance patterns of a Fagus sylvatica virgin forest remnant in the mountain vegetation belt of Slovenia.For. Snow Landsc. Res.7969–80.
174
Zohary M. (1973). Geobotanical foundations of the middle east.Stuttgart: Fischer.
175
Zuur A. F. Ieno E. N. Elphick C. S. (2010). A protocol for data exploration to avoid common statistical problems.Methods Ecol. Evol.13–14. 10.1111/j.2041-210X.2009.00001.x
Summary
Keywords
close-to-nature silviculture, Fagus orientalis , forest ecosystem functioning, Iran, old-growth forest, fine root traits, soil properties, forest structure
Citation
Azaryan M, Abrari Vajari K, Marcu MV and Sadeghi SMM (2026) Integrating multiscale ecological indicators to assess ecosystem functioning in virgin Hyrcanian beech forests. Front. For. Glob. Change 8:1726336. doi: 10.3389/ffgc.2025.1726336
Received
16 October 2025
Revised
09 December 2025
Accepted
18 December 2025
Published
30 January 2026
Volume
8 - 2025
Edited by
Manoj Kumar Jhariya, Sant Gahira Guru Vishwavidyalaya, India
Reviewed by
Gabriella Sferra, University of Molise, Italy
Sarvesh Suyal, HNBGU, India
Updates
Copyright
© 2026 Azaryan, Abrari Vajari, Marcu and Sadeghi.
This is an open-access article distributed under the terms of the Creative Commons Attribution License (CC BY). The use, distribution or reproduction in other forums is permitted, provided the original author(s) and the copyright owner(s) are credited and that the original publication in this journal is cited, in accordance with accepted academic practice. No use, distribution or reproduction is permitted which does not comply with these terms.
*Correspondence: Seyed Mohammad Moein Sadeghi, s.sadeghi@nau.edu
Disclaimer
All claims expressed in this article are solely those of the authors and do not necessarily represent those of their affiliated organizations, or those of the publisher, the editors and the reviewers. Any product that may be evaluated in this article or claim that may be made by its manufacturer is not guaranteed or endorsed by the publisher.