Abstract
In forests, first-year tree seedlings experience high mortality rates, yet we know relatively little about how extreme climate events contribute. In this study, we exposed over 700 containerized seedlings of eight tree species to three heat and three drought treatments, and their combinations, that represent extreme conditions currently beyond the climate typically experienced by species at the temperate-boreal ecotone. We measured the height and survival of all seedlings and compared these responses to species traits. We found that, overall, combined heat and drought reduced survival more than either stressor alone. Reductions in survival were strongest for two northern conifer species with relatively low root-to-shoot biomass ratios. In contrast, two more southerly distributed species with the largest root systems had higher survival. Treatments did not impact growth or biomass of surviving seedlings. These results establish that higher temperatures or shifting precipitation regimes may not pose a major threat to first-year seedlings separately, but combined warming and drought have the potential to cause widespread mortality, particularly at southern range margins. These findings demonstrate the importance of first-year seedling survival under combined stressors and clarify how these rare but extreme events can cause regeneration failure. Although difficult to predict, these events should be considered in adaptive management planning and forest modeling due to their potential for profound impacts.
Introduction
In many parts of the world, changing temperature and moisture conditions are altering forest composition (Allen et al., 2010; Forzieri et al., 2022; Hammond et al., 2022). Transition zones between forest types, such as the temperate-boreal ecotone in the northern United States and southern Canada, are expected to experience the most change as many tree species in this region are at their northern or southern range margins (Boulanger et al., 2017). Northerly-distributed species, such as Picea spp. and Abies balsamea, are expected to experience significant reductions in suitable habitat as early as 2060 (Andrews et al., 2022). The regeneration layer, and especially first-year tree seedlings, are particularly sensitive to temperature and moisture conditions (Johnson et al., 2011) and changes in climate, like increased heat or drought frequency, may facilitate rapid changes in forest composition that are manifested first in the regeneration layer (Canham and Murphy, 2017; Fisichelli et al., 2013). Climate change induced compositional shifts in the temperate-boreal forest may lead to loss of regionally unique spruce-fir forests and valuable ecosystem services (Andrews et al., 2022; Davis, 1966; Pohjanmies et al., 2017). Despite the sensitivity of trees at this early life stage, most studies have focused on responses of tree seedlings to climate after their first year, potentially missing a critical abiotic filter on tree survival in response to climate stress (for example, Balducci et al., 2015; Ziegler et al., 2024).
With projected warming and habitat loss in the temperate-boreal ecotone, many temperate deciduous species with southerly distributions relative to the ecotone (hereafter, “temperate broadleaves”) are expected to increase in abundance relative to more northerly-distributed conifer species (hereafter, “northern conifers”; Andrews et al., 2022; Prasad et al., 2020; Tang and Beckage, 2010). These changes are likely to occur as species are exposed to novel climate conditions, as first-year seedlings of temperate broadleaves are shown to have higher survival than first-year seedlings of northern conifers when exposed to heat and drought conditions (Fisichelli et al., 2014; Wright et al., 2018). Despite this, most studies investigating species-specific responses to abiotic stress are limited to experimental studies that use older seedlings (for example, Crockett and Hurteau, 2024; Putnam and Reich, 2017; Reich et al., 2015; Rodgers et al., 2018; Will et al., 2013). While this work is valuable, it ignores the critical developmental stage of newly emerged trees and limits our understanding of how climate stress impacts tree regeneration, therefore reducing the accuracy of forest simulation models in climate sensitive regions (Hanbury-Brown et al., 2022). Since first-year seedlings are likely more sensitive to climate but most regeneration data come from older seedlings, we may be underestimating the sensitivity and impacts of climate change on forest composition.
While first-year seedling survival is naturally low (De Steven, 1991; Frey et al., 2007), compared to long-term climate changes, survival of first-year seedlings is likely to be most impacted by extreme climate events, like heat, drought, and combined heat and drought events (Anderegg et al., 2019; McDowell et al., 2008; Menezes-Silva et al., 2019). First-year seedlings have a limited capacity to avoid heat and drought stress due to their small size, shallow roots, and newly developed vascular systems (Johnson et al., 2011). Though relatively few studies focus specifically on first-year seedlings, research conducted using older seedlings suggests that while both elevated temperatures and drought conditions can reduce seedling survival, responses vary by species (Crockett and Hurteau, 2024; Lalor et al., 2023; Moran et al., 2019), and we expect these effects to apply more strongly to first-year seedlings than to older seedlings. For example, warming has been shown in some cases to reduce survival for northern conifers and some, but not all, temperate broadleaves (Rank et al., 2022; Rodgers et al., 2018). However, reduced survival of northern conifers depends on the extent of warming (Kunert et al., 2022) and if it coincides with drought (Fisichelli et al., 2014; Wright et al., 2018). Although the effects of heat and drought on first-year tree seedling survival have been addressed for some species native to the temperate-boreal ecotone, there is a need to expand this work to encompass more species and include additional measurements to characterize the extent to which heated and droughted plants experience physiological stress (Balducci et al., 2015). We have a strong understanding of how extreme climate events impact growth of saplings and canopy trees, but the lack of data on first-year seedlings limits the ability to understand what climate-driven forests compositional shifts will occur as a result of first-year seedling mortality.
Among surviving seedlings, growth responses to abiotic stress vary by species and range locations. For instance, Reich et al. (2015) and Wright et al. (2018) found that warming increases the growth of temperate broadleaves within the temperate-boreal ecotone, but not that of northern conifers (also see Fisichelli et al., 2012). Though Fisichelli et al. (2014) also notes that growth is greatest for temperate broadleaves and increases with temperature, this effect depends on the degree of warming and moisture availability. Other species-specific studies conducted with temperate broadleaves in multiple ecosystems show varying effects of warming, so the native range of seedlings has great potential to dictate growth responses as the climate continues to warm (Carón et al., 2015; Meeussen et al., 2022; Putnam and Reich, 2017). Warming is generally expected to increase growth for temperate broadleaf species provided they can avoid moisture stress. However, reduced or altered precipitation regimes associated with climate change and the small size of first-year seedlings increase the likelihood that seedlings will experience moisture stress.
Incorporating species-level traits, particularly those related to temperature- and drought- tolerance, can improve our ability to predict first-year survival and growth of trees in response to extreme climate events (Bartlett et al., 2012; McGregor et al., 2021; Münchinger et al., 2023). Because drought can induce physiological stress such as hydraulic failure, reduced net photosynthesis, and decreased leaf conductance (Hammond et al., 2019; Reich et al., 2018), seedling survival during heat and drought stress is strongly linked to hydraulic traits and growth is linked to both hydraulic- and carbon-related traits (Adams et al., 2017; Johnson et al., 2018). Hydraulic traits that may be particularly important for first-year survival in heat and drought stress include turgor loss point (TLP; the ability to maintain leaf structure and function at low water potentials) and minimum epidermal conductance (gmin; the ability to reduce residual water loss during drought). Both relate to tree growth and survival (Duursma et al., 2019; Visakorpi et al., 2024; Wang et al., 2024), but at least some studies suggest that TLP, for example, may not vary among species in their first year (Beikircher et al., 2025). Other structural traits with implications for water relations, such as leaf mass per area (LMA; Sastry et al., 2018) and root-to-shoot biomass ratio (root:shoot; Pearson and D'Orangeville, 2022), have been correlated with higher stress tolerance. These data are widely available and often used to understand the growth and survival of older trees (for example, Anderegg et al., 2019; Choat et al., 2018; McDowell et al., 2008), though more data is required to understand variation in traits during the first year of tree growth (Beikircher et al., 2025). Therefore, specific sets of traits may relate to survival and growth of first-year seedlings experiencing climate extremes and could be used to generalize species-specific patterns to broader taxonomic or functional groups.
The goal of this study was to understand how heat, drought, and combined heat and drought affect the growth and survival of first-year seedlings of tree species native to eastern North America. We exposed 793 first-year seedlings of eight tree species {balsam fir [Abies balsamea (L.) Mill.], red maple (Acer rubrum L.), sugar maple (Acer saccharum Marsh.), black ash (Fraxinus nigra Marsh.), red spruce (Picea rubens Sarg.), eastern white pine (Pinus strobus L.), red oak (Quercus rubra L.), and northern white cedar (Thuja occidentalis L.)} to three heat and three drought treatments, and their combinations, for 90 days. We selected species based on their relative ranges in Maine, USA, which is located at the northern limit of the temperate forest and the southern limit of the boreal forest (Goldblum and Rigg, 2010). Species included a mix of northern conifers generally approaching their southern range margins and temperate broadleaves approaching their northern range margins. Additionally, these species represent a range of traits, including species and broader taxonomic groups with relatively high TLP (Abies balsamea) and relatively low TLP (Acer rubrum, Quercus rubra), high gmin (Thuja occidentalis, Acer rubrum) and low gmin (Quercus rubra), high LMA (Picea spp.) and low LMA (Acer spp.; Bartlett et al., 2014; Duursma et al., 2019). We tested how these heat and drought treatments impacted seedling survival and growth and explored potential links with physiological traits. Generally, we hypothesized that:
-
I. Across all species, warming alone would not affect seedling survival, but drought alone would decrease survival, and more so when combined with heat.
-
II. Temperate broadleaf species would have increased growth in warmed treatments when adequate substrate moisture is present, and northern conifer species would experience no changes to growth because of the temperature treatments, regardless of substrate moisture.
-
III. Species with the highest survival would be those with the most efficient water-conserving traits, including a low TLP, low gmin, high LMA, and high root:shoot, for example, red maple, red oak, and eastern white cedar.
Methods
Seeds and seedlings
To determine how first-year seedlings respond to heat and drought events, we collected seed in fall 2023 from four northern conifer and four temperate broadleaf trees native to the temperate-boreal ecotone in the northeastern US (Table 1 and Supplementary Table 1). All seeds were cold-moist stratified according to recommendations in the USDA Seed Manual except for red maple which we collected in spring 2024 when they matured (Bonner and Karrfalt, 2008; Supplementary Table 2). In late April and early May of 2024, we sowed seeds of all northern conifer species in 6.4-cm-deep (250 cm3) square containers and all temperate broadleaf species in 8.9-cm-deep (500 cm3) square containers. We used two container sizes to match expected root system size of each species to container size such that all species experienced moisture stress. The angiosperm species in this study grow more quickly than the gymnosperm species, and the root growth of angiosperm species would be limited in the smaller containers, while the root growth of the gymnosperm species would be limited to a small portion of the media in the larger containers and therefore unlikely to experience moisture stress. We collected red maple seeds in early June (when they naturally mature) and immediately sowed seeds into 6.4-cm-deep containers. Later, established seedlings of red maple were repotted into 8.9-cm-deep containers. For all species except red oak, sugar maple, and red maple, two to four seeds were sown in each container to account for low germination rates. All containers were filled with potting media (Pro-Mix BX Growing Medium with Mycorrhizae, Premier Tech Growers and Consumers Inc., Pennsylvania USA) and hand-watered regularly. This medium includes a starter charge of nutrients that provides up to 130 mgL−1 nitrate, 40 mgL−1 phosphate, and 130 mgL−1 potassium, plus additional macro and micronutrients for an initial electrical conductivity of up to 1.8 mmhos cm−1 as measured by saturated medium extract. Containers were kept in a climate-controlled greenhouse to establish until May 31, 2024. Data on establishment rates was collected when seedlings were moved outside and again on June 12, 2024 (Supplementary Table 3). Seedlings were then kept outside on the University of Maine campus (44°53′50.0″N, 68°40′08.3″W; Supplementary Figure 1, within the current extent of the temperate-boreal ecotone), to acclimate to ambient conditions in full sunlight and protected from predation with mesh wire fencing until June 20, 2024 [day-of-treatment (DOT) 0; Supplementary Table 4]. To ensure we had enough singly planted individuals, we repotted seedlings when there was more than one individual per container but a limited number of total individuals of that species (Supplementary Table 5).
Table 1
| Leaf type | Species | Range |
|---|---|---|
| Evergreen needle-leaved species | Balsam fir (Abies balsamea) | Southern |
| Red spruce (Picea rubens) | Southern/central | |
| Eastern white pine (Pinus strobus) | Northern | |
| Northern white cedar (Thuja occidentalis) | Southern | |
| Deciduous broad-leaved species | Red oak (Quercus rubra) | Northern |
| Red maple (Acer rubrum) | Northern/central | |
| Sugar maple (Acer saccharum) | Northern | |
| Black ash (Fraxinus nigra) | Northern/central |
List of tree species by functional leaf type and where the state of Maine, USA falls within their native ranges.
Experimental design
To simulate heat and drought conditions, we created 27 custom chambers from inverted 62.5-liter clear plastic storage containers (Supplementary Figure 2). Chambers were evenly divided into three blocks (A, B, or C) of 9 chambers each (Figure 1A). Within each block, each chamber was randomly assigned to one unique combination of heat (ambient, moderate, extreme) and drought (irrigated, extended, repeated; Figure 1B). Due to limitations in the number of established seedlings and predation during the establishment phase for some species (Supplementary Table 3), the number of seedlings within a chamber was not always consistent among species. Specifically, we placed two or three individuals of angiosperm species in all chambers, except for black ash, which had overall low establishment and was limited to one individual in seven chambers in block three, and red oak, which was limited to one individual in one chamber of block three. A minimum of five individuals of each gymnosperm species, except for red spruce, was placed in each chamber. For the gymnosperm species with the highest overall establishment (eastern white pine, balsam fir, and northern white cedar), up to 13 individuals were placed in some chambers, and a subset of these extra gymnosperms (107 total seedlings) were multiply-sown (2–4 individuals per container) to guarantee sufficient individuals for destructive measurements like water potential and gmin. Due to limited seed stock for red spruce, three seedlings were placed in each chamber in blocks one and two, and one seedling was placed in seven chambers in block three (Supplementary Table 1; 793 total seedlings; Figure 1C). We randomized placement of seedlings within each chamber to ensure that the effect of shading was not confounded with treatment. All chambers were fitted with an automated spray irrigation system (Vibronet Mister, Netafim, Israel). Misters were placed in the center of the chamber about 30.5-cm from the base and watered seedlings to saturation three times per week except during drought treatments.
Figure 1
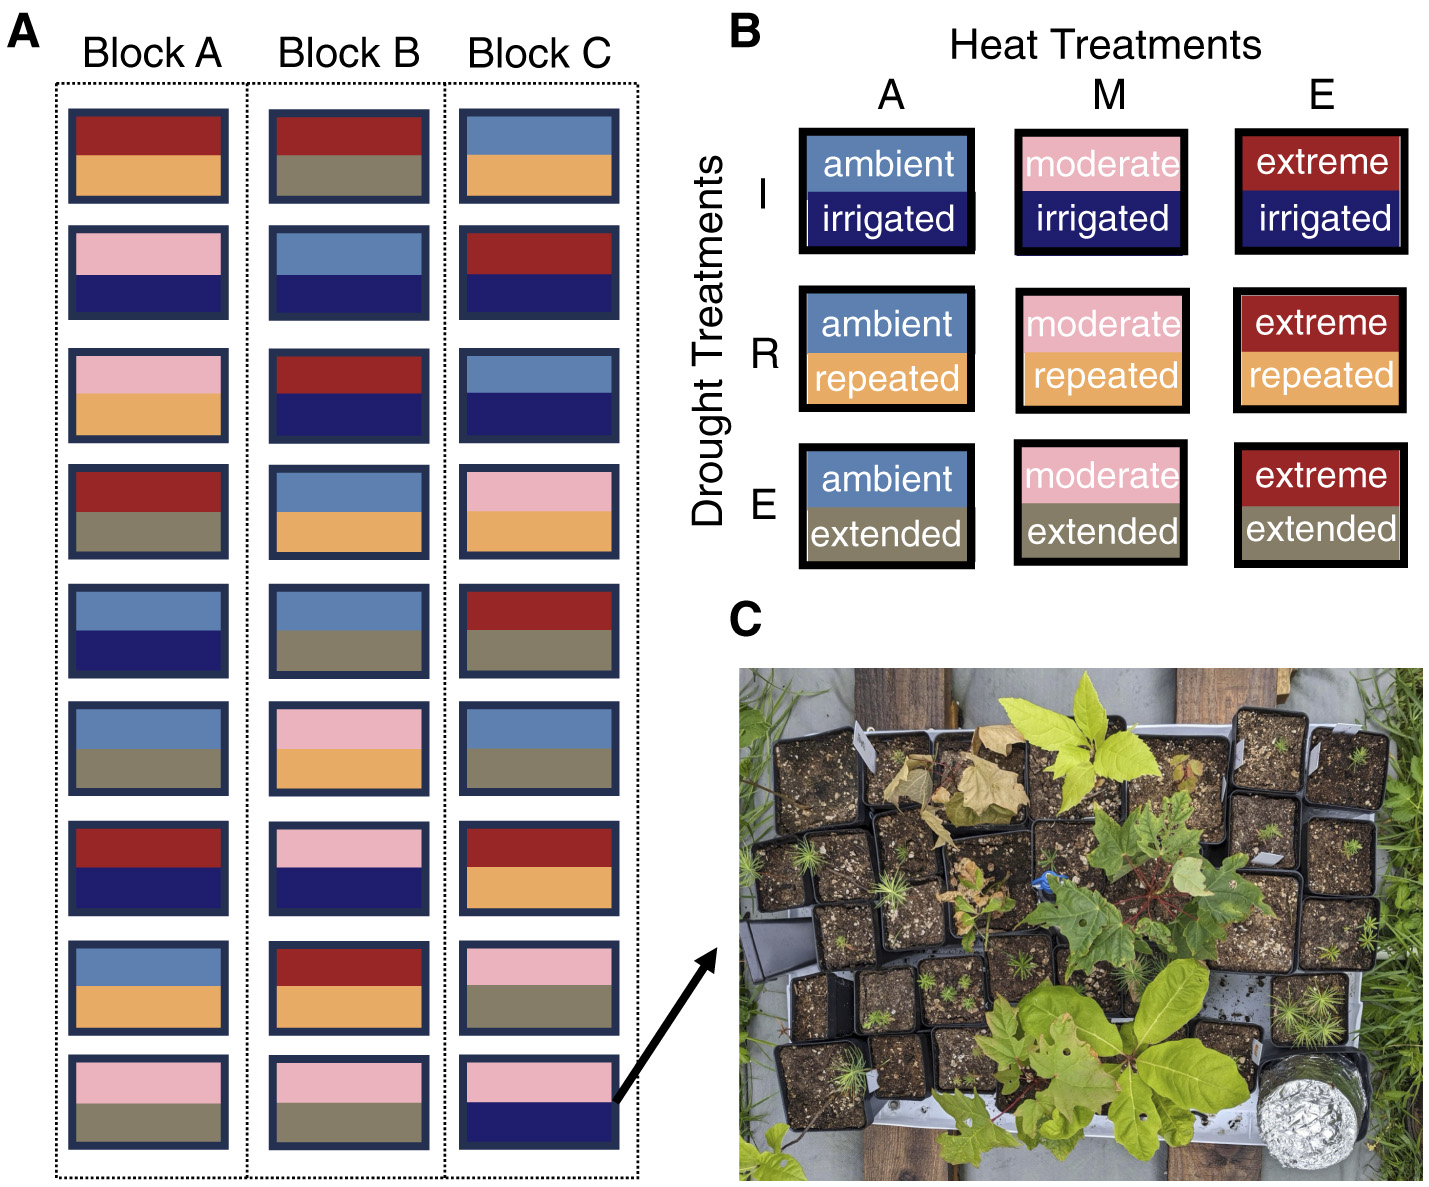
Organization of 27 treatment chambers into three blocks (A), all possible combinations of the three heat treatments and three drought treatments (B), and an example of seedling layout for one treatment chamber with the chamber top removed (C). Chamber tops shown in Supplementary Figure 2. Heat treatment abbreviations: A, ambient; M, moderate; E, extreme. Drought treatment abbreviations: I, irrigated; R, repeated; E, extended.
Heat and drought treatments
Treatment timeline
All seedlings (except red maple that were added on DOT 13; Supplementary Table 4) were placed in chambers on DOT 0 (onset of experimentation) and remained in chambers until the end of September (DOT 97–106). Once in chambers, all seedlings were fully irrigated until DOT 13. Extreme warming began on DOT 12 and continued through DOT 90, but due to electrical issues, was intermittent until DOT 26. Drought treatments were applied from DOT 13 to DOT 49.
Heat treatments
The chambers used for the ambient temperature treatment had large, rectangular (645-cm2 on the longer sides and 338-cm2 on the shorter sides) ventilation holes cut into all four sides of the chamber to limit heat and moisture buildup (Supplementary Figure 2). We used the chamber plastic in the upper 5-cm of each ventilation hole as an angled overhang to help exclude precipitation. Chambers used for the moderate heat and extreme heat treatments had smaller (37-cm by 0.5-cm) ventilation slits on two sides, but each extreme heat chamber also had a heat mat (Heat Mat and Heat Mat Temperature Controller, Vivosun, Ontario Canada) underneath the chamber that turned on if air temperature in the chamber dropped below 37 °C. Heat mats were used to increase air temperatures by elevating all seedlings approximately 5cm above the heat mats on a plastic platform with air holes. To partially reduce insolation, all chambers were wrapped in 30% polyethylene shade cloth (Green-Tek, Wisconsin USA), with two layers on the top of each chamber (Supplementary Figure 2).
Drought treatments
To apply drought treatments, the irrigated chambers were watered to saturation (1 h) every 2–3 days, the extended drought chambers received half of the amount of water as the irrigated chambers every 2–3 days (limited to 20 min of water 1 day a week on DOT 22 and unirrigated after DOT 38), and the repeated drought chambers experienced no watering for the duration of drought treatments (DOT 13–29 and DOT 30–49). Repeated drought chambers were watered to saturation on DOT 29 before the drought was repeated. Extended drought chambers received one third of saturation-level irrigation on DOT 30 in addition to their 1 day of water for the week.
The drought treatments were designed to include two short and intense droughts (the Repeated treatment) and a more gradual and prolonged drought (the Extended treatment). We adjusted the watering to achieve these outcomes based on continuously monitored substrate moisture data.
Chamber temperature and humidity
Unfortunately, we are unable to report temperature and humidity data due to data loss after three days of data collection. However, we reconstructed one of each warming chamber type the following summer and recorded hourly temperature and relative humidity for 31 days in July and August to better understand how environmental conditions varied among treatments without seedlings in the chambers (HOBO MX2302A External Temperature/RH Sensor Data Logger, Onset, Bourne, MA). We found that, compared to the ambient chamber, average daily temperature was 3.0 ±1.6 °C (mean ±2 standard deviations) warmer in the moderate heat chamber and 7.7 ±1.8 °C warmer in the extreme heat chamber. Average daily vapor pressure deficit was 0.9 ±0.7 and 1.8 ±0.9 kPa higher in moderate and extreme heat chambers, respectively, than in ambient chambers (Supplementary Figure 3).
Substrate moisture
To quantify the effect of the drought treatments on water availability, one individual per species per chamber was weighed in its pot twice a week to approximate changes in substrate moisture. Mass was converted to approximate substrate moisture based on earlier measurements of the dry mass of the corresponding container size filled with media. To estimate substrate moisture, we subtracted dry mass from current mass and divided the difference by substrate volume.
Survival and growth
To assess the effects of heat and drought treatments on growth and survival, we measured the height (length of stem) at the start of heat treatments (DOT 0) and the end of the season (EOS; DOT 90–92). Survival (live or dead; based on the presence of any green foliage) was measured on those dates and twice more during the drought treatments to capture progressive declines (DOT 36 and 53). We also quantified the final biomass for 417 living seedlings from blocks A and B after EOS height and vigor assessments. To obtain biomass, seedlings were carefully removed from containers, roots were rinsed in water, and all living tissue was placed in paper envelopes and dried at 70 °C for a minimum of 1 week. Roots, stems, and live leaves were measured separately.
Water relations
To better understand the extent to which drought treatments may have caused drought stress, we measured midday (between 11:00 and 14:00) leaf water potential (Ψleaf) twice. Although we were limited in our ability to sample for water potential by the number of sensors and limiting destructive measurements on seedlings, we were able to conduct a total of four sampling rounds across two different time periods. We first sampled partway through the drought on DOT 27 and 28 to determine how extended drought differed from irrigated (ambient temperature) and how repeated drought differed from irrigated (extreme heat). At the end of the drought on DOT 48 and 49, we then sampled two more times to assess how extended drought differed from irrigated (ambient temperature) and how extreme heat differed from ambient heat (extended drought). We used thermocouple psychrometers calibrated using sodium chloride solutions of known water potentials (TCP; JRD Merrill Specialty Equipment, Logan, UT, USA) to estimate Ψleaf. Due to a limited number of TCP chambers for estimating Ψleaf, we could only sample one individual per species from each of four treatment chambers, divided evenly among two treatment combinations each day.
To measure Ψleaf, we followed the protocol outlined in Barry et al. (2024). Briefly, we collected two to four needles (depending on their size) per northern conifer species and one leaf disc per temperate broadleaf species for each seedling and immediately placed them in a TCP chamber and stored them in a cooler for the duration of sampling. Red maple seedlings were not large enough to be sampled on DOT 27 and 28. TCP chambers were transported to the lab after sample collection, connected to a datalogger, placed in a temperature-controlled water bath, and allowed to equilibrate for at least 6 h. Once measurements were stable, a minimum of three values were averaged to obtain Ψleaf.
Species-level traits
To explore potential species-level traits, we estimated the leaf minimum epidermal conductance (gmin), leaf turgor loss point (TLP), and leaf mass-per-area (LMA) in late August (DOT 67, 65, 67 respectively) for all species. To determine gmin, we followed the protocol outlined in Sack and Scoffoni (2010). Seedlings were watered to saturation and covered in a black bag for at least 1 h to stop transpiration and achieve full turgor before sampling one leaf (temperate broadleaves) or whole shoot (1.1–5 cm; northern conifers) from six individuals of each species taken from three ambient × irrigated chambers and three ambient × extended drought chambers. Cut ends of samples were sealed with petroleum jelly, and samples were hung in a dark box with constant air circulation, and weighed at regular intervals (Barry et al., 2024). Temperature and relative humidity were monitored and recorded throughout the dry downs (HOBO MX2302A External Temperature/RH Sensor Data Logger, Onset, Bourne, MA). Each sample was weighed a minimum of five times, and gmin was calculated using the gmin Analysis Spreadsheet Tool from the slope of the dry-down curve (Sack, 2010).
To estimate the leaf-mass-per-area (LMA), we used the same leaf samples used in the gmin analyses. All leaves from temperate broadleaf species were scanned (Epson V600 Photo Scanner model B11B198011) before and after gmin measurements. For northern conifer species, we stripped the needles from each shoot and scanned them after gmin measurements. We calculated the area of leaves and needles using ImageJ (Schindelin et al., 2012). We then used the oven-dry mass (dried at 70 °C > 48 h) to calculate the LMA of each sample, using the formula: LMA = dry leaf mass/leaf area.
To estimate TLP, we followed the rapid osmometer method (Bartlett et al., 2012), substituting the osmometer with TCPs (Barry et al., 2024). We sampled eight individuals per species, two from each of four treatment chambers (two ambient × irrigated chambers and two ambient × extended drought chambers). Seedlings were watered to saturation and covered in a black bag for at least 1 h to stop transpiration and achieve full turgor. A leaf disc was collected from each temperate broadleaf, and 3–5 needles were removed from each northern conifer. Samples were wrapped in aluminum foil, flash frozen in liquid nitrogen for 2 min, removed from the foil, and placed in a TCP chamber. Once all samples were in TCP chambers, the same protocol described for Ψleaf was followed to estimate osmotic potential at full turgor. We then applied the established regression equation from Bartlett et al. (2012) to predict turgor loss point from the estimates of osmotic potential at full turgor.
Statistical analyses
To analyze substrate moisture, we modeled approximate substrate moisture as a response in a linear mixed effects model using the lowest observed substrate moisture for each given container throughout the study. Our initial model included fixed effects for species, heat treatment, and drought treatment, all possible interactions, and chamber as a random effect. If the three-way interaction was significant, we followed up with separate models for each species testing for effects of heat, drought, and their interaction. If the three-way interaction was not significant, it was removed, and we further reduced model complexity by progressively removing non-significant two-way interactions and rerunning the model each time until the final model included only significant interactions (if any) and all three predictors as main effects.
To quantify differences in Ψleaf, we calculated one average Ψleaf for each species and treatment combination on a given sampling day. Then, we used those values to calculate the difference in Ψleaf between our control treatment and test treatment on a given day (ΔWPleaf) and ran one sample t-tests on each comparison.
To determine the effects of species, heat, and drought on seedling survival, we modeled EOS survival as a binomial response variable in a generalized linear mixed effects model using the same model selection process described for substrate moisture.
To determine the effects of species, heat, and drought on growth, we estimated growth as absolute EOS height, relative height growth (relative to start-of-treatment height), total biomass, and root:shoot biomass ratio (root:shoot). We used each of these growth metrics as response variables in linear mixed effects models using the same predictors and selection process described for substrate moisture, above. After fitting models, we checked model assumptions including normality of residuals and Q-Q plots. These tests lead us to log-transform absolute EOS height, total biomass, and root:shoot before rerunning the model reduction process.
In all mixed-effects models, we included a random intercept for chamber to account for variation in sample size. To test for pairwise comparisons for significant main effects or interactions in all models, we conducted post-hoc pairwise comparisons of estimated marginal means, applying a Sidak adjustment to account for multiple comparisons (Šidák, 1967). Compact letter displays were used to group treatments with statistically similar means, with different letters indicating significant differences. For all models, we tested if the repotting of some individuals (Supplementary Table 5) impacted the results by rerunning the model selection process excluding individuals that were repotted. We found that our results and conclusions were not impacted by the repotting and we report only the combined results here. Additionally, we tested if the inclusion of multiply-sown seedlings (13% of total individuals used in survival, height, and biomass analyses) impacted results and found that our conclusions were not impacted if these individuals were removed.
To determine how species traits may drive patterns in survival, we tested how species mean gmin, LMA, and root:shoot each separately predict species mean survival (across all treatments) using linear regressions. We also tested for correlations among traits using Pearson correlation coefficients to investigate the relationship between gmin, LMA, and root:shoot. To analyze TLP, we tested for differences in TLP by species and drought treatment.
All analyses were run in R using RStudio (ver. 4.4.1, R Core Team, 2024) and using packages “stats,” “lme4,” “car,” “emmeans,” and “multcomp” (Bates et al., 2015; Fox et al., 2024; Hothorn et al., 2008; Lenth et al., 2025; R Core Team, 2024).
Results
Heat and drought treatments
We found no significant interactions in our models of minimum substrate moisture. Drought treatments significantly reduced minimum substrate moisture (p-value < 0.001), with the repeated drought experiencing two successive declines in substrate moisture and the extended drought experiencing one gradual decline (Figures 2A–C). However, minimum substrate moisture did not differ significantly between repeated and extended drought treatments (p = 0.992) nor among heat treatments (p = 0.213), though the chambers experiencing extreme warming and the extended drought reached the lowest recorded substrate moisture (Figure 2C). We found that during three of our sampling events for Ψleaf, the Ψleaf of drought treated plants was not significantly lower than controls. However, near the end of the drought treatments we did find that, on average, seedlings experiencing extreme heat and extended drought had Ψleaf 1.1 MPa lower than seedlings experiencing ambient heat and extended drought (p-value = 0.003; Table 2).
Figure 2
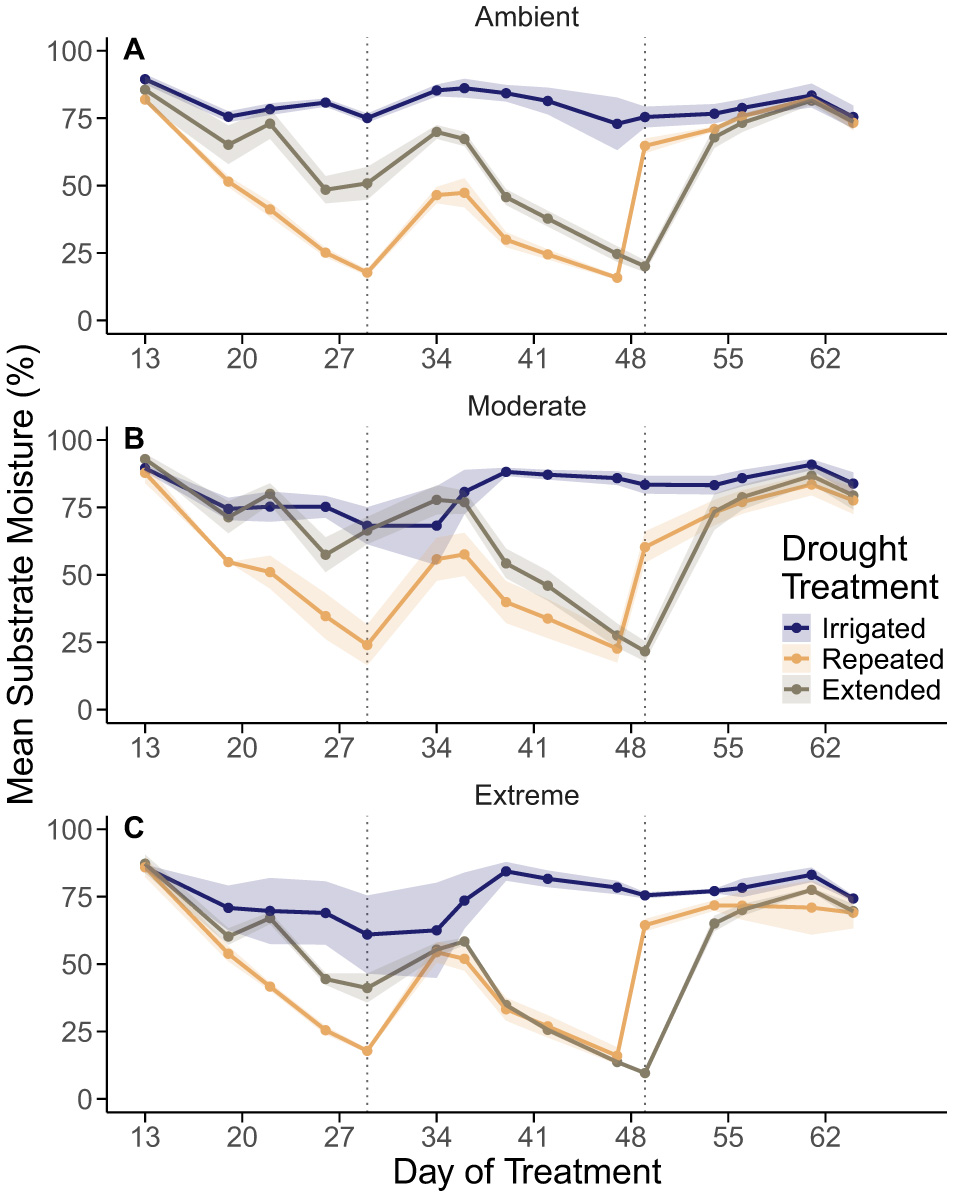
Approximate substrate moisture (%) for ambient (A), moderate heat (B), and extreme heat (C) chambers. Within each panel, irrigated treatments are represented with a blue line, repeated drought treatments with an orange line, and extended drought treatments with a brown line. Values of approximate substrate moisture were averaged by chamber for a given day then by treatment combination and day. Shaded regions represent ± one standard error of the mean. Points represent days pots were weighed, labeled as day of treatment on the x-axis (DOT; see Supplementary Table 4). Vertical lines represent days seedlings were irrigated at the end of the two drought periods (DOT 29 and DOT 49 ± 2–3 days). The rightmost datapoint corresponds to DOT 64, when we ceased weighing containers.
Table 2
| DOT | Group 1 | Group 2 | ΔWP | p-value |
|---|---|---|---|---|
| 27, 28 | Ambient × extended (2) | Ambient × irrigated (1) | −0.20 (0.16) | 0.124 |
| 27, 28 | Extreme × repeated (5) | Extreme × irrigated (5) | −0.34 (0.23) | 0.093 |
| 48 | Ambient × extended (1) | Ambient × irrigated (0) | −0.40 (0.38) | 0.167 |
| 49 | Extreme × extended (4) | Ambient × extended (0) | −1.07 (0.27) | 0.003 |
Day of water potential sampling (day of treatment; DOT); treatments sampled that day with the number of species for which species-level average water potential fell below cross-species average turgor loss point (−1.47; 95% CI = −1.57 to −1.36) in parentheses; cross-species average difference in water potential (ΔWP; group 1–group 2) with standard error in parentheses; and the p-value from a one-sample t-test used to determine if ΔWP was, on average, below 0.
Survival
We found that overall, survival declined most in response to combined heat and drought (final model included a drought × heat interaction; p-value = 0.038; Figure 3; Supplementary Table 6). However, survival also differed by species (final model included a species main effect; p-value < 0.001). Two northern conifers, red spruce (Figure 4A) and balsam fir (Figure 4B), had the lowest survival and were most impacted by combined heat and drought treatments. In contrast, two temperate broadleaf species, black ash (Figure 4G) and red oak (Figure 4H), had the highest survival and were not impacted by combined heat and drought treatments. The remaining species (Figures 4C–F) demonstrated intermediate reductions in survival to combined heat and drought.
Figure 3
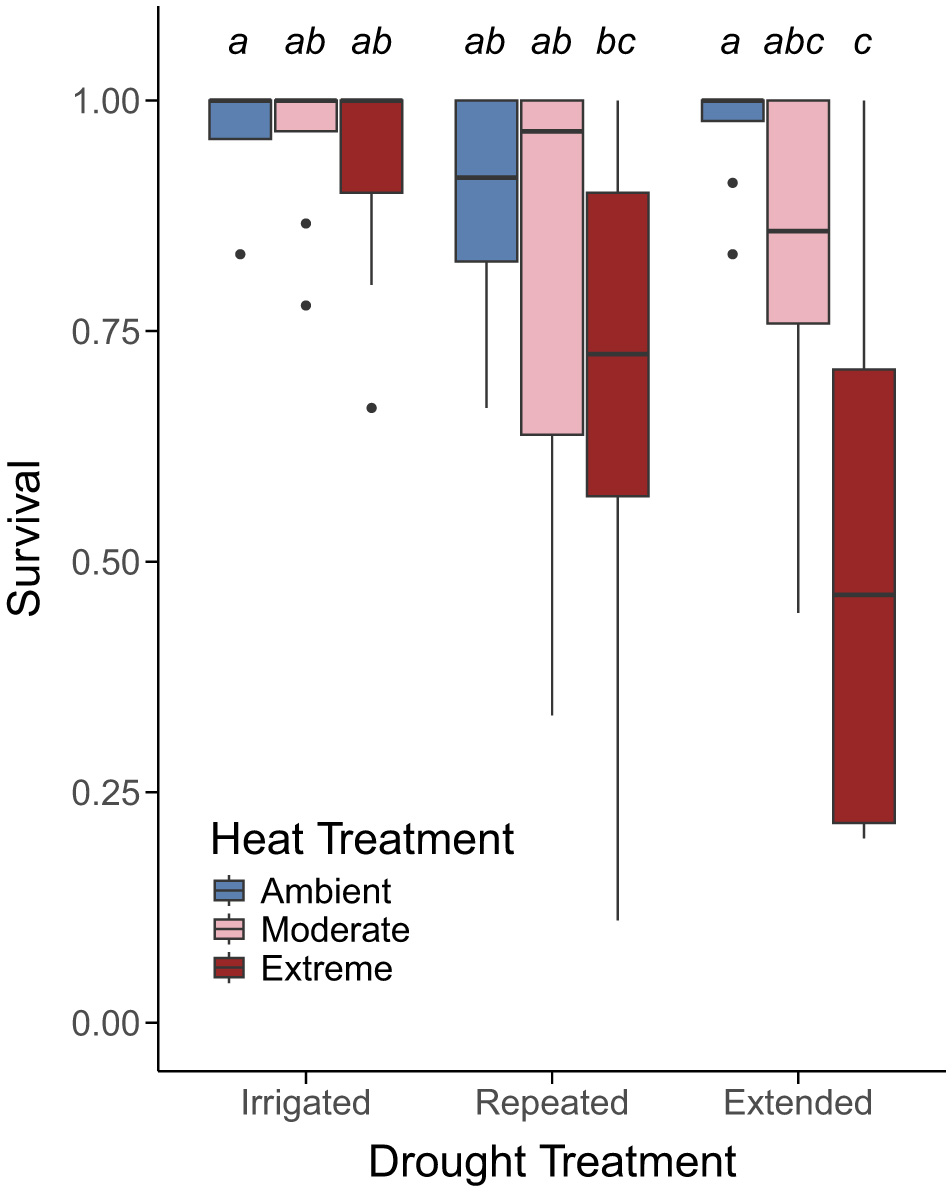
Survival (as a proportion of living individuals) within a chamber averaged across all species and treatment combinations. Boxes represent the middle 50% of data and the horizontal line represents the median survival within a treatment combination. Whiskers extend to 1.5 × the interquartile range and any data points beyond that range are represented as separate dots. Annotations above bars indicate significant differences in survival among treatment combinations from a Sidak post-hoc test if boxes do not share a letter. Sample size for each species is as follows: red spruce (n = 66), balsam fir (n = 136), eastern white pine (n = 171), northern white cedar (n = 179), red maple (n = 56), sugar maple (n = 64), black ash (n = 47), and red oak (n = 67).
Figure 4
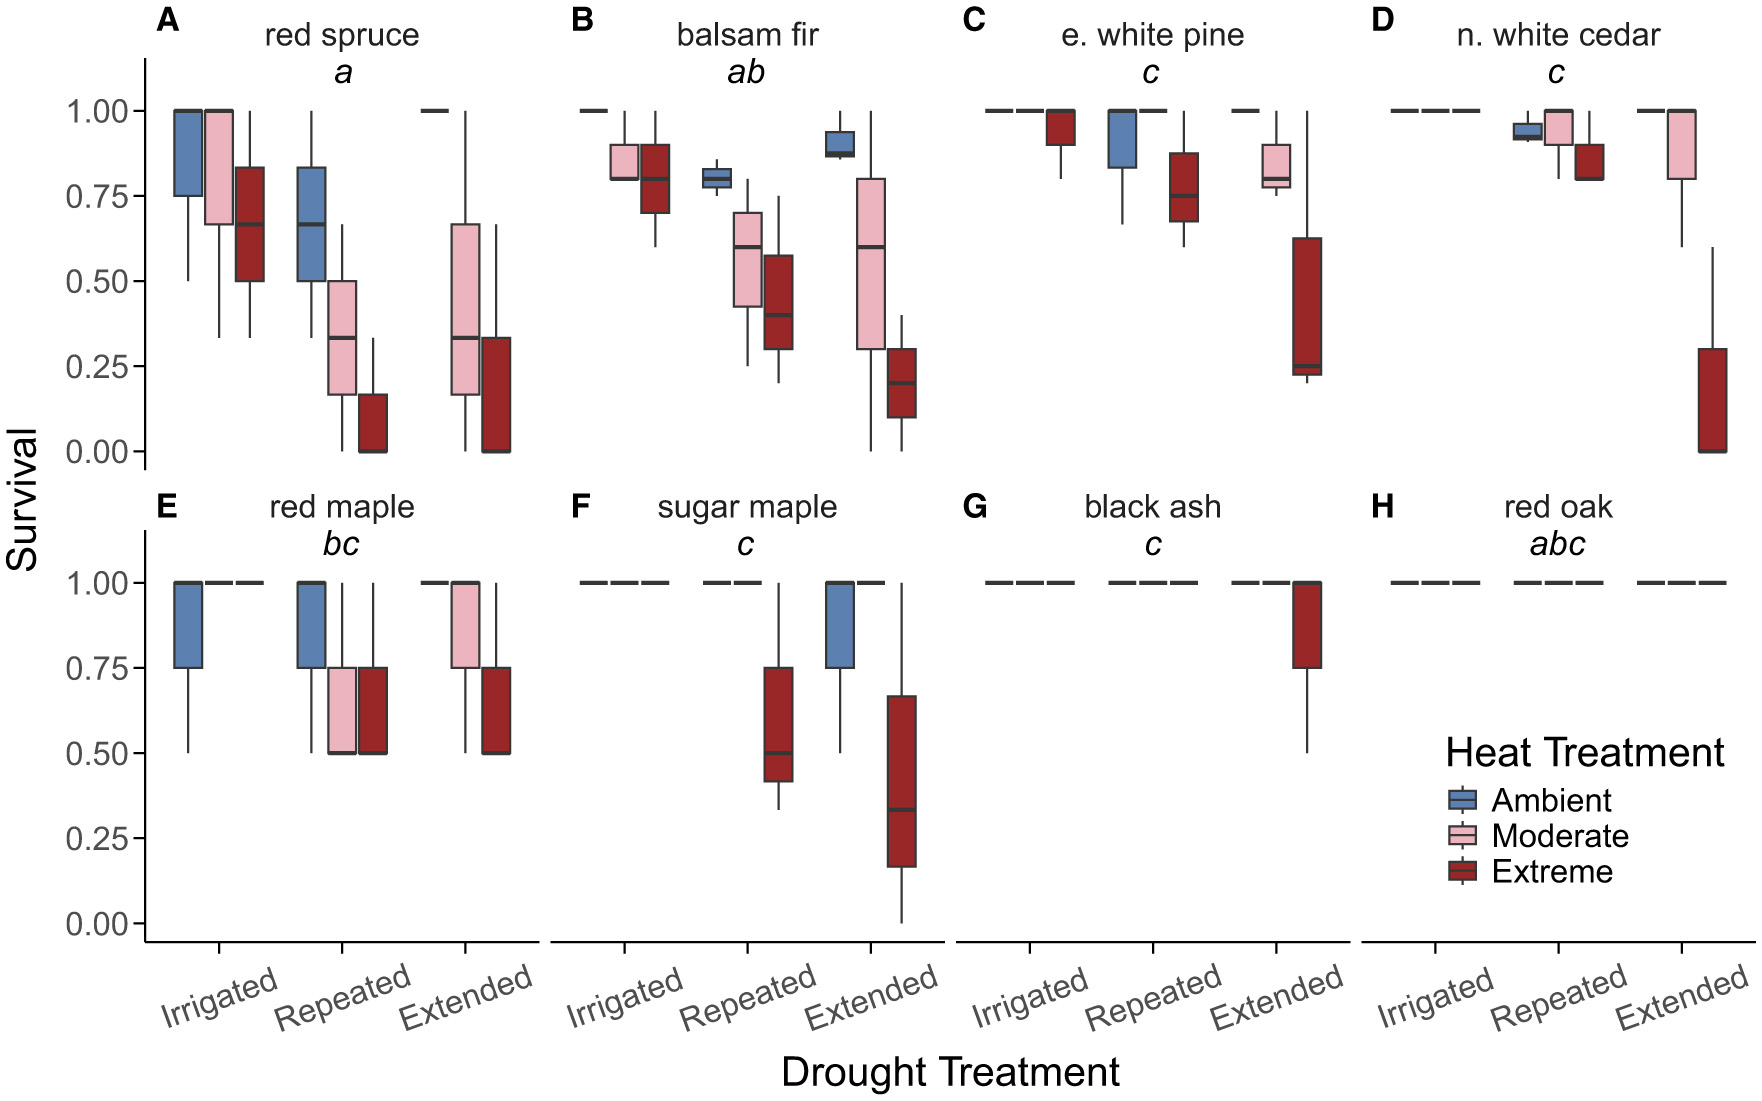
Survival (as a proportion of living individuals) within a chamber at the end of the growing season for each species: (A) red spruce (Picea rubens) (B) balsam fir (Abies balsamea) (C) eastern white pine (Pinus strobus) (D) northern white cedar (Thuja occidentalis) (E) red maple (Acer rubrum) (F) sugar maple (Acer saccharum) (G) black ash (Fraxinus nigra) (H) red oak (Quercus rubra). Boxes represent the middle 50% of data and the horizontal line represents the median survival within a treatment combination. Whiskers extend to 1.5 × the interquartile range and any data points beyond that range are represented as separate dots. Annotations at the top of each panel indicate significant differences in survival among species from a Sidak post-hoc test if boxes do not share a letter. Sample size for each species is as follows: red spruce (n = 66), balsam fir (n = 136), eastern white pine (n = 171), northern white cedar (n = 179), red maple (n = 56), sugar maple (n = 64), black ash (n = 47), and red oak (n = 67).
Height
EOS height was not impacted by drought (p = 0.261) or heat (p = 0.256), but the final model did include a significant effect of species (p < 0.001; Supplementary Table 6). Our initial model of EOS height included a significant interaction between species and drought treatment (p = 0.027). Despite the interaction, pairwise comparisons showed no differences among drought treatments for any species, suggesting that this interaction was minor and instead that species was the major factor determining EOS height (Supplementary Figure 4). Therefore, we removed this interaction and used an additive model. Generally, we found that all northern conifers were shorter than all temperate broadleaves (Figure 5A), and results from our model of relative height growth over the treatment period found only a significant effect of species (p < 0.001). Red maple and northern white cedar had the highest relative height growth, whereas red spruce had intermediate relative height growth, and all other species had low relative height growth over the course of our treatments (Figure 5B).
Figure 5
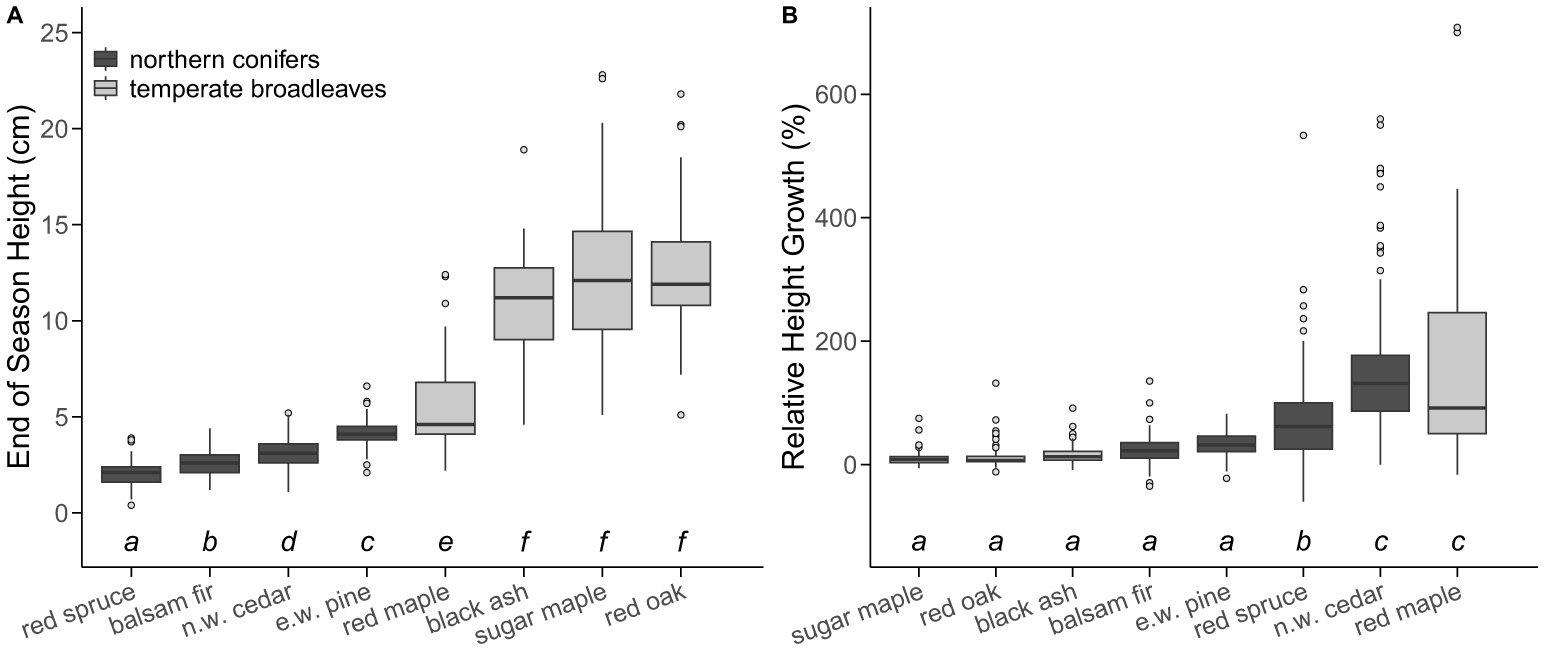
Absolute end-of-season (EOS) height [cm; (A)] and relative height growth as a percentage of height at the start of the treatments [%; (B)] of all seedlings by individuals for each of our study species. Species are ranked from lowest EOS height or lowest relative height growth (left) to highest EOS height or highest relative height growth (right). Boxes represent the middle 50% of data and the horizontal line represents the median height or height growth for each species. Whiskers extend to 1.5 × the interquartile range and any data points beyond that range are represented as separate dots. Annotations below bars indicate significant differences in height and height growth among species from a Sidak post-hoc test if boxes do not share a letter. Letters shown in (A) are independent from those shown in (B). Sample size for each species is as follows: red spruce (n = 65), balsam fir (n = 136), eastern white pine (n = 171), northern white cedar (n = 178), red maple (n = 56), sugar maple (n = 63), black ash (n = 46), and red oak (n = 65).
Biomass
The final model for total biomass included a significant interaction between species and drought treatment (p = 0.02; Supplementary Table 6). However, pairwise comparisons revealed only one minor difference among treatments for one species (Supplementary Figure 5). Therefore, we removed this interaction and the only remaining predictor for total biomass was species (p < 0.001). Generally, northern conifers had lower total biomass than temperate broadleaves, with red spruce having the lowest total biomass and red oak having the highest total biomass (Figure 6A). Similarly, the final model for root:shoot included no interactions (Supplementary Figure 6) and only a significant effect of species (p < 0.001). Differences in root:shoot were less pronounced, but we generally found that northern conifers had lower root:shoot than temperate broadleaf species (Figure 6B).
Figure 6
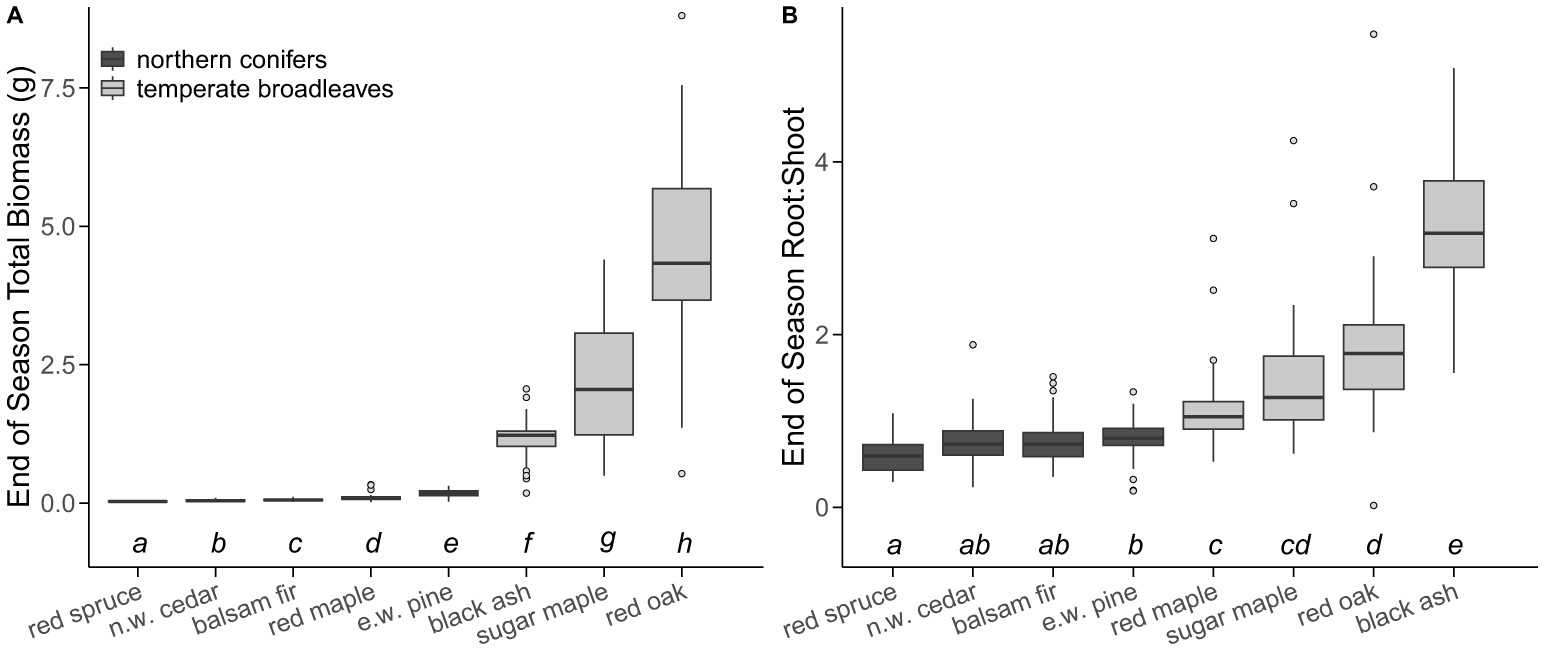
Total end-of-season seedling biomass [(A); g] and end-of-season root:shoot (B) for 417 individuals ranked from lowest total biomass or lowest root:shoot (left) to highest total biomass or highest root:shoot (right). Boxes represent the middle 50% of data and the horizontal line represents the median survival within a chamber. Whiskers extend to 1.5 × the interquartile range and any data points beyond that range are represented as separate dots. Annotations below bars indicate significant differences in biomass and root:shoot among species from a Sidak post-hoc test if boxes do not share a letter. Letters shown in (A) are independent from those shown in (B). Sample size for each species is as follows: red spruce (n = 30), balsam fir (n = 62), eastern white pine (n = 93), northern white cedar (n = 100), red maple (n = 27), sugar maple (n = 38), black ash (n = 29), and red oak (n = 38).
Water relations and species-level traits
Although we found general patterns separating northern conifers and temperate broadleaf species in regard to survival and growth, we found that LMA (Figure 7A; p-value = 0.08), gmin (Figure 7B; p-value = 0.26), and root:shoot (Figure 7C; p-value = 0.09) were not linearly related to species-level survival. Although there were not consistent linear relationships, we did find that the two species with the lowest survival (balsam fir and red spruce) had the largest LMA and lowest root:shoot. We also found that the two species with the highest survival (red oak and black ash) had the highest root:shoot (Table 3). We did not find correlations between LMA and gmin (p-value = 0.46), LMA and root:shoot (p-value = 0.07), or gmin and root:shoot (p-value = 0.90). We found no differences in TLP by species or treatment combination, leading us to average all values to obtain one TLP for all species. However, we did find that midday Ψleaf of seedlings occasionally exceeded (was lower than) the mean TLP (−1.47 ± 0.052 MPa), particularly in the extreme heat treatments that were also experiencing a drought (Supplementary Figures 7A, D).
Figure 7

Species-level average survival as a function of species-level average LMA (A), gmin(B), and root:shoot (C). Error bars represent one standard error ± the mean. Standard error is not shown for survival, as values ranged from 0 to 0.061 and were not visible on the plot.
Table 3
| Species | LMA (g/m2) | gmin (mmol m−2s−1) | root:shoot |
|---|---|---|---|
| Red spruce (Picea rubens) | a 97.34 (4.65) | b 6.93 (0.69) | d 0.61 (0.04) |
| Balsam fir (Abies balsamea) | a 97.34 (4.65) | b 5.27 (0.48) | d 0.76 (0.04) |
| E. white pine (Pinus strobus) | b 77.30 (3.92) | d 2.04 (0.14) | c 0.80 (0.02) |
| N. white cedar (Thuja occidentalis) | b 77.30 (3.92) | cd 5.12 (0.42) | bc 0.72 (0.03) |
| Red maple (Acer rubrum) | b 77.30 (3.92) | a 8.21 (0.59) | a 1.17 (0.12) |
| Sugar maple (Acer saccharum) | c 58.85 (1.63) | c 4.25 (0.24) | b 1.44 (0.10) |
| Black ask (Fraxinus nigra) | c 58.85 (1.63) | a 6.20 (1.48) | a 3.32 (0.17) |
| Red oak (Quercus rubra) | c 58.85 (1.63) | cd 2.98 (0.52) | bc 1.91 (0.18) |
Species-level average leaf-mass-per-area (LMA), minimum epidermal conductance (gmin), and root-to-shoot biomass ratio (root:shoot) ± one standard error in parentheses.
Superscript compact letter displays from a Tukey post-hoc test are shown to compare values within a column. For each value of LMA and gmin, n = 6. For root:shoot, n = 27–100 depending on species.
Discussion
Our study revealed how extreme environmental conditions can reduce the survival of first-year seedlings native to the northeastern USA. We found that northern conifers at the southern edge of their range margin, red spruce and balsam fir, have overall lower survival than other conifers and temperate broadleaf species. Furthermore, survival of northern conifers responded more negatively to extreme conditions (heat and drought) than other species. The species with the highest survival had the highest root-to-shoot biomass ratio, suggesting this may be a critical factor for seedling survival in extreme conditions. Despite impacts to survival, for seedlings that survived the treatments, heat and drought did not cause reductions in height or biomass growth in this first year. These data expand our understanding of the sensitivity of first-year seedlings to extreme climate conditions and suggest that combined extremes may dramatically impact regeneration in the regional temperate-boreal ecotone.
Survival was reduced for most species in response to heat and drought
Overall, we found that survival responded strongly to the treatments, particularly the extreme heat treatment combined with either the repeated or extended drought. This reduction in survival was strongest for the northern conifer species red spruce and balsam fir. Although many other studies have highlighted the importance of moisture for the persistence of red spruce and balsam fir (Collier et al., 2022; Greenwood et al., 2008; Roberts and Cannon, 1992), these were the only two species in our study to also experience substantial declines in survival in response to heat alone. Though, the temperatures in the extreme heat treatment were likely greater than current and projected future temperatures in these species' ranges and therefore more representative of potential future extreme heat waves. These results confirm a growing understanding that these species and other species are vulnerable to changes in climate, particularly at their southern range margins, and provide new context into how these climate changes may interact to impact forest regeneration (Canham and Murphy, 2017; Vaughn et al., 2021).
Generally, when combined with heat, the extended drought treatment led to greater reductions in survival than the repeated drought treatment. Despite only finding significantly low water potential for seedlings in the extreme heat and extended drought treatment, we suspect that at the observed substrate moisture values, very minor changes in moisture did not capture the known large differences in water potential that can occur (van Kampen et al., 2022). However, low survival in the combined heat and extended drought treatments provide indirect evidence that the seedlings in this treatment experienced physiological stress. These results are further supported by the overall lower minimum substrate moisture in the extreme heat and extended drought treatment. Collectively, these results point to the importance of hydraulic stress dictating survival and the strong degree to which this depends upon both soil moisture and atmospheric dryness (vapor pressure deficit) that generally increases with warming (Berry and Smith, 2013; Day, 2000; Grossiord et al., 2020), and future first-year seedling studies may consider including more repeated measurements of hydraulic stress during drought treatments. Indeed, the small size of seedlings and small root systems may reduce their ability to buffer changes in water potential from rapidly changing environmental conditions (Scholz et al., 2011), leading to catastrophic hydraulic failure and mortality.
Growth of surviving seedlings did not decline in response to heat and drought
Although treatments strongly impacted survival, we found no effect of any treatment on height or biomass growth of seedlings in this first year. This lack of response may be attributed to the timing of heat and drought stress. For example, the timing of the heat treatments occurred after most of these species had completed much of their height growth (i.e., relative height growth during treatment period near zero; Schulz et al., 2024; van Kampen et al., 2022). Further, studies that expose first-year seedlings to heat and altered precipitation throughout the growing season note increased growth, particularly for temperate broadleaves, under warmed conditions and regardless of precipitation regime (Fisichelli et al., 2014). Net photosynthesis has been used to explain increases in growth under experimental warming, as warming increases photosynthesis of temperate broadleaves and, to a lesser extent, northern conifers when soils are moist (Reich et al., 2018). However, the temperatures experienced in our chambers were likely regularly above temperature optima for photosynthesis (Cheesman and Winter, 2013; Gagne et al., 2020; Sendall et al., 2015). Furthermore, the warming may have increased vapor pressure deficit that, in extreme cases, can lead to hydraulic damage (Schönbeck et al., 2022) and mortality. However, for the seedlings that survived, stomatal closure to avoid hydraulic failure may still have reduced photosynthesis (Jalakas et al., 2021; Will et al., 2013). Therefore, growth reductions in response to warming may not be detectable until the following year due to reduced carbohydrate storage from reduced photosynthesis and increased respiration rates.
Drought has also been shown to profoundly impact tree growth in other studies, both in the drought year and following years (Barry et al., 2024; Kannenberg et al., 2019). However, like our results for heat, we did not find that drought impacted growth in the treatment year. The issue of drought timing may be particularly relevant here for similar reasons as for heat: stomatal closure reducing photosynthesis and carbohydrate storage (Woodruff et al., 2024; Zargar et al., 2017). However, drought can also reduce water potential in ways that directly reduce turgor-driven cell expansion (Hsiao, 1973). Because most species completed growth prior to the onset of drought stress, this may suggest that, for seedlings, timing growth in early spring when moisture is often abundant limits the likelihood that low water potentials reduce growth. Species with extended growth phenologies may exhibit reduced growth rates during early-season droughts and recover by increasing growth rates after droughts cease (van Kampen et al., 2022). Indeed, spring droughts have profound effects on current-year growth yet, to our knowledge, there are no studies that investigate the effects of how late-season droughts may drive reductions in growth the following year for small seedlings (for evidence of drought lagged effects in adult trees, see Bigler et al., 2007; Foster, 2014; Huang et al., 2018). Therefore, because both the timing of heat and the timing of drought impact seedling growth, future seedling survival in natural conditions will depend on the timing of future heat, drought, and combined heat and drought events, which are likely to disproportionately impact growth more than just heat or drought alone (Allen et al., 2010; Williams et al., 2012).
Species-level traits partly explain patterns in survival
Compared to the temperate broadleaves, we found that the northern conifers tended to have higher LMA, similar gmin and lower root-to-shoot biomass ratio. Despite the lack of linear correlations among traits in this study, these differences represent fundamental tradeoffs in leaf and plant structure and function that have been shown in other studies to relate to plant performance across a range of conditions (Maynard et al., 2022; Sastry et al., 2018; Wright et al., 2010). Unlike some studies, we did not find simple relationships among these traits and seedling survival. For example, gmin has emerged as a key trait of interest for plant desiccation tolerance yet did not explain survival in our study (Ziegler et al., 2024). This discrepancy may be related to the relatively small leaf area of these seedlings and their limited capacity to buffer moisture changes with hydraulic capacitance (Scholz et al., 2011). This is supported by our survival and growth results, which suggest a threshold-type response whereby if the seedling survives the stressful conditions, growth is not impacted this year. Our results support the findings of others that root:shoot is a key trait related to supply and demand of moisture that may be especially important at this early life stage, and higher and more variable in seedlings than in adult trees (Ledo et al., 2018; Poorter et al., 2012).
We expected TLP to vary more by species within our study. However, while TLP has been shown to vary by species in multiple environments (Álvarez-Cansino et al., 2022; Visakorpi et al., 2024), this is often related to plant distribution in environments where drought is common and does not always correlate to drought vulnerability (Farrell et al., 2017). The relatively mesic forests of eastern North America may not place a strong selective pressure on TLP, partially explaining the lack of variation among the species in this study. Furthermore, traits like TLP are not well studied in the first year of tree growth, and TLP may not actually vary strongly in first-year seedlings despite differences at later life stages (Beikircher et al., 2025). In addition, while some species may be able to acclimate TLP to future drought by adjusting the concentration of solutes in their cells and retaining water during dry periods (Bartlett et al., 2014), to our knowledge this phenomenon has not been studied in first-year tree seedlings.
Conclusions and implications
In addition to the extensive biotic and abiotic factors that contribute to very low seedling survival in the first year, our study demonstrates how heat, drought, and combined heat and drought events can have strong effects on first-year seedling survival. At the temperate boreal ecotone in northeastern North America, climate change and extreme conditions have the potential to cause a reduction in the survival of northerly distributed trees common to the region, which may facilitate a shift in species composition.
Specifically, the state of Maine, located at the southeastern extent of the temperate-boreal ecotone in North America, is projected to warm 1–5 °C by 2100, and drought is projected to become increasingly common (Fernandez et al., 2020). These elevated baseline temperatures and more variable precipitation patterns will likely increase the frequency of heat and drought stress. Due to the difficulty with associating specific temperatures to treatments in this study, future research that quantifies first-year survival reductions in trees native to this region is advantageous to our understanding of the severity of future compositional changes. Specific compositional changes, like projected loss of spruce-fir forests, could lead to the loss of this regionally unique habitat and the services it provides (Andrews et al., 2022; Davis, 1966; Pohjanmies et al., 2017). Because combined heat and drought events are more detrimental to first-year survival than either stressor alone, landscape-level decisions can be made to reduce the probability of overlap of these conditions. For example, the impact of droughts may be less likely to cause widespread mortality to seedlings in forest understories, where the microclimate can prevent excess heat during heatwaves (Finocchiaro et al., 2024; Redmond et al., 2018). Additionally, regeneration of seedlings or plantings in thinned or open conditions may have higher survival if moisture deficits can be avoided (Brodribb et al., 2020; Pozner et al., 2022; Qie et al., 2019).
Traits that maximize moisture supply and limit demand may be critical for first-year seedling survival in stressful conditions. However, studies documenting the anatomical and physiological development of first-year seedlings is lacking, and future opportunities include qualifying traits beyond those included in this study throughout the first growing season to understand their potential variation across species' ranges. Further, studying the interactions among genotype, seed provenance, and species-level traits may provide additional insights to how climate sensitive species will respond to future abiotic stress. Collectively, our results emphasize the critical importance of first-year survival of seedlings and provide new evidence that the impacts of combined heat and drought events may have profound impacts on tree regeneration at the temperate-boreal ecotone that may ultimately manifest as long-term shifts in species composition.
Statements
Data availability statement
The datasets presented in this study will be publicly available in the Dryad data repository (DOI: 10.5061/dryad.k3j9kd5ph).
Author contributions
EM: Formal analysis, Writing – review & editing, Methodology, Writing – original draft, Data curation, Conceptualization. MC: Writing – review & editing, Conceptualization. BP: Methodology, Conceptualization, Writing – review & editing. JW: Writing – original draft, Funding acquisition, Conceptualization, Formal analysis, Supervision, Methodology, Writing – review & editing.
Funding
The author(s) declared that financial support was received for this work and/or its publication. This work was supported by the United States Department of Agriculture's National Institute of Food and Agriculture under the Agriculture and Food Research Initiative (Grant Number 2023-67020-40089) to JW. This project is part of McIntire Stennis Project Number ME0-42121 administered through the Maine Agricultural and Forest Experiment Station.
Acknowledgments
The authors would like to thank Paige Cormier, Brigid Mrenna, Laura Pinover, Megan Grega, and Samuel Juntunen for assisting with data collection; Billy Kunelius, John Daigle, and John Butnor for seed donations; and William Halteman for statistical consultation.
Conflict of interest
The author(s) declared that this work was conducted in the absence of any commercial or financial relationships that could be construed as a potential conflict of interest.
Generative AI statement
The author(s) declared that generative AI was not used in the creation of this manuscript.
Any alternative text (alt text) provided alongside figures in this article has been generated by Frontiers with the support of artificial intelligence and reasonable efforts have been made to ensure accuracy, including review by the authors wherever possible. If you identify any issues, please contact us.
Publisher’s note
All claims expressed in this article are solely those of the authors and do not necessarily represent those of their affiliated organizations, or those of the publisher, the editors and the reviewers. Any product that may be evaluated in this article, or claim that may be made by its manufacturer, is not guaranteed or endorsed by the publisher.
Supplementary material
The Supplementary Material for this article can be found online at: https://www.frontiersin.org/articles/10.3389/ffgc.2025.1734405/full#supplementary-material
References
1
Adams H. D. Zeppel M. J. B. Anderegg W. R. L. Hartmann H. Landhäusser S. M. Tissue D. T. et al . (2017). A multi-species synthesis of physiological mechanisms in drought-induced tree mortality. Nat. Ecol. Evol. 1, 1285–1291. doi: 10.1038/s41559-017-0248-x
2
Allen C. D. Macalady A. K. Chenchouni H. Bachelet D. McDowell N. Vennetier M. et al . (2010). A global overview of drought and heat-induced tree mortality reveals emerging climate change risks for forests. For. Ecol. Manag. 259, 660–684. doi: 10.1016/j.foreco.2009.09.001
3
Álvarez-Cansino L. Comita L. S. Jones F. A. Manzané-Pinzón E. Browne L. Engelbrecht B. M. J. (2022). Turgor loss point predicts survival responses to experimental and natural drought in tropical tree seedlings. Ecology103:e3700. doi: 10.1002/ecy.3700
4
Anderegg W. R. L. Anderegg L. D. L. Kerr K. L. Trugman A. T. (2019). Widespread drought-induced tree mortality at dry range edges indicates that climate stress exceeds species' compensating mechanisms. Glob. Change Biol. 25, 3793–3802. doi: 10.1111/gcb.14771
5
Andrews C. Foster J. R. Weiskittel A. D'Amato A. W. Simons-Legaard E. (2022). Integrating historical observations alters projections of eastern North American spruce–fir habitat under climate change. Ecosphere13:e4016. doi: 10.1002/ecs2.4016
6
Balducci L. Deslauriers A. Giovannelli A. Beaulieu M. Delzon S. Rossi S. et al . (2015). How do drought and warming influence survival and wood traits of Picea mariana saplings?J. Exp. Bot. 66, 377–389. doi: 10.1093/jxb/eru431
7
Barry A. M. Bein B. Zhang Y. Wason J. W. (2024). Linking physiological drought resistance traits to growth and mortality of three northeastern tree species. Tree Physiol.44:tpae095. doi: 10.1093/treephys/tpae095
8
Bartlett M. K. Scoffoni C. Sack L. (2012). The determinants of leaf turgor loss point and prediction of drought tolerance of species and biomes: a global meta-analysis. Ecol. Lett. 15, 393–405. doi: 10.1111/j.1461-0248.2012.01751.x
9
Bartlett M. K. Zhang Y. Kreidler N. Sun S. Ardy R. Cao K. et al . (2014). Global analysis of plasticity in turgor loss point, a key drought tolerance trait. Ecol. Lett. 17, 1580–1590. doi: 10.1111/ele.12374
10
Bates D. Mächler M. Bolker B. Walker S. (2015). Fitting Linear Mixed-Effects Models Using lme4. J. Stat. Softw. 67, 1–48. doi: 10.18637/jss.v067.i01
11
Beikircher B. Held M. Losso A. Mayr S. (2025). New insights into a sensitive life stage: hydraulics of tree seedlings in their first growing season. New Phytol. 245, 577–590. doi: 10.1111/nph.20243
12
Berry Z. C. Smith W. K. (2013). Ecophysiological importance of cloud immersion in a relic spruce–fir forest at elevational limits, southern Appalachian Mountains, USA. Oecologia173, 637–648. doi: 10.1007/s00442-013-2653-4
13
Bigler C. Gavin D. G. Gunning C. Veblen T. T. (2007). Drought induces lagged tree mortality in a subalpine forest in the Rocky Mountains. Oikos116, 1983–1994. doi: 10.1111/j.2007.0030-1299.16034.x
14
Bonner F. T. Karrfalt R. P. (eds.). (2008). The Woody Plant Seed Manual. Agriculture Handbook No. 727. Washington, DC: U.S. Department of Agriculture, Forest Service. Available online at: https://research.fs.usda.gov/treesearch/32626 (Accessed May 23, 2025).
15
Boulanger Y. Taylor A. R. Price D. T. Cyr D. McGarrigle E. Rammer W. et al . (2017). Climate change impacts on forest landscapes along the Canadian southern boreal forest transition zone. Landsc. Ecol. 32, 1415–1431. doi: 10.1007/s10980-016-0421-7
16
Brodribb T. J. Powers J. Cochard H. Choat B. (2020). Hanging by a thread? Forests and drought. Science368, 261–266. doi: 10.1126/science.aat7631
17
Canham C. D. Murphy L. (2017). The demography of tree species response to climate: sapling and canopy tree survival. Ecosphere8:e01701. doi: 10.1002/ecs2.1701
18
Carón M. M. De Frenne P. Chabrerie O. Cousins S. A. O. De Backer L. Decocq G. et al . (2015). Impacts of warming and changes in precipitation frequency on the regeneration of two Acer species. Flora214, 24–33. doi: 10.1016/j.flora.2015.05.005
19
Cheesman A. W. Winter K. (2013). Growth response and acclimation of CO2 exchange characteristics to elevated temperatures in tropical tree seedlings. J. Exp. Bot. 64, 3817–3828. doi: 10.1093/jxb/ert211
20
Choat B. Brodribb T. J. Brodersen C. R. Duursma R. A. López R. Medlyn B. E. (2018). Triggers of tree mortality under drought. Nature558, 531–539. doi: 10.1038/s41586-018-0240-x
21
Collier J. MacLean D. A. D'Orangeville L. Taylor A. R. (2022). A review of climate change effects on the regeneration dynamics of balsam fir. For. Chron. 98, 54–65. doi: 10.5558/tfc2022-005
22
Crockett J. L. Hurteau M. D. (2024). Ability of seedlings to survive heat and drought portends future demographic challenges for five southwestern US conifers. Tree Physiol.44:tpad136. doi: 10.1093/treephys/tpad136
23
Davis R. B. (1966). Spruce-fir Forests of the coast of Maine. Ecol. Monogr. 36, 79–94. doi: 10.2307/1942150
24
Day M. E. (2000). Influence of temperature and leaf-to-air vapor pressure deficit on net photosynthesis and stomatal conductance in red spruce (Picea rubens). Tree Physiol. 20, 57–63. doi: 10.1093/treephys/20.1.57
25
De Steven D. (1991). Experiments on mechanisms of tree establishment in old-field succession: Seedling survival and growth. Ecology72, 1076–1088. doi: 10.2307/1940607
26
Duursma R. A. Blackman C. J. Lopéz R. Martin-StPaul N. K. Cochard H. Medlyn B. E. (2019). On the minimum leaf conductance: Its role in models of plant water use, and ecological and environmental controls. New Phytol. 221, 693–705. doi: 10.1111/nph.15395
27
Farrell C. Szota C. Arndt S. K. (2017). Does the turgor loss point characterize drought response in dryland plants?Plant Cell Environ. 40, 1500–1511. doi: 10.1111/pce.12948
28
Fernandez I. J. Birkel S. Simonson J. Lyon B. Pershing A. Stancioff E. et al . (2020). Maine's Climate Future: 2020 Update. Orono, ME: University of Maine.
29
Finocchiaro M. Médail F. Saatkamp A. Diadema K. Pavon D. Brousset L. et al . (2024). Microrefugia and microclimate: Unraveling decoupling potential and resistance to heatwaves. Sci. Total Environ. 924:171696. doi: 10.1016/j.scitotenv.2024.171696
30
Fisichelli N. Frelich L. E. Reich P. B. (2012). Sapling growth responses to warmer temperatures ‘cooled' by browse pressure. Glob. Change Biol. 18, 3455–3463. doi: 10.1111/j.1365-2486.2012.02785.x
31
Fisichelli N. Wright A. Rice K. Mau A. Buschena C. Reich P. B. (2014). First-year seedlings and climate change: Species-specific responses of 15 North American tree species. Oikos123, 1331–1340. doi: 10.1111/oik.01349
32
Fisichelli N. A. Frelich L. E. Reich P. B. (2013). Climate and interrelated tree regeneration drivers in mixed temperate–boreal forests. Landsc. Ecol. 28, 149–159. doi: 10.1007/s10980-012-9827-z
33
Forzieri G. Dakos V. McDowell N. G. Ramdane A. Cescatti A. (2022). Emerging signals of declining forest resilience under climate change. Nature608, 534–539. doi: 10.1038/s41586-022-04959-9
34
Foster T. E. (2014). Timing matters: The seasonal effect of drought on tree growth. J. Torrey Bot. Soc. 141, 225–241. doi: 10.3159/TORREY-D-13-00060.1
35
Fox J. Weisberg S. Price B. Adler D. Bates D. Baud-Bovy G. et al . (2024). Car: Companion to Applied Regression (R package). Available online at: https://cran.r-project.org/web/packages/car/index.html (Accessed May 12, 2025).
36
Frey B. R. Ashton M. S. McKenna J. J. Ellum D. Finkral A. (2007). Topographic and temporal patterns in tree seedling establishment, growth, and survival among masting species of southern New England mixed-deciduous forests. For. Ecol. Manag. 245, 54–63. doi: 10.1016/j.foreco.2007.03.069
37
Gagne M. A. Smith D. D. McCulloh K. A. (2020). Limited physiological acclimation to recurrent heatwaves in two boreal tree species. Tree Physiol. 40, 1680–1696. doi: 10.1093/treephys/tpaa102
38
Goldblum D. Rigg L. S. (2010). The deciduous forest – boreal forest ecotone. Geogr. Compass4, 701–717. doi: 10.1111/j.1749-8198.2010.00342.x
39
Greenwood M. S. O'Brien C. L. Schatz J. D. Diggins C. A. Day M. E. Jacobson G. L. et al . (2008). Is early life cycle success a determinant of the abundance of red spruce and balsam fir?Can. J. For. Res. 38, 2295–2305. doi: 10.1139/X08-072
40
Grossiord C. Buckley T. N. Cernusak L. A. Novick K. A. Poulter B. Siegwolf R. T. W. et al . (2020). Plant responses to rising vapor pressure deficit. New Phytol. 226, 1550–1566. doi: 10.1111/nph.16485
41
Hammond W. M. Williams A. P. Abatzoglou J. T. Adams H. D. Klein T. López R. et al . (2022). Global field observations of tree die-off reveal hotter-drought fingerprint for Earth's forests. Nat. Commun. 13:1761. doi: 10.1038/s41467-022-29289-2
42
Hammond W. M. Yu K. Wilson L. A. Will R. E. Anderegg W. R. L. Adams H. D. (2019). Dead or dying? Quantifying the point of no return from hydraulic failure in drought-induced tree mortality. New Phytol. 223, 1834–1843. doi: 10.1111/nph.15922
43
Hanbury-Brown A. R. Powell T. L. Muller-Landau H. C. Wright S. J. Kueppers L. M. (2022). Simulating environmentally-sensitive tree recruitment in vegetation demographic models. New Phytologist235, 78–93. doi: 10.1111/nph.18059
44
Hothorn T. Bretz F. Westfall P. (2008). Simultaneous inference in general parametric models. Biom. J. 50, 346–363. doi: 10.1002/bimj.200810425
45
Hsiao T. C. (1973). Plant Responses to Water Stress. Ann. Rev. of Plant Physiol. 24, 519–570. doi: 10.1146/annurev.pp.24.060173.002511
46
Huang M. Wang X. Keenan T. F. Piao S. (2018). Drought timing influences the legacy of tree growth recovery. Glob. Change Biol. 24, 3546–3559. doi: 10.1111/gcb.14294
47
Jalakas P. Takahashi Y. Waadt R. Schroeder J. I. Merilo E. (2021). Molecular mechanisms of stomatal closure in response to rising vapour pressure deficit. New Phytol. 232, 468–475. doi: 10.1111/nph.17592
48
Johnson D. M. Domec J.-C. Carter Berry Z. Schwantes A. M. McCulloh K. A. Woodruff D. R. et al . (2018). Co-occurring woody species have diverse hydraulic strategies and mortality rates during an extreme drought. Plant Cell Environ. 41, 576–588. doi: 10.1111/pce.13121
49
Johnson D. M. McCulloh K. A. Reinhardt K. (2011). “The earliest stages of tree growth: Development, physiology and impacts of microclimate,” in Size- and Age-Related Changes in Tree Structure and Function, eds. F. C. Meinzer, B. Lachenbruch, and T. E. Dawson (Dordrecht: Springer Netherlands) 65–87. doi: 10.1007/978-94-007-1242-3_3
50
Kannenberg S. A. Maxwell J. T. Pederson N. D'Orangeville L. Ficklin D. L. Phillips R. P. (2019). Drought legacies are dependent on water table depth, wood anatomy and drought timing across the eastern US. Ecol. Lett. 22, 119–127. doi: 10.1111/ele.13173
51
Kunert N. Hajek P. Hietz P. Morris H. Rosner S. Tholen D. (2022). Summer temperatures reach the thermal tolerance threshold of photosynthetic decline in temperate conifers. Plant Biology24, 1254–1261. doi: 10.1111/plb.13349
52
Lalor A. R. Law D. J. Breshears D. D. Falk D. A. Field J. P. Loehman R. A. et al . (2023). Mortality thresholds of juvenile trees to drought and heatwaves: implications for forest regeneration across a landscape gradient. Front. For. Glob. Change6:1198156. doi: 10.3389/ffgc.2023.1198156
53
Ledo A. Paul K. I. Burslem D. F. R. P. Ewel J. J. Barton C. Battaglia M. et al . (2018). Tree size and climatic water deficit control root to shoot ratio in individual trees globally. New Phytol. 217, 8–11. doi: 10.1111/nph.14863
54
Lenth R. V. Banfai B. Bolker B. Buerkner P. Giné-Vázquez I. Herve M. et al . (2025). emmeans: Estimated marginal means, aka least-squares means (R package). Available online at: https://cran.r-project.org/web/packages/emmeans/index.html (Accessed May 12, 2025).
55
Maynard D. S. Bialic-Murphy L. Zohner C. M. Averill C. van den Hoogen J. Ma H. et al . (2022). Global relationships in tree functional traits. Nat. Commun. 13:3185. doi: 10.1038/s41467-022-30888-2
56
McDowell N. Pockman W. T. Allen C. D. Breshears D. D. Cobb N. Kolb T. et al . (2008). Mechanisms of plant survival and mortality during drought: Why do some plants survive while others succumb to drought?New Phytol. 178, 719–739. doi: 10.1111/j.1469-8137.2008.02436.x
57
McGregor I. R. Helcoski R. Kunert N. Tepley A. J. Gonzalez-Akre E. B. Herrmann V. et al . (2021). Tree height and leaf drought tolerance traits shape growth responses across droughts in a temperate broadleaf forest. New Phytol. 231, 601–616. doi: 10.1111/nph.16996
58
Meeussen C. De Pauw K. Sanczuk P. Brunet J. Cousins S. A. O. Gasperini C. et al . (2022). Initial oak regeneration responses to experimental warming along microclimatic and macroclimatic gradients. Plant Biol. 24, 745–757. doi: 10.1111/plb.13412
59
Menezes-Silva P. E. Loram-Lourenço L. Alves R. D. F. B. Sousa L. F. da Silva Almeida S,.E FarneseF. S. (2019). Different ways to die in a changing world: Consequences of climate change for tree species performance and survival through an ecophysiological perspective. Ecol. Evol. 9, 11979–11999. doi: 10.1002/ece3.5663
60
Moran E. V. Das A. J. Keeley J. E. Stephenson N. L. (2019). Negative impacts of summer heat on Sierra Nevada tree seedlings. Ecosphere10:e02776. doi: 10.1002/ecs2.2776
61
Münchinger I. K. Hajek P. Akdogan B. Caicoya A. T. Kunert N. (2023). Leaf thermal tolerance and sensitivity of temperate tree species are correlated with leaf physiological and functional drought resistance traits. J. For. Res. 34, 63–76. doi: 10.1007/s11676-022-01594-y
62
Pearson E. D'Orangeville L. (2022). Relating the growth phenology and biomass allocation in seedlings of 13 Acadian tree species with their drought tolerance. Front. For. Glob. Change5:784382. doi: 10.3389/ffgc.2022.784382
63
Pohjanmies T. Triviño M. Le Tortorec E. Mazziotta A. Snäll T. Mönkkönen M. (2017). Impacts of forestry on boreal forests: an ecosystem services perspective. Ambio46, 743–755. doi: 10.1007/s13280-017-0919-5
64
Poorter H. Niklas K. J. Reich P. B. Oleksyn J. Poot P. Mommer L. (2012). Biomass allocation to leaves, stems and roots: meta-analyses of interspecific variation and environmental control. New Phytol. 193, 30–50. doi: 10.1111/j.1469-8137.2011.03952.x
65
Pozner E. Bar-On P. Livne-Luzon S. Moran U. Tsamir-Rimon M. Dener E. et al . (2022). A hidden mechanism of forest loss under climate change: The role of drought in eliminating forest regeneration at the edge of its distribution. For. Ecol. Manag. 506:119966. doi: 10.1016/j.foreco.2021.119966
66
Prasad A. Pedlar J. Peters M. McKenney D. Iverson L. Matthews S. et al . (2020). Combining US and Canadian forest inventories to assess habitat suitability and migration potential of 25 tree species under climate change. Divers. Distrib. 26, 1142–1159. doi: 10.1111/ddi.13078
67
Putnam R. C. Reich P. B. (2017). Climate and competition affect growth and survival of transplanted sugar maple seedlings along a 1700-km gradient. Ecol. Monogr. 87, 130–157. doi: 10.1002/ecm.1237
68
Qie L. Telford E. M. Massam M. R. Tangki H. Nilus R. Hector A. et al . (2019). Drought cuts back regeneration in logged tropical forests. Environ. Res. Lett. 14:045012. doi: 10.1088/1748-9326/ab0783
69
R Core Team (2024). R: A Language and Environment for Statistical Computing. Vienna: R Foundation for Statistical Computing. Available online at: https://www.R-project.org/ (Accessed June 4, 2025).
70
Rank R. Maneta M. Higuera P. Holden Z. Dobrowski S. (2022). Conifer seedling survival in response to high surface temperature events of varying intensity and duration. Front. For. Glob. Change4:731267. doi: 10.3389/ffgc.2021.731267
71
Redmond M. D. Weisberg P. J. Cobb N. S. Clifford M. J. (2018). Woodland resilience to regional drought: Dominant controls on tree regeneration following overstorey mortality. J. Ecol. 106, 625–639. doi: 10.1111/1365-2745.12880
72
Reich P. B. Sendall K. M. Rice K. Rich R. L. Stefanski A. Hobbie S. E. et al . (2015). Geographic range predicts photosynthetic and growth response to warming in co-occurring tree species. Nat. Clim. Chang. 5, 148–152. doi: 10.1038/nclimate2497
73
Reich P. B. Sendall K. M. Stefanski A. Rich R. L. Hobbie S. E. Montgomery R. A. (2018). Effects of climate warming on photosynthesis in boreal tree species depend on soil moisture. Nature562, 263–267. doi: 10.1038/s41586-018-0582-4
74
Roberts B. R. Cannon Jr W. N. (1992). Growth and water relationships of red spruce seedlings exposed to atmospheric deposition and drought. Can. J. For. Res. 22, 193–197. doi: 10.1139/x92-025
75
Rodgers V. L. Smith N. G. Hoeppner S. S. Dukes J. S. (2018). Warming increases the sensitivity of seedling growth capacity to rainfall in six temperate deciduous tree species. AoB PLANTS10:ply003. doi: 10.1093/aobpla/ply003
76
Sack L. (2010). Gmin Analysis Tool. PROMETHEUS Protocols. Available online at: https://prometheusprotocols.net/function/gas-exchange-and-chlorophyll-fluorescence/stomatal-and-non-stomatal-conductance-and-transpiration/minimum-epidermal-conductance-gmin-a-k-a-cuticular-conductance/ (Accessed May 23, 2025).
77
Sack L. Scoffoni C. (2010). Minimum epidermal conductance (gmin, a.k.a. cuticular conductance). PROMETHEUS Protocols. Available online at: https://prometheusprotocols.net/function/gas-exchange-and-chlorophyll-fluorescence/stomatal-and-non-stomatal-conductance-and-transpiration/minimum-epidermal-conductance-gmin-a-k-a-cuticular-conductance/ (Accessed May 23, 2025).
78
Sastry A. Guha A. Barua D. (2018). Leaf thermotolerance in dry tropical forest tree species: relationships with leaf traits and effects of drought. AoB PLANTS10:plx070. doi: 10.1093/aobpla/plx070
79
Schindelin J. Arganda-Carreras I. Frise E. Kaynig V. Longair M. Pietzsch T. et al . (2012). Fiji: An open-source platform for biological-image analysis. Nat. Methods9, 676–682. doi: 10.1038/nmeth.2019
80
Scholz F. G. Phillips N. G. Bucci S. J. Meinzer F. C. Goldstein G. (2011). “Hydraulic capacitance: Biophysics and functional significance of internal water sources in relation to tree size,” in Size- and Age-Related Changes in Tree Structure and Function, eds. F. C. Meinzer, B. Lachenbruch, T. E. Dawson (Springer, Dordrecht) 341–361.
81
Schönbeck L. C. Schuler P. Lehmann M. M. Mas E. Mekarni L. Pivovaroff A. L. et al . (2022). Increasing temperature and vapour pressure deficit lead to hydraulic damages in the absence of soil drought. Plant Cell Environ. 45, 3275–3289. doi: 10.1111/pce.14425
82
Schulz K. A. Barry A. M. Kenefic L. S. Wason J. W. (2024). Contrasting survival strategies for seedlings of two northern conifer species to extreme droughts and floods. Tree Physiol.44:tpae117. doi: 10.1093/treephys/tpae117
83
Sendall K. M. Reich P. B. Zhao C. Jihua H. Wei X. Stefanski A. et al . (2015). Acclimation of photosynthetic temperature optima of temperate and boreal tree species in response to experimental forest warming. Glob. Change Biol. 21, 1342–1357. doi: 10.1111/gcb.12781
84
Šidák Z. (1967). Rectangular confidence regions for the means of multivariate normal distributions. J. Am. Stat. Assoc. 62, 626–633. doi: 10.1080/01621459.1967.10482935
85
Tang G. Beckage B. (2010). Projecting the distribution of forests in New England in response to climate change. Divers. Distrib. 16, 144–158. doi: 10.1111/j.1472-4642.2009.00628.x
86
van Kampen R. Fisichelli N. Zhang Y.-J. Wason J. (2022). Drought timing and species growth phenology determine intra-annual recovery of tree height and diameter growth. AoB PLANTS14:plac012. doi: 10.1093/aobpla/plac012
87
Vaughn W. R. Taylor A. R. MacLean D. A. D'Orangeville L. Lavigne M. B. (2021). Climate change experiment suggests divergent responses of tree seedlings in eastern North America's Acadian Forest Region over the 21st century. Can. J. For. Res. 51, 1888–1902. doi: 10.1139/cjfr-2021-0047
88
Visakorpi K. Manzanedo R. D. Görlich A. S. Schiendorfer K. Altermatt Bieger A. Gates E. et al . (2024). Leaf-level resistance to frost, drought and heat covaries across European temperate tree seedlings. J. Ecol. 112, 559–574. doi: 10.1111/1365-2745.14254
89
Wang S. Hoch G. Grun G. Kahmen A. (2024). Water loss after stomatal closure: Quantifying leaf minimum conductance and minimal water use in nine temperate European tree species during a severe drought. Tree Physiol.44:tpae027. doi: 10.1093/treephys/tpae027
90
Will R. E. Wilson S. M. Zou C. B. Hennessey T. C. (2013). Increased vapor pressure deficit due to higher temperature leads to greater transpiration and faster mortality during drought for tree seedlings common to the forest–grassland ecotone. New Phytol. 200, 366–374. doi: 10.1111/nph.12321
91
Williams A. P. Allen C. D. Macalady A. K. Griffin D. Woodhouse C. Meko D. M. et al . (2012). Temperature as a potent driver of regional forest drought stress and tree mortality. Nat. Clim. Chang. 3, 292–297. doi: 10.1038/nclimate1693
92
Woodruff D. R. Meinzer F. C. McCulloh K. A. O'Keefe K. Kerr K. L. Ulrich D. E. M. et al . (2024). Drought-related mortality, growth and non-structural carbohydrate dynamics in two conifer species during early stages of development. Trees38, 1491–1508. doi: 10.1007/s00468-024-02568-9
93
Wright A. J. Fisichelli N. A. Buschena C. Rice K. Rich R. Stefanski A. et al . (2018). Biodiversity bottleneck: Seedling establishment under changing climatic conditions at the boreal–temperate ecotone. Plant Ecol. 219, 691–704. doi: 10.1007/s11258-018-0827-1
94
Wright S. J. Kitajima K. Kraft N. J. B. Reich P. B. Wright I. J. Bunker D. E. et al . (2010). Functional traits and the growth–mortality trade-off in tropical trees. Ecology91, 3664–3674. doi: 10.1890/09-2335.1
95
Zargar S. M. Gupta N. Nazir M. Mahajan R. Malik F. A. Sofi N. R. et al . (2017). Impact of drought on photosynthesis: Molecular perspective. Plant Gene11, 154–159. doi: 10.1016/j.plgene.2017.04.003
96
Ziegler C. Cochard H. Stahl C. Foltzer L. Gérard B. Goret J.-Y. et al . (2024). Residual water losses mediate the trade-off between growth and drought survival across saplings of 12 tropical rainforest tree species with contrasting hydraulic strategies. J. Exp. Bot. 75, 4128–4147. doi: 10.1093/jxb/erae159
Summary
Keywords
combined stress, drought, heat, range margins, survival, tree seedlings
Citation
MacDonald EG, Cullina MD, Peterson BJ and Wason JW (2026) Combined heat and drought events reduce first-year survival of tree seedlings, especially at southern range margins. Front. For. Glob. Change 8:1734405. doi: 10.3389/ffgc.2025.1734405
Received
28 October 2025
Revised
12 December 2025
Accepted
22 December 2025
Published
20 January 2026
Volume
8 - 2025
Edited by
Xiaochun Wang, Northeast Forestry University, China
Reviewed by
Jacob Ravn, University of New Brunswick Fredericton, Canada
Alexandra Lalor, United States Department of the Interior, United States
Naili Zhang, Beijing Forestry University, China
Updates
Copyright
© 2026 MacDonald, Cullina, Peterson and Wason.
This is an open-access article distributed under the terms of the Creative Commons Attribution License (CC BY). The use, distribution or reproduction in other forums is permitted, provided the original author(s) and the copyright owner(s) are credited and that the original publication in this journal is cited, in accordance with accepted academic practice. No use, distribution or reproduction is permitted which does not comply with these terms.
*Correspondence: Emily G. MacDonald, emily.macdonald@maine.edu
Disclaimer
All claims expressed in this article are solely those of the authors and do not necessarily represent those of their affiliated organizations, or those of the publisher, the editors and the reviewers. Any product that may be evaluated in this article or claim that may be made by its manufacturer is not guaranteed or endorsed by the publisher.