1 Introduction
Forest soils play a key role in land-atmosphere interactions through driving physical, chemical and ecological processes of the underlying surfaces and influencing energy and carbon exchange between land and atmosphere. Daily soil temperature is the critical environmental parameter to govern essential soil processes such as nutrient cycling, microbial activity, and water retention, directly affecting plant growth, seed germination, and root growth in forest ecosystems (Verma et al., 2011). Canopy density and light interception levels vary among forest ecosystems, determining the amount of light reaching the soil and thus influencing soil temperature (Saher et al., 2025). Since accurate gridded daily soil temperature data can help to improve numerical weather forecasts and optimize key infrastructure design in forest regions, addressing pressing environmental and societal challenges (Das et al., 2025), generation of high-resolution gridded daily soil temperature datasets can greatly support the development of sustainable forest ecosystems (Qi et al., 2019). However, direct measurement of daily soil temperatures in large-scale forest regions is always impractical due to the expensive and time-consuming processes for any developing countries like Ethiopia.
Ethiopia is distinguished by its remarkable topographic diversity, varying from as much as 116 m below sea level in the Danakil depression to 4,620 m above sea level in the Ras Dashen, resulting in a variety of forest ecosystems (Tesfaye et al., 2017). Such a dramatic altitudinal variation shapes Ethiopia's forest ecosystem, resulting in three ecological zones: Dega, Woina Dega, and Kola. Every ecological zone has the similar soil type, vegetation covers, topography and agricultural management. The highland Dega zone, ranging from 2,300 to 3,200 meters above sea level, is characterized by cooler temperatures, fertile soils, and higher rainfall; the Woina Dega zone, located between 1,500 and 2,300 meters, experiences moderate temperatures and favorable conditions for agriculture; the Kola zone encompasses lowland, semi-arid regions ranging from 500 to 1,500 meters, characterized by high temperatures, lower rainfall, and heightened susceptibility to drought (Etana et al., 2020).
The combination of diverse topography of Ethiopia and recent climatic warming results in complex soil temperature variations. Although soil temperature plays a pivotal role in shaping forest ecosystem dynamics and supports healthy and sustainable development of forests, soil temperatures in Ethiopia have been only measured to a very limited extent. Among all 17 meteorological stations in the National Meteorological Agency (NMA) of Ethiopia, soil temperature is measured only in 11 stations (see Table 1). These meteorological stations include Arba Minch, Addis Ababa, Awassa, Gondar, Hosana, Jijiga, Jimma, Konso, Neghele, Debre Markos, and Dire Dawa, which have provided regularly measured soil temperatures at multiple depths (5 cm, 10 cm, 20 cm, and 50 cm) during 1993–2023. Despite the importance of these measurements, soil temperatures measured in these stations still have missing values for several periods, in detail: Arba Minch: Jan–Dec 1993, Jul–Dec 2009, Jan–Dec 2016, Jan–Dec 2020, May–Dec 2018; Addis Ababa: Jan–Dec 1994, Aug–Dec 2010, Jan–Dec 2017, Jan–Dec 2021, May–Dec 2023; Awassa: Jan–Dec 1995, May–Dec 2009, Nov–Dec 2017, May–Dec 2020, Jul–Dec 2018; Gondar: Dec 1994, Aug–Dec 2010, Jan–Dec 2016, May–Dec 2020, Dec 2022; Hosana: Aug–Dec 2009, May–Dec 2017, May–Dec 2018, Jan–Dec 2021, May–Dec 2023; Jijiga: Dec 1997, Jan–Dec 2009, Jul–Dec 2018, Jan–Dec 2021, May–Dec 2023; Jimma: Jan–Dec 1998, May–Dec 2017, Jan–Dec 2020, May–Dec 2022, 2023; Konso: Jan–Dec 1995, May–Dec 2009, Dec 2018, Jan–Dec 2020, May–Dec 2021; Neghele: May–Dec 1996, Jan–Dec 2008, May–Dec 2018, Jul–Dec 2020, Jan–Dec 2022; Debre Markos: Aug–Dec 2009, May–Dec 2017, Jan–Dec 2019, Jan–Dec 2021, May–Dec 2022; Dire Dawa: Jan–Dec 1996, Jul–Dec 2009, Jul–Dec 2017, Jan–Dec 2022, Jan–Dec 2023.
Table 1
| Stations | Latitude | Longitude | Elevation | Measured soil temperature | Ecological zone | Observed period |
|---|---|---|---|---|---|---|
| Addis | 38.80 | 8.98 | 2,354 | Yes | Dega | 1993–2023 |
| Arba | 37.56 | 6.06 | 1,220 | Yes | Kola | 1993–2023 |
| Awassa | 38.48 | 7.07 | 1,694 | Yes | Woina Dega | 1993–2023 |
| Bulki | 36.81 | 6.28 | 2,430 | No | Dega | 1993–2023 |
| Debre Markos | 37.74 | 10.33 | 2,446 | Yes | Dega | 1993–2023 |
| Neghele | 39.27 | 5.33 | 1,439 | Yes | Kola | 1993–2023 |
| Dire Dawa | 41.90 | 9.61 | 1,045 | Yes | Kola | 1993–2023 |
| Metehara | 39.92 | 8.87 | 952 | No | Kola | 1993–2023 |
| Jimma | 36.82 | 7.67 | 1,710 | Yes | Woina Dega | 1993–2023 |
| Tulu Bolo | 38.21 | 8.66 | 2,190 | No | Woina Dega | 1993–2023 |
| Hosana | 37.43 | 12.52 | 2,306 | Yes | Dega | 1993–2023 |
| Gondar | 37.86 | 38.86 | 1,973 | Yes | Woina Dega | 1993–2023 |
| Jinka | 36.56 | 5.78 | 1,373 | No | Kola | 1993–2023 |
| Jijiga | 42.72 | 9.37 | 1,557 | Yes | Woina Dega | 1993–2023 |
| Mehal Meda | 39.66 | 10.31 | 3,084 | No | Dega | 1993–2023 |
| Konso | 37.44 | 5.34 | 1,431 | Yes | Kola | 1993–2023 |
| Wolkite | 37.77 | 8.28 | 1,884 | No | Woina Dega | 1993–2023 |
All available meteorological stations in Ethiopia.
In this data report, we used various ensemble boosting learning techniques to develop an optimal soil temperature forecasting model through the link between observed meteorological factors and soil temperature at multiple depths (5 cm, 10 cm, 20 cm, and 50 cm) in these 11 meteorological stations. Following that, by inputting the observed meteorological data from all 17 meteorological stations into this optimal soil temperature model, we not only filled missing values in soil temperature measurement in these 11 meteorological stations, but also produced a soil temperature dataset for the remaining six stations without observed soil temperature data. Since all meteorological stations in Ethiopia are sparse and irregularly distributed, these data are not enough to produce a complete soil temperature distribution map for Ethiopia. In order to solve these issues, we utilized the NASA POWER gridded meteorological data at a 0.5° × 0.625° resolution as the input of our optimal soil temperature model and we generated a high-resolution gridded soil temperature dataset in the whole Ethiopia.
2 Methods
Ensemble boosting techniques use decision trees as their base learners and sequentially combine them to improve forecast accuracy, where each new tree is trained to correct the errors made by the previous trees. In order to generate a high-resolution gridded soil temperature dataset for the whole of Ethiopia, we adopted four advanced ensemble boosting models: XGBoost, CatBoost, Gradient Boosting, and LightGBM to establish the link between observed meteorological factors and soil temperature at multiple depths. Gradient Boosting is the first widely-used boosting technique through the connection between stagewise additive expansions and steepest-descent minimization, producing competitive, highly robust, interpretable procedures for regression issues (Friedman, 2001). XGBoost, as an improvement of Gradient Boosting, is known for its scalability and regularization techniques for handling sparse data and its implementation in parallel and distributed computing (Chen and Guestrin, 2016). CatBoost incorporates ordered boosting, a permutation-driven alternative to the classic algorithm, and an innovative algorithm for processing categorical features to fight prediction shifts in Gradient Boosting (Prokhorenkova et al., 2018). LightGBM incorporates Gradient-based One-Side Sampling (GOSS) and Exclusive Feature Bundling (EFB), offering high efficiency during training process (Ke et al., 2017). These models can capture complex non-linear relationships between climate factors and soil temperature and have demonstrated strong performance in various environmental modeling applications (Alizamir et al., 2024).
The performance of boosting models on soil temperature predictions can be significantly influenced by different input scenarios and time windows. For this study, the input of soil temperature prediction models should be meteorological factors which impact significantly on soil temperatures, so we selected five meteorological factors, including daily minimum air temperature (MIN), daily maximum air temperature (MAX), daily mean air temperature (MEAN), daily rainfall (RAIN), and daily humidity (HUM) as model inputs. Four kinds of input scenarios were tested in the performance of soil temperature prediction: the MEAN-MAX-MIN combination scenario is to consider only air temperature dynamics; the MEAN-MAX-MIN-HUM combination scenario is to further add humidity effects on evaporative cooling; the MEAN-MAX-MIN-RAIN combination scenario is to consider temperature-rainfall interactions; and the MEAN-MAX-MIN-HUM-RAIN scenario is to consider all meteorological factors. These input scenarios can make the boosting models simulate physical processes that influence soil thermal properties. We also considered five types of time window: 1-day, 2-day, 3-day, 4-day, and 5-day.
From January 1, 2010, to December 31, 2023, all meteorological factors were measured at 17 meteorological stations of the National Meteorological Agency (NMA) of Ethiopia. However, soil temperature was only measured in 11 stations. Our method for generating a high-resolution gridded soil temperature dataset in the whole Ethiopia was as follows.
Step 1: establishment of an optimal soil temperature forecast model
For 11 meteorological stations where both climate factors and soil temperature were measured simultaneously, after removing periods with missing data, we divided the remaining dataset using an 80–20 split: 80% for training the models and 20% for testing. We employed four ensemble boosting models (XGBoost, CatBoost, Gradient Boosting, and LightGBM) with five types of time window and four input scenarios to stimulate soil temperature at different depths. By comparing different combinations of boosting models, time windows and input scenarios, we identified the optimal combination of ensemble learning model, input scenario, and time window size for forecasting daily soil temperature at different depths for each of 11 meteorological stations.
Step 2: filling missing soil temperature data in 11 meteorological stations
Using the optimal soil forecast model established in Step 1 for the 11 meteorological stations with partial soil temperature measurements, we filled missing soil temperature data during periods where meteorological factors were measured but soil temperature was not. We input the observed meteorological factors into the optimal soil temperature forecast model to generate estimates of soil temperature at different depths for the missing periods, thereby creating complete daily soil temperature time series for all 11 stations.
Step 3: generation of a soil temperature dataset in six meteorological stations without measured soil temperatures
We utilized the optimal soil temperature forecast model for each of 11 stations in Step 1 to generate an estimate of soil temperatures at different depths in the remaining six stations. The detailed process was as follows: for any given station without soil temperature measurements (denoted by Station A), we calculated the correlation between maximum/minimum air temperature in Station A and those in 11 stations. If Station B achieved the maximal correlation coefficient in all 11 stations, this meant that meteorological conditions in Stations A and B were similar. Then we used the optimal soil temperature forecast model for Station B to estimate soil temperature in Station A, i.e., we input observed climate data in Station A into the optimal soil temperature forecast model for Station B, then we generated the soil temperature time series for Station A. By this way, we produced an estimate of daily soil temperatures at all six stations without measured soil temperatures.
Step 4: generation of high-resolution gridded soil temperature data for the whole of Ethiopia
Since all meteorological stations in Ethiopia are sparse and irregular distributed, these data are not enough to produce a complete soil temperature distribution map for Ethiopia. Therefore, we adopted NASA POWER gridded meteorological data at 0.5° × 0.625° resolution as model input; these datasets were downloaded from https://power.larc.nasa.gov/. Correlation-based matching was performed between meteorological factors at each NASA grid cell and all 11 stations with measured soil temperatures. For a given grid cell P, when meteorological data in Station Q achieved the highest correlation coefficients with those in grid cell P, this demonstrated that grid cell P and Station Q had the strongest meteorological similarity and was located in the same ecological zone. Therefore, we drove the optimal soil temperature forecast model for Station Q by inputting NASA POWER meteorological data at grid cell P and then generated daily soil temperature estimates at multiple depths at grid cell P. When we repeated the same process for all grid cells at 0.5° × 0.625° resolution, we produced a high-resolution gridded soil temperature map distribution at different depth for Ethiopia.
3 Daily soil temperature data
Soil temperature data were measured twice a day at 5 cm, 10 cm, 20 cm, and 50 cm in 11 meteorological stations of the National Meteorological Agency (NMA) of Ethiopia during 1993–2023, Based on these observation data, we evaluated the performance of daily soil temperature prediction by four models (XGBoost, LightGBM, CatBoost, Gradient Boosting) across various input scenarios and time windows, where the prediction errors were measured by the Pearson correlation coefficient (R) and Root Mean Square Error (RMSE) between observed and forecasted values. Due to space limitations, the detailed results are shown in Supplementary Tables S1–S8. The optimal soil temperature prediction model at 50 cm depth at 00-h was achieved by the CatBoost model with using the MEAN-MAX-MIN-RAIN scenario and a 1-day time window (R = 0.917, RMSE = 0.520), and that at 12-h was achieved by the LightGBM model with the same input scenario and time window (R = 0.896, RMSE = 0.504). The optimal soil temperature prediction model at 20 cm depth was achieved by the CatBoost model with the MEAN-MAX-MIN scenario and a 1-day time window (00-h: R = 0.856, RMSE = 0.975; 12-h: R = 0.866, RMSE = 0.954). The optimal soil temperature prediction model at 10 cm depth was achieved by the LightGBM model utilizing the MEAN-MAX-MIN-HUM-RAIN scenario and a 1-day time window (00-h: R = 0.816, RMSE = 1.259; 12-h: R = 0.826, RMSE = 1.122). The optimal soil temperature prediction model at 5 cm depth was achieved by the CatBoost model using the MEAN-MAX-MIN-HUM-RAIN scenario and a 5-day time window yielding the best results (00-h: R = 0.775, RMSE = 1.187; 12-h: R = 0.786, RMSE = 1.769). Due to space limitations, optimal soil temperature prediction models for each station and related prediction accuracy in terms of RMSE and R are shown in Supplementary Tables S9–S12.
Based on these optimal soil temperature models, using the method described in Step 2, we filled the missing daily soil temperature records at 5 cm, 10 cm, 20 cm, and 50 cm depths for the 11 meteorological stations. Using the correlation-based matching and ensemble boosting approach in Step 3, we generated daily soil temperature data for the remaining six meteorological stations without soil measurement.
Based on the correlation-based matching of meteorological conditions between each NASA grid cells and 11 meteorological stations in Ethiopia, we input NASA POWER meteorological data (0.5° × 0.625° resolution) into optimal soil temperature prediction models and produced daily soil temperature estimates at 5 cm, 10 cm, 20 cm, and 50 cm depths. Figure 1 demonstrates mean daily soil temperature distribution map at 5 cm, 10 cm, 20 cm, and 50 cm depths, reflecting localized and accurate representation of spatial variability in soil temperature across Ethiopia. Such high-resolution gridded soil temperature maps can provide critical insights for forest planning and management, climate change adaptation, and environmental monitoring.
Figure 1
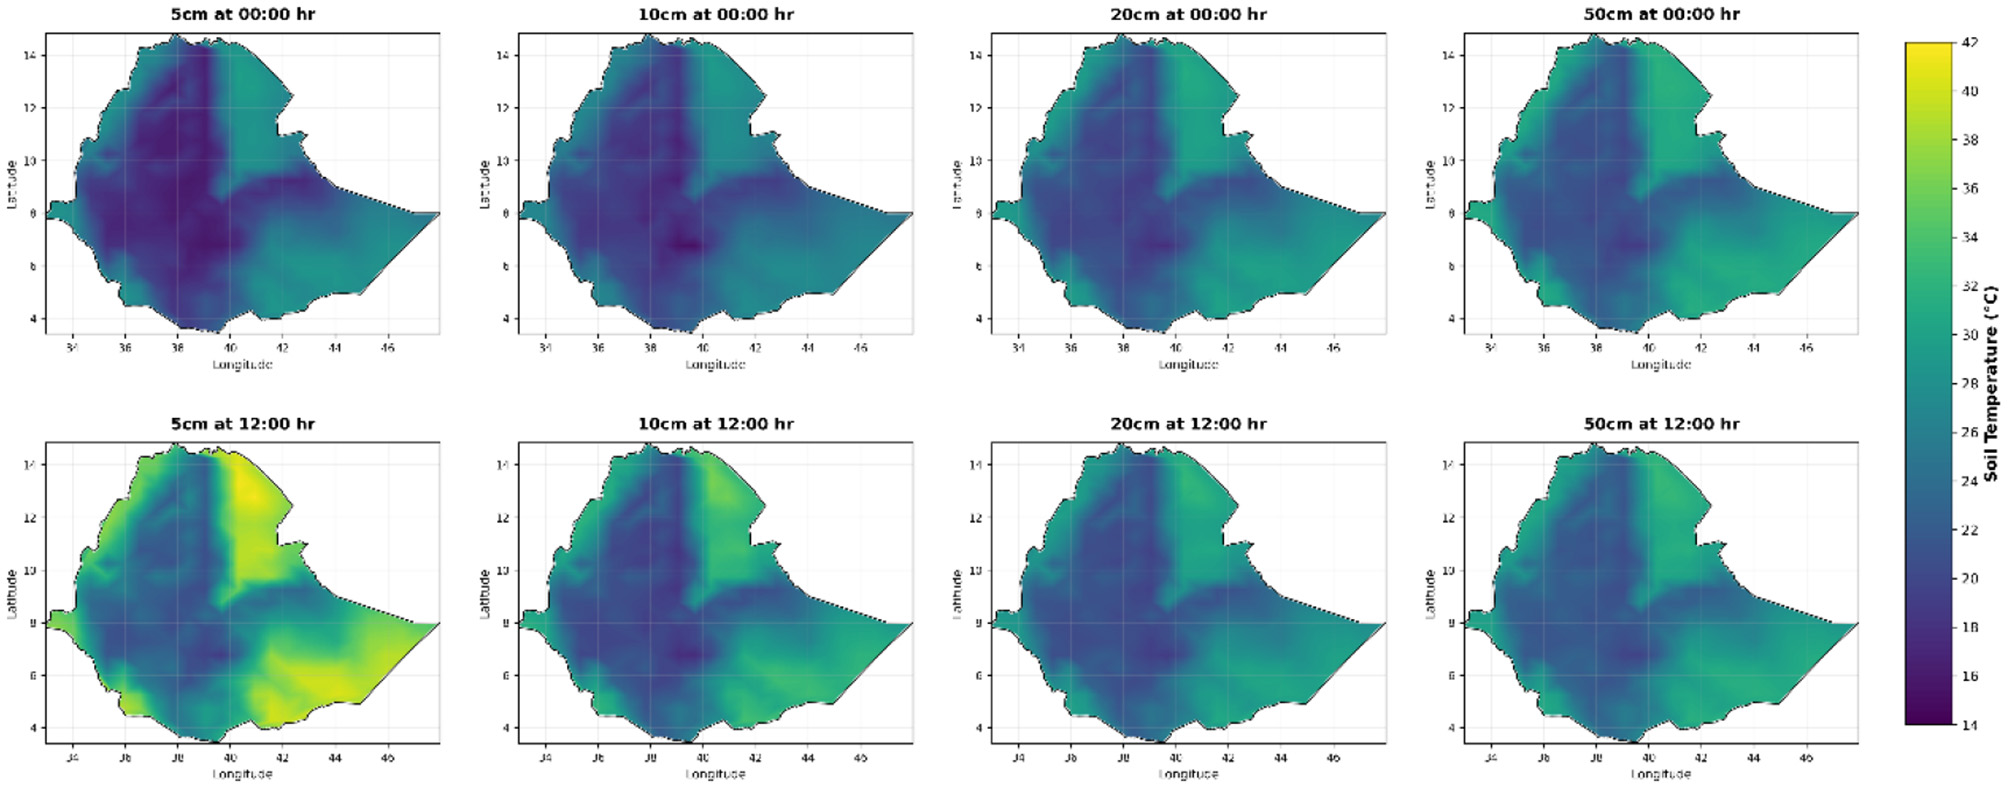
High-resolution daily soil temperature map of Ethiopia at the depths of 5 cm, 10 cm, 20 cm, and 50 cm, especially the first line shows daily soil temperature of Ethiopia at 00 hr and the second line is daily soil temperature of Ethiopia at 12 hr.
4 Implications
Daily soil temperatures are key drivers of soil ecological processes and they affect healthy growth of forest ecosystems. Owing to limited soil measurements, Ethiopia has urgently needed to capture daily soil temperatures at multiple depths in order to improve its environmental monitoring and enhance climate resilience in its forest ecosystems. In this data report, we utilized correlation-based matching and boosting-based learning to generate high-resolution gridded daily soil temperature datasets at 5 cm, 10 cm, 20 cm, and 50 cm depths throughout the whole of Ethiopia. These insights will be crucial for addressing challenges related to forest conservation and climate resilience, making our gridded daily soil temperature dataset valuable for research and informed decision-making in Ethiopia.
Statements
Data availability statement
The datasets presented in this study can be found in online repositories. The names of the repository/repositories and accession number(s) can be found below: https://github.com/lopiso2021/soil_temperature_v2.
Author contributions
FK: Data curation, Investigation, Resources, Software, Validation, Visualization, Writing – original draft. ZZ: Conceptualization, Formal analysis, Methodology, Writing – original draft, Writing – review & editing. MC: Writing – review & editing.
Funding
The author(s) declared that financial support was not received for this work and/or its publication.
Conflict of interest
The author(s) declared that this work was conducted in the absence of any commercial or financial relationships that could be construed as a potential conflict of interest.
Generative AI statement
The author(s) declared that generative AI was not used in the creation of this manuscript.
Any alternative text (alt text) provided alongside figures in this article has been generated by Frontiers with the support of artificial intelligence and reasonable efforts have been made to ensure accuracy, including review by the authors wherever possible. If you identify any issues, please contact us.
Publisher’s note
All claims expressed in this article are solely those of the authors and do not necessarily represent those of their affiliated organizations, or those of the publisher, the editors and the reviewers. Any product that may be evaluated in this article, or claim that may be made by its manufacturer, is not guaranteed or endorsed by the publisher.
Supplementary material
The Supplementary Material for this article can be found online at: https://www.frontiersin.org/articles/10.3389/ffgc.2025.1756263/full#supplementary-material
References
1
Alizamir M. Wang M. Ikram R. M. A. Ahmed K. O. Heddam S. Kim S. (2024). An efficient computational investigation on accurate daily soil temperature prediction using boosting ensemble methods explanation based on SHAP importance analysis. Results Eng.24:103220. doi: 10.1016/j.rineng.2024.103220
2
Chen T. Guestrin C. (2016). “XGBoost: a scalable tree boosting system,” in Proceedings of the 22nd ACM SIGKDD International Conference on Knowledge Discovery and Data Mining (New York, NY: Association for Computing Machinery), 785–794. doi: 10.1145/2939672.2939785
3
Das L. Zhang Z. Crabbe J. Alam M. (2025). Daily soil temperature at varying depths in Bangladesh during 2001-2022. Front. For. Glob. Change8:1615261. doi: 10.3389/ffgc.2025.1615261
4
Etana D. Snelder D. J. R. M. Wesenbeeck C. F. A. Buning T. D. C. (2020). Trends of climate change and variability in three agro-ecological settings in central Ethiopia: contrasts of meteorological data and farmers' perceptions'. Climate8:121. doi: 10.3390/cli8110121
5
Friedman J. H. (2001). Greedy function approximation: a gradient boosting machine. Ann. Stat.29, 1189–1232. doi: 10.1214/aos/1013203451
6
Ke G. Meng Q. Finley T. Wang T. Chen W. Ma W. et al . (2017). LightGBM: “A highly efficient gradient boosting decision tree,” in Proceedings of the 31st International Conference on Neural Information Processing Systems (Singapore: Springer), 3149–3157.
7
Prokhorenkova L. Gusev G. Vorobev A. Dorogush A. V. Gulin A. (2018). “CatBoost : unbiased boosting with categorical features,” in 32nd Conference on Neural Information Processing Systems (New York, NY: Association for Computing Machinery), 6639–6649.
8
Qi J. Zhang X. Cosh M. H. (2019). Modeling soil temperature in a temperate region: a comparison between empirical and physically based methods in SWAT. Ecol. Eng.129, 134–143. doi: 10.1016/j.ecoleng.2019.01.017
9
Saher A. Kim G. Ahn J. Chae N. Chung H. Son Y. (2025). Factors affecting CO2, CH4, and N2O fluxes in temperate forest soils. Forests16:1723. doi: 10.3390/f16111723
10
Tesfaye T. W. Dhanya C. T. Gosain A. K. (2017). Spatiotemporal evaluation temperature over Ethiopia of reanalysis and surface air. Eur. Water59, 215–221.
11
Verma P. Yeates J. Daly E. (2011). A stochastic model describing the impact of daily rainfall depth distribution on the soil water balance. Adv. Water Resour.34, 1039–1048. doi: 10.1016/j.advwatres.2011.05.013
Summary
Keywords
ensemble boosting techniques, Ethiopia, forest soil, four soil depth, gridded daily soil temperature
Citation
Kobe FT, Zhang Z and Crabbe MJC (2026) 0.5° × 0.625° gridded daily soil temperature at four depths in Ethiopia during 1993–2023. Front. For. Glob. Change 8:1756263. doi: 10.3389/ffgc.2025.1756263
Received
28 November 2025
Revised
25 December 2025
Accepted
29 December 2025
Published
21 January 2026
Volume
8 - 2025
Edited by
Zachary E. Kayler, University of Idaho, United States
Reviewed by
Safdar Bashir, University of Idaho, United States
Updates
Copyright
© 2026 Kobe, Zhang and Crabbe.
This is an open-access article distributed under the terms of the Creative Commons Attribution License (CC BY). The use, distribution or reproduction in other forums is permitted, provided the original author(s) and the copyright owner(s) are credited and that the original publication in this journal is cited, in accordance with accepted academic practice. No use, distribution or reproduction is permitted which does not comply with these terms.
*Correspondence: Zhihua Zhang, zhangzhihua@sdu.edu.cn
Disclaimer
All claims expressed in this article are solely those of the authors and do not necessarily represent those of their affiliated organizations, or those of the publisher, the editors and the reviewers. Any product that may be evaluated in this article or claim that may be made by its manufacturer is not guaranteed or endorsed by the publisher.