Abstract
Driven by the global pursuit of sustainability, various institutional and governance frameworks—such as Environmental, Social, and Governance initiatives (ESG), and their associated policy instruments, including carbon markets—have been developed to mitigate climate change. These emerging systems can serve as strong incentives for sustainable forest management, particularly in countries where the forestry sector remains underutilized. In this context, this study evaluated the comprehensive carbon benefits of a regional-scale sustainable forest management project integrated with a wood supply chain in South Korea, a country with limited utilization of domestic forest resources. The results were compared with those of a conventional passive forest management scenario. Establishing a regional forest supply chain was estimated to generate 4,236,270 tCO2e of cumulative net carbon benefit over the 40-year project period. These benefits include 1,901,418 tCO2e from CO2 sequestration in forests, 835,733 tCO2e from substituting fossil fuels with forest biomass energy, 247,349 tCO2e from reduced transportation emissions, and 1,251,769 tCO2e from carbon storage in harvested wood products (HWPs). This amount was comparable to that of the passive management scenario (4,245,577 CO2e). These results indicate that, despite increased harvesting, active forest management can offset associated emissions through enhanced wood utilization and other carbon benefits. Overall, the findings demonstrate that integrating regional forest supply chains can not only enhance societal access to renewable material resources and generate revenue streams but also contribute meaningfully to climate change mitigation.
1 Introduction
The agriculture, forestry, and other land use (AFOLU) sector is widely recognized for its capacity to contribute to climate change mitigation and adaptation (IPCC, 2023). Moreover, from the perspective of human livelihoods, land and ecosystem management plays a critical role by providing not only economic benefits—such as wood, food, and feed—but also essential ecosystem services, such as freshwater provision, biodiversity conservation, and multiple contributions to human wellbeing (Sapkota et al., 2022). Accordingly, it is necessary to evaluate the carbon mitigation outcomes of different land-use pathways within an integrated forestry supply chain, while also considering their associated revenue streams and renewable material resources.
Globally, forests cover approximately 4.06 billion hectares, representing 31% of the Earth’s land surface [FAO (Food and Agriculture Organization of the United Nations), 2020]. Reducing emissions from deforestation and forest degradation (REDD+) has been recognized as a critical strategy for addressing climate change, given that mature tropical forests store the highest level of CO2—approximately 300–400 tons per hectare—particularly in Central and South America and Africa, where reduced deforestation accounts for nearly 60% of total mitigation potential (IPCC, 2023; Climate investment funds, 2021). In addition, expanding forest areas is considered one of the cost-effective mitigation measures over the next 30–50 years (Feng, 2022). Consequently, many countries are increasingly incorporating forest-based carbon sequestration as a key element of their national climate strategies (Feng, 2022).
Alongside reforestation and avoided forest conversion, improved forest management provides substantial and cost-effective mitigation potential, much of which can be deployed rapidly without changes in land use or tenure, and with minimal effects on wood yield (Griscom et al., 2017). Moreover, forest management contributes to climate change mitigation not only through carbon sequestration in forests but also via the utilization of HWPs. HWPs function as a carbon sink, accounting for approximately 13% of the forest carbon sinks in Europe (Gregor et al., 2024). Renewable energy derived from forest resources also serves as an effective means of mitigating climate change by replacing fossil fuels and offering viable economic opportunities (Ofoegbu, 2023). Furthermore, HWPs can replace carbon-intensive materials, such as concrete and steel, which together are responsible for roughly 14% of global CO2 emissions from the construction sector (Gregor et al., 2024).
However, according to FAO’s statistics, the 23 OECD member countries utilize only 69% of their annual forest volume increment, and South Korea’s utilization rate is even lower at 18% (FAO, 2024). This suggests that additional mitigation potential could be achieved through more active forest management. Furthermore, mature forests—such as those in Europe—have been shown to experience declines in net primary productivity (NPP) due to ageing and increasing disturbances (Gregor et al., 2024). Forests in South Korea, most of which were established through large-scale reforestation in the 1960s and 1970s, have reached or passed the peak growth stage of their average life cycle. Consequently, their annual net CO2 sequestration capacity has declined—from 62 MtCO2e yr.−1 in 2008 to 41 MtCO2e yr.−1 in 2020—and is projected to further decrease to 14 MtCO2e yr.−1 by 2050, although these forests are still expected to remain a net carbon sink (Korea Forest Service, 2023b).
To address this situation, the Korea Forest Service (KFS) has reinforced its policies on sustainable circular forest management and the expansion of carbon storage in HWPs by promoting the use of domestic wood (Ahn et al., 2022). However, due to fragile timber production and processing infrastructure, South Korea continues to exhibit a low level of wood self-sufficiency—defined as the proportion of domestic timber supply relative to national demand—which stood at 17.4% in 2023 (Korea Forest Service, 2025). Although forest resources are receiving increasing attention as a renewable material, a considerable portion of forest biomass remains unutilized due to the lack of an efficient supply chain in the wood-related industry (Min et al., 2017).
Recently, strengthened forest policies have created meaningful opportunities for the private sector. One such opportunity is the growing interest in nature-based carbon projects as part of ESG management initiatives (Yanai et al., 2020). In addition, the expansion of voluntary carbon markets provides new revenue streams for forest projects, offering businesses the opportunity to generate commercial returns through forest conservation, restoration, and management (World Economic Forum, 2021). For instance, an Irish sustainable forest fund has acquired approximately 5,000 hectares of forestland in Ireland and is converting the area to continuous-cover forestry. This approach not only stabilizes wood production, providing a positive economic impact for project promoters, but also supports broader ESG objectives, including biodiversity enhancement and improved environmental sustainability (European Investment Bank, 2019).
Forestry can play an economically important role, particularly when supported by sustainable management and the effective utilization of forest resources as low-carbon materials (World Economic Forum, 2021). One mechanism that connects natural ecosystems with the private sector is the carbon market, which incentivizes voluntary efforts to reduce carbon emissions and enhance ecosystem-based carbon sequestration, thereby enabling the generation and trading of carbon credits (Bomfim et al., 2022).
However, as the voluntary carbon market develops, concerns have been raised about the environmental integrity of carbon offset projects and the potential over-issuance of carbon credits (Probst et al., 2024). Several studies have also highlighted discrepancies between the actual carbon benefits and the carbon credits issued in forest carbon projects (Badgley et al., 2022; Probst et al., 2024; West et al., 2023). Accordingly, there is growing demand for carbon-pricing mechanisms that align protocol rules with robust scientific evidence, ensuring that crediting is more accurate and conservative. Such improvements would help redirect carbon financing toward projects that deliver genuine climate-mitigation outcomes (Haya et al., 2023).
From the perspective of forestry businesses, although accounting rules for carbon benefits have improved, they still do not fully capture the mitigation potential of the forest sector. This underscores the need to account for the trade-off between carbon sequestration in forests and emission reductions achieved through wood utilization (Tsukada and Matsumoto, 2024). Beyond carbon sequestration in forest ecosystems, forest-based mitigation also encompasses carbon storage in HWPs and avoidance of emissions through improved management practices, material substitution, or energy substitution (European Forest Institute, 2022). However, these components are often not fully reflected in existing carbon crediting frameworks.
In these contexts, this study hypothesized that activating forest management would generate greater carbon benefits than the conventional passive practices in South Korea. Specifically, it was assumed that active forest management would provide additional carbon benefits across the supply chain, such as (1) carbon sequestration in forests, (2) carbon storage in HWPs, (3) reduced transportation-related emissions, and (4) energy substitution, compared to passive forest management (Figure 1). Based on this framework, this study aimed to (1) assess the overall effectiveness of the integrated supply chain—from forest management to processing and renewable energy generation—using a life cycle analysis perspective; (2) identify more effective strategies for the forest sector; and (3) propose additional incentive for forest management through carbon crediting mechanisms that account for the integrated carbon benefits of forest-based activities.
Figure 1

Carbon flow in the project. Solid lines represent flows included in carbon benefits and dotted lines represent flows excluded. *Variable definitions: NEE, net ecosystem exchange; H, harvested wood transported from forests; EDOM, emissions from HWP in own country made from wood harvested from domestic forests; EEX DOM, emissions from HWP in other countries made from wood exported abroad that were made from wood harvested from own country’s forests; EIM, emission from imported HWP in own country; EEX OTH, emissions from HWP in other countries made from wood harvested in other countries; PEX, exports of HWP including roundwood, wood-based waste and refined products; PIM, imports of HWP including roundwood, wood-based waste and refined products; TIM, emissions from ocean transportation; TDOM, emissions from land transportation.
2 Materials and methods
2.1 Study area
The study area (Figure 2)—Goesan-gun with a population of 36,252 in 2024—is recognized as one of the leading districts in forest management in South Korea. Over the past decade, the mean annual temperature was 12.5 °C and the mean annual precipitation averaged 1,237 mm. The main industry in the district is agriculture, emphasizing the district’s environment-friendly and sustainability-oriented identity, which is highlighted by the slogan, Clean Goesan (Goesan-gun, 2024; Lee et al., 2024; KOSIS National Statistical Portal, 2024). Forests occupy approximately 76% of Goesan-gun’s total area, with an average growing stock of 175.2 m3/ha in 2022. This value is higher than the global average of 132.7 m3/ha but lower than that of South America (222.1 m3/ha in 2020) (Supplementary Figure S1; FAO, 2024; Korea Forest Map Service, 2024).
Figure 2
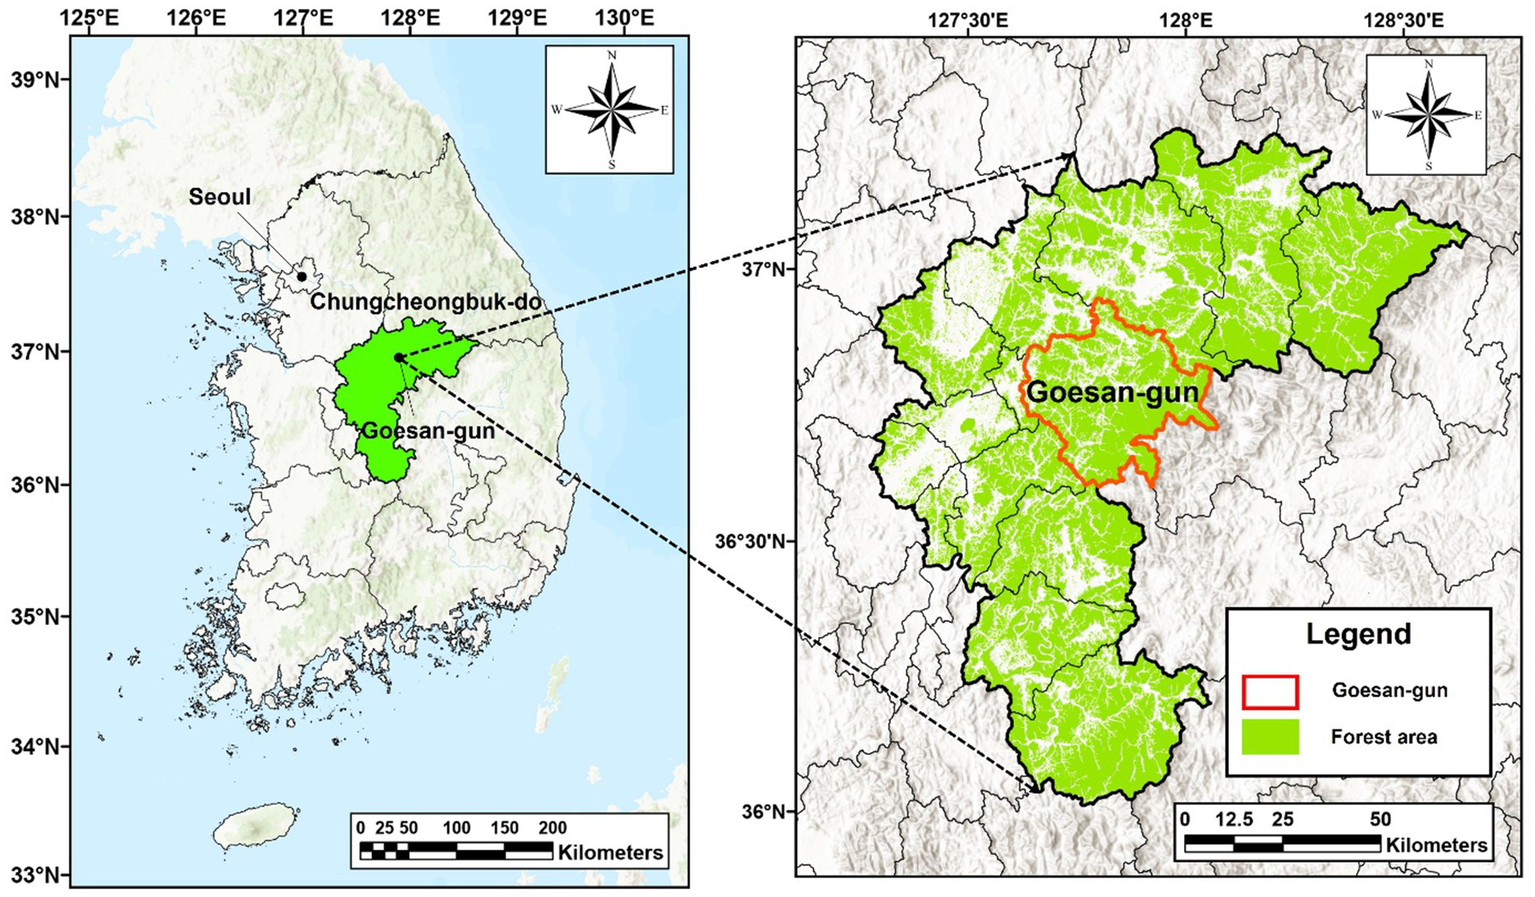
Location and forest cover of the study area, Goesan-gun, a district of Chungcheongbuk-do of South Korea.
In South Korea, most forests were severely degraded during the Japanese colonial period, and this degradation was further exacerbated after liberation in 1945 due to population growth and the unregulated extraction of forest resources. Following the establishment of the Korea Forest Service in 1967, national forest policies were implemented through large-scale reforestation and erosion-control projects, accompanied by extensive public participation (Kim, 2020). As a result, forests in South Korea largely regenerated as even-aged stands dominated by early-successional species, particularly pine, which are well adapted to disturbed environments. With the progression of secondary succession, species composition has gradually shifted toward more shade-tolerant species such as oaks, a trend that is also evident in the study area, although pine forests still account for the largest area among single-species stands (Supplementary Table S1; Kim et al., 2024).
These forests now exhibit structural characteristics consistent with the later stages of their average stand life cycle. As they continue to age—particularly stands dominated by pioneer species whose growth declines with advancing age under both progressive and disturbance-driven succession (Choung et al., 2020)—the proportion of trees older than 50 years, currently around 10%, is projected to exceed 70% by 2050. This demographic shift is expected to reduce the annual growth of standing trees from 4.3 m3 yr.−1 to 1.9 m3 yr.−1, corresponding to a decline of over 50% in NPP (Han et al., 2021). Moreover, many forest stands have now reached or exceeded the average regulated rotation age of the dominant species, indicating that they are entering the later stages of their management life cycle. Forests in Goesan-gun reflect this broader regional pattern: tree ages are relatively homogeneous, primarily ranging from 30 to 60 years, and 92.5% of the forest area is classified as high-density (Supplementary Table S2; Korea Forest Map Service, 2024). These conditions indicate that forest management intervention—such as thinning and regeneration—is necessary to rejuvenate forest stands and sustain long-term carbon sequestration capacity (Lee et al., 2022; Robinson et al., 2025; Nishizono et al., 2008a).
In 2022, the Korea Forestry Promotion Institute and Goesan-gun signed an agreement to advance sustainable forest management and subsequently established a working group comprising asset managers, local forest managers, and a forest biomass company. The objective was to develop a regional-scale best practice for forest management. In 2023, the working group designed an integrated forest supply-chain model spanning forestry operations, wood processing, and biomass energy utilization (the project) and has since been implementing it in a stepwise manner (Figure 3; Korea Forestry Promotion Institute, 2024).
Figure 3
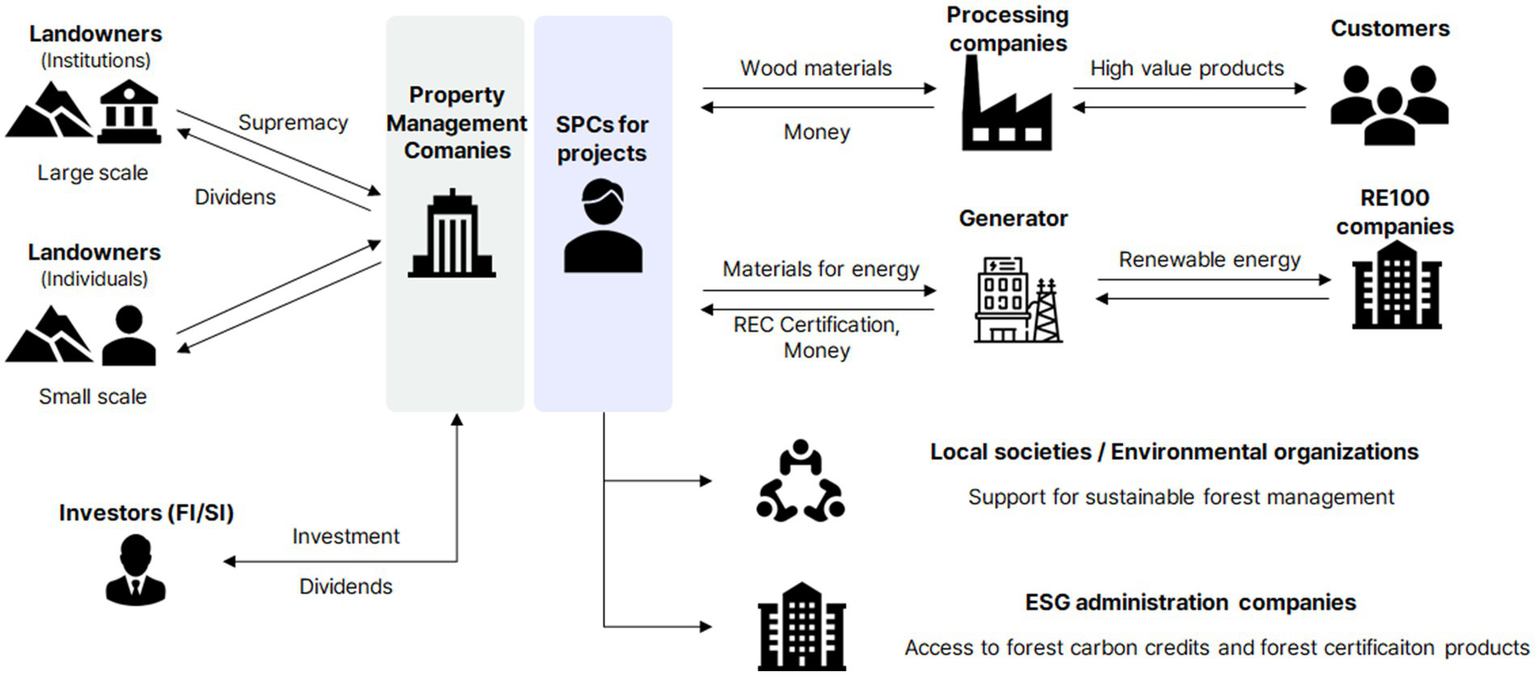
Value chain of integrated forest management used in this study.
2.2 Forest management scenario
The main scenario of the project was to consolidate numerous small-scale private forests into a set of integrated management units and manage them through a professional forest management company capable of achieving sustainable economies of scale (Figure 3). This approach aligns with the policy announced by the Korea Forest Service in 2022, which aims to promote sustainable circular forest management and enhance the utilization of domestic wood to expand carbon storage (Ahn et al., 2022).
To achieve these policy objectives, South Korea must address several long-standing challenges in its forestry sector—including species-related imitations, low wood prices, insufficient forest management infrastructure, highly fragmented small-scale ownership, weak linkages between upstream and downstream industries, and excessive regulatory constraints—all of which require substantial investment (Min et al., 2017). By involving financial investors, the project can secure funding for establishing supply-chain industries, wood-processing facilities, and a local combined heat and power plant that utilizes products from the project areas. Investors are increasingly attracted to forestry because it aligns with their ESG objectives, offering benefits such as carbon sequestration, the supply of renewable materials, and contribution to the local economy (Chudy et al., 2020).
The total management area over the 40-year project period was 22,900 ha, consisting of 18,900 ha for thinning (900 ha yr.−1 with a 20-year rotation) and 4,000 ha for clear-cutting (100 ha yr.−1) (Table 1). The 40-year project duration reflects the regulated rotation age of major species—such as red pine, other conifers, chestnut, birch, and other broadleaved species—which together occupy approximately 47% of the provincial forest area. Aligning the project duration with the rotation age ensures that all regeneration areas undergo at least one harvest-regeneration cycle during the project period. Thinning volume was limited to the annual increment of each stand to maintain and enhance forest carbon stock (Ali et al., 2025). Accordingly, this study applied a 20% retention rate for clear-cutting, following Korean regulation, and a thinning intensity of 20%, which is lower than the regulatory maximum of 30% (Table 1; Korea Forest Service, 2023a). These approaches were expected to improve growth conditions in thinning areas and promote regeneration with more climate-adapted species in clear-cutting areas, thereby helping to counteract declining NPP while producing wood materials to meet societal demand.
Table 1
| Classification | Contents | |
|---|---|---|
| Project periods |
|
|
| Forestry sector | Scale of management |
|
| Harvesting (Clear cutting) |
|
|
| Thinning |
|
|
| Commodity |
|
|
| Processing sector | Installment |
|
| Procurement |
|
|
| Yield rate |
|
|
| Commodity |
|
|
| Energy sector | Installment |
|
| Procurement |
|
|
| Commodity |
|
|
Scenarios of integrated forest management in the project.
2.3 CO2 flux in forest management
This study compared net CO2 flux of three scenarios: (1) the baseline scenario (S1), representing passive forest management at the current national level; (2) the project control scenario (S2), representing active forest management as designed in the project but without accounting for the tending effects of thinning, to isolate the additional growth attributable to forest management; (3) the project scenario (S3), representing active forest management that incorporates the additional increment effect of thinning (Table 2; Lee et al., 2022).
Table 2
| Scenarios | Management | Species change from regeneration | Tending effect from thinning |
|---|---|---|---|
| (1) Passive forest management (national level) | Producing 0.437% of growing stock | None | Not reflecting |
| (2) Active forest management not reflecting the tending effect | Clear-cutting and regeneration in 100 ha/y, Thinning in 900 ha/y | (contemporary) Red pine, Mongolian oak → (Regeneration) Larch, Oak tree | Not reflecting |
| (3) Active forest management reflecting tending effect | (Same as above) | (Same as above) | Reflecting |
Differences among the three scenarios used in this study.
To predict NPP over the 40-year project period, this study estimated and compared the age-class composition and growing stock of forests under the three scenarios, accounting for harvest removals (thinning and clear-cutting) and subsequent regrowth through regeneration. Volume growth was estimated using the “Table of growing stock, biomass and harvest” developed by the National Institute of Forest Science, which provides national-level average growth rates by species and age for forests in South Korea (National Institute of Forest Science, 2014).
Reflecting current forest statutes in Chungcheongbuk-do, the species selected for growth projection were (1) red pine for conifer forests, (2) oak tree for broad-leaved forests, and (3) a 50:50 mixture of red pine and oak for mixed forests (Korea Forest Service, 2023d). In regenerated forests, Larix kaempferi and oriental chestnut oak were chosen to replace red pine and oak, relatively, as they are the most widely planted species in the province (Supplementary Table S1; Korea Forest Service, 2023d). To account for the tending effect—defined as the enhancement of tree growth through artificial treatments such as thinning and pruning—an annual growth improvement of 0.46% was assumed, based on a previous study quantifying the thinning effect in South Korea (Kwon et al., 2007).
Active forest management—including thinning and harvesting—alters the age-class structure and growth environment of forest stands by creating additional growing space, thereby influencing carbon sequestration (Ali et al., 2025). Carbon stock was estimated by multiplying the projected growing stock by carbon-related coefficients, including wood density, biomass expansion factors, and root-to-shoot ratios (Equation 1; Supplementary Tables S3, S4; Forest Carbon Center, 2022). Net CO2 flux was then calculated by subtracting CO2 emissions associated with harvested biomass—including branches and roots—from total CO2 stock across the project area (Equation 2; Figure 4). For forest residues, branches were assumed to be used as a biomass energy source, whereas leaves were assumed to remain on-site and decompose gradually over 4 years (Cha et al., 2017). Although a portion of these residues may ultimately contribute to SOC during decomposition, this study did not account for this effect due to limited scientific understanding of how forest debris influences soil carbon cycling (Fan et al., 2023; Shannon et al., 2022).
Figure 4
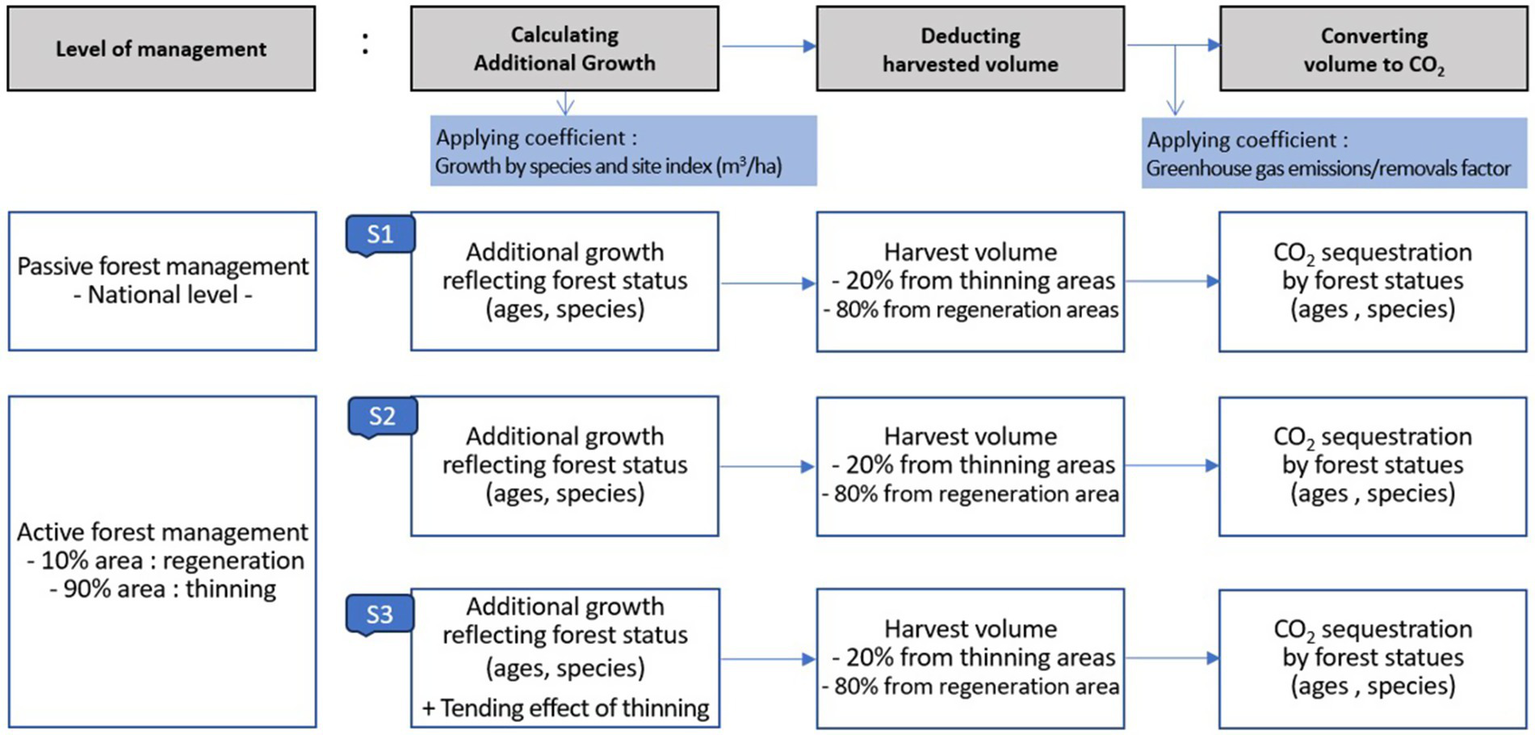
Calculation of growth and carbon sequestration under three scenarios (S1–S3) in this study.
Where CV, V, BEF, RR, WD, and CF represent the carbon stocks in living biomass (including above- and belowground biomass), tree volume, the biomass expansion factor used to convert tree volume to aboveground biomass, the root-to-shoot ratio, basic wood density, and the carbon fraction of dry matter, respectively (Son et al., 2014; Forest Carbon Center, 2022; Lee et al., 2025).
2.4 CO2 storage effect from the integrated supply chain
The project involved a series of processes in which forest resources were harvested, with some converted into wood products and others used as energy sources, necessitating a process-based evaluation that assesses inputs, outputs, and potential environmental impacts across the entire production system (Kim and Heo, 2022; Lippke et al., 2011). Therefore, evaluating the carbon benefits of the project also requires consideration of changes at each stage of the supply chain and trade-offs between these steps (Supplementary Figure S2).
For roundwood production, volumes were calculated separately by area according to harvest methods—clear-cutting or thinning—using national statistics for the South Korean wood industry (Korea Forest Service, 2023b). The harvested roundwood was then allocated to the three product types: woodchips for energy, sawnwood, and other biomass for medium-density fiberboard (MDF), which were selected in the project to maximize mitigation effects through fossil fuel substitution and carbon storage in HWPs (Figure 5). Input volumes for these three commodities were determined by reclassifying 15 categories from the national statistics on roundwood production and utilization into the corresponding four commodities (Supplementary Figure S3; Korea Forest Service, 2023b). Final products at the processing stage were estimated by multiplying the roundwood volume by the average yield rate of wood processing, based on national statistics for the South Korean wood industry (Figure 6; Korea Forest Service, 2023b). Among wood products, sawnwood and other biomass for MDF were classified as long-lived wood products, storing carbon over extended periods (Gregor et al., 2024).
Figure 5
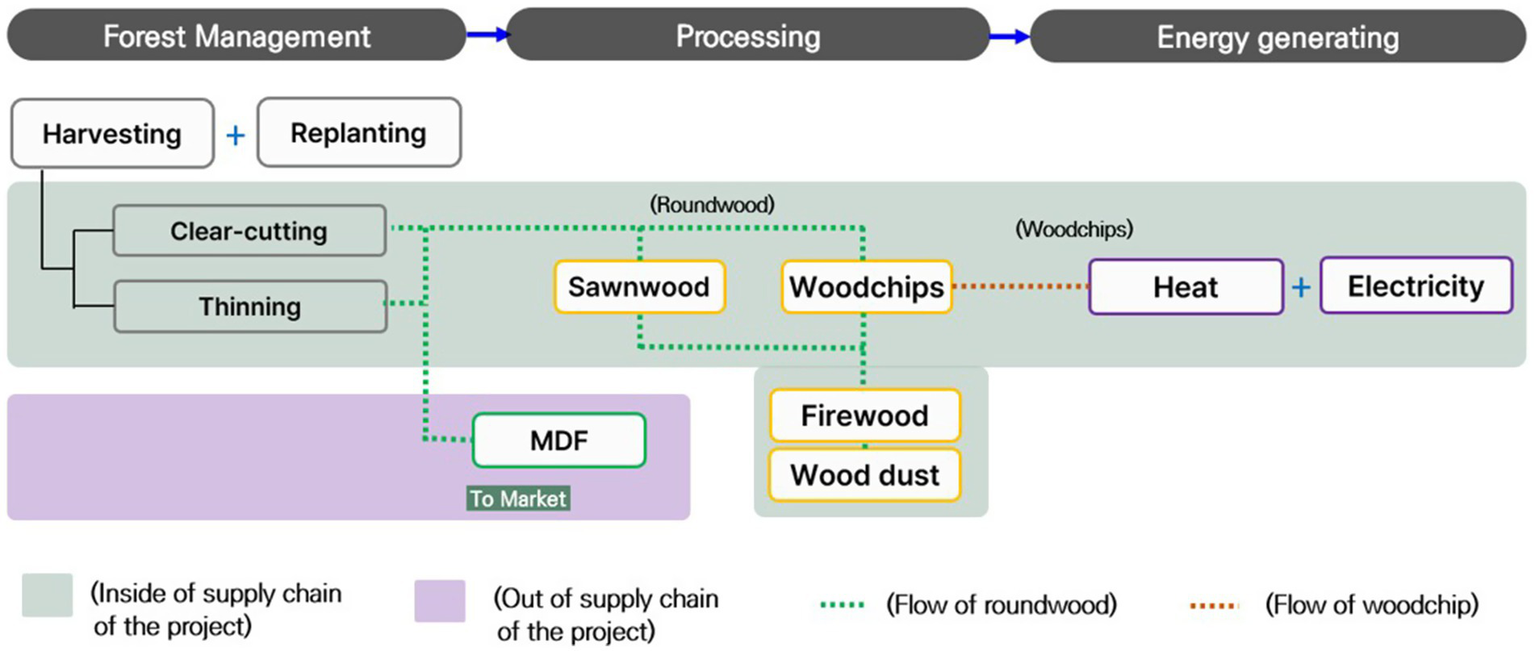
Supply chain of the integrated forest management system in this study. Most forest materials are used within the supply chain for sawnwood production and woodchip-based energy generation, whereas roundwood for MDF production is supplied outside the supply chain.
Figure 6
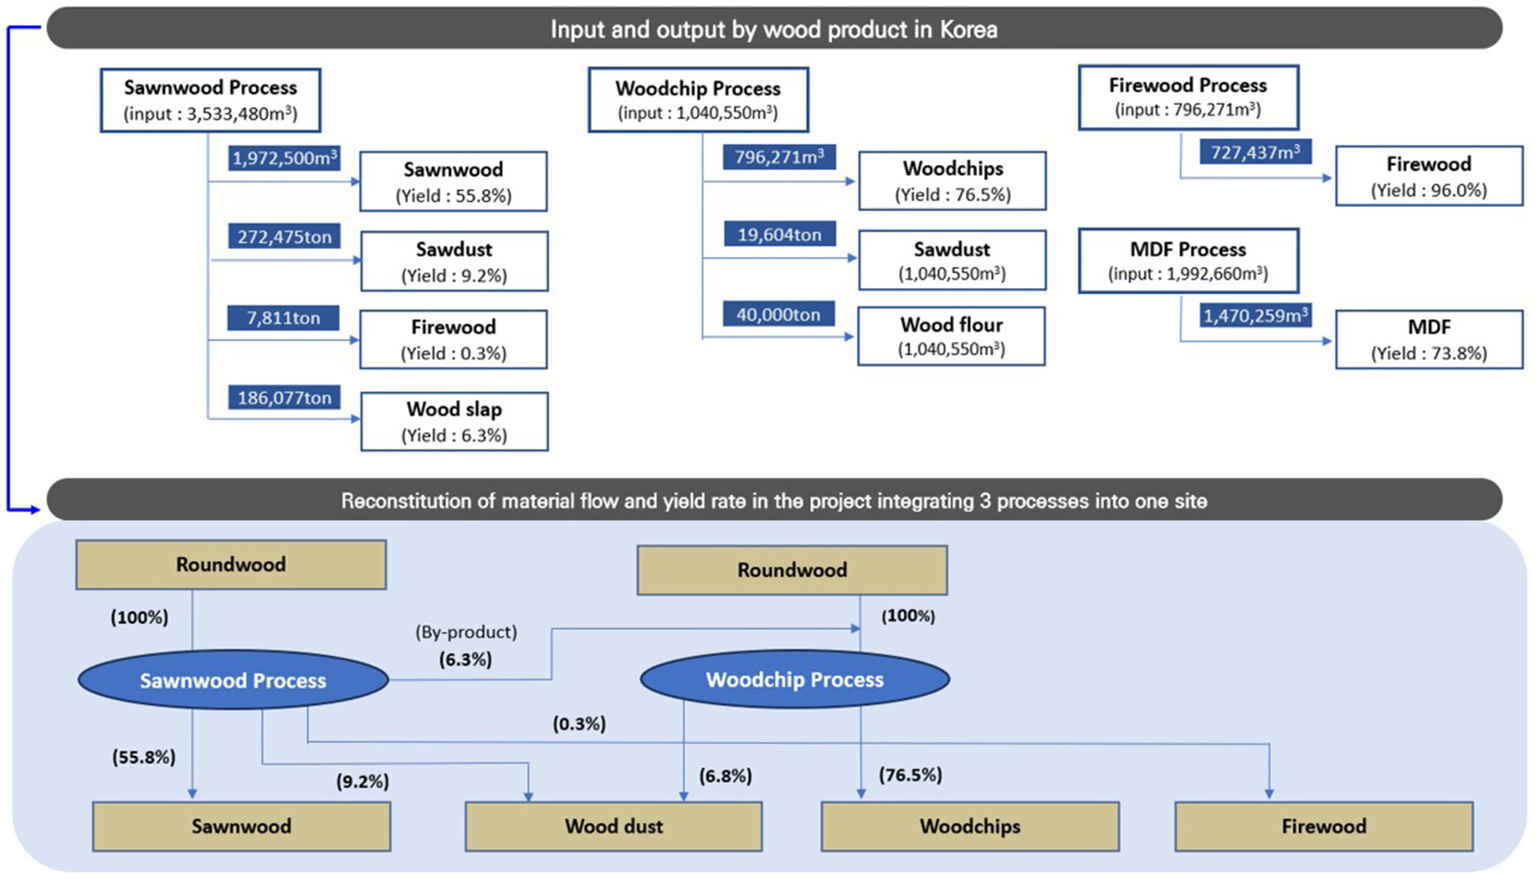
Yield rates of each processing step based on the statistics of input and output volumes by products in 2022 used in this study. A conversion factor of 0.84 was applied to convert volume to weight.
To estimate the carbon storage effect of HWPs, specifically sawnwood and MDF, this study applied the wood product usage methodology of the Korea Forest Carbon Offset Scheme (KFCOS), which is largely consistent with the IPCC guidelines while incorporating country-specific factors in Tier 2. The analysis also took into account the decay of wood over time, providing more conservative estimates of mitigation effects [Table 3 and Supplementary Table S5; Forest Carbon Center, 2022; IPCC (Intergovernmental Panel on Climate Change), 2006].
Table 3
| Category | Formula | Abbreviations |
|---|---|---|
| Net storage | BSt = 3.664 × Bt – LEt | BSt: Net CO2 store during t-period |
| Bt: Carbon store in wood products during t-period | ||
| LEt: CO2 leakage during t-period | ||
| Storage | Bt = × Hi | Hi: Average carbon store of wood product type i |
| Hi = (HGi – HLi) × WD × CF × FR | HGi: Use volume of wood product type i | |
| HLi: Removal volume of wood product type i | ||
| WD: Basic wood density | ||
| CF: Carbon fraction of dry matter | ||
| FR: Average carbon storage rate over 100 years | ||
| Leakage | LEt = BSt × 2% (BSy < 3,000tCO2) | BSy: Annual net CO2 storage |
Formula of the wood product use methodology.
2.5 CO2 reduction effect from the integrated supply chain
Woodchips produced from the project were used for energy generation at a combined heat and power (CHP) plant. This substitution effect reduces greenhouse gas (GHG) emissions by replacing fossil fuels with biogenic materials, which can subsequently reabsorb CO2 through forest regrowth (Ofoegbu, 2023). Biomass extraction differed across scenarios: under the passive forest management scenario, forest residues were collected only from clear-cutting areas, whereas under the active forest management scenario, residues were extracted from both thinning and clear-cutting sites. This approach reflects current practices in South Korea, where 96.3% of forest residues are collected from harvesting operations, while only 3.7% originated from forest tending activities (Yang et al., 2022). Although this difference may influence SOC dynamics across scenarios, its impact is likely to be small because the variation arises only from branches, and only a limited portion of them—potentially around 7.3%—is converted to SOC (Fan et al., 2023).
To calculate GHG reductions from substituting fossil fuels with forest biomass, this study followed a three-step procedure: (1) calculating the amount of heat and electricity generated from forest biomass; (2) determining the equivalent amount of fossil fuel—specifically diesel—based on its thermal energy conversion rates; and (3) converting the corresponding diesel use into GHG emissions using the appropriate emission factors. All steps employed nationally standardized emission and energy-conversion factors [Table 4; EG-TIPS (Energy Green House Gas Totol Information Platform Service), 2024]. GHG emissions inherent in woodchips were not counted separately, as they were already included in the emissions from the harvesting phase.
Table 4
| Category | Conversion factors | Formulas |
|---|---|---|
| Electricity | ① 1 kWh = 8.9 MJ | |
| ② Diesel 1 ℓ = 37.8 MJ | ||
| Thermal energy | ① 1 Gcal = 106 kcal | |
| ② Diesel 1 ℓ = 9,020 kcal | ||
| CO2 emission | ||
Formulas for calculating the amount of fossil fuel used for heat and electricity production and the associated CO2 emissions.
Another mitigation aspect of the project was the reduction in transportation of wood products, including raw materials, 85% of which are currently sourced from abroad in South Korea (Korea Forest Service, 2023c). Procuring raw materials and wood products domestically can shorten transportation distances, thereby reducing associated GHG emissions (Hülagü et al., 2025). To evaluate GHG reductions by sourcing wood materials within the district, results were compared with a baseline scenario in which wood was imported from Vietnam, the largest timber exporter to the Korean market (Forest Products Trade System, 2024). GHG emissions from ocean transportation were estimated using the MSC carbon calculator, provided by the world’s largest shipping company [MSC (Mediterranean Shipping Company), 2024]. For land transportation of processed wood products, it was assumed that materials were transported from Goesan-gun to Seoul, the region with the largest population, using an emission factor of 0.88433 kgCO2e per km for a 17-ton truck (Richardes and Grinsted, 2024).
3 Results and discussion
3.1 CO2 benefits from forest management
This study examined changes in age-class structure between passive forest management at the current national level in South Korea—0.37% of clear-cutting and 1.41% thinning of the total forest area—and the active forest management of the project area—0.44% clear-cutting and 3.93% thinning of the project area (Table 5 and Supplementary Table S6). Compared to passive management, active forest management resulted in a higher proportion of trees in age classes 1–4 and a lower proportion in age classes 9–10, thereby forming a more balanced age structure, which is expected to enhance the NPP and CO2 sequestration capacity of the forests (Robinson et al., 2025; Nishizono et al., 2008b). With respect to growing stock after 40 years, S1 exhibited the largest volume at 5,701,698 m3, followed by S3 with 4,827,040 m3 and S2 with 4,392,245 m3. Similarly, in terms of net CO2 flux, S1 achieved the highest amount at 3,625,401 tCO2e, followed by 1,901,418 tCO2e for S3 and 967,046 tCO2e for S2, including carbon stored in forest residues (Table 6; Supplementary Table S7; Supplementary Figure S4).
Table 5
| Category | –10ya | 10–20 | 21–30 | 31–40 | 41–50 | 51–60 | 61–70 | 71–80 | 81–90 | 91–100 | Total | |
|---|---|---|---|---|---|---|---|---|---|---|---|---|
| Current situation | Area | 1,821 | 801 | 914 | 7,612 | 10,948 | 804 | – | – | – | – | 22,900 |
| (%) | (8.0) | (3.5) | (4.0) | (33.2) | (47.8) | (3.5) | – | – | – | – | (100) | |
| Volume | 27,256 | 37,744 | 134,869 | 1,308,803 | 2,293,880 | 202,708 | – | – | – | 4,005,262 | ||
| (%) | (0.68) | (0.94) | (3.37) | (32.68) | (57.27) | (5.06) | – | – | – | – | (100) | |
| ↓ | ||||||||||||
| Passive forest management in 40 y (S1) | Volume | 17,058 | 48,070 | 89,420 | 131,207 | 167,908 | 22,558 | 155,877 | 1,984,597 | 2,985,734 | 99,268 | 5,701,698 |
| (%) | 0.30% | 0.84% | 1.57% | 2.30% | 2.94% | 0.40% | 2.73% | 34.81% | 52.37% | 1.74% | (100) | |
| vs | ||||||||||||
| Active forest management in 40 y (S2) | Volume | 20,133 | 56,734 | 105,536 | 154,854 | 243,269 | 120,484 | 199,896 | 1,368,867 | 1,973,354 | 149,118 | 4,392,245 |
| (%) | 0.44% | 1.25% | 2.32% | 3.41% | 5.64% | 2.78% | 4.58% | 31.26% | 44.94% | 3.39% | (100) | |
Changes in forest age-class structure under the scenarios in this study.
Unit: ha, m3.
The y in this table represents year.
Table 6
| Scenario | Carbon sequestration (tCO2e) | Carbon emission (tC) | CO2 emission (tCO2e) | Net CO2 sequestration (tCO2e) | ||
|---|---|---|---|---|---|---|
| Standing trees | Residues | Sub-total ② | ③ | ① = ②−③ | ||
| S1 | 5,424,459 | 36,379 | 5,460,839 | 500,574 | 1,835,438 | 3,625,401 |
| S2 | 7,485,639 | 148,832 | 7,634,471 | 1,818,389 | 6,667,425 | 967,046 |
| S3 | 8,704,758 | 163,390 | 8,868,149 | 1,900,017 | 6,966,730 | 1,901,418 |
Net CO2 flux in the project forests.
Younger forest stands generally exhibit higher NPP than older stands (Nishizono et al., 2008b). In the project area, located at approximately 37° N—the center of South Korea—the majority of the trees were over 40 years old, with expected growth during the project period representing only 38.9% of that in newly established coniferous forests and 65.4% in broad-leaved forests (Figure 7). This pattern is consistent with the declining net carbon flux observed in South Korean forests (Korea Forest Service, 2023b).
Figure 7
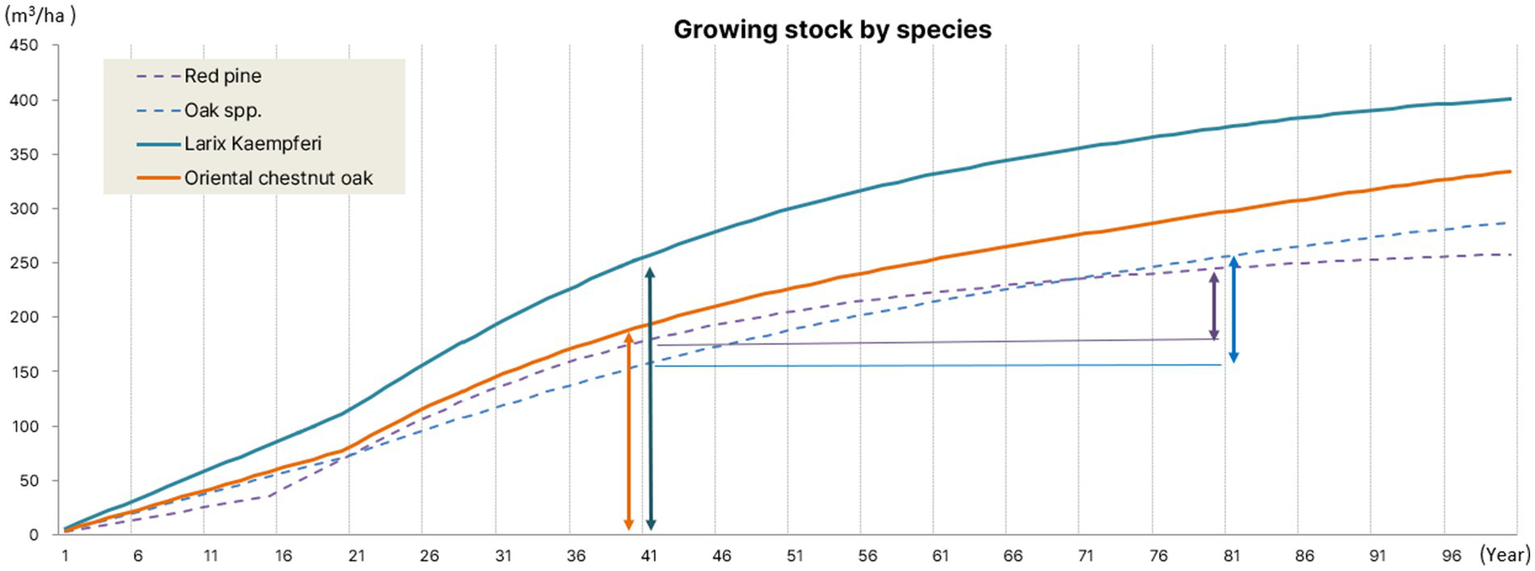
Growing volume per hectare for each species by age class in this study.
Nonetheless, active forest management requires substantially more time for biogenic volumes to recover compared to passive forest. This indicates that CO2 sequestration benefits from enhanced growth through tree replacement and improved age-class structure cannot fully offset the increased emissions from harvesting over the 40-year project period. These findings underscore the need to consider the complex interactions between forest management practices and carbon dynamics, highlighting the importance of adopting light to moderate thinning strategies (Ali et al., 2025).
As active forest management may have adverse effects on carbon sinks within the 40-year period, it is important to implement forest management under careful control, taking into account forest characteristics such as species composition, site quality, health status, and age structure (Zengin and Ünal, 2019). However, over the longer term, S3 is likely to provide greater forest carbon benefits beyond this timeframe, as trees over 50 years old in S1 are expected to experience a dramatic decline in growth due to reduced NPP and increased vulnerability to insects and pests (Figure 7; Nishizono et al., 2008b; Seo et al., 2018). Recent modeling of European commercial forests also suggests that actively managed forests can sequester substantially more carbon over the long term than unmanaged stands, while simultaneously delivering economic value through optimized wood use and growth conditions (Yousefpour et al., 2018).
3.2 Carbon storage effect from the integrated supply chain
In contrast to CO2 sequestration in forests, S3 stored the most carbon among the three scenarios, with 341,874 tC, compared to 327,187 tC for S2 and 110,872 tC for S1, corresponding to 1,251,769, 1,199,684, and 406,529 CO2e, respectively (Table 7). This outcome is primarily attributed to higher roundwood production under S3 and S2—2,366,923 m3 and 2,265,235 m3, respectively, compared to 867,563 m3 in S1. Of these volumes, the amounts processed into long-lived wood products, including sawnwood and MDF, were 1,349,370 m3, 1,291,413 m3, and 437,613 m3, corresponding to the carbon storage reported above.
Table 7
| Category | Sawnwood (Softwood) | Sawnwood (Hardwood) | MDF | |
|---|---|---|---|---|
| Amount | S1 | 76,259 m3 | 3,431 m3 | 357,923 m3 |
| S2 | 225,044 m3 | 10,125 m3 | 1,056,245 m3 | |
| S3 | 235,172 m3 | 10,578 m3 | 1,103,619 m3 | |
| ↓ | ||||
| (Conversion formula) = × (HGi – HLi) × WD × CF × FR (refer to Supplementary Tables S4 and S5) | ||||
| Parameter | WD | 0.46 | 0.68 | 0.57 |
| CF | 0.5 | 0.5 | 0.5 | |
| FR | 0.463 | 0.250 | 0.582 | |
| Period | 40 | 40 | 40 | |
| ↓ | ||||
| Carbon storage | S1 | 16,107 tC | 963 tC | 93,802 tC |
| S2 | 47,531 tC | 2,843 tC | 276,813 tC | |
| S3 | 49,665 tC | 2,970 tC | 289,239 tC | |
Carbon mitigation effects through storage in wood products.
In terms of carbon storage efficiency in HWPs, carbon losses from forest harvesting were substantially greater than the storage effect of HWPs—1,117,038 tC versus 341,874 tC, a 3.3-fold difference in S3. This trade-off between carbon storage effect in HWPs and emissions from harvesting has been highlighted in previous studies (Ali et al., 2025; Brown et al., 2023; Soimakallio et al., 2021). Specifically, biomass losses during harvesting—including portions of stems, crowns, and roots—tend to exceed the carbon stored in HWPs, which primarily utilize stems (Yue et al., 2018). Furthermore, in this study, the storage effect of HWPs accounted for the future decay rate of wood products and was limited to the 40-year project period, excluding potential effects beyond this timeframe [IPCC (Intergovernmental Panel on Climate Change), 2006].
Another important consideration is the utilization rate of harvested roundwood for long-lived wood products. In the project, 81.8% of harvested roundwood—1,935,990 m3 out of 2,366,923 m3—was assumed to be processed into long-lived wood products, comprising 440,186 m3 for sawnwood and 1,495,804 m3 for MDF, based on input volume. This 81.8% share is an aspirational assumption, reflecting a management strategy in which harvested roundwood is primarily allocated to long-lived wood products in order to explore the upper-bound climate mitigation potential of the highly integrated and proactive scenario examined in this study. This value is substantially higher than the current national average in South Korea (59.3%, Supplementary Figure S3; Korea Forest Service, 2023b). Nevertheless, South Korea has a relatively high potential to allocate domestic roundwood to long-lived wood products compared with many other countries, owing to its well-established MDF industry (Chang et al., 2018; Jang and Youn, 2021). Furthermore, future advances in wood processing technologies—including the development of innovative wood products, extended service life of each end-use products and improved recycling and processing efficiencies—may further enhance the mitigation potential of HWPs beyond the estimates presented in this study (Li et al., 2022). The importance of carbon storage in HWPs is widely recognized, with global stocks estimated at approximately 5 Gt in 2010 (Kouamé and Ghannadzadeh, 2023).
3.3 CO2 reduction effect from the integrated supply chain
The GHG reduction effects of the project were categorized into two components: (1) fossil fuel substitution and (2) reduced transportation distance through district-level sourcing of wood materials. Consistent with the CO2 storage effects of HWPs, S3 achieved the greatest reduction, totaling 1,083,082 tCO2e, followed by 1,036,543 tCO2e for S2 and 213,647 tCO2e for S1. This outcome reflects the greater volume of raw materials replaced by domestic sources and the larger amount of fossil fuel substituted with forest biomass under S3 and S2 compared to S1 (Tables 8, 9).
Table 8
| Formula | Reduction effect |
|---|---|
| ①-1: Quantity of diesel required for thermal energy production | 299,006 tCO2e |
| = 107,383,297 ℓ | |
| ①-2: Formula of alternative effect of thermal energy production | |
| × | |
| Calorific value of diesel: 37.8 MJ/ℓ/ Emission factor of diesel: 20.09 tC/TJ | |
| ②-1: Quantity of diesel required for electricity production | 536,727 tCO2e |
| = 192,757,099 ℓ | |
| ②-2: Formula of alternative effect of electricity production | |
| × |
Mitigation effects from energy substitution in S3.
Emissions of carbon contained in woodchips during energy generation are not included, as they are accounted for at the harvesting stage.
Table 9
| Category | Base Line | Project Line (Scenario 3) | |||||||||
|---|---|---|---|---|---|---|---|---|---|---|---|
| Importing wood products (Vietnam to Seoul) | Producing in Goesan and transporting to Seoul | ||||||||||
| Wood chips | Sawn wood | Fire wood | Wood dust | Round wood | Wood chips | Sawn wood | Fire wood | Wood dust | Round wood | ||
| Amount (tons) | 890,030 | 206,430 | 973 | 139,130 | 1,256,429 | 890,030 | 206,430 | 973 | 139,130 | 1,256,429 | |
| Land (Forest → Mill → Port) | Distance (km) (in Vietnam or Korea) | 130 | 130 | 130 | 130 | 130 | 30 | 30 | 30 | 30 | 30 |
| Emission (tCO2e) | 6,019 | 1,396 | 7 | 941 | 8,497 | 1,389 | 322 | 2 | 217 | 1,961 | |
| Ocean (Port → Port) | Distance (km) (Hai Phong to Incheon) | 8,114 | 8,114 | 8,114 | 8,114 | 8,114 | – | – | – | – | – |
| Emission (tCO2e) | 86,422 | 20,044 | 94 | 13,510 | 121,999 | – | – | – | – | – | |
| (Land) (Port → Market) | Distance (km) (in Korea) | 42 | 42 | 42 | 42 | 42 | 30 | 141 | 141 | 141 | 141 |
| Emission(tCO2e) | 1,945 | 451 | 2 | 304 | 2,745 | 1,389 | 1,514 | 7 | 1,020 | 9,216 | |
| Emission (tCO2e) | 94,385 | 21,891 | 103 | 14,754 | 133,241 | 2,778 | 1,836 | 9 | 1,238 | 11,176 | |
Difference in CO2 emission between importing raw materials from Vietnam and procuring them from the project in S3.
Vietnam was the biggest wood exporter to South Korea in 2022. Ocean transportation emissions were calculated by a program called as the MSC carbon calculator. For the land transportation emissions, it was assumed that the market is Seoul, where the largest population resides. Emissions were calculated by multiplying the transportation distance by an emission factor of 0.88433 kg CO2e/km for a large truck (17 tons).
The heat energy produced by the energy sector amounted to 968,597 Gcal, and electricity generation totaled 818,676 MWh, corresponding to 107,383 kL and 192,757 kL of diesel, respectively, in the project. Applying the diesel emission coefficient of 20.09 tC/TJ, as specified in the Energy Green House Gas Tool Information Platform Service (EG-TIPS), the total CO2 emissions were estimated as 835,733 tCO2e (Table 8). When considering the inherent carbon contained in raw materials—1,059,560 m3 of roundwood and by-products amounting to 2,118,947 tCO2e, including branches and roots—it becomes evident that substantial carbon losses occur during the short-term conversion of wood biomass to energy. This result mirrors the pattern observed in the HWP storage assessment, in part due to the exclusion of leaves and roots from wood utilization (Soimakallio et al., 2021).
Another mitigation effect considered in this study was the reduction in transportation-related emissions. By establishing a localized forestry supply chain, wood products—including woodchips, sawnwood, firewood, wood dust, and MDF—produced within the project can replace imported materials, thereby reducing transportation distances, a critical factor given the high volume and weight of wood products (Lijewski et al., 2017). The transportation sector is also a significant source of GHG emissions, reaching globally 1,076 MCO2e in 2018 (Yu et al., 2021). The total quantity of wood products generated by the project was 2,492,993 tons (by weight), associated with an avoided ocean transport distance of 8,114 km (Table 9). As a result, total transportation emissions were estimated at 17,037 tCO2e, representing a substantial reduction from the baseline value of 264,375 tCO2e—a decrease of 93.9%, equivalent to 247,338 tCO2e (Table 9; Lijewski et al., 2017).
3.4 Total effect of GHG mitigation
As discussed in Section 3.1, “CO2 benefits from forest management”; when considering only the carbon flux of standing trees, the passive forest management (S1) was more effective within the 40-year project period. However, when accounting for additional effects, such as carbon storage in HWPs, substitution of fossil fuels, and reduced emissions from shorter transportation distances, the overall carbon benefits of the two scenarios became more comparable, although passive management still results in slightly greater mitigation than active management (Table 10; Pilli et al., 2015).
Table 10
| Scenario | Carbon sequestration | Alternative effect of fossil fuel | Mitigation effect from transportation | Carbon storage in wood products | Total | ||
|---|---|---|---|---|---|---|---|
| Standing trees | Forest residues | Sub-total | |||||
| S1 | 3,589,021 | 36,379 | 3,625,401 | 150,089 | 63,558 | 406,529 | 4,245,577 |
| S2 | 818,215 | 148,832 | 967,046 | 799,820 | 236,722 | 1,199,684 | 3,203,273 |
| S3 | 1,738,028 | 163,390 | 1,901,418 | 835,733 | 247,349 | 1,251,769 | 4,236,270 |
Total mitigation effects across the three scenarios in this study.
Unit: CO2e.
Although these results differed from the initial hypothesis—that activating forest management would provide greater carbon benefits than the conventional passive approach in South Korea—consideration of additional effects, such as substituting high carbon-intensity materials with wood products, indicates that active forest management integrating the forest supply chain at the regional level can indeed deliver greater overall carbon benefits (Supplementary Table S8). Furthermore, improvements in age-class distribution and species composition achieved through active forest management are expected to enhance climate mitigation potential over longer time horizons (Dalmonech et al., 2022). Therefore, given the societal demand for wood, a holistic approach is needed to harmonize active forest management with the utilization of HWPs to maximize total carbon benefits (European Forest Institute, 2022). Moreover, using domestically sourced wood materials can help alleviate pressure on forests in other countries, functioning as a substitute for plantation establishment abroad and thereby contributing indirectly to global carbon preservation (Frey et al., 2018).
When registered in the voluntary carbon market in South Korea, the project was expected to generate 2,535,572 tCO2e in carbon credits by applying KFCOS methodologies for regeneration and rotation extension, corresponding to 2.77 tCO2e ha−1 yr.−1 (Supplementary Table S9; Forest Carbon Center, 2022). This value is substantially lower than the average credit issuance reported for tropical regions, which reaches 35.05 tCO2e ha−1 yr.−1, reflecting inherent differences in forest carbon dynamics across climatic zones (Fajardo et al., 2020). Indeed, the five countries with the highest return on investment in forest carbon projects—Brazil, Indonesia, Malaysia, Bolivia, and India—are all located in tropical regions, in contrast to the temperate forest conditions of South Korea (Fajardo et al., 2020; Koh et al., 2021).
Therefore, to promote active forest management and enhance the economic attractiveness in temperate regions where forestry is less profitable, such as South Korea, it is necessary to incorporate diverse carbon mitigation effects across the integrated forest supply chain into volunteer carbon mechanisms (Woo et al., 2021; Yoo et al., 2018). Applying an integrated regional forest management methodology that accounts for the four types of carbon benefits analyzed in this study would yield marketable credits of 4,236,270 tCO2e, equivalent to 4.62 tCO2e ha−1 yr.−1—a 67% increase over the current methodology—yet still insufficient to attract substantial investment (Figure 8). Moreover, including additional effects, such as forest fire risk reduction and biochar production, which were beyond the scope of this study’s carbon accounting framework of this study, would further enhance the economic viability of active forest management at the regional scale. Such integration would align with the objectives of voluntary carbon offsetting, which aims to promote sustainable development through more flexible and innovative approaches compared to compliance-based mechanisms (Loh, 2018).
Figure 8
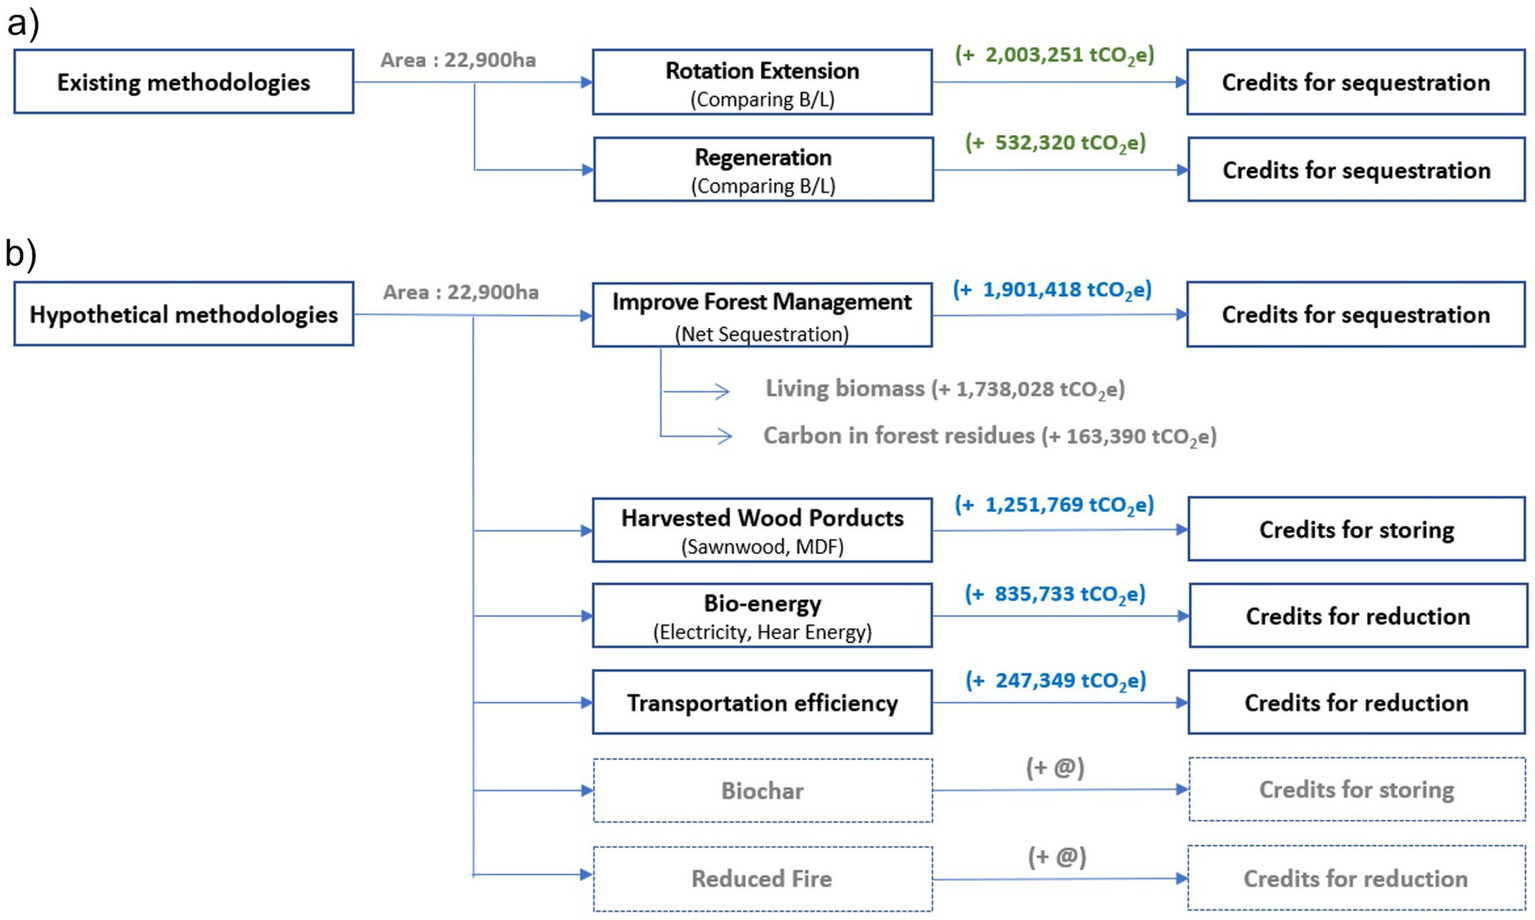
Comparison of carbon credits between (a) existing methodologies and (b) hypothetical methodologies, such as the comprehensive effects of integrated forest management in this study.
Moreover, this approach could provide an effective response to several criticisms of forest carbon credits in voluntary markets—particularly those concerning scheme governance, transparency, and permanence. Expanding project scales can further enhance the accuracy of carbon accounting and mitigate leakage risks, which have been another major source of criticism regarding carbon projects [Boucher and Elias, 2013; Schwartzman et al., 2021; ISDA (International Swaps and Derivatives Association), 2022]. By implementing an integrated carbon accounting methodology at the regional level, leakage—most prevalent in small-scale projects—can be effectively minimized. Consequently, this approach would improve the liquidity of timberland asset markets, enabling both buyers and sellers to better assess market valuations (Gray, 2002).
This study contributes to a better understanding of the importance of evaluating forest carbon benefits from an integrated supply chain perspective. Such an approach is advantageous for attracting greater investment in forestry, enhancing the integrity of forest carbon projects, and providing more accurate assessments of forest management effects through life cycle analysis (LCA), including effects of downstream products. Ultimately, this can enhance the credibility and market value of forest carbon credits (Kilpeläinen et al., 2021; Klein et al., 2015). Nevertheless, certain limitations should be acknowledged, as certain mitigation effects were inevitably excluded due to the lack of applicable methodologies—such as reductions in forest fire risk through fuel load management and GHG mitigation from substituting high-carbon materials with woods (Forzieri et al., 2021).
4 Conclusion
This study analyzed the carbon benefits of an integrated forest supply chain, linking district-level forest management to wood processing and renewable energy generation. When accounting for carbon flux in forests, carbon storage in HWPs, emission reductions from fossil fuel substitution, and transportation-related emissions, the overall cumulative net carbon benefits of active and passive forest management were comparable—4,236,270 tCO2e and 4,245,577 tCO2e, respectively—over the project period. Although active management results in greater loss of forest carbon stocks, these can be compensated for by integrating the regional forest supply chain, which increases the production of HWPs and reduces transportation emissions. Moreover, active forest management generates revenue streams for investors and provides renewable material resources for society, resulting in more comprehensive benefits while maintaining climate mitigation effects comparable to passive management.
Considering the additional environmental and social benefits of forests, along with the growing emphasis on ESG practices, there is substantial potential for the establishment of large-scale funds to support and expand sustainable forest management. While this study provides meaningful insights into the carbon benefits of forest management integrated across the supply chain, future studies should aim to quantify additional effects—such as forest fire risk reduction, material substitution, and biochar production—under varying scenarios of forest management intensity and time horizons. Such comprehensive evidence would better support decision-making by stakeholders considering participation in forest management projects.
Statements
Data availability statement
The original contributions presented in the study are included in the article/Supplementary material, further inquiries can be directed to the corresponding author.
Author contributions
SS: Conceptualization, Data curation, Formal analysis, Methodology, Visualization, Writing – original draft, Writing – review & editing. C-BL: Conceptualization, Methodology, Project administration, Supervision, Writing – review & editing.
Funding
The author(s) declared that financial support was received for this work and/or its publication. This study was supported by the National Research Foundation of Korea (NRF) grant funded by the Korea government (MSIT) (Project No. RS-2024-00358413).
Conflict of interest
The author(s) declared that this work was conducted in the absence of any commercial or financial relationships that could be construed as a potential conflict of interest.
The author C-BL declared that they were an editorial board member of Frontiers, at the time of submission. This had no impact on the peer review process and the final decision.
Generative AI statement
The author(s) declared that Generative AI was not used in the creation of this manuscript.
Any alternative text (alt text) provided alongside figures in this article has been generated by Frontiers with the support of artificial intelligence and reasonable efforts have been made to ensure accuracy, including review by the authors wherever possible. If you identify any issues, please contact us.
Publisher’s note
All claims expressed in this article are solely those of the authors and do not necessarily represent those of their affiliated organizations, or those of the publisher, the editors and the reviewers. Any product that may be evaluated in this article, or claim that may be made by its manufacturer, is not guaranteed or endorsed by the publisher.
Supplementary material
The Supplementary material for this article can be found online at: https://www.frontiersin.org/articles/10.3389/ffgc.2026.1694737/full#supplementary-material
References
1
Ahn H. J. Lee S. M. Jung H. G. Kim D. W. (2022). Climate-Smart Forest Framework for the 2050 Carbon-neutral Strategy in Korea. Naju-si: Korea Rural Economy Research Institute.
2
Ali J. Haoran W. Mehmood K. Muhammad B. Hussain W. Hussain K. et al . (2025). Evaluating biomass and carbon stock responses to thinning and pruning in mature Larix principis-rupprechtii Mayr stands: a case study from northern China. Front. For. Glob. Change8:1592009. doi: 10.3389/ffgc.2025.1592009
3
Badgley G. Freeman J. Hamman J. J. Haya B. Trugman A. T. Anderegg W. R. L. et al . (2022). Systematic over-crediting in California’s forest carbon offsets program. Glob. Change Biol.28, 1433–1445. doi: 10.1111/gcb.15943
4
Bomfim B. Pinagé E. R. Emmert F. Kueppers L. M. (2022). Improving sustainable tropical forest management with voluntary carbon markets. Plant Soil479, 53–60. doi: 10.1007/s11104-021-05249-5
5
Boucher D. Elias P. (2013). From REDD to deforestation-free supply chains: the persistent problem of leakage and scale. Carbon Manag.4, 473–475. doi: 10.4155/cmt.13.47
6
Brown M. L. Canham C. D. Buchholz T. Gunn J. S. Donovan T. M. (2023). Net carbon sequestration implications of intensified timber harvest in northeastern U.S. forests. Ecosphere15:e4758. doi: 10.1002/ecs2.4758
7
Cha S. Chae H. M. Lee S. H. Shim J. K. (2017). Branch wood decomposition of tree species in a deciduous temperate forest in Korea. Forests8:176. doi: 10.3390/f8050176
8
Chang Y. S. Kim S. Kim K. M. Yeo H. Shim K. B. (2018). Quantification of carbon reduction effects of domestic wood products for valuation of public benefit. J. Kor. Wood Sci. Technol.46, 202–210. doi: 10.5658/wood.2018.46.2.202
9
Choung Y. Lee J. Cho S. Noh J. (2020). Review on the succession process of Pinus densiflora forests in South Korea: progressive and disturbance-driven succession. J. Ecol. Environ.44:16. doi: 10.1186/s41610-020-00157-8
10
Chudy R. P. Cubbage F. W. (2020). Research trends: forest investments as a financial asset class. Forest Policy Econ.119:102273. doi: 10.1016/j.forpol.2020.102273,
11
Climate investment funds (2021). Designing Fiscal Instruments for suStainable Forests. Washington DC: World Bank.
12
Dalmonech D. Marano G. Amthor J. S. Cescatti A. Lindner M. Trotta C. et al . (2022). Feasibility of enhancing carbon sequestration and stock capacity in temperate and boreal European forests via changes to management regimes. Agric. For. Meteorol.327:109203. doi: 10.1016/j.agrformet.2022.109203
13
EG-TIPS (Energy Green House Gas Totol Information Platform Service) . (2024). Available online at: https://tips.energy.or.kr (Accessed December 15, 2024)
14
European Forest Institute (2022). Forest-based Climate Change Mitigation and Adaptation in Europe. Joensuu: European Forest Institute.
15
European Investment Bank (2019). Financing Rural, Agricultural and Forestry Infrastructure. Brussels: European Commisison.
16
Fajardo A. M. P. Timofeiczyk R. Gama e Silva Z. A. G. P. Silva J. C. G. L. Santos A. J. Agudelo P. A. M. (2020). Economic viability of REDD+ project in the Brasilian Amazonia. Madera Bosques.26:e2611761. doi: 10.21829/myb.2020.2611761
17
Fan X. Bai E. Zhang J. Wang X. Yuan W. Piao S. (2023). The carbon transfer from plant to soil is more efficient in less productive ecosystems. Glob. Biogeochem. Cycles37:e2023GB007727. doi: 10.1029/2023gb007727
18
FAO . (2024). Available online at: www.fao.org/faostat (Accessed December 15, 2024)
19
FAO (Food and Agriculture Organization of the United Nations) (2020). Global Forest Resources Assessment 2020. Rome: FAO.
20
Feng B. (2022). Forest carbon sink resource asset evaluation with case study of Fujian Province in China. Math. Probl. Eng.2022:7391473. doi: 10.1155/2022/7391473
21
Forest Carbon Center . (2022). Methodologies of Korea Forest Carbon Offset Scheme. Available online at: https://carbonregistry.forest.go.kr/fcr_web/fco/spt/board/methodologyView.do?bbsId=BBSMSTR_000000000026&nttId=593 (Accessed November 14, 2022).
22
Forest Products Trade System . (2024). Available online at: https://trade.forest.go.kr [Accessed December 15, 2025].
23
Forzieri G. Girardello M. Ceccherini G. Spinoni J. Feyen L. Hartmann H. et al . (2021). Emergent vulnerability to climate-driven disturbances in European forests. Nat. Commun.12:1081. doi: 10.1038/s41467-021-21399-7,
24
Frey G. E. Cubbage F. W. Ha T. T. T. Davis R. R. Carle J. B. Thon V. X. et al . (2018). Financial analysis and comparison of smallholder forest and state forest enterprise plantations in Central Vietnam. Int. Forestry Rev.20, 181–198. doi: 10.1505/146554818823767582
25
Goesan-gun . (2024). Available online at: https://www.goesan.go.kr (Accessed December 14, 2022).
26
Gray J. A. (2002). Forest Concession Policies and Revenue Systems - country Experience and Policy Changes for Sustainable Tropical Forestry. Wahington DC: The World Bank.
27
Gregor K. Krause A. Reyer C. P. O. Knoke T. Meyer B. F. Suvanto S. et al . (2024). Quantifying the impact of key factors on the carbon mitigation potential of managed temperate forests. Carb. Balance Manag.19:10. doi: 10.1186/s13021-023-00247-9,
28
Griscom B. W. Adams J. Ellis P. W. Houghton R. A. Lomax G. Miteva D. A. et al . (2017). Natural climate solutions. Proc. Natl. Acad. Sci. USA114, 11645–11650. doi: 10.1073/pnas.1710465114,
29
Han H. Lee S. J. Bae J. S. Lim J. S. Lee S. H. Yoo J. W. (2021). Contribution to NDC by Raising Forest Management Rates. Seoul: National Institute of Forest Science.
30
Haya B. K. Evans S. Brown L. Bukoski J. Butsic V. Cabiyo B. et al . (2023). Comprehensive review of carbon quantification by improved forest management offset protocols. Front. For. Glob. Change6:958879. doi: 10.3389/ffgc.2023.958879
31
Hülagü S. Dullaert W. Eruguz A. S. Heijungs R. Inghels D. (2025). Integrating life cycle assessment into supply chain optimization. PLoS One20:e0316710. doi: 10.1371/journal.pone.0316710,
32
IPCC (2023). Climate Change 2023 Synthesis Report. Geneva: IPCC.
33
IPCC (Intergovernmental Panel on Climate Change) (2006). 2006 IPCC Guidelines for National Greenhouse gas INVENTORIES. Geneva: IPCC.
34
ISDA (International Swaps and Derivatives Association) (2022). Voluntary Carbon Market: Analysis of Regulatory Oversight in the US. New York: ISDA.
35
Jang E. K. Youn Y. C. (2021). Effects of wood product utilization on climate change mitigation in South Korea. Sustainability13:6737. doi: 10.3390/su13126737
36
Kilpeläinen A. Alam A. Strandman H. Kellomaki S. (2021). Life cycle assessment tool for estimating net CO2 exchange of forest production. Glob. Change Biol. Bioenergy.3, 461–471. doi: 10.1111/j.1757-1707.2011.011001.x
37
Kim S. J. (2020). Park Jeong-hee's ‘Green Mountain’ construction and economic, ecological cognizance in the 1960s: focusing on the ‘arbor day’ and ‘Forest Rebabilitation’ project in Daehan news. Trans Human.13, 91–112. doi: 10.22901/trans.2020.13.2.91
38
Kim I. Heo T. (2022). Environment Evaluation on Whole Process. Paju-si: Donwha Technology.
39
Kim E. S. Jung J. B. Park S. (2024). Analysis of changes in pine forests according to natural forest dynamics using time-series NFI data. J. Kor. Soc. Forest Sci.113, 40–50. doi: 10.14578/jkfs.2024.113.1.40
40
Klein D. Wolf C. Schulz C. Blaschke G. W. (2015). 20 years of life cycle assessment (LCA) in the forestry sector: state of the art and a methodical proposal for the LCA of forest production. Int. J. Life Cycle Assess.20, 556–575. doi: 10.1007/s11367-015-0847-1
41
Koh L. P. Zeng Y. Sarira T. V. Siman K. (2021). Carbon prospecting in tropical forests for climate change mitigaiton. Nat. Commun.12:1271. doi: 10.1038/s41467-021-21560-2
42
Korea Forest Map Service . (2024). Available online at: https://map.forest.go.kr/forest/ (Accessed December 16, 2024).
43
Korea Forest Service . (2023a.) Guide on eco-friendly harvesting. Available online at: https://law.go.kr/LSW (Accessed November 10, 2022).
44
Korea Forest Service (2023b). Survey on Wood Utilization of Korea in 2022. Daejeon: Korea Forest Service.
45
Korea Forest Service (2023c). The 3rd Comprehensive Carbon Sink Enhancement Plan (2023∼2027). Daejeon: Korea Forest Service.
46
Korea Forest Service (2023d). 2023 Forest and Forestry Statistics. Daejeon: Korea Forest Service.
47
Korea Forest Service . (2025). Available online at: www.forest.go.kr (Accessed June 22, 2025).
48
Korea Forestry Promotion Institute (2024). Annual Management Report in 2023. Seoul: Korea Forestry Promotion Institute.
49
KOSIS National Statistical Portal . (2024). Available online at: https://kosis.kr/statHtml (Accessed December 2, 2024).
50
Kouamé S. Ghannadzadeh A. (2023). A comparative parametric sudy on dynamic biogenic carbon of harvested wood products: biomass rotation period vs. product lifetime. Energies16:3136. doi: 10.3390/en16073163
51
Kwon S. D. Kim S. Y. Jung J. S. Kim H. H. (2007). Development of Thinning Effect Analysis Model (TEAM) using individual-Tree distance-independent growth model of Pinus koraiensis stands. J. Korean Soc. Forest Sci.96, 742–749.
52
Lee D. Jung S. Choi J. (2022). Analysis of tree growth characteristics by first and second thinning in Korean white pine plantations. J. Korean Soc. Forest Sci.111, 150–164. doi: 10.14578/jkfs.2022.111.1.150
53
Lee Y. J. Lee M. K. Lee C. B. (2025). Combined effects of environmental conditions and stand age-induced tree size variation on temperate forest carbon pools among stand types in South Korea. For. Ecol. Manag.581:122553.
54
Lee Y. Min H. Yi E. (2024). A study of slogan brand development in an agricultural city: Goesan-gun, Chungcheongbukdo. J. Integr. Design Res.23, 81–96. doi: 10.21195/jidr.2024.23.3.005
55
Li L. Wei L. Zhao J. Hayes D. Daigneault A. Weiskittel A. et al . (2022). Technological advancement expands carbon storage in harvested wood products in Maine, USA. Biomass Bioenergy161:106457. doi: 10.1016/j.biombioe.2022.106457
56
Lijewski P. Merkisz J. Fuc P. Ziółkowski A. Rymaniak Ł. Kusiak W. (2017). Fuel consumption and exhaust emissions in the process of mechanized timber extraction and transport. Eur. J. Forest Res.136, 153–160. doi: 10.1007/s10342-016-1015-2
57
Lippke B. Oneil E. Harrison R. Skog K. Gustavsson L. Sathre R. (2011). Life cycle impacts of forest management and wood utilization on carbon mitigation: knowns and unknowns. Carbon Manag.2, 303–333. doi: 10.4155/cmt.11.24
58
Loh E. F. T. (2018). Voluntary Carbon Offestting and its Contribution to Sustainable Development. London: Imperial College London.
59
Min K. T. Seok H. D. Choi J. Y. (2017). Policy Tasks to Improve the Profitability of Forest Management in Korea. Naju-si: Korea Rural Economy Research Institute.
60
MSC (Mediterranean Shipping Company) . (2024). Available online at: https://www.msc.com/en/carbon-calculator (Accessed August 24, 2025)
61
National Institute of Forest Science (2014). Table of Growing Stock, Biomas and Harvest. Korea Forest Service; National Forest Research Institute: Seoul.
62
Nishizono T. Tanaka K. Awaya Y. Oishi Y. Hayashi M. Yokota Y. et al . (2008b). Age-related changes in stand volume growth of Cryptomeria japonica plantations in Akita District, northeastern Japan. J. Japanese Forest Soc.90, 232–240. doi: 10.4005/jjfs.90.232
63
Nishizono T. Tanaka K. Hosoda K. Awaya Y. Oishi Y. (2008a). Effects of thinning and site productivity on culmination of stand growth: results from long-term monitoring experiments in Japanese cedar (Cryptomeria japonica D. Don) forests in northeastern Japan. J. For. Res.13, 264–274. doi: 10.1007/s10310-008-0082-8
64
Ofoegbu C. (2023). Feasibility assessment of harvest residue gasification for bioelectricity and its financial impact on conventional plantation forestry. Sustain. Environ.9:2206506. doi: 10.1080/27658511.2023.2206506
65
Pilli R. Fiorese G. Grassi G. (2015). EU mitigation potential of harvested wood products. Carbon Balance Manag.10:6. doi: 10.1186/s13021-015-0016-7,
66
Probst B. S. Toetzke M. Kontoleon A. Anadón L. D. Minx J. C. Haya B. K. et al . (2024). Systematic assessment of the achieved emission reductions of carbon crediting projects. Nat. Commun.15:9562. doi: 10.1038/s41467-024-53645-z,
67
Richardes G. Grinsted S. (2024). The Logistics and Supply Chain Toolkit: Over 100 Tools for Transport, Warehousing and Inventory Management. London: Kogan Page.
68
Robinson N. Drever C. R. Gibbs D. A. Lister K. Esquivel-Muelbert A. Heinrich V. et al . (2025). Protect young secondary forests for optimum carbon removal. Nat. Clim. Chang.15, 793–800. doi: 10.1038/s41558-025-02355-5
69
Sapkota T. B. Dittmer K. M. Ortiz-Monasterio I. Mathivanan G. P. Sonder K. Leyva J. C. et al . (2022). Quantification of economically feasible mitigation potential from agriculture, forestry and other land uses in Mexico. Carbon Manag.13, 594–607. doi: 10.1080/17583004.2022.2151939
70
Schwartzman S. Lubowski R. N. Pacala S. W. Keohane N. O. Kerr S. Oppenheimer M. et al . (2021). Environmental integrity of emissions reductions depends on scale and systemic changes, not sector of origin. Environ. Res. Lett.16:091001. doi: 10.1088/1748-9326/ac18e8
71
Seo Y. Lee D. Chhorn V. Choi J. (2018). Comparison of growth and allometric change of stand and dominant trees in Pinus koraiensis plantation over 34 years. J. Forest Environ. Sci.34, 235–241. doi: 10.7747/JFES.2018.34.3.235
72
Shannon V. L. Vanguelova E. I. Morison J. I. L. Shaw L. J. Clark J. M. (2022). The contribution of deadwood to soil carbon dynamics in contrasting temperate forest ecosystems. Eur. J. Forest Res.141, 241–252. doi: 10.1007/s10342-021-01435-3
73
Soimakallio S. Kalliokoski T. Lehtonen A. Salminen O. (2021). On the trade-offs and synergies between forest carbon sequestration and substitution. Mitig. Adapt. Strateg. Glob. Change26:4. doi: 10.1007/s11027-021-09942-9
74
Son Y. M. Kim R. H. Lee K. H. Pyo J. K. Kim S. W. Hwang J. S. et al . (2014). Carbon Emission Factors and Biomass Allometric Equations by Species in Korea. Seoul: Korea Forest Research Institute.
75
Tsukada N. Matsumoto M. (2024). Forest carbon accounting to leverage mitigation actions: implications for the Paris agreement based on the analysis of countries’ decision under the Koyo Protocal. J. For. Res.29, 176–185. doi: 10.1080/13416979.2024.2302303
76
West T. A. P. Wunder S. Sills E. O. Börner J. Rifai S. W. Neidermeier A. N. et al . (2023). Action needed to make carbon offsets from tropical forest conservation work for climate change mitigation. Science381, 873–877. doi: 10.1126/science.ade3535,
77
Woo H. Acuna M. Choi B. Kim J. (2021). Net revenue of forest carbon offset projects: application of the Korean emission trading system in the forestry sector. Forests12:742. doi: 10.3390/f12060742
78
World Economic Forum (2021). Investing in Forests: The Business Case. Geneva: World Economic Forum.
79
Yanai R. D. Wayson C. Lee D. Espejo A. B. Campbell J. L. Green M. B. et al . (2020). Improving uncertainty in forest carbon accounting for REDD+ mitigation efforts. Environ. Res. Lett.15:124002. doi: 10.1088/1748-9326/abb96f
80
Yang J. Lee J. Jeong H. Han S. H. Lee S. M. (2022). Estimation of the amount of round wood in unused forest biomass reporting in forest clearing. New Renew Energy. 18:4, 70–78. doi: 10.7849/ksnre.2022.0038
81
Yoo S. Cho Y. S. Park H. (2018). An optimal management strategy of carbon forestry with a stochastic price. Sustainability10:3290. doi: 10.3390/su10093290
82
Yousefpour R. Augustynczik A. L. D. Reyer C. P. O. Lasch-Born P. Suckow F. Hanewinkel M. (2018). Realizing mitigation efficiency of European commercial forests by climate smart forestry. Sci. Rep.8:345. doi: 10.1038/s41598-017-18778-w,
83
Yu Y. Tu J. Shi K. Liu M. Chen J. (2021). Flexible optimization of international shipping routes considering carbon emission cost. Math. Probl. Eng.2021:6678473. doi: 10.1155/2021/6678473
84
Yue J. W. Guan J. H. Deng L. Zhang J. G. Li G. Du S. (2018). Allocation pattern and accumulation potential of carbon stock in natural spruce forests in Northwest China. PeerJ6:4859. doi: 10.7717/peerj.4859,
85
Zengin H. Ünal M. E. (2019). Analyzing the effect of carbon prices on wood production and harvest scheduling in a managed forest in Turkey. Forest Policy Econ.103, 28–35. doi: 10.1016/j.forpol.2017.10.017
Summary
Keywords
carbon benefits, forest biomass energy, harvested wood products, integrated forest supply chain, sustainable forest management
Citation
So S and Lee C-B (2026) Evaluating carbon benefits across an integrated forestry supply chain, including forest management, wood products, and biomass energy: a temperate-region case study in South Korea. Front. For. Glob. Change 9:1694737. doi: 10.3389/ffgc.2026.1694737
Received
28 August 2025
Revised
06 January 2026
Accepted
08 January 2026
Published
29 January 2026
Volume
9 - 2026
Edited by
Ram P. Sharma, Tribhuvan University, Nepal
Reviewed by
David Ellison, Swedish University of Agricultural Sciences, Sweden
Xavier Cavard, Université du Québec en Abitibi Témiscamingue, Canada
Sumit Chakravarty, Uttar Banga Krishi Viswavidyalaya, India
Updates
Copyright
© 2026 So and Lee.
This is an open-access article distributed under the terms of the Creative Commons Attribution License (CC BY). The use, distribution or reproduction in other forums is permitted, provided the original author(s) and the copyright owner(s) are credited and that the original publication in this journal is cited, in accordance with accepted academic practice. No use, distribution or reproduction is permitted which does not comply with these terms.
*Correspondence: Chang-Bae Lee, kecolee@kookmin.ac.kr
ORCID: Chang-Bae Lee, orcid.org/0000-0002-3543-6440; n
Disclaimer
All claims expressed in this article are solely those of the authors and do not necessarily represent those of their affiliated organizations, or those of the publisher, the editors and the reviewers. Any product that may be evaluated in this article or claim that may be made by its manufacturer is not guaranteed or endorsed by the publisher.