Abstract
Introduction:
Wildfire smoke is a significant pollutant and severe threat to climate, air quality, and public health within forest ecosystems. This study focused on quantifying PM2.5 emission characteristics from the combustion of major coniferous species in China.
Methods:
Indoor ignition experiments were conducted on needles, branches, and bark of six coniferous species——Pinus koraiensis (HS), Larix gmelinii (LYS), Pinus sylvestris var. Mongolica (ZZS), Abies fabri (LS), Picea jezoensis (YLYS), and Picea koraiensis (HPYS)—from the Liangshui National Nature Reserve. The experiments systematically varied fuel moisture content, fuel load, and wind speed to assess their effects on PM2.5 emissions.
Results:
Substantial disparities in PM2.5 emission concentrations were observed among different tree species and their organs. Both individual and interactive effects of fuel moisture content, fuel load, and wind speed significantly impacted PM2.5 emissions. Elevated wind speed and fuel load were identified as predominant factors influencing PM2.5 concentrations, whereas the impact of high fuel moisture content was more complex.
Discussion:
The random forest model trained on these data effectively predicted PM2.5 emissions at the laboratory scale. This study provides a crucial reference for estimating wildfire smoke emissions, evaluating their atmospheric impact, and informing refined forest fuel management strategies.
1 Introduction
Forest fires are natural disturbance factors in forest ecosystems, and high-intensity fires can damage forest structure, productivity, and biodiversity (Wu et al., 2023; Chen et al., 2025). Climate change exacerbates wildfire frequency and intensity through drought and warming (Romanov et al., 2022; Celis et al., 2023), and thus forests and their carbon storage are increasingly vulnerable to fire disturbance (Ewald et al., 2024). Meteorological conditions are a major factor driving fire spread at the regional level (Quishpe-Vasquez et al., 2024; Heidarlou et al., 2024; Law et al., 2025). Furthermore, the prevailing warm-dry trend and extreme weather events will continuously increase global forest fire risks, particularly in high-latitude and high-altitude regions where litter accumulation leads to higher fuel loads and more pronounced fire hazards (Souane et al., 2025; Huang et al., 2022; Pau et al., 2023). During fires, the release of heat, gases (e.g., water vapor), and materials connects the atmosphere, hydrosphere, and biosphere, altering biotic and abiotic processes in forest ecosystems and disrupting energy flow (Wasserman and Mueller, 2023; Sano et al., 2025; McNorvell, 2023; Paroissien et al., 2025). This results in tree mortality, consumption of understory vegetation and litter, and degradation of soil physical structure and nutrients (Su et al., 2022; Marziliano et al., 2025). Additionally, high-intensity fires are accompanied by high-concentration smoke emissions, which not only far exceed air quality standards but also affect atmospheric stability, photochemical reaction rates and air quality in nearby and even far-off areas (Santoso et al., 2022; Mateos et al., 2019).
Wildfire smoke emissions represent a significant pollution source endangering forest ecosystems. Although vegetation can absorb part of the smoke, massive emissions have significantly disrupted biogeochemical cycles, including carbon, nitrogen and phosphorus cycles (Zheng et al., 2022; Lee et al., 2022). Such emissions impact climate change and the atmospheric environment, while the pollutants in the smoke also present a serious health hazard to firefighters and residents in forested areas (Doubleday et al., 2020; Karanasiou et al., 2021; Matz et al., 2020). Wildfire smoke has become a global public health issue, with approximately 339,000 premature deaths attributed to it annually. Distant populations can also be affected by the long-range dispersion of Particulate Matter with a diameter of 2.5 micrometers (PM2.5), and long-term exposure to environments containing its main components is associated with increased mortality (Matz et al., 2020; Ikeda and Tanimoto, 2015; Cottle et al., 2014; Wang et al., 2022). Wildfires release not merely PM2.5 but also a variety of toxic gaseous pollutants, including volatile organic compounds (VOCs). Firefighters face direct inhalation injuries and long-term health risks affecting the cardiovascular, pulmonary, and neurological systems due to exposure to high PM2.5 concentrations in wildfire smoke (Karanasiou et al., 2021; Milton and White, 2020; Ontawong et al., 2020). Existing research has systematically investigated how factors such as fuel loading, meteorological conditions, and fuel spatial distribution influence wildfire characteristics and human health impacts (Ning et al., 2022). Therefore, conducting predictive research integrating wildfire behavior dynamics and smoke emission modeling to provide technical underpinnings for wildfire management strategies is of paramount importance.
Current research primarily focuses on the sampling methods, compositional analysis, and influencing factors of particulate matter released during forest fires, particularly PM2.5 (Ju et al., 2019; Zheng et al., 2024). However, existing research has been predominantly focused on the effects of individual factors. The integrated effects arising from the combination of multiple factors, such as meteorological conditions and fuel characteristics, remain less explored and warrant further investigation. For instance, although the impact of wind speed on particulate concentration has been noted, the complex mechanisms underlying this relationship remain unclear.
In the field of forest fire smoke emissions and PM2.5 concentration estimation, existing modeling approaches are diverse and can primarily be categorized into two major classes: statistical models focused on mechanistic interpretation and machine learning models emphasizing predictive performance, each with its own trade-offs between accuracy and interpretability. Currently, statistical models still play a foundational role. Multiple Linear Regression, due to its complete transparency, is often used as a performance benchmark to quantify the linear contributions of various influencing factors, such as fuel load and meteorological conditions (Mirzaei et al., 2020). Generalized Additive Models further capture nonlinear relationships (such as threshold effects) between variables like meteorology, fire risk, and PM2.5 through smoothing functions, enhancing the ability to fit complex data while maintaining good interpretability (Leone et al., 2023). On the other hand, various machine learning models are widely employed to pursue higher predictive accuracy. Support Vector Machines, for instance, have been applied to map the complex dispersion patterns of smoke plumes (He et al., 2018), while BP Neural Networks are effective in simulating spatial concentration distributions from experimental burn data (Ning et al., 2021a). These models excel at capturing complex interactions among high-dimensional features and have achieved more accurate concentration estimates in many cases. However, their inherent “black-box” nature makes the decision logic difficult to interpret, which to some extent limits the direct application of their conclusions in disaster management practices. In contrast, ensemble learning models such as Random Forests offer a compelling balance. By aggregating predictions from multiple decision trees, they maintain high predictive accuracy while providing better model interpretability than many other machine learning techniques through built-in metrics like variable importance rankings. This combination of performance and partial transparency has established them as one of the mainstream high-performance prediction methods in recent applications, from rapid exposure assessment tools (Raffuse et al., 2024) to comparative studies confirming their efficacy (Khanmohammadi et al., 2024).
Heilongjiang Province, a region severely affected by forest fires in China, urgently requires in-depth investigation. In China, large-scale open burning experiments are highly restricted by environmental policies and safety regulations. Therefore, similar to many studies that rely on laboratory simulations or model-based approaches, this investigation adopts the Liangshui National Nature Reserve as a representative and feasible site for empirical observation. It selects coniferous tree species and conducts indoor combustion experiments simulating various wind speeds, fuel moisture contents, and fuel loads under wildland burning conditions. Therefore, to overcome the trade-off between mechanistic interpretability and complex nonlinear fitting in existing models, and to generate transferable mechanistic knowledge, this study selects the Random Forest model as the core method. This choice is based on its dual advantages: at the laboratory scale, it can achieve high-precision prediction due to its excellent nonlinear fitting capability; more importantly, its built-in feature importance analysis function can transform prediction results into the quantitative identification of key driving factors, thereby unifying “prediction and attribution.” The “feature-emission” response framework constructed under controlled conditions in this study has its core value in providing fundamental process understanding and key parameter constraints for understanding more complex wildfire emissions, thus possessing broad reference value at the methodological and physico-mechanistic levels. By quantitatively analyzing PM2.5 emissions from forest fires and establishing a PM2.5 emission prediction model based on the Random Forest algorithm, this study not only fills the gap in research on the integrated effects of multiple factors but also provides crucial support for the safety of forest fire-fighting personnel and research on fire emissions. Furthermore, the study furnishes efficacious assessment instruments for fire alert and management, offering data support and a theoretical foundation for regional ecological environment evaluation.
2 Materials and methods
2.1 Overview of the study area
The Liangshui National Nature Reserve is situated on the eastern slope of the Dalidailing Branch Range within the southern Xiaoxing’anling Mountains, located in northeastern China. Spanning an area of 12,133 hectares, the reserve extends longitudinally from 128°47′8″E-128°57′19″E and latitudinally from 47°6′49″N-47°16′10″N (refer to Figure 1). As a zonal vegetation type, the area is dominated by temperate mixed coniferous-broadleaved forests with Pinus koraiensis (HS) as the key species, belonging to the northern subzone of the temperate coniferous-broadleaved mixed forest belt. It lies within the typical distribution subregion of broadleaved-Pinus koraiensis forests and serves as the core global habitat for Pinus koraiensis, exhibiting high representativeness in ecosystem structure. The reserve contains a complete forest succession continuum, including undisturbed primary forests, secondary forests regenerated after fire/clear-cutting, artificial monocultures and mixed plantations. This mosaic ecosystem represents a microcosm of pre-development Xiaoxing’anling forests, providing critical baseline data for pristine forest ecosystem research.
Figure 1

Location map of Liangshui National Nature Reserve.
Situated at the eastern periphery of the Eurasian landmass, the region is defined by a temperate continental monsoon climate, which is significantly influenced by maritime air masses (Zou et al., 2024). Prevailing winds shift seasonally: southwestern winds dominate in spring and summer, while northwestern winds prevail in autumn and winter. The primary mountain range aligns north–south, intersected by secondary east–west trending ranges, creating a basin-like geomorphology with elevated northern, eastern, and western peripheries and a depressed central-southwestern sector. Portions of the core and experimental zones are situated within this basin landform.
2.2 Research methods
2.2.1 Sample collection and pretreatment
Field sampling was conducted in Liangshui National Nature Reserve during the leaf expansion period (early May), the leaf stabilization period (mid-July), and the early leaf senescence period (late September). Stratified sampling was adopted in this experiment, with six representative tree species collected in the forest area, including Pinus koraiensis (HS), Larix gmelinii (LYS), Pinus sylvestris var. Mongolica (ZZS), Abies fabri (LS), Picea jezoensis (YLYS) and Picea koraiensis (HPYS), covering key fuel types. Limited by field sampling and combustion experiment resources, five adult individual trees with similar growth vigor were randomly selected for each tree species. While falling short of the standards for large-scale ecological surveys, this study aligns with the experimental design norms of similar research focusing on the analysis of different tree components under combustion. Needles, branches, and bark were each collected from individual trees, amounting to 1,000 grams per organ. The corresponding organs from identical tree species were subsequently manually combined and stored in airtight plastic bags to avert the loss of moisture (Ma et al., 2022).
2.2.2 Sample treatment and preparation
Samples were desiccated in a forced-air oven at 105 °C until they reached a constant mass to determine their moisture content, then stored in sealed bags in a cool, shaded area. The sample preparation procedure followed the method described in Wei et al. (2022). Previous research has demonstrated that wildfire behavior and smoke characteristics differ significantly between combustion states (open flame or smoldering) (Shan et al., 2023). To ensure experimental repeatability, this study focused exclusively on open-flame single-stage combustion scenarios. Target moisture contents were achieved by spraying deionized water onto fuel surfaces, followed by 24-h airtight equilibration to ensure uniform water absorption. This investigation utilizes relative moisture content, the formula for which is articulated as Equation 1:
In the formula: FMC signifies the moisture content of fuel (%); WF denotes the fresh weight of fuel, measured after the oven-dried samples were rehydrated to the target moisture content; WD represents the dry weight of fuel. In this paper, both WF and WD are measured in grams (g).
2.3 Indoor burning experiment
The combustion experiment was executed within a fume hood located in the laboratory. The laboratory apparatus and facilities primarily comprised a custom-built combustion bed, a PM2.5 air monitor, an atmospheric particulate matter sampler, and a fan (Figure 2).
Figure 2

Diagram of the indoor ignition experimental device.
The combustion experiments simulated fire smoke release under natural conditions, utilizing high-flow particulate matter samplers to collect PM2.5 (Zhang et al., 2022). In a closed fume hood with the ventilation system turned off (simulating an enclosed space), needles, branches and bark of six coniferous tree species were ignited. Fuel beds with different combinations were laid out based on variables including moisture content (0, 5, 10, 15%), wind speed (0 m/s, 1 m/s, 2 m/s, 3 m/s) (Liu et al., 2022), and fuel load (0.5 g, 1.0 g, 2.0 g), with three replicates for each combination.
The combustion bed had a length of 30 cm and a width of 20 cm, with an asbestos fireproof insulation layer at the bottom to reduce heat conduction loss. The bed was kept horizontal to eliminate slope effects. In preliminary experiments, airflow was monitored in the combustion area using a digital anemometer, and preset wind speed parameters were achieved by adjusting fan speed. Fuel samples were precisely weighed and uniformly spread on the combustion bed surface. The ignition procedure was conducted utilizing an alcohol lamp ignition apparatus, ensuring a steady flame by regulating the proximity of the alcohol lamp to the combustion bed. This methodology guaranteed sustained combustion until the samples were entirely reduced to ash.
2.4 Collection and data processing of PM2.5
The PM2.5 concentration in this study was determined using the gravimetric method. This method involves drawing air through a filter at a constant flow rate via a particulate sampler, thereby collecting PM2.5 particles on the filter. The PM2.5 concentration is calculated from the mass difference of the filter before and after sampling and the volume of air sampled under standard conditions.
Before the experiment, the PM2.5 air monitor was turned on and the initial PM2.5 concentration was recorded. The PM2.5 samples were collected using a JCH-6120 medium-flow sampler (Qingdao Juchuang Creation Technology Co., Ltd., China) operated at 100 L/min and fitted with a PM2.5 size-cutting device. Sampling was conducted continuously until the concentration stabilized at the pre-combustion background level, with gas volume data under standard temperature and pressure conditions recorded simultaneously. After each experiment, the cutter components were cleaned with organic solvents to eliminate cross-contamination risks (Wu et al., 2024).
Glass fiber filters were used for all collections. Prior to use, each filter was inspected for defects (e.g., pinholes, non-uniformity) via transmitted light. Only intact, uniform, and flat filters were selected. Each filter was conditioned in a constant temperature and humidity chamber (25 °C, 50% relative humidity) for at least 24 h and then weighed using a precision electronic balance (Model: ek-1200i, Precision: 0.0001 g) to obtain its initial mass. After sampling, the loaded filter was re-conditioned under the same environmental settings for 24 h before final weighing. The net mass gain of the filter was used for the concentration calculation.
The formula for PM2.5 mass concentration is expressed as Equation 2:
In the formula: P represents the mass concentration of PM2.5; W1 signifies the weight of the filter membrane prior to sampling; W2 denotes the weight of the filter membrane after sampling; V corresponds the sampling volume under standard conditions, which is obtained by multiplying the sampling flow rate by the sampling time. In this paper, the unit for p is μg/m3.
This investigation employs emission factors (EF) to evaluate the emissions of particulate matter pollutants. The emission factor signifies the mass of pollutants discharged per unit mass of fuel or per unit energy utilized during combustion. The total PM2.5 emissions can be estimated by multiplying the emission factor by the total combustion fuel mass and its formula is articulated as Equation 3:
In the formula, EFi represents the emission factor of pollutant i, Mi is the mass of particulate matter, and MFuel is the combustion mass of tree species i. In this paper, Mi is measured in grams (g), MFuel is measured in kilograms (kg).
2.5 Statistical analysis
This investigation employed a multifactorial experimental framework to methodically examine the impacts of three principal variables—namely, moisture content, load, and wind speed—and their interrelationships on the PM2.5 concentration emitted during the combustion of needle-leaved tree foliage, including needles, branches, and bark. The precise research hypotheses are delineated as follows:
-
Does the moisture content, load, and wind speed exert significant primary effects on the release concentration of PM2.5?
-
Are there notable interrelationships between moisture content and load, moisture content and wind speed, and load and wind speed, which jointly affect the PM2.5 release concentration?
-
Does the interplay of moisture content, load, and wind velocity exert a significant influence on the release concentration of PM2.5?
Statistical analyses were performed in R Studio. First, a multivariate linear model (Table 1) was fitted with species and organ as fixed, independent predictors together with moisture content, fuel load and wind speed and all two- and three-way interactions; PM2.5 emission factor was the response variable. Second, to visualize predictive performance, separate random-forest models were trained for each species–organ combination (Figure 3); within each model the same three combustion variables (moisture content, fuel load, wind speed) served as predictors.
Table 1
| Variable | SumSq | Fvalue | pvalue | HP_ContribPct | Std β | Partial η2 |
|---|---|---|---|---|---|---|
| Species | 1.69e+9 | 151 | <0.0001 | 25.9774% | 0.844 | 0.474 |
| Organ | 2.08e+9 | 187 | <0.0001 | 12.7993% | 0.548 | 0.308 |
| MC | 3.13e+1 | 0.224 | >0.05 | 0.0077% | −53.7 | 0.0003 |
| FL | 3.89e-1 | 1,077 | <0.0001 | 36.9562% | 3,730 | 0.562 |
| WS | 1.25e+0 | 58.7 | <0.0001 | 2.0142% | 871 | 0.0654 |
| Species×Organ | 7.22e+8 | 64.8 | <0.0001 | 22.2221% | 0.775 | 0.436 |
| MC × FL | 7.33e+4 | 0.0066 | >0.05 | 2e-04% | 9.22 | 0 |
| MC × WS | 7.84e+5 | 0.0704 | >0.05 | 0.0024% | −30.2 | 0.0001 |
| FL × WS | 6.66e+6 | 0.598 | >0.05 | 0.0205% | 87.9 | 0.0007 |
| MC × FL × WS | 1.21e+4 | 0.0011 | >0.05 | 0% | −3.74 | 0 |
Data table for statistical analysis.
Figure 3

PM2.5 emission factors of different organs of various tree species.
In order to more vividly illustrate the impact of these influencing factors and their interactions on PM2.5 emissions, data visualization was carried out using Origin software. This analysis focused on the characteristics of PM2.5 emissions under the influence of single factors as well as the interactive effects of moisture content, fuel load, and wind speed. A three-dimensional response surface methodology (RSM) model was utilized to explore the combined influence of two factors on PM2.5 concentrations. The model was derived through quadratic regression analysis, and its statistical significance was verified through Analysis of Variance (ANOVA) (p < 0.0001). RSM is capable of identifying the optimal combination of independent variables that maximizes or minimizes the response variable. It also provides a direct visualization of the estimated effects of these independent variables on the response variable, including both main effects and interactions. Additionally, a three-dimensional bubble chart was created using R Studio to depict the emission characteristics of PM2.5 under the joint action of the three factors.
2.6 Random forest model
To accurately capture the intricate nonlinear relationship between PM2.5 emissions and the combustion of various tree species and organs, inclusive of the multifactorial interaction effects of combustion conditions, we employed the random forest model. Random forest has been widely applied in environmental research, such as spatio-temporal prediction of air quality and pollutant concentrations, as well as analysis of related influencing factors (Dong et al., 2024). The random forest model, a powerful machine learning tool, is capable of handling complex nonlinear relationships and high-dimensional data. Random forest enhances prediction accuracy and stability by constructing multiple decision trees. Each decision tree is trained on a random subset of the data, and a random subset of features is selected for splitting at each node. This randomness increases model diversity while reducing the risk of overfitting (Zou et al., 2024).
Random-forest modeling and visualization were implemented in R Studio using the caret, randomForest, and ggplot2 packages. To verify the stability and reliability of the model, we employed a 10-fold cross-validation approach, which not only comprehensively evaluates model performance but also effectively mitigates the impact of randomness. This method ensures that the random forest model not only accurately predicts PM2.5 concentrations but also possesses robust generalization ability and stability. In each iteration, the dataset is randomly divided into 10 mutually exclusive subsets (folds) of approximately equal size, with 9 folds used for model training and the remaining 1 fold for model testing. Following 10-fold cross-validation, we computed the variable-wise %IncMSE (percentage increase in mean squared error) from the out-of-bag predictions of a random forest trained independently on each fold. These values were normalized to relative proportions (i.e., variable contribution rates) and then averaged across folds to yield stable estimates of feature importance. Through multiple iterative experiments, each sample has the opportunity to be used as test data, and distribution bias is controlled by adopting a stratified random sampling strategy during fold division, enabling a more comprehensive evaluation of model performance. This design further enhances the reliability of the model’s predictive capability. The model uses the Coefficient of Determination (R2) to assess goodness of fit, with values ranging from 0 to 1—higher values indicate closer alignment between predicted and observed values. Additionally, the Root Mean Squared Error (RMSE) is employed to quantify prediction errors, where smaller values signify smaller discrepancies between predicted and observed values. In comparative evaluations against multiple regression, generalized additive models, and BP neural networks (a type of multi-layer feedforward neural network based on the error backpropagation algorithm, which excels at fitting complex data relationships through nonlinear mapping), the random forest model exhibits significantly higher accuracy in predicting PM2.5 concentrations.
This study employs the Random Forest model to construct a predictive model for emissions. It is important to clarify the dual analytical focus of this work: while the model is trained to directly predict PM2.5 concentration—a metric directly tied to environmental impact and applicable to risk assessment and air quality modeling—the study simultaneously analyzes emission factors. This dual approach serves complementary scientific purposes. The PM2.5 concentration reflects the absolute environmental load, whereas the emission factors, as a standardized metric, removes the influence of fuel consumption to isolate the effects of variables like moisture content, fuel load, and wind speed on the intrinsic efficiency of the combustion process itself. Thus, by integrating both concentration-based prediction and emission factors-based mechanistic analysis, this research design not only delivers practical predictive outputs but also provides deeper physico-chemical insight into combustion dynamics. This strengthens the physical interpretability of the model and establishes a more robust basis for extending laboratory-derived understanding to complex field-scale scenarios.
3 Results
3.1 Analysis of PM2.5 concentration released by combustion of different organs of each tree species
Taking the combustion state of fuel with a moisture content of 0%, a load of 1.0 g, and a wind speed of 0 m/s as an example, Figure 3 shows the PM2.5 emission factors released by the bark, branches, and needles of six coniferous tree species during combustion and error bars represent the standard deviation of PM2.5 emission factors obtained from three replicate combustion experiments for each tree species–organ combination.
The results show that the PM₂.₅ emission factors during combustion differ markedly among fuel components. Specifically, for HS (25.1 g·kg−1), LYS (22.1 g·kg−1), ZZS (19.7 g·kg−1) and LS (24.4 g·kg−1), the needles exhibit the highest PM₂.₅ emission factors. Conversely, for YLYS (12.1 g·kg−1), the bark displays the greatest PM₂.₅ emission factor. In the case of HPYS, the bark (15.7 g·kg−1), branches (16.5 g·kg−1) and needles (15.5 g·kg−1) yield relatively similar PM₂.₅ emission factors.
3.2 The impact of a single factor on PM2.5
Figures 4a–c shows the PM2.5 release trends during combustion influenced by moisture content. Taking the combustion state with a fuel load of 1.0 g and a wind speed of 0 m/s as an example. For bark combustion, HS, LYS, and HPYS release more PM2.5 than ZZS, LS, and YLYS, with varying trends (initial increase–decrease for HS, fluctuating upward for LS, stable upward for ZZS). For branch combustion, HS and HPYS release more PM2.5, with HS and ZZS showing upward trends and others showing downward trends (initial increase–decrease for YLYS and HPYS). For foliage combustion, YLYS releases the least PM2.5, while ZZS, YLYS, and HPYS show upward trends and HS, LS, and LYS show initial declines followed by increases but overall downward trends.
Figure 4

(a–c) PM2.5 emission factors across organs as a function of moisture content. (d–f) PM2.5 emission factors across organs as a function of fuel load. (g–i) PM2.5 emission factors across organs as a function of wind speed.
Subject to the influence of fuel load as a single factor, the trend of PM2.5 emission during combustion is depicted in Figures 4d–f. Taking the combustion state with a moisture content of 0% and a wind speed of 0 m/s as an example, the PM2.5 concentration emitted during the combustion of bark, branches, and needles from the six coniferous tree species significantly increases with the increase in fuel load. An elevated amount of fuel materials is utilized in the combustion, and thus release more PM2.5 particulate pollutants.
The trend of PM2.5 emission factors during combustion, influenced exclusively by wind speed, is illustrated in Figures 4g–i. Upon scrutinizing the combustion scenario at a moisture content of 0% and a fuel load of 1.0 g, it becomes evident that as the wind velocity increases from 0 m/s to 1 m/s, there is a substantial elevation in the PM2.5 concentration released by the fuel materials, specifically the bark, branches, and needles of the six coniferous trees. Nonetheless, As wind speed continues to rise, the rate of PM2.5 emission factors from the majority of these materials tends to decelerate and may even diminish. This phenomenon could be attributed to the suppression of combustion of the fuel materials by the elevated wind speed.
3.3 Effects of multiple factors on PM2.5 concentration
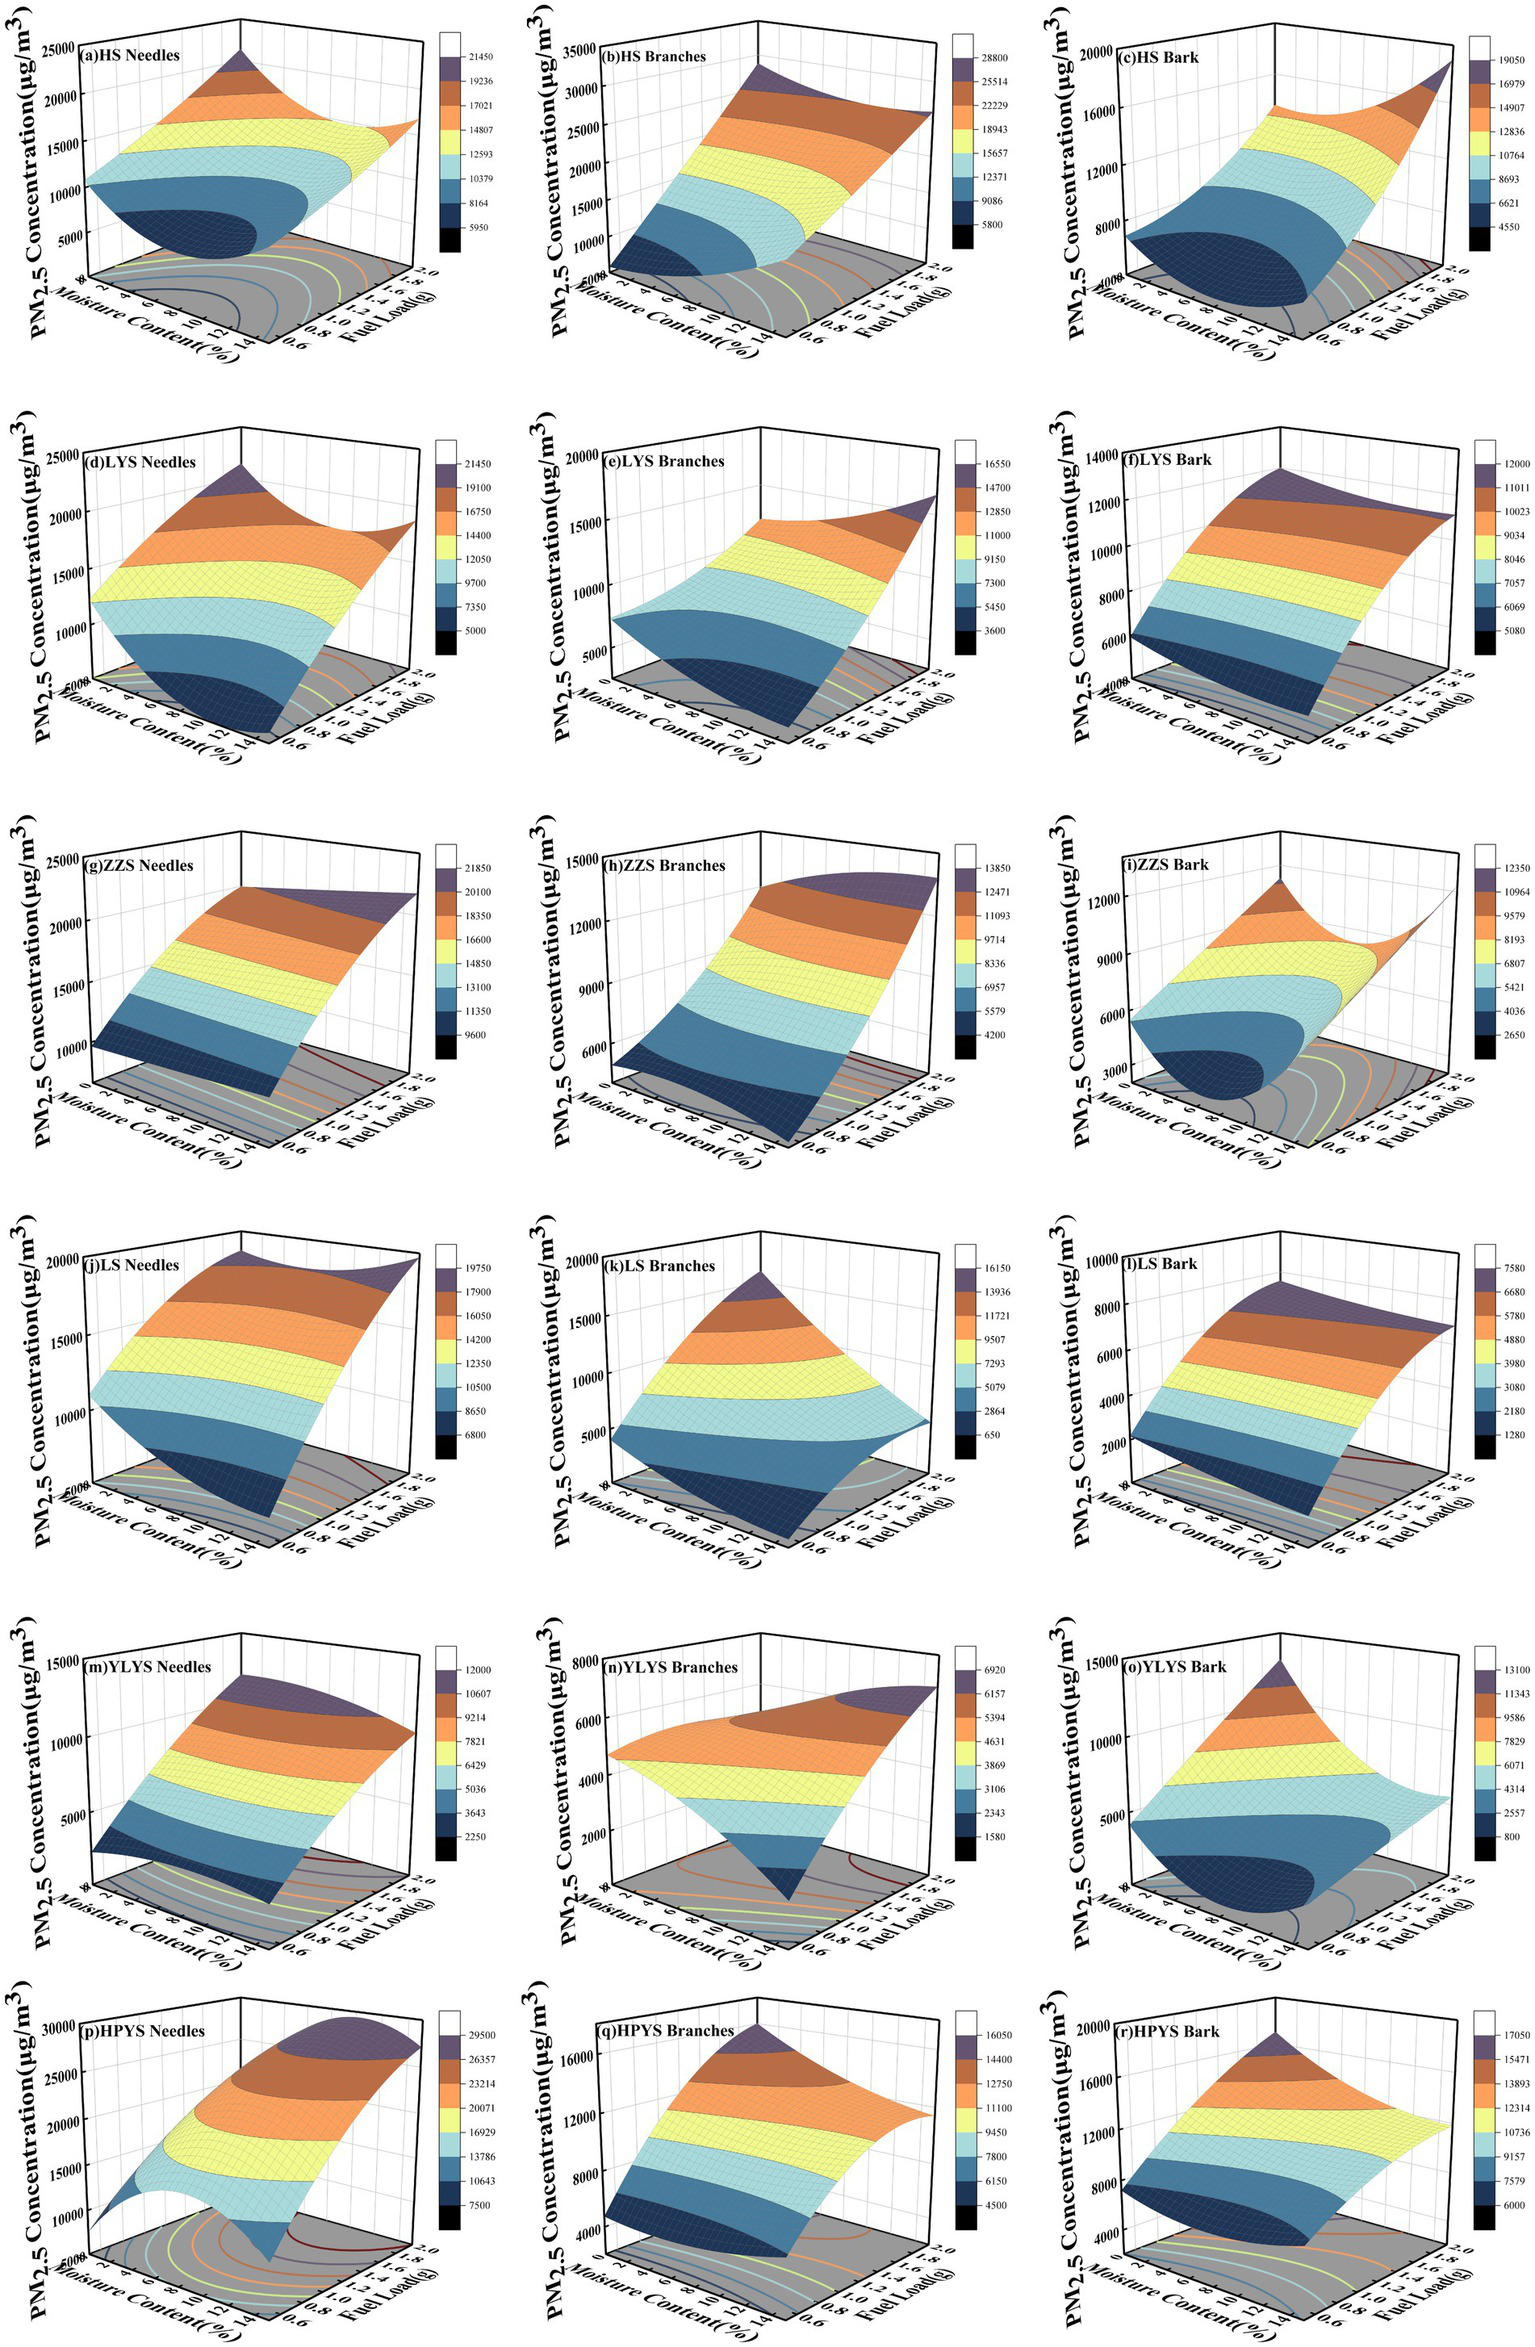
3.3.1 Effects of moisture content and fuel load on PM2.5 concentration
At a wind speed of 0 m/s, the impacts of moisture content and fuel load on PM2.5 concentration are presented in Figure 5, which is reflected by the RSM model fitted by the experimental average value.
Figure 5
The PM2.5 concentration under the interactive effects of moisture content and fuel load with wind speed at 0 m/s. (a) HS needles, (b) HS branches, (c) HS bark, (d) LYS needles, (e) LYS branches, (f) LYS bark, (g) ZZS needles, (h) ZZS branches, (i) ZZS bark, (j) LS needles, (k) LS branches, (l) LS bark, (m) YLYS needles, (n) YLYS branches, (o) YLYS bark, (p) HPYS needles, (q) HPYS branches, (r) HPYS bark.
PM2.5 concentration increased with fuel load, whereas responses to moisture content varied among species and organs. In conclusion, no discernible pattern in the moisture content has been identified. Certain species–organ combinations exhibit an increase in correlation with ascending moisture levels, while others demonstrate a decrease, and still others display an initial increase followed by a subsequent decline as moisture content rises.
3.3.2 The effects of moisture content and wind speed on PM2.5 concentration
At a fuel load of 0.5 g, the impacts of fuel moisture content and wind speed on PM2.5 concentration are depicted in Figure 6, as modeled by the RSM model fitted to experimental mean values.
Figure 6
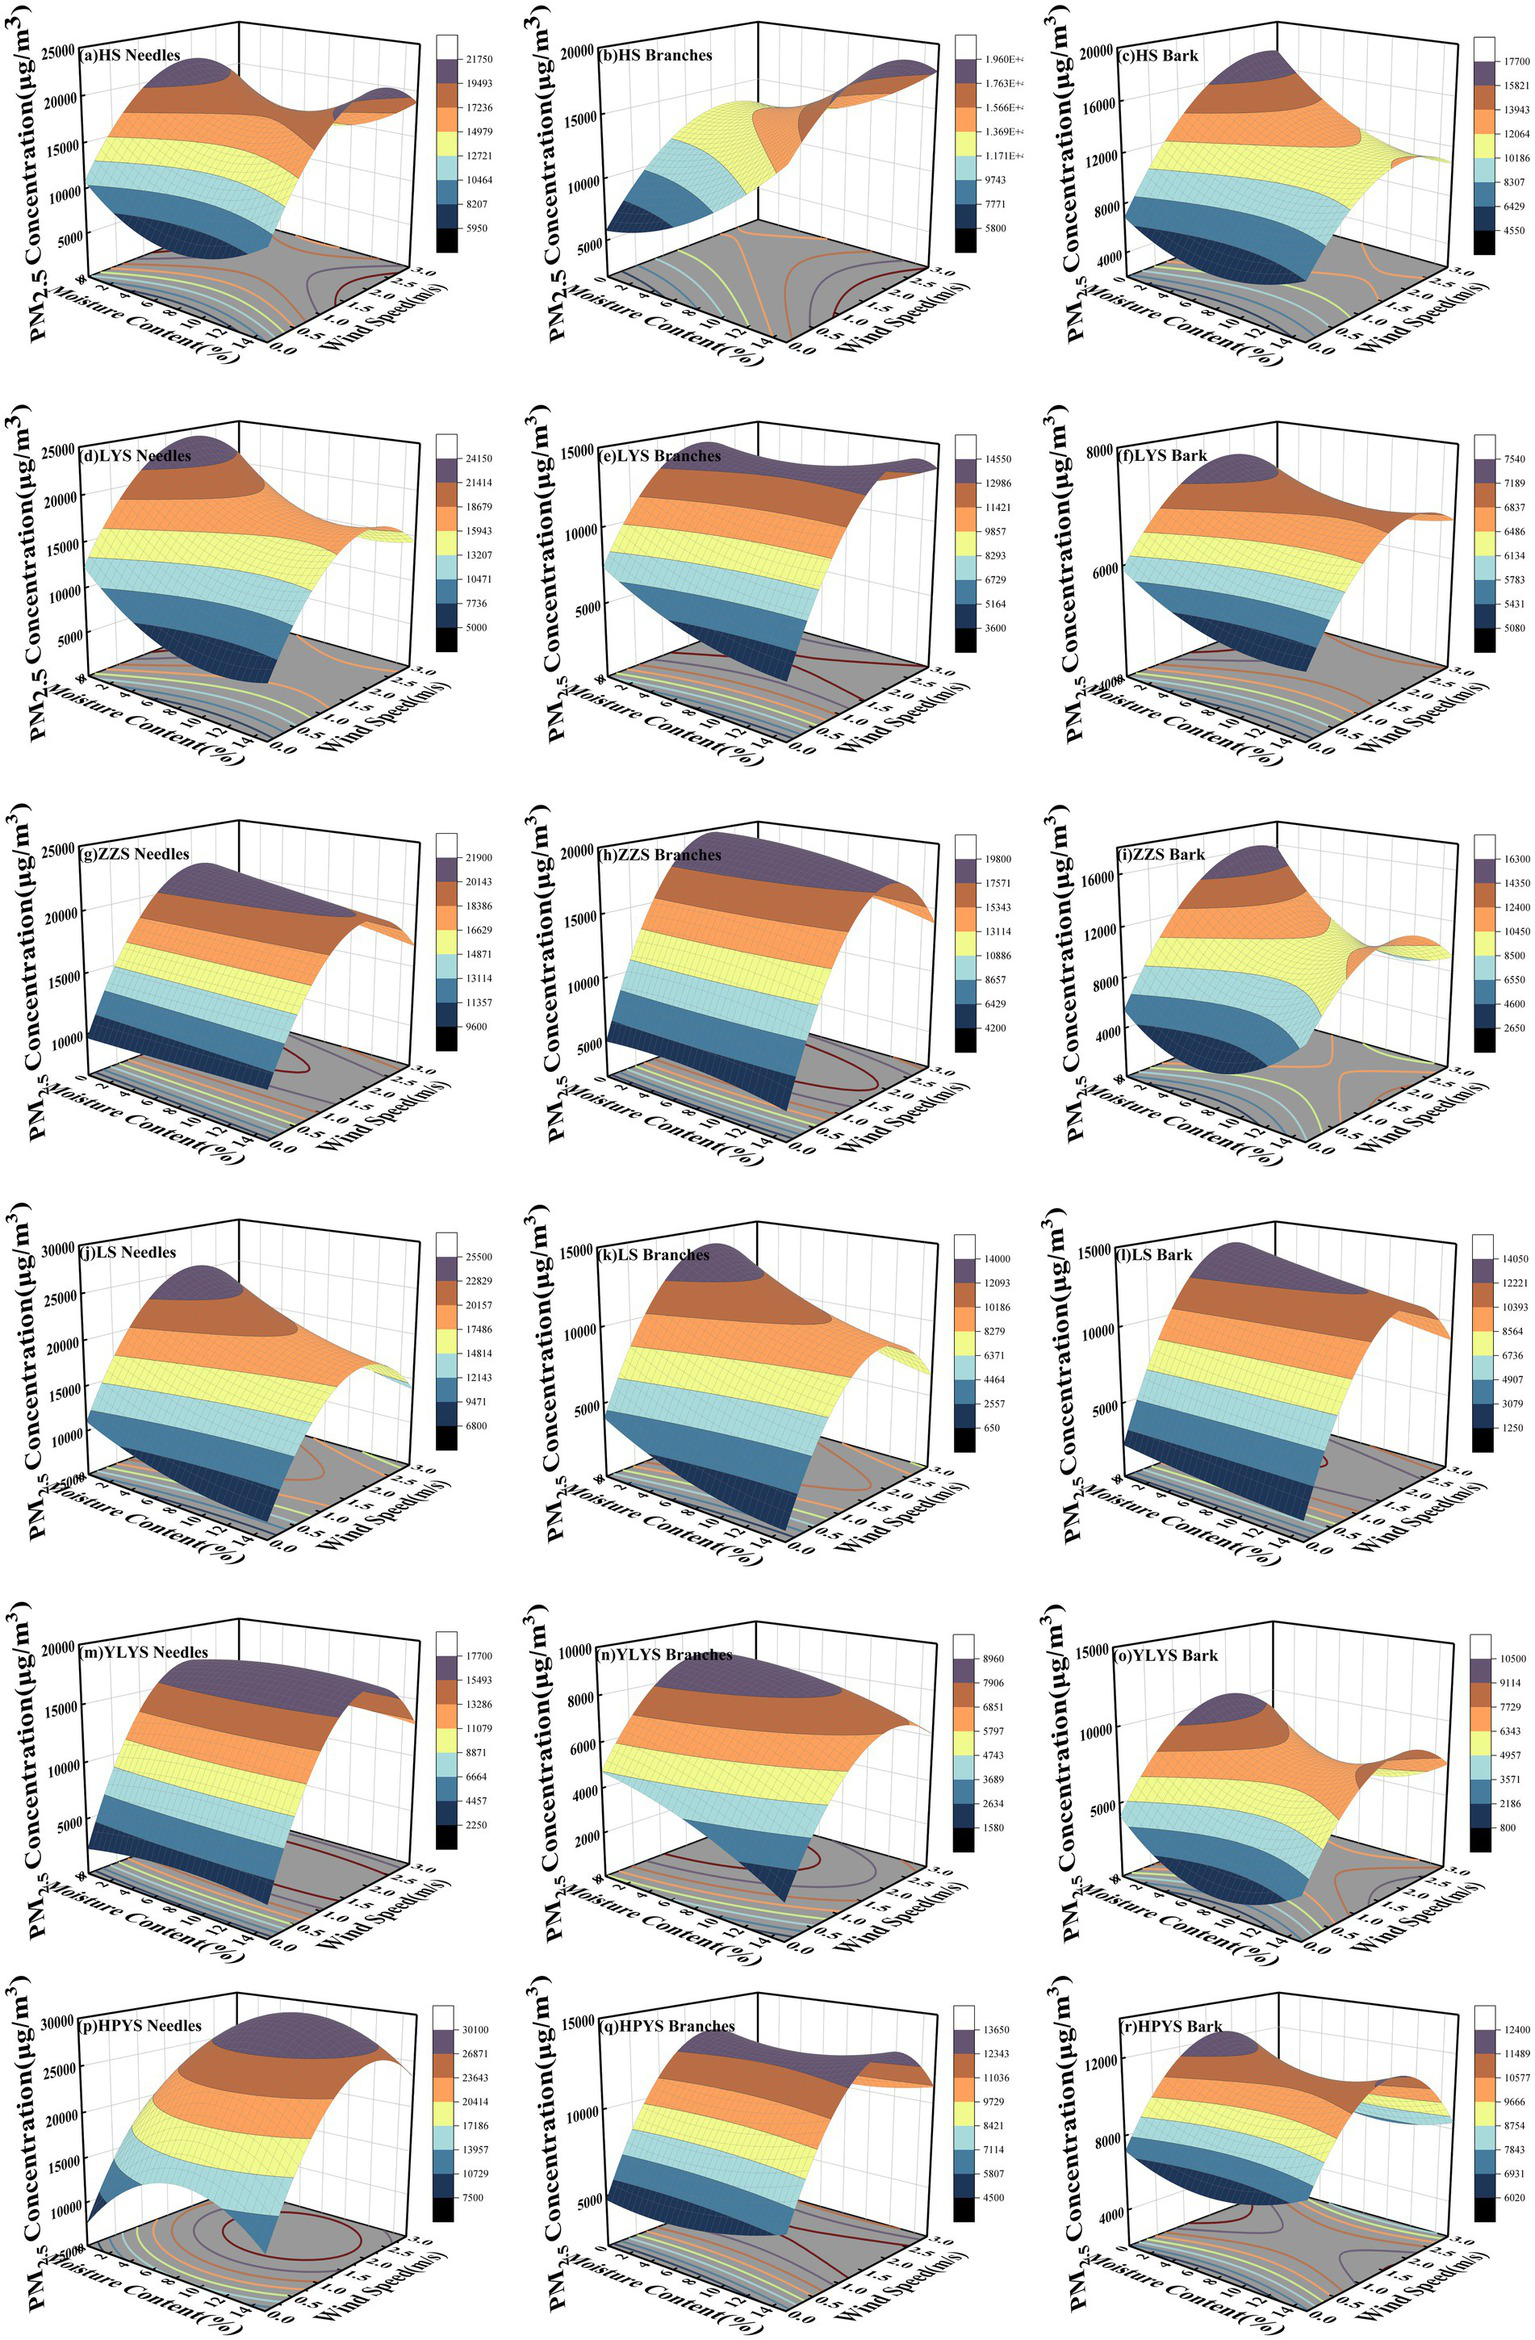
The PM2.5 concentration under the interactive effects of moisture content and wind speed at 0.5 g fuel load. (a) HS needles, (b) HS branches, (c) HS bark, (d) LYS needles, (e) LYS branches, (f) LYS bark, (g) ZZS needles, (h) ZZS branches, (i) ZZS bark, (j) LS needles, (k) LS branches, (l) LS bark, (m) YLYS needles, (n) YLYS branches, (o) YLYS bark, (p) HPYS needles, (q) HPYS branches, (r) HPYS bark.
Upon conducting an investigation into the relationship between fuel moisture content and wind speed, it was ascertained that for a fuel load of 0.5 grams, the PM2.5 concentration for the six coniferous species tends to escalate with the augmentation of wind speed. The needles of HS, the leaf branches and bark of LYS, the leaf branches of ZZS, the leaf branches and bark of LS, the leaf branches and bark of YLYS, and the needles and bark of HPYS have similar performance. Irrespective of fuel moisture content, the concentration of PM2.5 initially rises and subsequently declines with increasing wind speed. This observation can be ascribed to reduced moisture content in fuel materials promoting more complete combustion at low wind speeds. Conversely, higher moisture content hinders combustion and reduces the amount of material involved in the combustion process, which in turn leads to a decrease in PM2.5 concentration. At moderate wind speeds, the PM2.5 concentration attains its zenith. The branches of HS show that more PM2.5 is released when burning under high moisture content and high wind speed conditions. The bark of HS, the bark of ZZS, and the branches of HPYS demonstrate that the PM2.5 concentration peaks under conditions of 0% moisture content and high wind speed.
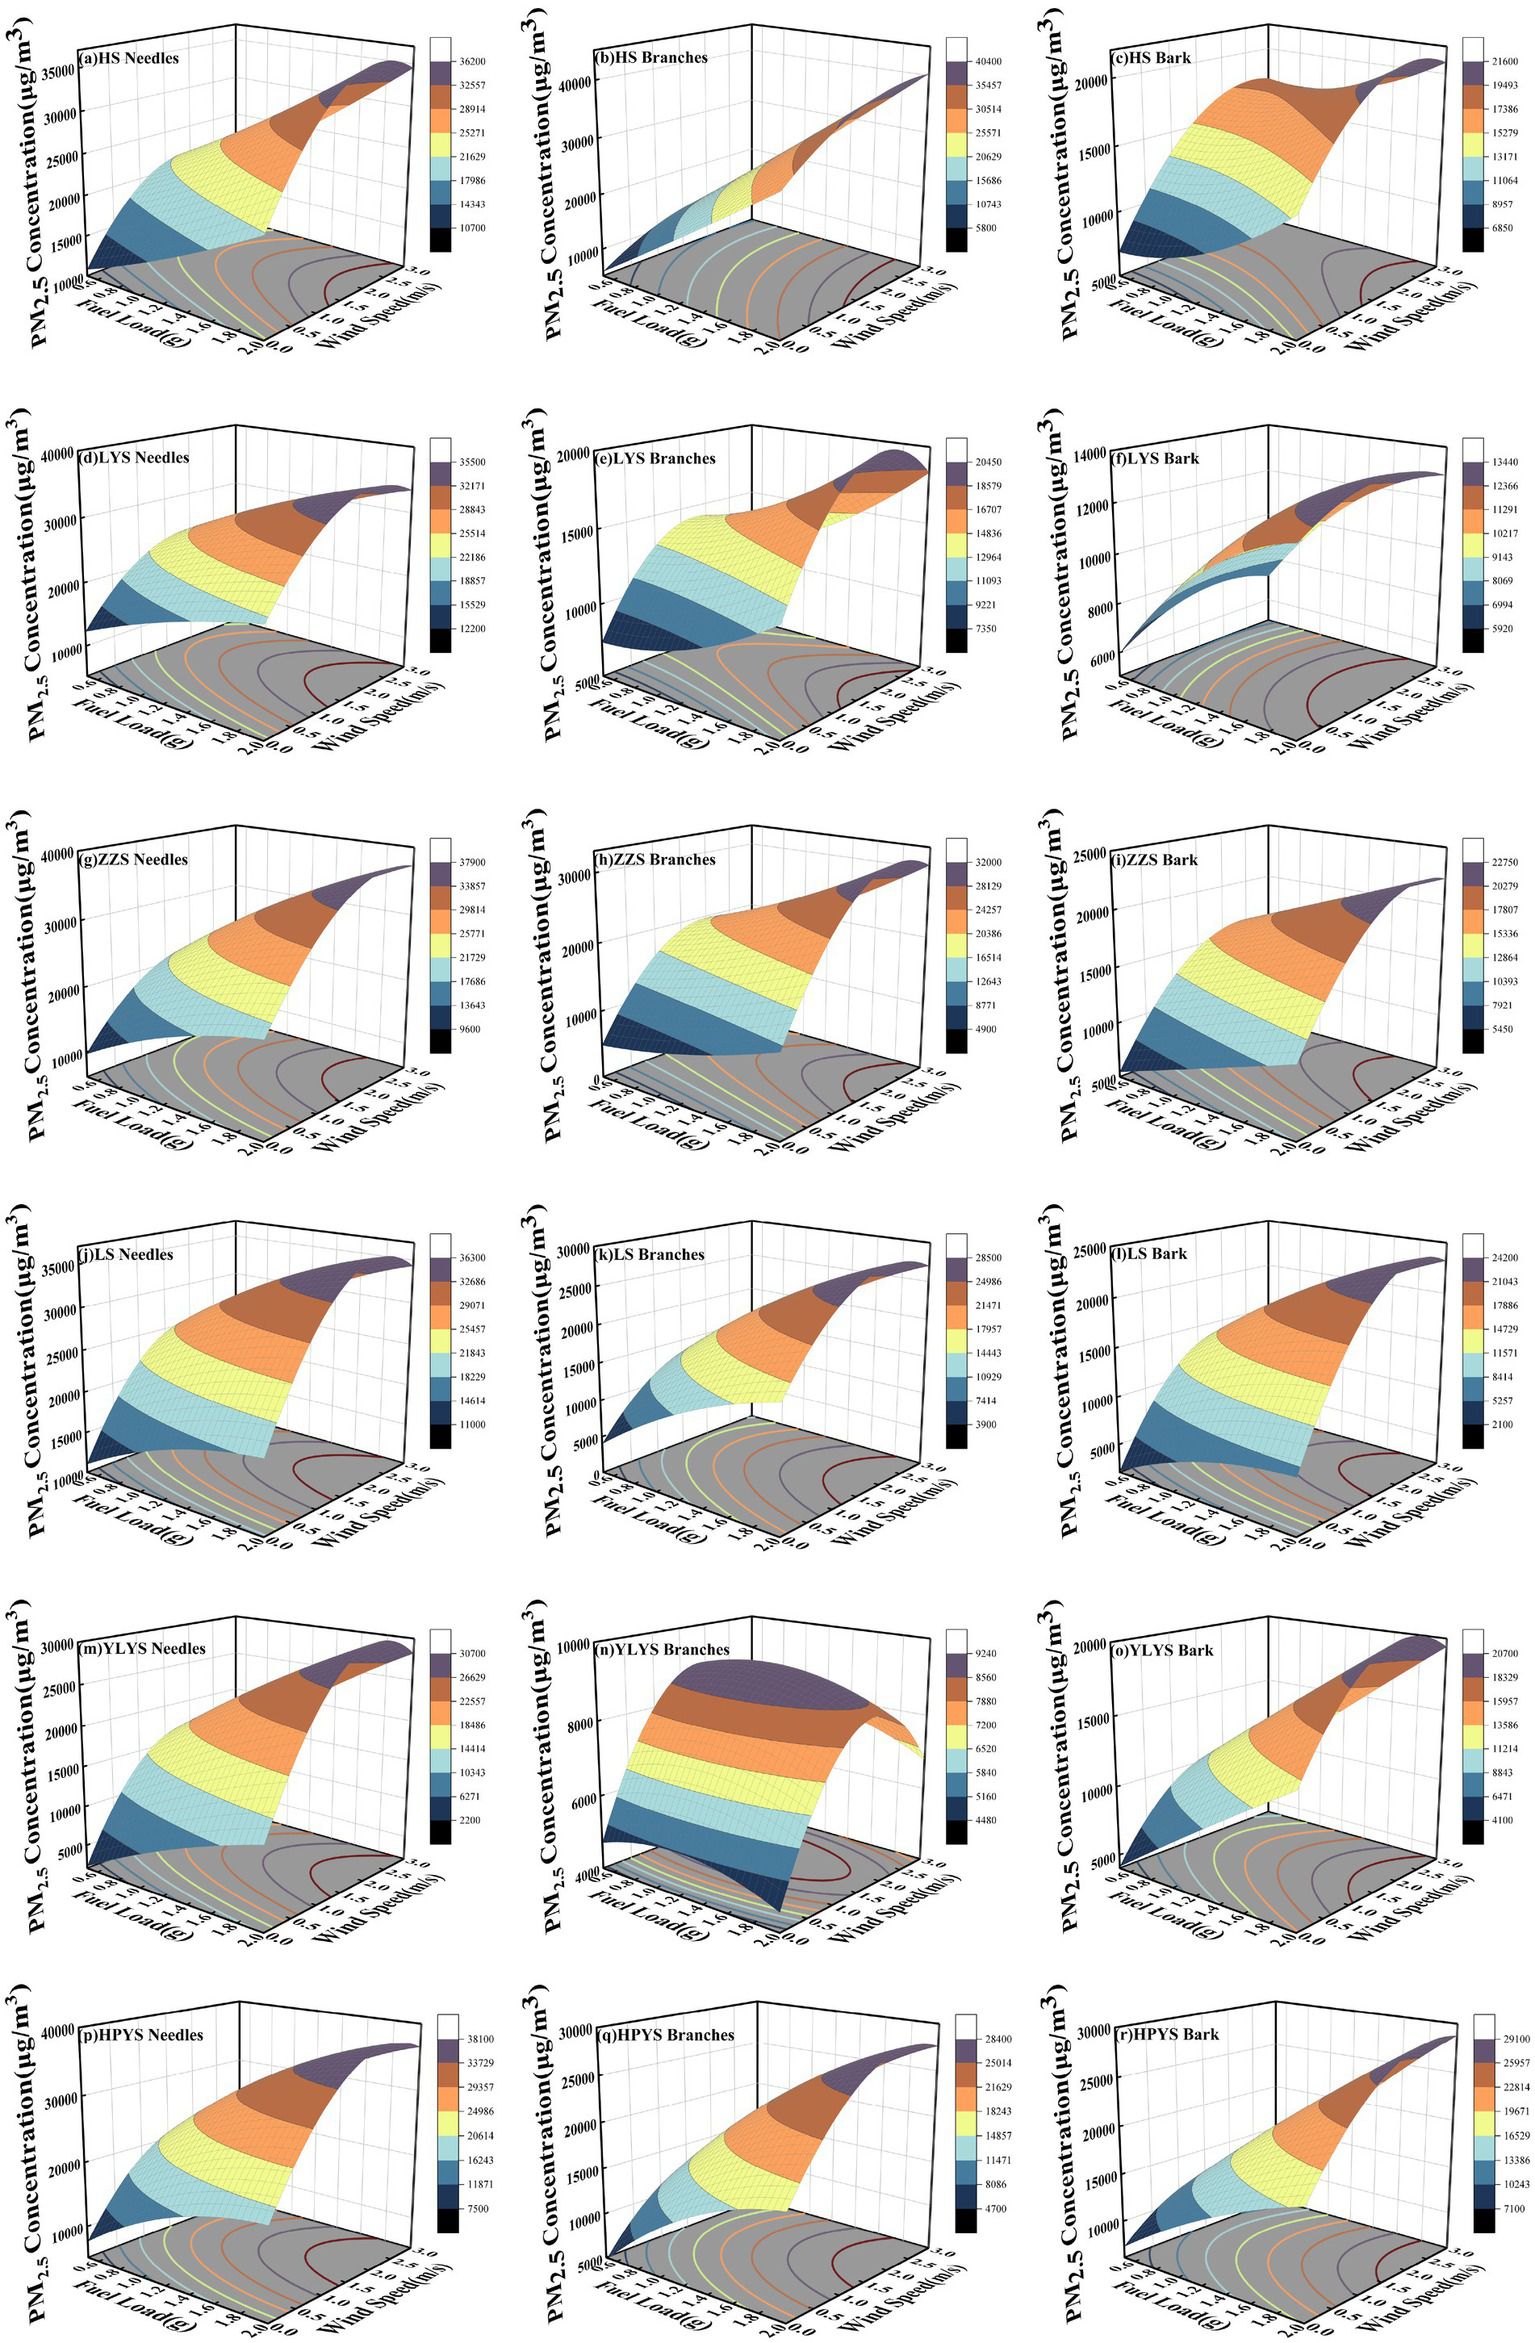
3.3.3 The effects of fuel load and wind speed on PM2.5 concentration
At a fuel moisture content of 0%, the impacts of fuel load and wind speed on PM2.5 concentration are depicted in Figure 7, as modeled by the RSM model fitted to experimental mean values.
Figure 7
The PM2.5 concentration under the interactive effects of fuel load and wind speed with a moisture content of 0%. (a) HS needles, (b) HS branches, (c) HS bark, (d) LYS needles, (e) LYS branches, (f) LYS bark, (g) ZZS needles, (h) ZZS branches, (i) ZZS bark, (j) LS needles, (k) LS branches, (l) LS bark, (m) YLYS needles, (n) YLYS branches, (o) YLYS bark, (p) HPYS needles, (q) HPYS branches, (r) HPYS bark.
Analysis of the interactive effect between fuel load and wind speed indicates that, at 0% moisture content, PM2.5 concentration from the combustion of six coniferous tree species increases significantly with increasing fuel load and wind speed. Except for the branches of the YLYS, the needles, branches, and bark of other fuel all demonstrate that under high fuel load and high wind speed combustion conditions, they can produce more PM2.5.
3.4 Analysis of multifactorial effects within the framework of linear models
To preliminarily identify the main effects and explicit interaction effects of moisture content, load, and wind speed on PM2.5 concentration, a multiple linear regression model was used for preliminary analysis. The process of model construction and validation is as follows:
The core objects of analysis include PM2.5 concentration, 5 key independent variables, and the interaction effects between variables. Among them, the independent variables consist of 2 types of categorical variables (Species, Organ) and 3 types of continuous variables [Moisture Content (MC), Fuel Load (FL), Wind Speed (WS)]. Meanwhile, 4 groups of pairwise interaction terms (Species × Organ, MC × FL, MC × WS, FL × WS) and 1 group of three-factor interaction term (MC × FL × WS) are incorporated to comprehensively quantify the impacts of single factors and the combined effects of multiple factors on the dependent variable.
To clearly quantify the impact intensity and significance of each effect, Type II sum of squares was used to conduct ANOVA to reflect the degree of variation in the dependent variable caused by the effect. The F-value and p-value are used to determine the statistical significance of the effect; the HP contribution rate reflects the relative importance of a single effect within the “model-explained variance”; the standardized β is used for horizontal comparison of the impact intensity of different effects; and partial η2 measures the independent explanatory power of a single effect for the variation in the dependent variable after controlling for other variables.(Table 1).
In terms of main effects, the main effects of Species, Organ, and Fuel Load were significant, with p < 0.0001 for all. Their partial η2 values were 0.474, 0.308, and 0.562 respectively, exhibiting strong explanatory power. Among them, Species was the largest single source of influence; Organ showed significant differences; Fuel Load had the strongest impact; Wind Speed had a smaller but significant impact; and Moisture Content had no significant main effect.
Regarding interaction effects, the Species × Organ interaction among pairwise interactions was significant and contributed substantially. All other pairwise interactions had p > 0.05, with partial η2 ≈ 0 and HP contribution rates all <0.03%, indicating no significant interaction effects. The three-way interaction was not significant (p > 0.05) with partial η2 ≈ 0, which means the combined effect of the three factors had no additional explanatory power on PM2.5. Its HP contribution rate was 0%, further confirming that it had no practical effect.
3.5 Random forest model for PM2.5 concentration evaluation
In order to ascertain the disparities in PM2.5 emission profiles among various tree species and their respective components during combustion, the present study implemented a “group-specific independent modeling” approach, culminating in the creation of 18 distinct random forest models. For each group of models, 144 combustion emission samples were included in the evaluation phase, with the application of 10-fold cross-validation. Each fold consisted of a training set containing 129–130 samples (90% of the data) and a validation set with 14–15 samples (10% of the data). The 10-fold cumulative generates 144 cross-validation predictions. Two hyperparameters were set for model construction: ntree = 500, and mtry using the default value (i.e., the square root of the total number of features). The prediction accuracy of the models was evaluated using the R2, RMSE, and Mean Absolute Error (MAE), while the 95% confidence interval was used to visually display the error fluctuation range. Figure 8 presents a scatter plot comparing the predicted and measured PM2.5 concentrations, where each point corresponds to a data pair. The close agreement between the values confirms the accurate predictive performance of the random forest model. The red dashed line represents the ideal reference line y = x, the blue solid line denotes the predicted mean line, and the blue translucent band indicates the 95% confidence interval of the predicted values. With most R2 values exceeding 0.9, the model predictions show excellent consistency with the measured data. This high degree of fit confirms the model’s capability to reliably predict PM2.5 concentrations. Based on the %IncMSE metric of the random forest model, the importance of various environmental factors was normalized to relative contribution rates (Percent, %) (Table 2). The results indicate that, across all 18 “tree species–organ” combinations, the contribution rate of fuel load ranged from 37.3 to 78.7% (average 47.8%), consistently ranking as the primary controlling factor; wind speed contributed 23.8 to 51.5% (average 36.9%), ranking second; and moisture content contributed −5.4 to 28.7% (average 15.5%), with the smallest effect. Based on the analysis using random forest models under controlled combustion conditions, fuel load emerged as the primary driving factor affecting PM2.5 concentration, while wind speed was identified as an important influencing variable of a similar order of magnitude. Within the context of this experimental framework and feature set, moisture content appeared to function primarily as a modulating factor.
Figure 8

(a) Scatter plot of RF model predictions for PM2.5 concentration from combustion of HS needles, branches, and bark. (b) Scatter plot of RF model predictions for PM2.5 concentration from combustion of LYS needles, branches, and bark. (c) Scatter plot of RF model predictions for PM2.5 concentration from combustion of ZZS needles, branches, and bark. (d) Scatter plot of RF model predictions for PM2.5 concentration from combustion of LS needles, branches, and bark. (e) Scatter plot of RF model predictions for PM2.5 concentration from combustion of YLYS needles, branches, and bark. (f) Scatter plot of RF model predictions for PM2.5 concentration from combustion of HPYS needles, branches, and bark.
Table 2
| Experimental samples | R 2 | RMSE | MAE | Relative Importance (%) | ||
|---|---|---|---|---|---|---|
| MC | FL | WS | ||||
| HS needles | 0.926 | 2986.7870 | 2475.0611 | 18.5 | 37.4 | 44.1 |
| HS branches | 0.928 | 4285.0185 | 3124.5513 | 9.8 | 29.9 | 60.3 |
| HS bark | 0.882 | 2496.2981 | 1921.7128 | 19.8 | 33.2 | 47 |
| LYS needles | 0.964 | 2789.8966 | 2294.3916 | 23.3 | 35.9 | 40.8 |
| LYS branches | 0.948 | 1710.0127 | 1472.6633 | 22.4 | 34 | 43.6 |
| LYS bark | 0.940 | 933.2178 | 729.4328 | −2.4 | 23.7 | 78.7 |
| ZZS needles | 0.939 | 3620.4277 | 3155.7153 | 15.6 | 38.7 | 45.8 |
| ZZS branches | 0.947 | 2205.4781 | 1779.1157 | −1.4 | 48.8 | 52.6 |
| ZZS bark | 0.931 | 2140.9402 | 1656.1436 | 27.9 | 29.9 | 42.3 |
| LS needles | 0.967 | 2490.2949 | 2017.6602 | 16.2 | 37.7 | 46 |
| LS branches | 0.934 | 2806.9094 | 2350.5659 | 28.7 | 34.1 | 37.3 |
| LS bark | 0.963 | 2040.0384 | 1663.5582 | 1.2 | 48.5 | 50.3 |
| HPYS needles | 0.948 | 2533.3488 | 2140.5164 | −5.4 | 51.5 | 53.9 |
| HPYS branches | 0.935 | 1785.8723 | 1464.4392 | 27 | 34.6 | 41.4 |
| HPYS bark | 0.934 | 2162.0777 | 1732.7118 | 26 | 36.5 | 37.4 |
| YLYS needles | 0.979 | 3492.4385 | 2586.2919 | 23.9 | 35.4 | 40.6 |
| YLYS branches | 0.764 | 2694.4749 | 2189.3564 | 14.8 | 38.4 | 46.8 |
| YLYS bark | 0.874 | 2550.3668 | 2072.3343 | 12.2 | 36.2 | 51.6 |
Sample-wise random forest prediction results and variable importance decomposition.
4 Discussion
In the present study, laboratory-scale combustion experiments were performed to investigate the effects of fuel moisture content, fuel load, and wind speed on PM2.5 concentration. The study revealed that the PM2.5 concentration from various tree species’ organs are subject to markedly different patterns when influenced by the combined effects of moisture content, fuel load, and wind speed. Response surface curves exhibit obvious nonlinear characteristics, and there are significant interaction effects among various factors; thus, this model can be referred to as a composite emission model controlled by multifactor coupling. The findings suggest that the interaction effects among these three factors exhibit significant differences between linear statistical analysis and the random forest model, which further indicates that their impact on the dependent variable has nonlinear characteristics, and reveals a complex emission pattern dominated by multifactor coupling. Variations in chemical composition (e.g., volatile organic compounds, lignin content) and physical structure (e.g., porosity, moisture content distribution) among tree species lead to distinct combustion pyrolysis processes and pollutant emission characteristics. Additionally, different organs of the same tree species exhibit divergent contributions to pollutant generation during combustion due to functional and structural disparities.
As shown in Figure 7, the study found that PM2.5 concentrations from coniferous tree combustion exhibited a positive correlation with fuel load and wind speed, but showed no obvious regular association with moisture content. At a wind speed of 2 m/s, PM2.5 concentrations decreased slightly, consistent with the findings of Ning et al. and Martins et al. (2012). Wind significantly increases the concentration of particulate matter downwind of forest fires and has a pronounced effect on the occurrence and spread of wildfires (Ning et al., 2023; Ning et al., 2021b; Storey et al., 2023). As wind speed increases, more oxygen is introduced into the combustion process, enhancing combustion efficiency and consequently raising particulate concentrations (Zhang Y. Y. et al., 2018; Dong et al., 2020; Yang et al., 2018). While high wind speed enhances oxygen supply and promotes combustion, excessively high wind speed can inhibit combustion (Sun et al., 2018; Zhang B. et al., 2018). High moisture content or fuel load increases fuel bed density, reducing air circulation and lowering combustion efficiency (Yang et al., 2022), indicating that PM2.5 concentration do not exhibit a simple linear relationship with bed characteristics and that the influence of bed density requires further attention. Moisture content primarily affects the combustion preheating stage: higher moisture content requires more heat for water evaporation, leading to incomplete combustion and increased PM2.5 concentration. Affected by monsoons and precipitation, the moisture content of forest fuels is variable, resulting in significant differences in emission compositions across fires (Ma et al., 2021). As shown in Figure 3, experimental results indicated that PM2.5 concentrations reached their highest levels in most coniferous trees when subjected to conditions of moderate wind speed, elevated fuel load, and low moisture content.
The Random Forest model effectively uncovers the changing patterns of PM2.5 concentrations under interactive effects of variables. Comparative analysis shows that while the model can reflect the trend of concentration changes and is applicable for predicting particulate matter released by forest fuel combustion, it exhibits underestimation of high values—a phenomenon also observed in other studies (Masinda et al., 2021; Zhang et al., 2020). Therefore, prediction points with large deviations from observed values warrant in-depth investigation. A significant limitation of this research pertains to the diminutive sample size, particularly the selection of merely five trees for each species to conduct multiple combustion experiments. This constraint on sample size may influence the model’s predictive capabilities, particularly when addressing the hierarchical structure of the data. Despite the random forest model exhibiting robust predictive performance during cross-validation, it is imperative to exercise caution when interpreting these outcomes.
There are significant discrepancies and limitations between laboratory-simulated combustion environments and real forest fires. It is challenging to replicate complex wildland meteorological conditions (such as real-time changes in wind speed/direction and fluctuations in atmospheric humidity), the spatial diversity of forest vegetation, multi-layered fuel structures (e.g., litter, shrubs, trees), topographic features, and underlying surface factors (e.g., soil, rock) that influence fire behavior. This issue has been confirmed by numerous studies in the field. For example, Zhang et al. (2023) pointed out in their field investigations in the forests of southwest Sichuan that the design of single-variable control in laboratories fails to reproduce the spatial heterogeneity of vegetation in the wild (such as the mixed distribution of dominant tree species and associated plants among six vegetation types). During the rescue of the Yajiang “3.15” forest fire, the Chinese Academy of Meteorological Sciences, using 3D scanning Doppler wind lidar, identified that near-surface instantaneous gales (measured at 16 m/s) and turbulent mixing are the key drivers behind spot fire formation. Notably, such extreme fire phenomena—including spot fires and flashovers—observed in real wildland fires are nearly impossible to replicate under controlled laboratory conditions. These differences may potentially lead to biases in predicting fire behavior and PM2.5 concentration.
This study focused on three key factors influencing PM2.5 concentrations from forest fuel combustion, filling a research gap in domestic studies on gaseous emissions from forest fuel burning. It provides important references for estimating fire smoke emissions, assessing atmospheric environmental impacts, and managing forest fuels, with practical implications for forest fire control, air quality improvement, and implementing sustainable development strategies in China. Future research should prioritize semi-field controlled experiments. In large open-air combustion facilities, researchers should establish vegetation models that highly replicate natural environments, including diverse tree species, multi-layered fuel structures (litter, shrub, and tree layers), and simulated complex terrains. Meanwhile, a complete meteorological regulation system should be developed to precisely control key parameters such as wind speed, wind direction, temperature, and humidity. Such experiments will enable in-depth investigations into fire behavior and pollutant emission patterns under multi-factor coupling, bridging the gap between laboratory simulations and real-world wildland fire scenarios, and providing more reliable data support for forest fire prevention, suppression, and pollutant dispersion forecasting.
5 Conclusion
The following conclusions were drawn from indoor combustion experiments on six coniferous tree species:
-
The relative contribution rates indicate that there are significant differences in the concentration of PM2.5 emitted during the combustion of needles, branches, and bark among six species of coniferous trees. Based on the feature importance analysis of the random forest model, fuel load and wind speed were identified as the primary drivers influencing PM2.5 concentration under the experimental conditions, whereas moisture content exhibited a more modest, regulatory effect.
-
Main effect analysis shows that species, organ, and fuel load have a significant impact on PM2.5 concentration. Among them, PM2.5 concentration increases with the increase of wind speed and fuel load, which is consistent with the basic theory of forest combustion. In contrast, the effect of moisture content within the tested range did not demonstrate a clear, monotonic trend.
-
The analysis of interactive effects indicated that high wind speed and fuel load were the primary factors influencing PM2.5 concentration dynamics. In contrast, the impact of elevated fuel moisture content was more complex, could be associated with mechanisms such as incomplete combustion or particulate hygroscopic growth during water evaporation. These mechanistic interpretations, however, require further validation via thermogravimetric analysis and other methods.
-
This study applied the random forest algorithm to construct and validate a predictive model for PM2.5 emissions from forest fires at the laboratory scale. The results demonstrate that this constructed model exhibits high predictive accuracy, with most R2 values exceeding 0.9, along with robust stability, confirming its strong potential as an effective assessment tool. This study achieves a key enhancement in model functionality by unifying high-accuracy prediction with the analysis of key driving factors. Compared to other “black-box” models with strong nonlinear fitting capabilities, such as Support Vector Machines or Neural Networks, the improvement of this trained model is reflected in that it not only delivers excellent predictive performance but also quantitatively identifies the key variables governing emissions through its built-in feature importance analysis. This contributes to transforming the model’s predictive power into scientific insights regarding emission mechanisms, offering a practical, data-driven approach to address the prevalent tendency in existing machine learning models for fire smoke prediction to “focus on prediction at the expense of attribution.”
-
As this study was conducted under controlled laboratory conditions, differences in PM2.5 concentration characteristics may exist due to the complexity of terrain, meteorological conditions, and combustion patterns in real forest fires. Laboratory-based conclusions need to be validated with field measurements. The proposed Random Forest model can provide technical support for laboratory-scale pollution prediction and may be expanded to regional fire-related air pollution early warning systems by integrating multi-source data in future research.
-
Recommendations: Prioritize fire source management and control in areas with high fuel load and low moisture content, and develop differentiated fire risk emergency plans for wind-sensitive regions. Future studies should further explore the dynamic coupling mechanisms of multiple factors and PM2.5 component characteristics to improve the scientific basis for environmental risk assessment of forest fires.
Statements
Data availability statement
The original contributions presented in the study are included in the article/supplementary material, further inquiries can be directed to the corresponding author/s.
Author contributions
YG: Conceptualization, Writing – original draft. XH: Writing – review & editing. HG: Resources, Writing – review & editing. ZW: Software, Writing – original draft. TZ: Data curation, Writing – original draft. BL: Data curation, Writing – original draft. ZS: Conceptualization, Funding acquisition, Methodology, Writing – review & editing.
Funding
The author(s) declared that financial support was received for this work and/or its publication. This research was funded by “National Key R&D Program of China (grant no. 2024YFF1306200, 2024YFF1306203).”
Acknowledgments
The authors would like to express their sincere gratitude to the College of Forestry, Northeast Forestry University, Harbin, China, for their financial support and the provision of necessary facilities. Finally, we would like to acknowledge the valuable and constructive comments provided by the reviewers, which have greatly improved the quality of this manuscript.
Conflict of interest
The author(s) declared that this work was conducted in the absence of any commercial or financial relationships that could be construed as a potential conflict of interest.
Generative AI statement
The author(s) declared that Generative AI was not used in the creation of this manuscript.
Any alternative text (alt text) provided alongside figures in this article has been generated by Frontiers with the support of artificial intelligence and reasonable efforts have been made to ensure accuracy, including review by the authors wherever possible. If you identify any issues, please contact us.
Publisher’s note
All claims expressed in this article are solely those of the authors and do not necessarily represent those of their affiliated organizations, or those of the publisher, the editors and the reviewers. Any product that may be evaluated in this article, or claim that may be made by its manufacturer, is not guaranteed or endorsed by the publisher.
Abbreviations
PM2.5, Particulate Matter with a diameter of 2.5 micrometers; HS, Pinus koraiensis; LYS, Larix gmelinii; ZZS, Pinus sylvestris var. Mongolica; LS, Abies fabri; YLYS, Picea jezoensis; HPYS, Picea koraiensis; EF, Emission factor; RSM, Response Surface Methodology; SPSS, Statistical Product and Service Solutions; ANOVA, Analysis of Variance; R2, Coefficient of Determination; RMSE, Root Mean Square Error; 3D, Three-Dimensional; MAE, Mean Absolute Error; RF, Random Forest.
References
1
Celis N. Casallas A. Lopez-Barrera E. A. Felician M. De Marchi M. Pappalardo S. E. (2023). Climate change, Forest fires, and territorial dynamics in the Amazon rainforest: an integrated analysis for mitigation strategies. ISPRS Int. J. Geoinf.12:436. doi: 10.3390/ijgi12100436
2
Chen X. H. Yang Q. Q. Chen Z. Z. Lei J. R. Wu T. T. Li Y. L. et al . (2025). The interaction between temperature and rainfall determines the probability of tropical forest fire occurrence in Hainan Island. Front. For. Glob. Change.8:1495699. doi: 10.3389/ffgc.2025.1495699
3
Cottle P. Strawbridge K. McKendry I. (2014). Long-range transport of Siberian wildfire smoke to British Columbia: Lidar observations and air quality impacts. Atmos. Environ.90, 71–77. doi: 10.1016/j.atmosenv.2014.03.005
4
Dong J. Cui R. Cheng L. Zhang Y. Song W. (2024). Fine spatiotemporal prediction of ozone in the Beijing-Tianjin-Hebei region based on the random forest method. J. Spatio-Temporal Inf. Sci.31, 348–358. doi: 10.20117/j.jsti.202403015
5
Dong T. T. T. Stock W. D. Callan A. C. Strandberg B. Hinwood A. L. (2020). Emission factors and composition of PM2.5 from laboratory combustion of five Western Australian vegetation types. Sci. Total Environ.703:134796. doi: 10.1016/j.scitotenv.2019.134796
6
Doubleday A. Schulte J. Sheppard L. Kadlec M. Dhammapala R. Fox J. et al . (2020). Mortality associated with wildfire smoke exposure in Washington state, 2006–2017: a case-crossover study. Environ. Health19:4. doi: 10.1186/s12940-020-0559-2,
7
Ewald M. Conedera M. Stavros E. N. Fassnacht F. E. (2024). Forest fires in cool-temperate and humid-continental forests-an overview. Forestry98, 1–5. doi: 10.1093/forestry/cpae063
8
He P. Zheng B. H. Zheng J. (2018). Urban PM2.5 diffusion analysis based on the improved Gaussian smoke plume model and support vector machine. Aerosol Air Qual. Res.18, 3177–3186. doi: 10.4209/aaqr.2017.06.0223
9
Heidarlou H. B. Bazarbash M. G. Borz S. A. (2024). Unveiling the role of climate and environmental dynamics in shaping Forest fire patterns in northern Zagros. Iran. Land.13:1453. doi: 10.3390/land13091453
10
Huang C. Feng J. Y. Tang F. R. He H. S. Liang Y. Wu M. M. et al . (2022). Predicting the responses of boreal forests to climate-fire-vegetation interactions in Northeast China. Environ. Model. Softw.153:105410. doi: 10.1016/j.envsoft.2022.105410
11
Ikeda K. Tanimoto H. (2015). Exceedances of air quality standard level of PM2.5 in Japan caused by Siberian wildfires. Environ. Res. Lett.10:105001. doi: 10.1088/1748-9326/10/10/105001
12
Ju Y. H. Ma X. Q. Guo L. F. Ma Y. F. Cai Q. J. Guo F. T. (2019). Characteristics of pollutants released from the combustion of Chinese fir litter and compositional analysis of PM2.5. Silvae Sin.55, 187–196.
13
Karanasiou A. Alastuey A. Amato F. Renzi M. Stafoggia M. Tobias A. et al . (2021). Short-term health effects from outdoor exposure to biomass burning emissions: a review. Sci. Total Environ.781:146739. doi: 10.1016/j.scitotenv.2021.146739,
14
Khanmohammadi S. Arashpour M. Bazli M. Farzanehfar P. (2024). Data-driven PM2.5 exposure prediction in wildfire-prone regions and respiratory disease mortality risk assessment. Fire-Switzerland7. doi: 10.3390/fire7080277
15
Law B. E. Abatzoglou J. T. Schwalm C. R. Byrne D. Fann N. Nassikas N. J. (2025). Anthropogenic climate change contributes to wildfire particulate matter and related mortality in the United States. Commun. Earth Environ.6:336. doi: 10.1038/s43247-025-02314-0,
16
Lee S.-C. Knox S. H. McKendry I. Black T. A. (2022). Biogeochemical and biophysical responses to episodes of wildfire smoke from natural ecosystems in southwestern British Columbia. Canada. Atmos. Chem. Phys.22, 2333–2349. doi: 10.5194/acp-22-2333-2022
17
Leone G. Cattani G. Cusano M. Gaeta A. Pellis G. Vitullo M. et al . (2023). Wildfires impact assessment on PM levels using generalized additive mixed models. Atmos.14:231. doi: 10.3390/atmos14020231
18
Liu X. Y. Yang G. Ning J. B. Geng D. T. Yu H. Z. Di X. Y. (2022). Mass of particulate matter released from the combustion of surface fuels in Korean pine plantations and its influencing factors. Silvae Sin.58, 97–106.
19
Ma Y. F. Yang S. Zhu Z. P. Wang G. Y. Tigabu M. Guo Y. X. et al . (2022). Emissions of gaseous pollutants released by forest fire in relation to litter fuel moisture content. Atmos. Environ.284:119215. doi: 10.1016/j.atmosenv.2022.119215
20
Ma Y. Zheng W. Guo X. Tigabu M. Guo F. (2021). Effect of forest floor fuel moisture content on chemical components of PM2.5 emitted during combustion. Chemosphere279:130547. doi: 10.1016/j.chemosphere.2021.130547
21
Martins V. Miranda A. I. Carvalho A. Schaap M. Borrego C. Sá E. (2012). Impact of forest fires on particulate matter and ozone levels during the 2003, 2004 and 2005 fire seasons in Portugal. Sci. Total Environ.414, 53–62. doi: 10.1016/j.scitotenv.2011.10.007
22
Marziliano P. A. Bagnato S. Emo E. Mercuri M. (2025). Post-fire natural regeneration and soil response in Aleppo pine forests in a Mediterranean environment. Sustainability17:8309. doi: 10.3390/su17188309
23
Masinda M. M. Li F. Liu Q. Sun L. Hu T. (2021). Prediction model of moisture content of dead fine fuel in forest plantations on Maoer Mountain, Northeast China. J. For. Res.32, 2023–2035. doi: 10.1007/s11676-020-01280-x
24
Mateos A. C. Amarillo A. C. Tavera Busso I. Carreras H. A. (2019). Influence of meteorological variables and forest fires events on air quality in an urban area (Córdoba, Argentina). Arch. Environ. Contam. Toxicol.77, 171–179. doi: 10.1007/s00244-019-00618-9,
25
Matz C. J. Egyed M. Xi G. Racine J. Pavlovic R. Rittmaster R. et al . (2020). Health impact analysis of PM2.5 from wildfire smoke in Canada (2013-2015,2017-2018). Sci. Total Environ.725:138506. doi: 10.1016/j.scitotenv.2020.138506,
26
McNorvell M.A. (2023) Fire, Fungi, Flora, and flow: Post-fire fungal community assemblages, vegetation establishment, and soil hydrophobicity in forests of the southern Rocky Mountains. Dissertation/thesis. Utah State University. Logan, UT, USA.
27
Milton L. A. White A. R. (2020). The potential impact of bushfire smoke on brain health. Neurochem. Int.139:104796. doi: 10.1016/j.neuint.2020.104796,
28
Mirzaei M. Bertazzon S. Couloigner I. Farjad B. Ngom R. (2020). Estimation of local daily PM2.5 concentration during wildfire episodes: integrating MODIS AOD with multivariate linear mixed effect (LME) models. Air Qual. Atmos. Health13, 173–185. doi: 10.1007/s11869-019-00780-y
29
Ning J. B. Di X. Y. Yu H. Z. Yuan S. B. Yang G. (2021a). Spatial distribution of particulate matter 2.5 released from surface fuel combustion of Pinus koraiensis - a laboratory simulation study. Environ. Pollut.287:117282. doi: 10.1016/j.envpol.2021.117282
30
Ning J. B. Yang G. Liu X. Y. Geng D. T. Wang L. X. Li Z. G. et al . (2022). Effect of fire spread, flame characteristic, fire intensity on particulate matter 2.5 released from surface fuel combustion of Pinus koraiensis plantation- a laboratory simulation study. Environ. Int.166:107352. doi: 10.1016/j.envint.2022.107352
31
Ning J. B. Yang G. Zhang Y. L. Geng D. T. Wang L. X. Liu X. Y. et al . (2023). Smoke exposure levels prediction following laboratory combustion of Pinus koraiensis plantation surface fuel. Sci. Total Environ.881:163402. doi: 10.1016/j.scitotenv.2023.163402,
32
Ning J. B. Zhang Y. L. Yuan S. B. Yu H. Z. Di X. Y. Yang G. (2021b). A review of fine particulate matter (PM2.5) emissions from wildfires: research progress. World For. Res.34, 52–57. doi: 10.13348/j.cnki.sjlyyj.2020.0118.y
33
Ontawong A. Saokaew S. Jamroendararasame B. Duangjai A. (2020). Impact of long-term exposure wildfire smog on respiratory health outcomes. Expert Rev. Respir. Med.14, 527–531. doi: 10.1080/17476348.2020.1740089,
34
Paroissien R. Tangney R. Thomsen A. M. Offord C. A. Ooi M. K. J. (2025). Shifts in functional group community diversity of threatened Mesic forests with changing fire regimes. For. Ecol. Manag.594:122398. doi: 10.1016/j.foreco.2025.122938
35
Pau M. Gauthier S. Boulanger Y. Ouzennou H. Girardin M. P. Bergeron Y. (2023). Response of forest productivity to changes in growth and fire regime due to climate change. Can. J. For. Res.53, 663–676. doi: 10.1139/cjfr-2022-0207
36
Quishpe-Vasquez C. Oliva P. Anne L.-B. E. Casallas A. (2024). Wildfires impact on PM 2.5 concentration in Galicia Spain. J. Environ. Manag.367:122093. doi: 10.1016/j.jenvman.2024.122093,
37
Raffuse S. O'Neill S. Schmidt R. (2024). A model for rapid PM2.5 exposure estimates in wildfire conditions using routinely available data: rapidfire v0.1.3. Geosci. Model Dev.17, 381–397. doi: 10.5194/gmd-17-381-2024,
38
Romanov A. A. Tamarovskaya A. N. Gusev B. A. Leonenko E. V. Vasiliev A. S. Krikunov E. E. (2022). Catastrophic PM2.5 emissions from Siberian forest fires: impacting factors analysis. Environ. Pollut.306:119324. doi: 10.1016/j.envpol.2022.119324
39
Sano M. Tangney R. Thomsen A. Ooi M. K. J. (2025). Extreme fire severity interacts with seed traits to moderate post-fire species assemblages. Am. J. Bot.112:e70012. doi: 10.1002/ajb2.70012,
40
Santoso M. Hopke P. K. Damastuti E. Lestiani D. D. Kurniawati S. Kusmartini I. et al . (2022). The air quality of Palangka Raya, Central Kalimantan, Indonesia: the impacts of forest fires on visibility. J. Air Waste Manag. Assoc.72, 1191–1200. doi: 10.1080/10962247.2022.2077474,
41
Shan Y. Chen X. Yin S. Cao L. Tang S. Yu B. et al . (2023). Study on the limit of moisture content of the sub-surface fires converted to the surface fires in the boreal forests of China. Fire6:364. doi: 10.3390/fire6090364
42
Souane A. A. Khurram A. Huang H. Shu Z. Feng S. Belgherbi B. et al . (2025). Utilizing machine learning and geospatial techniques to evaluate post-fire vegetation recovery in Mediterranean Forest ecosystem: Tenira. Algeria. Forests.16:53. doi: 10.3390/f16010053
43
Storey M. A. Price O. F. Fox-Hughes P. (2023). The influence of regional wind patterns on air quality during forest fires near Sydney. Australia. Sci. Total Environ.905:167335. doi: 10.1016/j.scitotenv.2023.167335,
44
Su W. Q. Tang C. X. Lin J. H. Yu M. J. Dai Z. M. Luo Y. et al . (2022). Recovery patterns of soil bacterial and fungal communities in Chinese boreal forests along a fire chronosequence. Sci. Total Environ.805:150372. doi: 10.1016/j.scitotenv.2021.150372,
45
Sun P. Zhang Y. L. Sun L. Hu H. Q. Guo F. T. Wang G. Y. et al . (2018). Influence of fuel moisture content, packing ratio and wind velocity on the ignition probability of fuel beds composed of Mongolian oak leaves via cigarette butts. Forests9:507. doi: 10.3390/f9090507
46
Wang Y. F. Xiao S. Y. Zhang Y. H. Chang H. Martin R. Van Donkelaar A. et al . (2022). Long-term exposure to PM2.5 major components and mortality in the southeastern United States. Environ. Int.158:106969. doi: 10.1016/j.envint.2021.106969,
47
Wasserman T. N. Mueller S. E. (2023). Climate influences on future fire severity: a synthesis of climate-fire interactions and impacts on fire regimes, high-severity fire, and forests in the western United States. Fire Ecol.19:43. doi: 10.1186/s42408-023-00200-8
48
Wei M. Guo X. B. Ma Y. F. Guo Y. X. Sun X. Y. Tian M. Y. et al . (2022). Carbon emission characteristics from the combustion of branches and leaves of typical tree species in different Forest regions of China. J. Beijing For. Univ.44, 37–46. doi: 10.12171/j.1000−1522.20200419
49
Wu Z. Y. Hasham A. Zhang T. B. Gu Y. Lu B. B. Sun H. et al . (2024). Analysis of PM2.5 concentration Released from Forest combustion in Liangshui National Natural Reserve, China. Fire7:311. doi: 10.3390/fire7090311
50
Wu S. Y. Li D. L. Liu L. B. Zhang W. T. Liu K. D. Zhao W. Y. et al . (2023). Global patterns and influencing factors of post-fire land cover change. Glob. Planet. Change.223:104076. doi: 10.1016/j.gloplacha.2023.104076
51
Yang G. Ning J. Shu L. Zhang J. Yu H. Di X. (2022). Spotting ignition of larch (Larix gmelinii) fuel bed by different firebrands. J. For. Res.33, 171–181. doi: 10.1007/s11676-020-01282-9
52
Yang G. Zhang Y. Y. Di X. Y. Sun J. Zhao F. J. (2018). PM2.5 emissions from the combustion of Mongolian oak bed layers and their influencing factors. J. Northeast For. Univ.46:66-69+74. doi: 10.13759/j.cnki.dlxb.2018.11.013
53
Zhang Y. Y. Di X. Y. Zhao F. J. Yu H. Z. Yang G. (2018). Influencing factors of PM2.5 emission from combustion of surface needle fuel in Korean pine plantations. J. Beijing For. Univ.40, 30–40. doi: 10.13332/j.1000-1522.20170446
54
Zhang B. Jiao L. Xu G. Zhao S. Tang X. Zhou Y. et al . (2018). Influences of wind and precipitation on different-sized particulate matter concentrations (PM2.5, PM10, PM2.5-10). Meteorog. Atmos. Phys.130, 383–392. doi: 10.1007/s00703-017-0526-9
55
Zhang H. Li H. Liu X. Y. Ma Y. J. Zhou Q. Sa R. et al . (2022). Emissions released by Forest fuel in the daxing’an mountains. China. Forests.13:1220. doi: 10.3390/f13081220
56
Zhang L. Sun P. Liu S. (2020). Transpiration characteristics of different recovery stages of subalpine forests in Western Sichuan during the growing season. For. Sci.56, 1–9.
57
Zhang Y. Xiang D. Guo H. Kong L. Gao Y. Ma A. (2023). Research on the distribution of combustible materials and potential fire behavior in Southwest Sichuan forests. J Nat Disasters32, 108–116.
58
Zheng C. Y. Lin H. C. Zhan X. Y. Huang Z. Y. Ma Y. F. Zheng W. X. et al . (2024). Correlation analysis of element contents between forest fuel and PM2.5 released by combustion of main tree species in Fujian Province. Chin. J. Ecol.43, 333–341. doi: 10.13292/j.1000-4890.202402.023
59
Zheng W. X. Ma Y. F. Tigabu M. Yi Z. G. Guo Y. X. Lin H. C. et al . (2022). Capture of fire smoke particles by leaves of Cunninghamia lanceolata and Schima superba, and importance of leaf characteristics. Sci. Total Environ.841:156772. doi: 10.1016/j.scitotenv.2022.156772
60
Zou S. Duan W. Wang Y. Mou M. Wang S. (2024). Changes in soil organic carbon forms and mineralization rates under different restoration methods after clear-cutting of broad-leaved Korean pine forests. For. Eng.40, 79–90.
Summary
Keywords
coniferous trees, indoor simulated combustion, influencing factors, PM2.5, random forest, RSM model
Citation
Gu Y, Han X, Gao H, Wu Z, Zhang T, Lu B and Shu Z (2026) Investigating the characteristics of PM2.5 emissions from coniferous trees during indoor simulated combustion utilizing a random forest model. Front. For. Glob. Change 9:1744104. doi: 10.3389/ffgc.2026.1744104
Received
11 November 2025
Revised
10 January 2026
Accepted
12 January 2026
Published
05 February 2026
Volume
9 - 2026
Edited by
Ana Cristina Russo, University of Lisbon, Portugal
Reviewed by
Mark Potosnak, DePaul University, United States
Puneeta Pandey, Central University of Punjab, India
Updates
Copyright
© 2026 Gu, Han, Gao, Wu, Zhang, Lu and Shu.
This is an open-access article distributed under the terms of the Creative Commons Attribution License (CC BY). The use, distribution or reproduction in other forums is permitted, provided the original author(s) and the copyright owner(s) are credited and that the original publication in this journal is cited, in accordance with accepted academic practice. No use, distribution or reproduction is permitted which does not comply with these terms.
*Correspondence: Zhan Shu, shuzhan@nefu.edu.cn
Disclaimer
All claims expressed in this article are solely those of the authors and do not necessarily represent those of their affiliated organizations, or those of the publisher, the editors and the reviewers. Any product that may be evaluated in this article or claim that may be made by its manufacturer is not guaranteed or endorsed by the publisher.