Abstract
Revegetation has been proposed as one of the effective methods for enhancing carbon (C) and nitrogen (N) sequestration. However, the magnitude and direction of soil C and N changes following revegetation remain unclear. To address this issue, we conducted a synthesis analysis based on 6,171 observations of soil organic carbon (SOC) and total nitrogen (STN) from 183 studies in 0–200 cm depth across the Chinese Loess Plateau. Our results revealed revegetation type-specific soil C and N stocks of four soil profiles (0–20, 20–100, 100–200, and 0–200 cm) following five restoration ages (0–5, 6–10, 11–20, 21–30, and > 30 years). In general, significant increases in soil C and N stocks were respectively, observed 21 and 31 years after revegetation for the whole soil layer. In addition, the soil C and N stocks of shrub and grassland were chronologically asynchronous between the deep layer (deeper than 100 cm) and shallow layers, whereas that of forest showed more or less similar temporal dynamics only with slight differences in change rates. Such cross-layer asynchronous were also presented for precipitation and temperature, of which the influences in different soil layers exhibited great nonlinear patterns with different turning points in response to the two climatic factors. Furthermore, compared with natural succession, planted vegetation induced relatively more intensive changes of soil C and N, especially for the forest. Overall, our results revealed revegetation-induced asynchronous changes of soil C and N particularly in the deep layers, and suggest that different patterns of soil C and N stocks should be incorporated into soil C and N modeling and estimation.
1 Introduction
Revegetation has been regarded as an available strategies in combating climate change and land degradation (Shi et al., 2013; Deng et al., 2014). Over the past decades, the implementation of revegetation (e.g., China’s “Grain for Green” Program) has demonstrated significant positive effects on ecological functions, particularly on the processes related to soil carbon (C) and nitrogen (N) (Guo and Gifford, 2002; Paul et al., 2002; Deng and Shangguan, 2016). The soil C and N stocks are critical to the stability and sustainability of ecosystems. Accordingly, the revegetation-related alteration of soil C and N stocks have been attracting increasing attention (O’Connell et al., 2003; Hu et al., 2017; Tuo et al., 2018). In particular, deep soil layers, typically defined as those below 100 cm depth, represent a significant yet understudied component of terrestrial C and N pools that may respond more complex to revegetation compared to surface horizons.
In fact, considerable studies have confirmed the storage of large amounts of C and N in deep soils. For example, a study on the northwest coast of the United States evidenced that deep soil stored about 21% of total soil C and 31–45% of total soil N within a depth of 0–250 cm (James et al., 2015). The deep layers in tropical peatlands and permafrost region may contain more than 70% of total soil C with the depth of 0–300 and 0–400 cm, respectively (Köchy et al., 2015). Studies in the central China indicated that deep soil carbon storage significantly outweighs that of shallow soils, with deep layers holding approximately 1.9–2.2 times the organic carbon of shallow layers and comprising over 60% of total carbon storage, highlighting the critical contribution of deep soil carbon to the regional carbon pool (Gao et al., 2017; Gao et al., 2017; Li et al., 2020; Yu et al., 2020). The deep soil C and N have been long assumed stable over millennial timescales (Fontaine et al., 2007; Schmidt et al., 2011), but increasing evidences strongly indicate their higher and more complex vulnerability to disturbances caused by environmental changes, particularly the revegetation (Liu et al., 2018; Vaughn and Torn, 2019; Lan et al., 2021; Zhou et al., 2024).
Indeed, revegetation brings great uncertainties over the dynamics of soil C and N stocks more in deep layers than the shallow layers through complex mechanisms with two antagonistic sides. On one hand, revegetation contributes to the accumulation of C and N both in shallow and deep soils by enhancing the deep roots. This effect determines the magnitude and vertical distribution of soil C and N, especially in the arid and semi-arid regions (Davidson et al., 2011; Rumpel and Kögel-Knabner, 2011). On the other hand, the development of deep roots may reduce the C and N stock in deep soil due to three mechanisms. Firstly, the deep root penetration may accelerate the decomposition of deep millennia-old soil organic matter (Guenet et al., 2010; Shahzad et al., 2018), as findings indicated that fresh C inputs accelerate the mineralization rates deep soil organic matter, and increase its instability much more than we thought previously (Bernal et al., 2016; Shahzad et al., 2019). Secondly, revegetation contribute to the decrease of soil nutrients in deep layers and the increases in shallow layers by enhancing the “nutrient pumping” effects (Chen et al., 2016). Particularly, deep-rooted plants with high N residence time reduces the annual flux of N from the plant pool back to the soil pool (Laungani and Knops, 2009), leading to an enhanced plant N pool and depleted soil N pool (Knops et al., 2002; Chai et al., 2019). Thirdly, revegetation may bring intensive change of deep soil moisture and temperature that mediate microbial activities and associated processes of soil C and N, and consequently complicate the dynamics of deep soil C and N and their coupling relationships. Particularly in semi-arid environment (Cui et al., 2020), The deep soil moisture which is insensitive to daily evapotranspiration and regular rainfall events (Fang et al., 2016) depleted dramatically following revegetation and tended to form soil dried layer limiting the sustainability of ecosystems (Wang et al., 2010; Su and Shangguan, 2019). Findings evidenced that the soil C stock in deep soil layers increased in the middle stage and a decreased in the later stage of restoration, probably due to the change of soil moisture (Li et al., 2020).
Under the aforementioned context of complex mechanisms of revegetation over deep soil C and N, it will be undoubtedly helpful to resolve the general temporal patterns and associated factors in deep soil C and N following revegetation, since the dynamics of soil N and the C-N coupling are critical for the sustainability of ecosystem C sequestration over the long term (Luo et al., 2004; Luo et al., 2006). This is particularly important for the arid and semi-arid regions because of their vulnerable ecosystems. The Loess Plateau of China, as a typical arid and semi-arid region, has experienced a significant revegetation procedure in the past decades. Specifically, before the revegetation, agricultural exploitation has led to severe land degradation and become one of the most eroded regions in the world (Gao et al., 2017). To recover the ecosystem, the Chinese government started many pilot revegetation projects from 1970s, and launched the “Grain for Green” project in 1999, which increased the vegetation coverage in key regions such as the Loess Plateau from 31.6% in 1999 to 65% in 2021, resulting in significant greening and ecological benefits (Wang X. et al., 2025). Such large-scale revegetation certainly changed the soil C and N stocks.
While the changes of C and N stocks have been frequently examined in shallow and deep soil layers at different locations in the Loess Plateau of China with relatively small sample sizes (Lan et al., 2021; Ma et al., 2025; Wang R. et al., 2025), such dynamics during the restoration ages remain requiring more comprehensive examination based on a larger size of data. To this end, we present this comprehensive study aimed at twofold objectives: (1) establishing the temporal patterns of deep soil C and N stock change rates for different vegetation types; (2) determining the deep soil C and N changes under precipitation and temperature gradients. We hypothesize that deep soil C and N stock can change following the revegetation, and deep soil C and N stock changes are comparable to the shallow soil layers. To achieve these objectives, we collected data from 183 recent publications in the Loess Plateau, and synthesized their finds related to soil C and N changes. Overall, this study may to provide important implications for human-mediated ecological restoration for regions with similar environmental conditions around the world.
2 Materials and methods
2.1 Data collection
We compiled data from 183 peer-reviewed publications examining changes in soil carbon and nitrogen stocks following revegetation (Supplementary Table S1), in accordance with the following inclusion and exclusion criteria (Figure 1). Studies were included if they: (1) specifically examined soil organic carbon (SOC) or total nitrogen (STN) after revegetation; (2) reported or allowed calculation of the time since revegetation; (3) presented data from field survey rather than controlled experiments. Studies were excluded if they: (1) sampled at fertilized soils. In addition, we carefully reviewed publications from the same or closely related research groups to ensure that no observation appeared more than once in the dataset. The original data were extracted from either directly from the tables, or indirectly from the figures using GetData Graph Digitizer (Digitizer), which resulted in 6,271 observations from 41 sites between 2000 and 2020. For each observation, the following data were collected: data source, geographic location (longitude and latitude), annual mean precipitation and temperature, vegetation type (forest, shrub, or grassland), years since revegetation, soil depth, bulk density, as well as the amounts (or stocks) of soil organic carbon (SOC) and soil total nitrogen (STN) within the 0–200 cm soil profile. To account for inconsistent depth reporting among studies and to reduce associated uncertainty, the data were standardized into four depth intervals: 0–20, 20–100, 100–200, and 0–200 cm. Such configuration of soil layers allows to capture vertical heterogeneity in soil properties, function and vegetation impacts, which is also well-established pedological principles and previous research frameworks. For studies with multiple sampling depths, SOC and STN stocks were aggregated to match our target depth intervals. The duration since revegetation was classified into five stages: 0–5, 6–10, 11–20, 21–30, and > 30 years.
FIGURE 1

The distribution of sampling points. distribution of sampling points.
2.2 Data calculation
The soil C and N stock were calculated according to Equations 1, 2 with the unit converted to Mg ha−1.
where SOC and STN denotes soil organic carbon concentration and soil total nitrogen concentration (g kg–1), BD denotes bulk density (g cm–3), and D denotes soil thickness (cm). When calculating soil C stock, for those samples with only soil organic matter (SOM), their SOC were computed based on the relationship between SOM and SOC (Guo and Gifford, 2002), described as Equation (3):
Some of the observations did not provide measured BD. In this case, the BD values were estimated according to the empirical relationship between soil C and BD in accordance with previous publications (Wu et al., 2003; Deng et al., 2014), described as Equations 4, 5. Some of the observations provided multiple BD values for specific soil layers. In this case, we developed multi-models using random forest (described in section 2.3) trained and tested with 10 folds cross-validation strategy using the self-written code (Supplementary Table S2 and Supplementary Figure S1).
To increase the comparability of data derived from different studies, we developed a method for quantifying the relationship between shallow and deep soil C and N stock (Supplementary Figures S2, S3). Since the Loess Plateau is characterized by thick soil, drastic land-use changes, severe soil erosion, and semi-arid environment, it is also necessary and feasible to develop a self-adapted function for demonstrating the relationship between shallow and deep soil C stocks or soil N stocks in this region. The stability of these functions was tested with 10-folds cross-validation.
The rates of soil C and N stock changes were estimated depending on their time sequences. We constructed a linear regression equation [y = f(x) = y0 + kx] between soil C stocks or soil N stocks and years since revegetation according to the previous publication (Deng and Shangguan, 2016), described as Equation (6):
The equation’s first derivative represents the rate of change of the curve, so the first derivative of soil C stock or soil N stock versus years from Equation 6 represents the rate of change in soil C stock or soil N stock, as described as Equation (7):
where y0 denotes a constant, k denotes the rate of change in soil C or N stock (Mg ha–1yr–1) and also represents the slope of Equation (6), and Year denotes the time since revegetation (year). The rate ratio of soil C and N stock change was employed to detect the relative change of soil C and N in different restoration periods and soil depths, as described in Equation (8):
Additionally, under the precipitation and temperature gradients where there were two change rates for soil C and N stocks, the first ratio was calculated by k1 before the turning points, while the second ratio was calculated by k2 after the turning points.
2.3 Data analysis
The Kruskal-Wallis test was employed to detect the impacts of vegetation types, restoration years and their interactions on the soil C and N stocks, since the stock values do not follow normal distribution. This method also brings added value of robustness since the data unevenly in different groups. The test was performed by the function kruskal in the agricolae package of R 4.0 (de Mendiburu, 2023).
The random forest was employed to predict the BD value for the reconstruction of the soil C and N stock depth functions with the randomForest package in R 4.0 (Breiman, 2001; Breiman et al., 2024). The method is suited for such prediction because it is robust to missing and non-equilibrium data, and also less sensitive to multiple collinearities. The models were tested with 10-folds cross-validation for prediction using self-written codes (Supplementary Table S2).
The segmented regression was employed to detect the sensitivity of soil C and N stock changes under climatic gradients (Muggeo, 2025) using the davies.test in R 4.0 (Davies, 1987). This method allows to model the relationship of a response with one or more variables by two or more straight lines connected at unknown turning points (breakpoints, changepoints or join points). The model turns to linear regression if there is no turning point.
3 Results
3.1 Dynamic patterns of soil C and N stocks under entire “Grain for Green” program
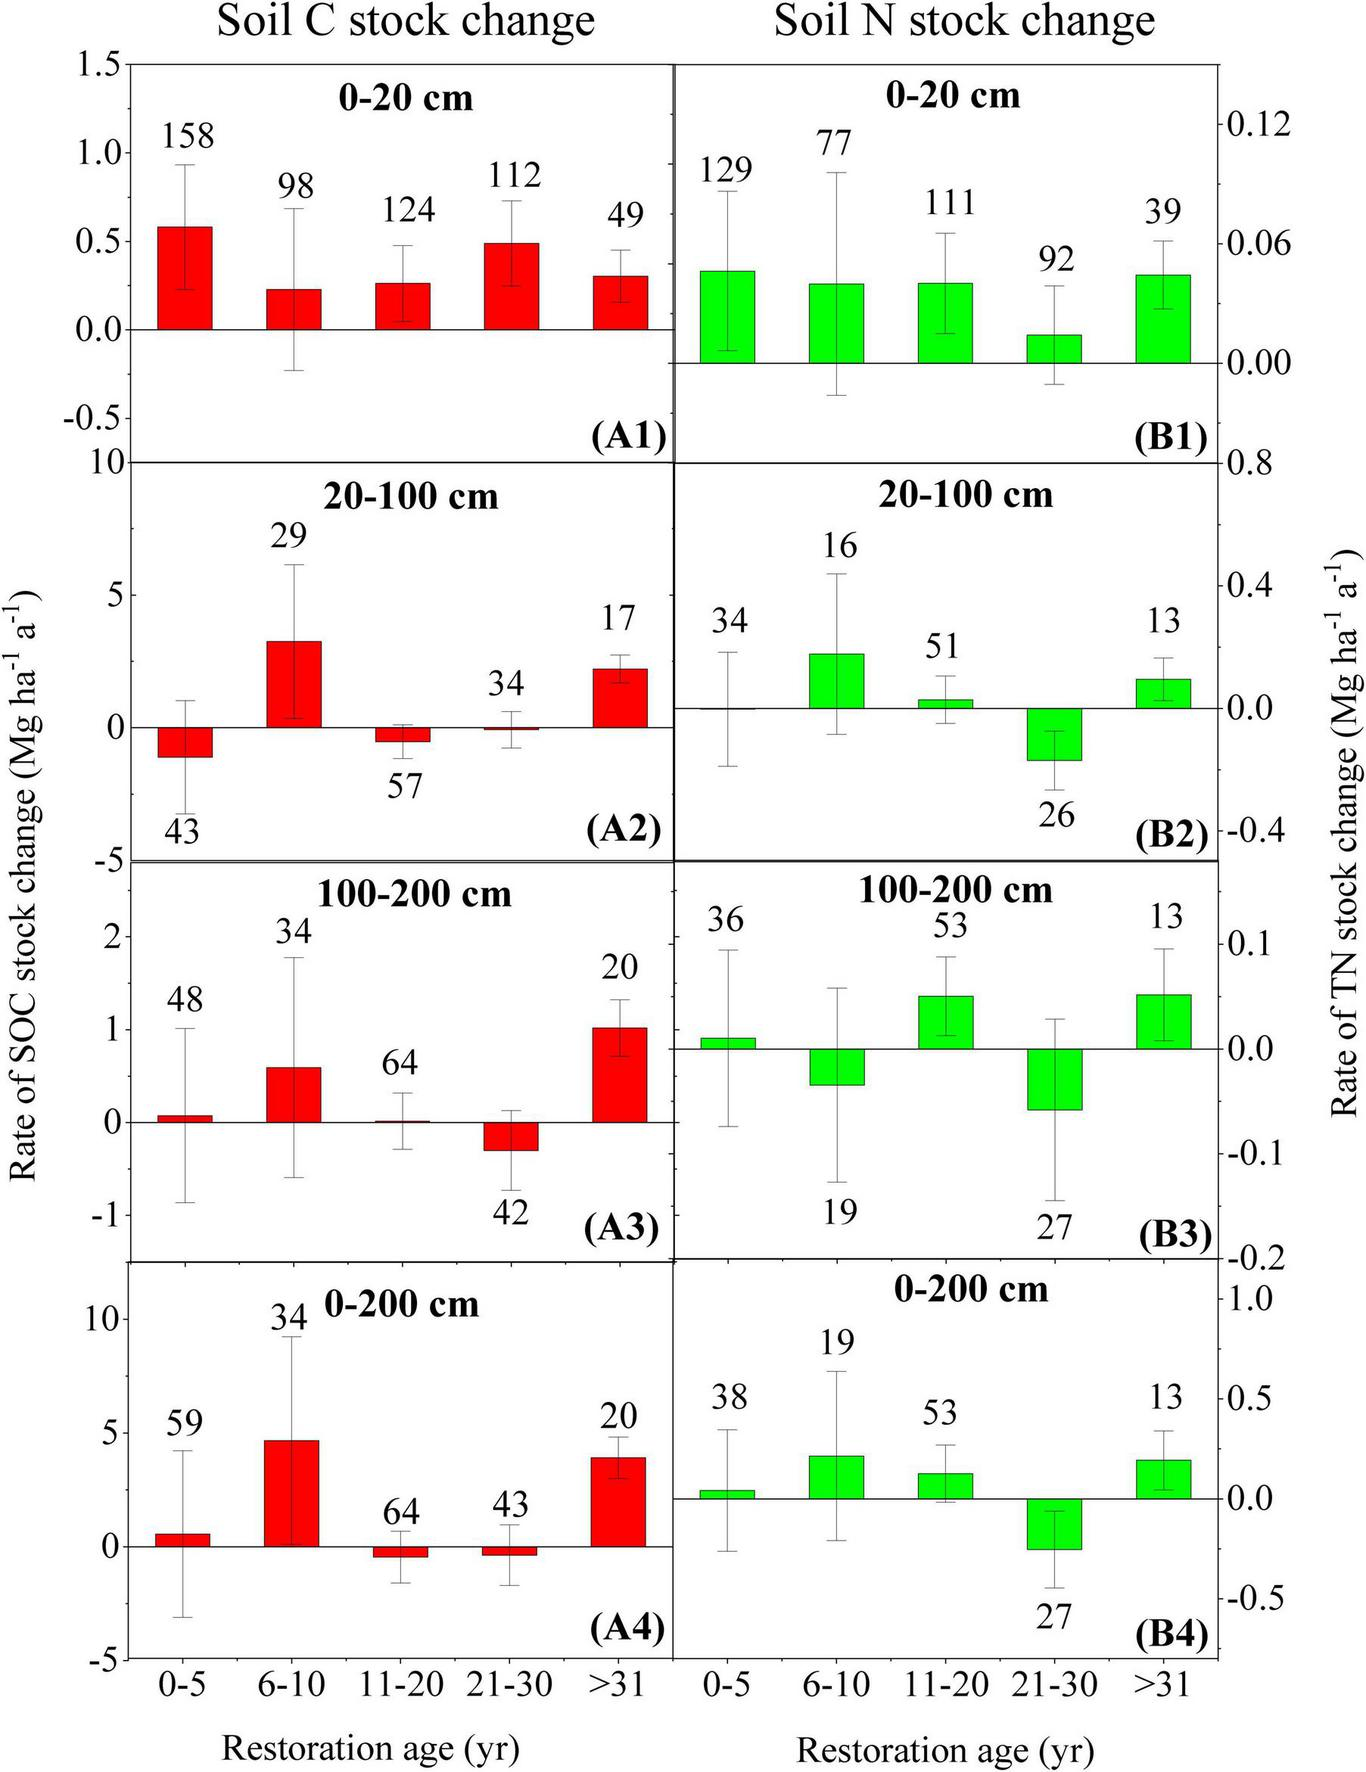
Revegetation significantly altered soil C and N stocks throughout the 0–200 cm profile across the entire “Grain for Green” project, with distinct temporal patterns depending soil depth and restoration age (Figure 2). In the upper 20 cm layer, the rate of change in soil C stocks initially increased, subsequently declined, and eventually peaked after 31 years (Figure 2A1). Meanwhile, soil N stocks showed a consistent upward trend, except during the 21–30 years period (Figure 2B1). In the 20–100 cm layer, soil C stocks decreased sharply during the first decade, followed by a gradual increase (Figure 2A2), whereas soil N stocks exhibited alternating phases of decrease and increase across successive 5-year intervals (Figure 2B2). The 100–200 cm layer showed a similar pattern for soil C stock changes as the 20–100 cm layer (Figure 2A3), while changes in soil N stocks were more comparable to those in the 0–20 cm layer (Figure 2B3), both with relatively lower rates. Across the entire soil profile, C and N sequestration in the deep layer lagged behind that in the surface layers, with net gains of soil C and N observed after 21 and 31 years of revegetation, respectively (Figures 2A4,B4). Overall, across the revegetation chrono sequence, the rate of change in C storage in the 0–200 cm soil layer (Figure 2A4) shifted from negative values in early stages (–0.67 Mg ha−1 yr−1 at 0–5 years and –2.72 Mg ha−1 yr−1 at 6–10 years) to positive accumulation in later stages (0.10, 1.36, and 2.18 Mg ha−1 yr−1 at 11–20, 21–30, and > 30 years, respectively). The rate of change in N storage was 0.03, 0.12, 0.03, –0.27, and 0.09 Mg ha−1 yr−1 for the same revegetation periods, respectively (Figure 2B4).
FIGURE 2

Changes in soil C and N stocks over time following revegetation across the entire “Grain for Green” project in China. (A1–A4) Represent soil C stock changes in the 0–20, 20–100, 100–200, and 0–200 cm soil layers, respectively; (B1–B4) represent corresponding soil N stock changes in 0–20, 20–100, 100–200, and 0–200 cm soil layers, respectively; error bars indicate the standard deviation of the slope k from Equation 6; the numbers above the bars denote the corresponding sample sizes.
3.2 Dynamic patterns of soil C and N stocks of different vegetation types
For the forest, the changes of soil C and N showed increasing trends in the first 5 years for all layers except for the soil C in the 0–20 cm layer (Figure 3). Subsequently, all the values showed consistent decreasing trends during the 6–10 years for all layers with similar values in each layer separately for C and N (Figure 3). Stable increases of soil C occurred in 0–20 cm, 20–100 cm and 100–200 cm after 11 years, reaching their highest rates during the 21–30 year (Figures 3A1–A3), while soil N exhibited consistent decreases during 6–30 year and tended to increase after 31 years (Figures 3B1–B3). In general, the deep soil C and N sequestration lagged behind that in the surface soil, but the rates in deeper soils were higher than surface (Figure 3). Across the entire profile, the rates of soil C change were 0.56, –12.95, 1.34, 3.53 and 1.74 Mg ha–1yr–1 during 0–5, 6–10, 11–20, 21–30 and > 31 years, respectively, and the corresponding values for soil N were 1.21, –0.37, –0.07, –0.16 and 0.05 Mg ha–1yr–1 (Figures 3A4,B4).
FIGURE 3

Changes in soil C and N stocks over time following forest restoration. (A1–A4) Represent soil C stock changes in the 0–20, 20–100, 100–200, and 0–200 cm soil layers, respectively; (B1–B4) represent corresponding soil N stock changes in the 0–20, 20–100, 100–200, and 0–200 cm soil layers, respectively; error bars indicate the standard deviation of the slope k from Equation 6; the numbers above the bars denote the corresponding sample sizes.
For the shrub, in the upper 20 cm soil layer, the rates of soil C stock change initially increased and subsequently decreased after 10 years (Figure 4A1). Similarly, soil N stocks exhibited a sharp increase during the first decade, followed by a decline (Figure 4B1). In the 20–100 and 100–200 cm soil layers, the rates of soil C stock change showed an increasing trend during the first 5 years, followed by a sharp decline, and eventually stabilized at relatively low levels starting from the 11th year (Figures 4A2,A3). In contrast, the rates of soil N stock change in these layers exhibited inverse temporal patterns (Figures 4B2,B3). Moreover, deep soil C and N stocks exhibited temporal patterns similar to those in the 100–200 cm layer, and their sequestration lagged behind that in the surface layers (Figure 4).
FIGURE 4

Changes in soil C and N stocks over time following shrub restoration. (A1–A4) Represent soil C stock changes in the 0–20, 20–100, 100–200, and 0–200 cm soil layers, respectively; (B1–B4) represent corresponding soil N stock changes in the 0–20, 20–100, 100–200, and 0–200 cm soil layers, respectively; error bars indicate the standard deviation of the slope k from Equation 6; the numbers above the bars denote the corresponding sample sizes.
For the grassland, soil C and N stocks tend to accumulate steadily in the 0–20 cm layer (Figures 5A1,B1), whereas their change rates in 20–100 and 100–200 cm soil layers exhibited more fluctuations (Figures 5A2,A3,B2,B3). For example, In the 20–100 cm layer, soil C stocks initially decreased during the first 1–5 years, subsequently increased between 6 and 10 years, then declined again from 11 to 30 years, and finally showed an increasing trend after the 31st year (Figure 5A2). Soil N stock in the 20–100 cm layer and soil C in the 100–200 cm layer showed an increasing trend before the 20th year, with the highest values occurring between 6 and 10 years, followed by a decline from 11 to 30 years, and a subsequent increase after the 31st year (Figures 5B2,A3). Soil N stock in the 100–200 cm layer alternated between increase and decrease across the period with gradually larger amplitudes (Figure 5B3). Consistently, both soil C and N stocks increased during the later period ( > 31 years) (Figure 5). Across the entire soil profile, changes in soil C and N generally exhibited coupled trends (Figures 5A4,B4).
FIGURE 5
Changes in soil C and N stocks over time following grassland restoration. (A1–A4) represent soil C stock changes in the 0–20, 20–100, 100–200, and 0–200 cm soil layers, respectively; (B1–B4) represent corresponding soil N stock changes in the 0–20, 20–100, 100–200, and 0–200 cm soil layers, respectively; error bars indicate the standard deviation of the slope k from Equation 6; the numbers above the bars denote the corresponding sample sizes.
In addition, Kruskal analysis showed significant effects of vegetation types (P < 0.001) and number of years since restoration (P < 0.001) on soil C and N changes in the 0–20, 20–100, 100–200, and 0–200 cm. The interaction between vegetation types and restoration years exhibited stronger influences on the soil C and N changes compared to single factor (Table 1).
TABLE 1
| Factor | 0–20 cm | 20–100 cm | ||||||
|---|---|---|---|---|---|---|---|---|
| C | N | C | N | |||||
| χ2 | p | χ2 | p | χ2 | p | χ2 | p | |
| Land use | 91.09 | 0.000*** | 52.61 | 0.000*** | 18.67 | 0.000*** | 16.88 | 0.000*** |
| Year | 100.04 | 0.000*** | 59.29 | 0.000*** | 25.9 | 0.000*** | 17.41 | 0.002** |
| Land use × Year | 184.26 | 0.000*** | 112.37 | 0.000*** | 72.05 | 0.000*** | 67.57 | 0.000*** |
| 100–200 cm | 0–200 cm | |||||||
| Land use | 23.44 | 0.000*** | 21.8 | 0.000*** | 26.16 | 0.000*** | 17.62 | 0.000*** |
| Year | 23.13 | 0.000*** | 22.96 | 0.000*** | 23.22 | 0.000*** | 17.41 | 0.002** |
| Land use × Year | 72.74 | 0.000*** | 71.14 | 0.000*** | 79.32 | 0.000*** | 62.51 | 0.000*** |
Kruskal-Wallis test results of the effects of vegetation types and year since revegetation, and their interactions on soil C and N stocks after revegetation.
χ2 denotes Chi-square; p denotes significance,
**marks the significance level with p ≦ 0.002,
***marks the significance level with p ≦ 0.001.
3.3 Dynamic patterns of soil C and N stocks under climatic gradients
The gradients of precipitation and temperature exerted critical impacts on the temporal patterns of soil C and N stocks, with significant turning points detected across all soil layers (Figures 6, 7). Along the precipitation gradient, soil C and N stocks exhibited similar trends, characterized by an initial decrease followed by an increase with different turning points (Figure 6). In the upper 20 cm layer, the turning points in soil C and N were almost identical, at about 514 mm (Figures 6A1,B1). In the 20–100 cm layer, the turning points for soil C and N were also similar but the turning points were much lower than those in surface layers (Figures 6A2,B2). Inconsistent turning points were observed in the 100–200 cm layer, where the turning point for soil C was 535 mm (Figure 6A3) and that for soil N was 451 mm (Figure 6B3), indicating that the sensitivity of soil N to precipitation was greater than that of soil C (k1 and k2). Overall, across the entire soil profile, the same turning point (453 mm) was identified for both C and N stocks, indicating a coupled trend along the precipitation gradient within the 200 cm soil depth (Figures 6A4,B4).
FIGURE 6

Changes in soil C and N stocks in response to mean annual precipitation. (A1–A4) represent soil C stock changes in the 0–20, 20–100, 100–200, and 0–200 cm soil layers, respectively; (B1–B4) represent corresponding soil N stock changes in the 0–20, 20–100, 100–200, and 0–200 cm soil layers, respectively; k1 and k2 denote the slopes before and after the turning point, respectively; T-point denotes turning point; R2 denotes the variance that can be explained by random Forest modes; N denotes the number of observations.
FIGURE 7

Changes in soil C and N stocks in response to mean annual temperature. (A1–A4) represent soil C stock changes in the 0–20, 20–100, 100–200, and 0–200 cm soil layers, respectively; (B1–B4) represent corresponding soil N stock changes in the 0–20, 20–100, 100–200, and 0–200 cm soil layers, respectively; k1 and k2 denote the slopes before and after the turning point, respectively; T-point denotes turning point; R2 denotes the variance that can be explained by random Forest modes; N denotes the number of observations.
Similar to precipitation gradients, significant turning points were also detected along the temperature gradients at all depths, with trends similar to those along the precipitation gradient (Figure 7). In terms of turning points, the responses of soil C and N stocks changes to temperature were largely consistent. For example, the turning point value for soil N was 8.4°C, and for soil C it was 8.9°C, while in the 20–100 cm layer, both were 8.4°C. This indicates that temperature has a weaker influence on the coupling between soil C and N dynamics in both shallow and deep soil layers compared to precipitation in the Loess Plateau.
4 Discussion
4.1 Temporal patterns of soil C and N stock changes after revegetation
Previous studies showed that mechanisms the controlled the soil C and N accumulation were different following revegetation, but similar temporal patterns for soil C and N changes from field studies have been reported (Morris et al., 2007; Deng et al., 2014; Deng et al., 2016), that is (1) decrease; (2) increase; (3) unchanged; (4) initial decrease and then increase gradually. The first decrease in soil C or N could even last for 3–35 years after revegetation (Paul et al., 2002). While a previous synthesis reported a net accumulation of soil C after about 30 years of restoration, the temporal pattern remained unclear due to the confounding effects of mixed soil depths in the analysis (Paul et al., 2002; Deng et al., 2014).
Nevertheless, these previously reported temporal patterns were mainly derived from shallow layers, whereas the patterns in deep soil layers are not well understood. Historically, the changes of soil C in deep layers have been regarded as functionally inert and the deep soil C was assumed to keep stable for millennium due to the organomineral associations and recalcitrant chemical structure (Torn et al., 1997), which probably led to the neglect of deep soil C and N dynamics. Importantly, our synthesis revealed that the temporal patterns of C and N stock changes were different for the shallow (0–20 cm) and deeper (20–100 cm and 100–200 cm) soil layers. Our results indicate that soil C stock received an overall significant and linear increase with average rates of 0.45 and 0.23 Mg ha–1yr–1 in the 20–100 and 100–200 cm, respectively (Supplementary Figures S4A2,A3) which was higher than the change rate (0.21 Mg ha–1yr–1) in the upper 20 cm soils (Supplementary Figure S4A1). In different periods, deep soil C stock showed an initial decrease and then a stable increase with ages (Figures 2A2,A3), in which the change rates were comparable with surface soils. Such observation can be supported by previous report that in semi-arid regions, converting cropland into perennial vegetation significantly increased the soil C stocks in 0–100 and 100–200 cm by 35.6 and 14.8%, respectively (Li et al., 2020). Our results also indicate significant accumulations for soil C and N stock after 21 and 31 years in the entire soil profile (Figures 2A4,B4), similar to the previous study (Paul et al., 2002). Overall, these findings may be critical to fully understand the potential impacts of environmental changes on soil C pools (Bernal et al., 2016).
Notably, this study revealed relatively large deep C loss in the early stages (< 10 years) under deep-rooted plants, e.g., forests or shrubs. The soil C loss after revegetation has been reported in several cases (Paul et al., 2002; Deng et al., 2014), mainly attributed to soil erosion or lack of fertilization. However, these studies may not interpret the C loss from the perspective of deep soils. Shahzad et al. confirmed that deep soil C would mineralize at higher rates than surface soils under the addition of new fresh C (Shahzad et al., 2019), also called priming effects, and suggested that higher mineralization rates of deep millennia-old soil organic matter in response to deeper root penetration could be induced by changes in human activities and climate (Shahzad et al., 2019). In the Loess Plateau, due to limited precipitation (usually < 600 mm) and thick loess (105.7 m) (Zhu et al., 2018), planted forests or shrubs can penetrate their roots into a great depth deeper than 1000 cm, and the total root biomass accumulated significantly with restoration ages (Supplementary Figure S5). Even the grassland can reach a maximum depth of 500 cm (Ma et al., 2012). Therefore, in the early stages of revegetation, the root penetration contributed to the deep soil C increase but also accelerated its mineralization through priming effects. Bernal et al. (2016) also suggested that deep soil C (∼300 cm) might be more vulnerable to environmental changes or human activities than previously thought, potentially influencing carbon dioxide exchange estimates between the land and the atmosphere. Actually, the slower C turnover rate in deep layers which was previously thought usually resulted from an impoverishment of energy-rich plant C for microorganisms, combined with a physical disconnection between soil C and microorganisms. Therefore, new C input may change the deep soil C greatly. In addition, another possible explanation for deep soil C loss is probably due to the lower productivity of new vegetation (Deng et al., 2014). For example, almost all the ecosystem C increase went into standing biomass rather than soil C during 30-year forest development in North Carolina (Compton and Boone, 2000). Laganiare et al. (2010) reported a similar result in which the soil C stock changed from an initial loss at initial stage ( < 10 years) and then a gain at middle and later periods. The third possible explanation for deep C loss is the liberation of organic compounds from protective associations with minerals induced by root exudate (Keiluweit et al., 2015). These three reasons may contribute greatly to the deep soil C loss in early stages. However, with the accumulation of plant root tissues and excretion in deep soil layers (Supplementary Figure S5), the C loss induced by priming effect, low productivity or liberation of organic compounds in early stages can be compensated and achieve a stable increase in the later periods (Figures 2A2–A3). Moreover, deep soils are always characterized as high soil C stock but low soil C content, resulting in an unsaturated state of mineral surfaces. The specific surface area may contribute to form organomineral compounds which represents one of the soil C stabilization mechanisms (Wiesmeier et al., 2019). To sum up, the accumulation of deep soil C stock should be taken into consideration due to its great potential in combating the global warming, and from the long view, and hopefully, deep soil C sequestration may contribute to the accomplishment of the “4 per 1,000 initiative.”
This study revealed linear increase in deep soil N stock with restoration ages, which indicates that a steady and sustainable N source may exist in deep soil layers (Supplementary Figure S5). Deep soil N generally exhibited a trend of accumulation under different vegetation types, which was supported by Deng and Shangguan (2016) and Li et al. (2012) (Figures 2, 4), despite the N loss during 21–30 years that possibly due to increased vegetation biomass over time. In addition, change of deep soil N fluctuated greatly in the earlier stages and tended to be stabilize in the middle and later periods (Figures 2, 4). Unlike the soil N changes in the surface layers, in which, the N deposition (Blume et al., 2016), organic material input (Li et al., 2012), fertilization in previous croplands (Li et al., 2012), biological N fixation (Hu et al., 2017) or improving soil and water conservation (Fu et al., 2009; Liu et al., 2012) may be the main reasons, the explanations for deep soil N stock dynamics have not been well understood. Li et al. (2012) also found that a stable N source existed in deep soil during forest development (generally within the 50 cm depth), and they attributed the deep soil N source to the combination of N deposition, fertilization and redistribution induced by forest development.
More comprehensively, we attribute deep soil N accumulation after revegetation to four possible reasons according to the latest studies: (1) Deep root penetration. The revegetation of the study area typically includes trees such as Black Locust, Goat’s Thorn, and Russian Olive. As noted, these roots can penetrate deeper than 1,000 cm and show consistent distribution (Supplementary Figure S5). Only 12% of root biomass is in the top 100 cm, while about 88% is below 100 cm. This suggests that soil nitrogen (N) accumulation is not limited to the upper 200 cm but also occurs significantly in deeper layers; (2) N leaching from surface soils. Revegetation increases inorganic and dissolved organic nitrogen (N) in surface soils globally, nationally, and locally (Liu et al., 2018; Tian et al., 2018). In the Loess Plateau, Fang et al. found that precipitation can infiltrate deeper than 500 cm under cropland, 260 cm under natural grassland, and 140–120 cm under planted grassland or shrub (e.g., Medicago sativa Linn and Caragana korshinskii) (Fang et al., 2016). Improved soil porosity from revegetation may further enhance infiltration and N leaching. Therefore, N leaching from the top 200 cm is likely a major contributor to deep soil N accumulation; (3) Priming effect. Tuo et al. found that C/N ratios in deep soil layers (100–200 and 200–300 cm) in the Loess Plateau are below 12, indicating that mineralization of old organic matter may release nitrogen (N) (Tuo et al., 2018). This may further reveal changes in the SOM types, as more labile C-rich SOM is lost, leaving recalcitrant complex N-rich compounds, which may explain the opposite trends in soil C and N stocks during early restoration stages (Figures 2–4). Deep soils also store large amounts of carbon (Jobbágy and Jackson, 2000; Wang et al., 2016; Li et al., 2020), which may further support N accumulation; (4) Biological nitrogen fixation. In arid regions, Hu et al. found that N2-fixing tree species increase total nitrogen (N) in roots and soil, helping to offset N deficiency (Hu et al., 2017). Many plants in the Loess Plateau are N-fixing species, and Jiao et al. found higher levels of N-fixing bacteria in deep soils. However, due to limited gas exchange, biological N fixation may be less significant than the first three mechanisms (Jiao et al., 2018). The N loss observed between 21 and 30 years likely reflects increased vegetation biomass over time, especially in arid and semi-arid regions, as shown by Chai et al. (2019) and Li et al. (2020). Like soil carbon (C), this N loss may reverse as root biomass increases and nutrient uptake by mature vegetation declines. Overall, deep soil N stocks increase after revegetation and their accumulation may serve as a key nitrogen reservoir for plant roots, potentially alleviating N limitation in surface soils.
4.2 Effects of climate gradients on deep soil C and N stock changes
Similar trends of soil C and N stock changes, in which there was a first decrease and then an increase, were found under precipitation and temperature gradients in different depths (Figures 6, 7). This indicates that the changes of deep soil C and N stock are sensitive to changes of climate (Koven et al., 2015; Tuo et al., 2018). Indeed, the soil C and N stocks after revegetation were found to vary with climatic factors (Guo and Gifford, 2002; Berthrong et al., 2009; Shi et al., 2013). For example, Deng and Shangguan (2016) showed that soil C and N after revegetation were determined by precipitation, temperature and restoration age, and they were higher in middle-level humidity index at national scale. Wei et al. (2009) reported that soil C and N increased linearly with precipitation and temperature during revegetation. But Laganiare et al. (2010) found that soil C stocks had no significant correlations with either precipitation or temperature which was similar with Deng 2014. These differences can be attributed to different spatial scales or depths (Deng et al., 2014). This study revealed turning points under climate gradients in different depths (Figures 6, 7), probably due to biotic processes associated with vegetation productivity and organic matter decomposition (Deng et al., 2016). Specifically, before the turning points, with the increase of precipitation and temperature, the mineralization of soil organic matter was higher than the input. But after the turning points, the vegetation productivity enhanced with relatively increasing precipitation and temperature, and thus the input of soil organic matter was higher than its mineralization (Chang et al., 2011).
Interestingly, the turning points in response to precipitation gradients for deep soil C and N stock differed greatly (535 mm and 451 for soil C and N, respectively) (Figures 6A3,B3), which indicates that the soil N stock is more sensitive than soil C stock under precipitation gradients. On the contrary, under temperature gradients, all the turning points were between 8.4 and 8.9 for soil C and N and showed similar patterns at different depths. We attribute these differences to the dynamics of soil moisture under climatic gradients. This may be because the Loess Plateau is a relatively small region with an almost uniform coverage of temperature (4–14°C). The explanations for the different turning points for soil C and N stock in 100–200 cm may be due to the different accumulation rates in response to precipitation. Overall, our results may offer important implications for the C and N cycling locally or globally. We emphasize that with the changes of climatic gradients, deep soil C-N coupling may be influenced greatly stronger than surface soils. However, at large spatial scales and eco-fragile regions, for example, the Polar region or the Triode, the climate change may induce much more influences than we may think previously especially the huge soil C or N stock was found below deep soils (Koven et al., 2015; Wu et al., 2016; Palmtag et al., 2018; Zhao et al., 2018).
4.3 Effects of revegetation on deep soil C and N coupling
Revegetation-related mechanisms of deep soil C and N dynamics, as well as their coupling, may be more complex. Specifically in planted forest (Supplementary Figures S4B1–B4) and shrub (Supplementary Figures S4C1–C4), the rate ratios of soil C and N stock changes in deep soils varied significantly, whereas the values in natural grassland showed little change (Supplementary Figures S4D1–D4). In addition, the coupling of C and N in revegetation may be different from that of natural vegetation succession, particularly for deep-rooted plants. The soil C/N ratios increased significantly in the 0–20, 20–100, 100–200, and 0–200 cm layers. Among vegetation types, C/N ratios increased significantly in forest soils, decreased slightly in shrub soil, and remained stable in grassland soils. On the contrary, natural vegetation succession typically presents stable C/N over time, possibly due to the balanced cycling of nutrients as plant and microbial communities reach equilibrium.
Considering the large C and N stocks in deep soils, it is extremely urgent to better understand long-term C-N relationships following revegetation. Indeed, the complex directions and paces of deep soil C and N stock may be driven by three reasons: (1) vegetation produces varying amounts and quality of organic matter at different restoration stages, and thus the composition and structure of microorganisms that consume these materials vary (Liu et al., 2025). As a result, different microbial metabolism processes for C or N may occur. (2) Vegetation root depth and biomass change with age (Yuan et al., 2025), affecting organic matter accumulation and inducing varying degrees of priming effects, which may alter soil C and N dynamics. (3) Soil moisture often declines significantly after revegetation, especially in deep layers (Wang et al., 2010; Wang et al., 2012; Su and Shangguan, 2019; Ma et al., 2025). Previous study evidenced that revegetation such as tree planting may destabilize deep soil ecosystems, suggesting plating trees might not be a straightforward solution for maintaining deep soil C-N balance (Holl and Brancalion, 2020). Particularly in arid and semi-arid regions, planting forests and shrubs can deplete deep soil moisture, form dry soil layers and cause tree mortality (Wang et al., 2012; Jia et al., 2017). Such change in soil moisture certainly exert profound impacts on the microbial metabolism. Microbial activity drives the decomposition of organic matter and mineralization of nitrogen, affecting C and N stocks. Microorganisms, such as bacteria and fungi, break down plant residues and organic compounds, releasing nutrients. Root exudates from revegetation can enhance microbial growth, influencing soil C and N dynamics by promoting mineralization and microbial immobilization (Chai et al., 2019). In addition, revegetation success also depends on the diversity of the vegetation. Monoculture plantings have been found to store less C than diverse plantings. Moreover, in deep soil layers following revegetation, the stabilization of SOM also depends on the formation of organo-metallic complexes and mineralization with clays. The formation of organo-metallic complexes, particularly with iron (Fe) and aluminum (Al) oxides, provides a powerful long-term stabilization mechanism by creating covalent bonds that are highly resistant to microbial attack. The success of revegetation in sequestering carbon at depth is therefore intrinsically linked to the subsoil’s mineralogy and its capacity to form these stable organo-mineral associations (Kleber et al., 2015).
4.4 Limitations
This study also has some limitations. Firstly, the current study only considered the response of soil C and N to mean annual precipitation and mean annual temperature. Future study could explore more responses of altitude or other climatic factors. Secondly, methodological heterogeneity across studies may introduce uncertainties. Thirdly, our current study did not account for management practices, which may be considered in further studies. Fourthly, although our current study did not contain data of very recent publications, the lack of 4–5 years of data does not substantially impact on the findings because the sample size and coverage were relatively large. Lastly, more advanced data processing methods such as the principal component analysis or independent component analysis could be applied to reveal finer dynamics of soil C and N.
5 Conclusion
Revegetation has been proposed as an effective method of C sequestration in order to slow down the global warming. However, how deep soils function during revegetation has received less attention. Our results emphasize that the deep soils may have great potential in C sequestration in the long-term. Since the overall C/N ratio increased linearly with age, the progressive N limitation may occur in the long term. But deep soils exhibit a lower risk of N limitation due to the lower change rate compared with surfaces soils, which further support our emphasis. Specifically, deep soil C loss in the earlier stages and the impacts of climatic gradients should be taken into consideration when evaluating the deep soil C. In addition, following the revegetation, deep soil N stock tended to increase linearly with age, and the accumulation of deep soil N may function as a fungible resource for plant root and contribute to alleviating the N limitation. However, dramatical fluctuations of the rate ratios for soil C and N stock change indicate that the C-N coupling may be disturbed by revegetation particularly the deep-rooted plants. Therefore, more attention should be paid to the deep soil C-N coupling in terms of ecosystem stability during revegetation in the long term. Overall, our results demonstrate that imbalanced changes of soil C and N particularly in the deep layers are induced by revegetation, and the different patterns of soil C and N stocks should be incorporated into soil C and N modeling and estimation.
Statements
Data availability statement
The original contributions presented in the study are included in the article/Supplementary material, further inquiries can be directed to the corresponding authors.
Author contributions
FW: Writing – original draft, Conceptualization, Methodology, Investigation, Funding acquisition, Writing – review & editing, Formal analysis. XB: Visualization, Methodology, Writing – review & editing. JC: Writing – review & editing, Validation, Visualization. ZL: Funding acquisition, Writing – review & editing, Writing – original draft, Supervision, Conceptualization.
Funding
The author(s) declared that financial support was received for this work and/or its publication. This research was funded in part by National Key Research and Development Program of China, grant number 2022YFF1300403, and in part by National Natural Science Foundation of China, grant number 42501140.
Conflict of interest
The author(s) declared that this work was conducted in the absence of any commercial or financial relationships that could be construed as a potential conflict of interest.
The reviewer BL declared a past co-authorship with the authors XB, JC, and ZL to the handling editor.
Generative AI statement
The author(s) declared that generative AI was not used in the creation of this manuscript.
Any alternative text (alt text) provided alongside figures in this article has been generated by Frontiers with the support of artificial intelligence and reasonable efforts have been made to ensure accuracy, including review by the authors wherever possible. If you identify any issues, please contact us.
Correction note
A correction has been made to this article. Details can be found at: 10.3389/ffgc.2026.1804395.
Publisher’s note
All claims expressed in this article are solely those of the authors and do not necessarily represent those of their affiliated organizations, or those of the publisher, the editors and the reviewers. Any product that may be evaluated in this article, or claim that may be made by its manufacturer, is not guaranteed or endorsed by the publisher.
Supplementary material
The Supplementary Material for this article can be found online at: https://www.frontiersin.org/articles/10.3389/ffgc.2026.1754187/full#supplementary-material
References
1
Bernal B. McKinley D. C. Hungate B. A. White P. M. Mozdzer T. J. Megonigal J. P. (2016). Limits to soil carbon stability; Deep, ancient soil carbon decomposition stimulated by new labile organic inputs.Soil Biol. Biochem.9885–94. 10.1016/j.soilbio.2016.04.007
2
Berthrong S. T. Jobbagy E. G. Jackson R. B. (2009). A global meta-analysis of soil exchangeable cations, pH, carbon, and nitrogen with afforestation.Ecol. Appl.192228–2241. 10.1890/08-1730.1
3
Blume H.-P. Brümmer G. W. Fleige H. Horn R. Kandeler E. Kögel-Knabner I. et al (2016). “Soil organic matter,” in Scheffer/Schachtschabel Soil Science.Berlin: Springer. 10.1007/978-3-642-30942-7_3
4
Breiman L. (2001). Random forests.Mach. Learn.455–32. 10.1023/A:1010933404324
5
Breiman L. Cutler A. Liaw A. Wiener M. (2024). Randomforest: Breiman and Cutlers Random Forests for Classification and Regression.Available online at: https://cran.r-project.org/web/packages/randomForest/index.html (accessed September 12, 2025).
6
Chai Q. Ma Z. An Q. Wu G. L. Chang X. Zheng J. et al (2019). Does Caragana korshinskii plantation increase soil carbon continuously in a water-limited landscape on the Loess Plateau, China?Land Degrad. Dev.301691–1698. 10.1002/ldr.3373
7
Chang R. Fu B. Liu G. Liu S. (2011). Soil carbon sequestration potential for “Grain for Green” project in Loess Plateau, China.Environ. Manage481158–1172. 10.1007/s00267-011-9682-8
8
Chen L.-F. He Z.-B. Zhu X. Du J. Yang J.-J. Li J. (2016). Impacts of afforestation on plant diversity, soil properties, and soil organic carbon storage in a semi-arid grassland of northwestern China.CATENA147300–307. 10.1016/j.catena.2016.07.009
9
Compton J. E. Boone R. D. (2000). Long-Term impacts of agriculture on soil carbon and nitrogen in new England Forests.Ecology812314–2330. 10.1890/0012-96582000081[2314:Ltioao]2.0.Co;2
10
Cui Y. Wang X. Zhang X. Ju W. Duan C. Guo X. et al (2020). Soil moisture mediates microbial Carbon and Phosphorus metabolism during vegetation succession in a semiarid region.Soil Biol. Biochem.147:107814. 10.1016/j.soilbio.2020.107814
11
Davidson E. Lefebvre P. A. Brando P. M. Ray D. M. Trumbore S. E. Solorzano L. A. et al (2011). Carbon inputs and water uptake in deep soils of an Eastern Amazon Forest.For. Sci.5751–58. 10.1093/forestscience/57.1.51
12
Davies R. B. (1987). Hypothesis testing when a nuisance parameter is present only under the alternatives.Biometrika7433–43. 10.2307/2336019
13
de Mendiburu F. (2023). Agricolae: Statistical Procedures for Agricultural Research.Available online at: https://cran.r-project.org/web/packages/agricolae/index.html (accessed September 12, 2025).
14
Deng L. Shangguan Z. P. (2016). Afforestation drives soil carbon and Nitrogen changes in China.Land Degrad. Dev.28151–165. 10.1002/ldr.2537
15
Deng L. Liu G. B. Shangguan Z. P. (2014). Land-use conversion and changing soil carbon stocks in China’s ‘Grain-for-Green’ Program: A synthesis.Global Change Biol.203544–3556. 10.1111/gcb.12508
16
Deng L. Zhu G. Y. Tang Z. S. Shangguan Z. P. (2016). Global patterns of the effects of land-use changes on soil carbon stocks.Global Ecol. Conserv.5127–138. 10.1016/j.gecco.2015.12.004
17
Fang X. Zhao W. Wang L. Feng Q. Ding J. Liu Y. et al (2016). Variations of deep soil moisture under different vegetation types and influencing factors in a watershed of the Loess Plateau. China.Hydrol. Earth Syst. Sci.203309–3323. 10.5194/hess-20-3309-2016
18
Fontaine S. Barot S. Barré P. Bdioui N. Mary B. Rumpel C. (2007). Stability of organic carbon in deep soil layers controlled by fresh carbon supply.Nature450277–280. 10.1038/nature06275
19
Fu B.-J. Wang Y.-F. Lu Y.-H. He C.-S. Chen L.-D. Song C.-J. (2009). The effects of land-use combinations on soil erosion: A case study in the Loess Plateau of China.Prog. Phys. Geography-Earth Environ.33793–804. 10.1177/0309133309350264
20
Gao X. Meng T. Zhao X. (2017). Variations of soil organic carbon following land use change on deep-loess hillsopes in China.Land Degrad. Dev.281902–1912. 10.1002/ldr.2693
21
GetData Graph Digitizer. (2013). GetData Graph Digitizer: Digitizing Software, Digitize Scanned Graphs and Get Original (x,y) Data. Available online at: https://getdata-graph-digitizer.com/download.html (accessed September 12, 2025).
22
Guenet B. Danger M. Abbadie L. Lacroix G. (2010). Priming effect: Bridging the gap between terrestrial and aquatic ecology.Ecology912850–2861. 10.1890/09-1968
23
Guo L. B. Gifford R. M. (2002). Soil carbon stocks and land use change: A meta analysis.Global Change Biol.8345–360. 10.1046/j.1354-1013.2002.00486.x
24
Holl K. D. Brancalion P. H. S. (2020). Tree planting is not a simple solution.Science368580–581. 10.1126/science.aba8232
25
Hu B. Zhou M. H. Dannenmann M. Saiz G. Simon J. Bilela S. et al (2017). Comparison of nitrogen nutrition and soil carbon status of afforested stands established in degraded soil of the Loess Plateau. China.For. Ecol. Manag.38946–58. 10.1016/j.foreco.2016.12.011
26
James J. Knight E. Gamba V. Harrison R. (2015). Deep soil: Quantification, modeling, and significance of subsurface nitrogen.For. Ecol. Manag.336194–202. 10.1016/j.foreco.2014.10.010
27
Jia X. X. Shao M. A. Zhu Y. J. Luo Y. (2017). Soil moisture decline due to afforestation across the Loess Plateau. China.J. Hydrol.546113–122. 10.1016/j.jhydrol.2017.01.011
28
Jiao S. Chen W. Wang J. Du N. Li Q. Wei G. (2018). Soil microbiomes with distinct assemblies through vertical soil profiles drive the cycling of multiple nutrients in reforested ecosystems.Microbiome6:146. 10.1186/s40168-018-0526-0
29
Jobbágy E. G. Jackson R. B. (2000). The vertical distribution of soil organic carbon and its relation to climate and vegetation. Ecol. Appl.10, 423–436. 10.1890/1051-0761(2000)010[0423:TVDOSO]2.0.CO;2
30
Keiluweit M. Bougoure J. J. Nico P. S. Pett-Ridge J. Weber P. K. Kleber M. (2015). Mineral protection of soil carbon counteracted by root exudates.Nat. Climate Change5588–595. 10.1038/nclimate2580
31
Kleber M. Eusterhues K. Keiluweit M. Mikutta C. Mikutta R. Nico P. S. (2015). “Chapter one - Mineral–Organic associations: Formation, properties, and relevance in soil environments,” in Advances in Agronomy, ed.SparksD. L. (Cambridge, MA: Academic Press), 1–140.
32
Knops J. M. H. Bradley K. L. Wedin D. A. (2002). Mechanisms of plant species impacts on ecosystem nitrogen cycling.Ecol. Lett.5454–466. 10.1046/j.1461-0248.2002.00332.x
33
Köchy M. Hiederer R. Freibauer A. (2015). Global distribution of soil organic carbon – Part 1: Masses and frequency distributions of SOC stocks for the tropics, permafrost regions, wetlands, and the world.Soil1351–365. 10.5194/soil-1-351-2015
34
Koven C. D. Lawrence D. M. Riley W. J. (2015). Permafrost carbon-climate feedback is sensitive to deep soil carbon decomposability but not deep soil nitrogen dynamics.Proc. Natl. Acad. Sci. U. S. A.1123752–3757. 10.1073/pnas.1415123112
35
Laganiare J. Angers D. A. Para D. (2010). Carbon accumulation in agricultural soils after afforestation: A meta-analysis.Global Change Biol.16439–453. 10.1111/j.1365-2486.2009.01930.x
36
Lan Z. Zhao Y. Zhang J. Jiao R. Khan M. N. Sial T. A. et al (2021). Long-term vegetation restoration increases deep soil carbon storage in the Northern Loess Plateau.Sci. Rep.11:13758. 10.1038/s41598-021-93157-0
37
Laungani R. Knops J. M. H. (2009). Species-driven changes in nitrogen cycling can provide a mechanism for plant invasions.Proc. Natl. Acad. Sci. U. S. A.10612400–12405. 10.1073/pnas.0900921106
38
Li B. B. Li P. P. Yang X. M. Xiao H. B. Xu M. X. Liu G. B. (2020). Land-use conversion changes deep soil organic carbon stock in the Chinese Loess Plateau.Land Degrad. Dev.32505–517. 10.1002/ldr.3644
39
Li D. Niu S. Luo Y. (2012). Global patterns of the dynamics of soil carbon and nitrogen stocks following afforestation: A meta-analysis.New Phytol.195172–181. 10.1111/j.1469-8137.2012.04150.x
40
Liu X. Wei T. Fan D. Bi H. Zhu Q. (2025). Response of typical artificial forest soil microbial community to revegetation in the Loess Plateau, China.Agronomy15:1821. 10.3390/agronomy15081821
41
Liu X. Yang T. Wang Q. Huang F. Li L. (2018). Dynamics of soil carbon and nitrogen stocks after afforestation in arid and semi-arid regions: A meta-analysis.Sci. Total Environ.6181658–1664. 10.1016/j.scitotenv.2017.10.009
42
Liu Y. Tao Y. Wan K. Y. Zhang G. S. Liu D. B. Xiong G. Y. et al (2012). Runoff and nutrient losses in citrus orchards on sloping land subjected to different surface mulching practices in the Danjiangkou Reservoir area of China.Agricultural Water Manag.11034–40. 10.1016/j.agwat.2012.03.011
43
Luo Y. Q. Field C. B. Jackson R. B. (2006). Does nitrogen constrain carbon cycling, or does carbon input stimulate nitrogen cycling?Ecology873–4. 10.1890/05-0923
44
Luo Y. Su B. Currie W. S. Dukes J. S. Finzi A. C. Hartwig U. et al (2004). Progressive nitrogen limitation of ecosystem responses to rising atmospheric Carbon Dioxide.Bioscience54731–739. 10.1641/0006-35682004054[0731:Pnloer]2.0.Co;2
45
Ma L. H. Wu P. T. Wang Y. K. (2012). Spatial distribution of roots in a dense jujube plantation in the semiarid hilly region of the Chinese Loess Plateau.Plant Soil35457–68. 10.1007/s11104-011-1041-2
46
Ma Y. Qi K. Feng N. Guo J. Qiao J. Shi C. (2025). Coupling interaction between soil water and soil organic carbon contents after vegetation restoration in the Loess Plateau Region of China.CLEAN – Soil Air Water53:e70049. 10.1002/clen.70049
47
Morris S. J. Bohm S. Haile-Mariam S. Paul E. A. (2007). Evaluation of carbon accrual in afforested agricultural soils.Global Change Biol.131145–1156. 10.1111/j.1365-2486.2007.01359.x
48
Muggeo V. M. R. (2025). Segmented: Regression Models with Break-Points / Change-Points Estimation.Available online at: https://cran.r-project.org/web/packages/segmented/ (accessed September 12, 2025).
49
O’Connell A. M. Grove T. S. Mendham D. S. Rance S. J. (2003). Changes in soil N status and N supply rates in agricultural land afforested with eucalypts in south-western Australia.Soil Biol. Biochem.351527–1536. 10.1016/s0038-0717(03)00242-6
50
Palmtag J. Cable S. Christiansen H. H. Hugelius G. Kuhry P. (2018). Landform partitioning and estimates of deep storage of soil organic matter in Zackenberg. Greenland.Cryosphere121735–1744. 10.5194/tc-12-1735-2018
51
Paul K. I. Polglase P. J. Nyakuengama J. G. Khanna P. K. (2002). Change in soil carbon following afforestation.For. Ecol. Manag.168241–257. 10.1016/s0378-1127(01)00740-x
52
Rumpel C. Kögel-Knabner I. (2011). Deep soil organic matter—a key but poorly understood component of terrestrial C cycle.Plant Soil338143–158. 10.1007/s11104-010-0391-5
53
Schmidt M. W. I. Torn M. S. Abiven S. Dittmar T. Guggenberger G. Janssens I. A. et al (2011). Persistence of soil organic matter as an ecosystem property.Nature47849–56. 10.1038/nature10386
54
Shahzad T. Anwar F. Hussain S. Mahmood F. Arif M. S. Sahar A. et al (2019). Carbon dynamics in surface and deep soil in response to increasing litter addition rates in an agro-ecosystem.Geoderma3331–9. 10.1016/j.geoderma.2018.07.018
55
Shahzad T. Rashid M. I. Maire V. Barot S. Perveen N. Alvarez G. et al (2018). Root penetration in deep soil layers stimulates mineralization of millennia-old organic carbon.Soil Biol. Biochem.124150–160. 10.1016/j.soilbio.2018.06.010
56
Shi S. Zhang W. Zhang P. Yu Y. Ding F. (2013). A synthesis of change in deep soil organic carbon stores with afforestation of agricultural soils.For. Ecol. Manag.29653–63. 10.1016/j.foreco.2013.01.026
57
Su B. Q. Shangguan Z. P. (2019). Decline in soil moisture due to vegetation restoration on the Loess Plateau of China.Land Degrad. Dev.30290–299. 10.1002/ldr.3223
58
Tian D. Xiang Y. Wang B. Li M. Liu Y. Wang J. et al (2018). Cropland abandonment enhances soil inorganic nitrogen retention and carbon stock in China: A meta-analysis.Land Degrad. Dev.293898–3906. 10.1002/ldr.3137
59
Torn M. S. Trumbore S. E. Chadwick O. A. Vitousek P. M. Hendricks D. M. (1997). Mineral control of soil organic carbon storage and turnover.Nature389170–173. 10.1038/38260
60
Tuo D. F. Gao G. Y. Chang R. Y. Li Z. S. Ma Y. Wang S. et al (2018). Effects of revegetation and precipitation gradient on soil carbon and nitrogen variations in deep profiles on the Loess Plateau of China.Sci. Total Environ.626399–411. 10.1016/j.scitotenv.2018.01.116
61
Vaughn L. J. S. Torn M. S. (2019). 14C evidence that millennial and fast-cycling soil carbon are equally sensitive to warming.Nat. Climate Change9467–471. 10.1038/s41558-019-0468-y
62
Wang R. Li S. Ruan Y. Shi R. Hao H. Liang Y. et al (2025). Residue carbon and C-degradation gene indicated the increase of soil organic carbon following vegetation restoration on the Loess Plateau. China.J. Environ. Manag.394:127323. 10.1016/j.jenvman.2025.127323
63
Wang X. He H. Zhang M. Deng J. Ren X. Lv Y. et al (2025). Grain for Green Project dominates greening in afforested areas rather than that in grass revegetation areas of the Loess Plateau, China–using Deep Crossing LSTM Age network.Environ. Res. Lett.20:084068. 10.1088/1748-9326/adec02
64
Wang Y. Han X. Jin Z. Zhang C. Fang L. (2016). Soil organic carbon stocks in deep soils at a watershed scale on the chinese loess plateau. Soil Sci. Soc. Am. J.80, 157–167. 10.2136/sssaj2015.06.0220
65
Wang Y. Q. Shao M. A. Liu Z. P. (2010). Large-scale spatial variability of dried soil layers and related factors across the entire Loess Plateau of China.Geoderma15999–108. 10.1016/j.geoderma.2010.07.001
66
Wang Y. Q. Shao M. A. Liu Z. P. Zhang C. C. (2012). Changes of deep soil desiccation with plant growth age in the Chinese Loess Plateau.Hydrol. Earth Syst. Sci. Discuss.201212029–12060. 10.5194/hessd-9-12029-2012
67
Wei X. Shao M. Fu X. Horton R. Li Y. Zhang X. (2009). Distribution of soil organic C, N and P in three adjacent land use patterns in the northern Loess Plateau, China.Biogeochemistry96149–162. 10.1007/s10533-009-9350-8
68
Wiesmeier M. Urbanski L. Hobley E. Lang B. von Lutzow M. Marin-Spiotta E. et al (2019). Soil organic carbon storage as a key function of soils - A review of drivers and indicators at various scales.Geoderma333149–162. 10.1016/j.geoderma.2018.07.026
69
Wu H. Guo Z. Peng C. (2003). Land use induced changes of organic carbon storage in soils of China.Global Change Biol.9305–315. 10.1046/j.1365-2486.2003.00590.x
70
Wu X. D. Zhao L. Fang H. B. Zhao Y. G. Smoak J. M. Pang Q. Q. et al (2016). Environmental controls on soil organic carbon and nitrogen stocks in the high-altitude arid western Qinghai-Tibetan Plateau permafrost region.J. Geophys. Research-Biogeosci.121176–187. 10.1002/2015jg003138
71
Yu X. Zhou W. Wang Y. Cheng P. Hou Y. Xiong X. et al (2020). Effects of land use and cultivation time on soil organic and inorganic carbon storage in deep soils.J. Geograph. Sci.30921–934. 10.1007/s11442-020-1762-3
72
Yuan Z.-Q. Wang B. Wang R. Sun R.-N. (2025). Decoupling alfalfa biomass and soil function: The dominant role of nutrient stoichiometry in degraded land restoration.Land Degrad. Dev.10.1002/ldr.70224[Epub ahead of print].
73
Zhao L. Wu X. Wang Z. Sheng Y. Fang H. Zhao Y. et al (2018). Soil organic carbon and total nitrogen pools in permafrost zones of the Qinghai-Tibetan Plateau.Sci. Rep.8:3656. 10.1038/s41598-018-22024-2
74
Zhou Z. Ren C. Wang C. Delgado-Baquerizo M. Luo Y. Luo Z. et al (2024). Global turnover of soil mineral-associated and particulate organic carbon.Nat. Commun.15:5329. 10.1038/s41467-024-49743-7
75
Zhu Y. Jia X. Shao M. (2018). Loess thickness variations across the Loess Plateau of China.Surveys Geophys.39715–727. 10.1007/s10712-018-9462-6
Summary
Keywords
Loess Plateau, revegetation, soil carbon, soil C-N coupling, soil nitrogen
Citation
Wang F, Bu X, Chen J and Li Z (2026) Revegetation induces asynchronous changes of deep soil carbon and nitrogen stocks in the Loess Plateau of China. Front. For. Glob. Change 9:1754187. doi: 10.3389/ffgc.2026.1754187
Received
25 November 2025
Revised
01 January 2026
Accepted
15 January 2026
Published
04 February 2026
Corrected
19 February 2026
Volume
9 - 2026
Edited by
Ling Zhang, Jiangxi Agricultural University, China
Reviewed by
Bo Tang, Free University of Berlin, Germany
Binbin Li, Northwest A&F University, China
Updates
Copyright
© 2026 Wang, Bu, Chen and Li.
This is an open-access article distributed under the terms of the Creative Commons Attribution License (CC BY). The use, distribution or reproduction in other forums is permitted, provided the original author(s) and the copyright owner(s) are credited and that the original publication in this journal is cited, in accordance with accepted academic practice. No use, distribution or reproduction is permitted which does not comply with these terms.
*Correspondence: Fengjiao Wang, wangfj@lzufe.edu.cnZongshan Li, zsli_st@rcees.ac.cn
Disclaimer
All claims expressed in this article are solely those of the authors and do not necessarily represent those of their affiliated organizations, or those of the publisher, the editors and the reviewers. Any product that may be evaluated in this article or claim that may be made by its manufacturer is not guaranteed or endorsed by the publisher.