Abstract
Forests at the altitudinal limits between seasonally dry tropical forests (SDTF) and montane forests in northeastern Peru are key for biodiversity and ecological connectivity. Sixteen 0.1-ha plots were surveyed along a 1900–2700 m a.s.l. gradient, recording 133 species, 76 genera, and 47 families, reflecting high floristic heterogeneity. Diversity indices showed a unimodal pattern, peaking in the transition zone between 2300 and 2500 m (Hill_q1 = 22.36; Hill_q2 = 15.92; estimated richness = 49 species). Diversity decreased at lower SDTF elevations (1900–2100 m) and higher montane sites (>2500 m), likely due to thermal and water limitations. Species dominance shifted along the gradient: Vachellia aroma and Inga adenophylla dominated SDTF, whereas Aiouea montana, Clethra revoluta, and Ilex scopulorum characterized montane forests. Beta diversity revealed pronounced species replacement and highlighted plot S08 as an ecotone with species from both ecosystems. Diameter-class distributions followed an inverted “J” pattern, indicating active regeneration in both ecosystems, with higher recruitment in SDTF. Altitude drives species replacement and shapes a unimodal diversity pattern. We recommend restoring dominant SDTF species, such as Vachellia aroma and Inga adenophylla, in degraded lower-elevation areas, and conserving ecotonal belts as altitudinal corridors to enhance biodiversity and climate resilience areas, and conserving ecotonal belts as 32 altitudinal corridors to enhance biodiversity and climate resilience.
1 Introduction
Tropical forests play a central role in global climate regulation, carbon cycling, and the maintenance of terrestrial biodiversity, while exhibiting high structural and functional complexity across broad environmental gradients (Pan et al., 2011; Malhi et al., 2010; Malhi et al., 2014). Their distribution and functioning are shaped by the interaction between climate, topography, and edaphic conditions, resulting in pronounced spatial heterogeneity in floristic composition, productivity, and ecological processes (Girardin et al., 2014). In this context, climatic and altitudinal gradients within the tropics provide an ideal framework for evaluating forest ecosystem responses to variations in temperature and water availability, factors of particular relevance under scenarios of global climate change (Malhi et al., 2010).
Within this broad array of ecosystems, tropical seasonally dry forests (TSDF) represent one of the most distinctive, vulnerable, and yet least studied forest biomes in the Neotropics (Pennington et al., 2009; Dirzo et al., 2011; Dryflor et al., 2016). These forests are characterized by pronounced climatic seasonality, with extended dry periods that impose strong physiological constraints and favor the dominance of species and functional strategies adapted to water stress, such as deciduousness, high wood density, and high water-use efficiency (Sánchez-Azofeifa et al., 2014; Poorter et al., 2016). Despite these limiting environmental conditions, TSDF harbor high levels of floristic diversity, endemism, and ecological uniqueness, often concentrated within relatively small geographic areas, which has led to their recognition as global priorities for conservation and scientific research (Pennington et al., 2009; Dryflor et al., 2016).
From a structural and functional perspective, TSDF are commonly dominated by families such as Fabaceae (Leguminosae) and Bignoniaceae, whose species exhibit key adaptations related to biological nitrogen fixation, drought tolerance, and the efficient exploitation of soils with high nutrient variability (Guzman et al., 2021). However, despite their ecological importance, these forests have been identified as among the most threatened tropical ecosystems worldwide, with less than 10% of their original extent remaining in many countries. This dramatic reduction is primarily driven by conversion to agricultural and livestock activities, habitat fragmentation, and their limited representation within formal protected area networks (Miles et al., 2006; Hoekstra et al., 2005; Dryflor et al., 2016).
In Peru, inter-Andean tropical seasonally dry forests comprise three major floristic groups—coastal, inter-Andean, and eastern forests, reflecting pronounced environmental and biogeographic heterogeneity (Linares-Palomino et al., 2011; Linares-Palomino et al., 2022). These ecosystems span a wide altitudinal range that, in some regions of northern Peru, exceeds 2,000 m a.s.l., particularly in inter-Andean valleys associated with the Marañón River basin (Linares-Palomino et al., 2011; Marrufo Huamán, 2023). In this region, TSDF exhibit exceptionally high levels of endemism, estimated at approximately 33% of woody plant species, along with pronounced floristic turnover (Marcelo-Peña et al., 2016; Marcelo-Peña et al., 2025). These patterns have been attributed to the complex Andean topography and historical processes of climatic isolation that have promoted the evolutionary differentiation of plant communities (Särkinen et al., 2012; Marcelo-Peña et al., 2025).
Nevertheless, despite their well-recognized biological importance, scientific research on TSDF in Peru remains limited, particularly with regard to systematic ecological studies and analyses across altitudinal gradients. This constraint hampers a comprehensive understanding of their dynamics and limits the development of effective conservation strategies (Delgado-Paredes et al., 2020; Marcelo-Peña et al., 2025). This knowledge gap is reflected in the scarcity of long-term monitoring plots in dry forests, in contrast to the relatively large number of studies and permanent plots established in montane forests. In the department of Amazonas, for example, several floristic assessments based on monitoring plots have been conducted in montane forests (Añazco Urbina et al., 2021; Culqui et al., 2024; Sánchez Zamora et al., 2024), whereas only a single study has specifically focused on the establishment of vegetation monitoring plots in dry forests (Tarrillo Cieza, 2024).
In this context, the establishment of evaluation plots in TSDF of northern Peru represents a strategically important initiative to improve ecological knowledge of these highly vulnerable ecosystems. Given the high biodiversity of the Amazonas department and the urgent need to generate baseline information to support conservation efforts, the installation of 16 study plots was undertaken at the altitudinal boundaries between TSDF and montane forest ecosystems in the district of Sonche, Chachapoyas Province. This effort aims to contribute to the characterization of vegetation structure and composition in the dry forests of northeastern Peru.
2 Materials and methods
2.1 Study area
This study was conducted along the altitudinal boundaries between tropical seasonally dry forest (TSDF) and montane forest ecosystems in the district of Sonche, Chachapoyas Province, northeastern Peru. At the provincial scale, montane forests cover approximately 66.76% of the territory (1,852.78 km2), whereas dry forest ecosystems account for 33.11% (918.96 km2). According to the Peruvian life zone map, these dry forests are classified as tropical premontane dry forest, tropical lower montane dry forest, and tropical premontane desert shrubland [Instituto Nacional de Recursos Naturales (INRENA), 1995]. In addition, they correspond to the inter-Andean seasonally dry forests of the Marañón Valley as defined in the national ecosystem map [Ministerio del Ambiente (MINAM), 2019].
Both seasonally dry tropical forests (SDTF) and montane forests in the Amazonas Department provide essential ecosystem services. In particular, SDTF serve as refuges for a high diversity of fauna (Guzman et al., 2021; Coronel-Castro et al., 2024), contribute to soil stability by reducing erosion and landslide risk, and supply important forest resources such as timber, fuelwood, fruits, and medicinal plants. Moreover, these ecosystems play a key role in hydrological regulation by storing and gradually releasing water into streams and rivers. Nevertheless, these ecosystems face increasing anthropogenic pressures associated with agricultural expansion, illegal logging, forest fires, climate variability, and institutional limitations for sustainable management. These pressures have driven ongoing processes of degradation and fragmentation (Figueroa et al., 2016; Coronel-Castro et al., 2024), such that currently slightly more than 10% of the area over which this ecosystem is distributed in the province (108.7 km2) is degraded [Ministerio del Ambiente (MINAM), 2021].
At the local scale, the district of Sonche covers an area of approximately 120 km2 and spans an altitudinal range from 1,554 to 2,845 m a.s.l. [Ministerio del Ambiente (MINAM), 2019]. Two main ecosystem types are recognized within the study area. Tropical seasonally dry forests dominate the landscape, covering nearly 89% of the territory, primarily as tropical premontane dry forest (bs-PT) and tropical lower montane dry forest (bs-MBT). In contrast, montane forests account for the remaining 11% and correspond to tropical lower montane humid forest (bh-MBT) [Instituto Nacional de Recursos Naturales (INRENA), 1995].
Climatic and topographic conditions vary markedly along the altitudinal gradient and strongly influence vegetation structure and composition. In lower and mid-elevation areas, where TSDF predominate, conditions are warmer and drier, and the terrain is rugged, characterized by steep slopes, deep valleys, and well-defined ravines (Rodríguez Achung et al., 2010; Mapcarta, 2025). Vegetation in these areas is mainly composed of deciduous, spiny, and open-canopy tree species adapted to environmentally restrictive conditions (Tarrillo Cieza, 2024). In contrast, higher elevations corresponding to humid montane forests experience lower temperatures and greater moisture availability [Instituto Nacional de Recursos Naturales (INRENA), 1995], which favor denser and more structurally complex vegetation with closed canopies and a high abundance of epiphytes, mosses, and ferns (Sánchez Zamora et al., 2024).
2.2 Establishment of sampling units and tree species inventory
For the establishment of the sampling units, a digital elevation model (DEM) with a spatial resolution of 30 m was used (Farr et al., 2007). The study area was stratified into four altitudinal classes at 200 m intervals (1900–2,100, 2,100–2,300, 2,300–2,500, and 2,500–2,700 m a.s.l.) (Figure 1) within a Geographic Information Systems (GIS) environment using ArcGIS software version 10.8 (Bricca et al., 2025). The first two strata corresponded to seasonally dry tropical forests, whereas the two upper strata were associated with montane forests. This stratification allowed the sampling design to be structured along the altitudinal gradient and ensured adequate representation of the environmental and ecological conditions of the study area (Khadanga et al., 2023).
Figure 1

Geographic, ecosystem, and altitudinal location map of the study area and sampling unit installation.
Within each altitudinal stratum, potential plot locations were identified through a spatial selection process in GIS and subsequently refined in the field using a targeted sampling approach. This refinement considered criteria of accessibility, safety, and the presence of continuous and representative forest cover, allowing the exclusion of disturbed or fragmented areas and ensuring comparable environmental conditions within each altitudinal class (Queinnec et al., 2022; Khadanga et al., 2023).
Based on this procedure, four sampling plots were established per stratum (50 × 20 m; 0.1 ha each), following designs widely used in studies of tropical and montane forests (Fujiki et al., 2016; Aguirre Mendoza et al., 2021a; García-Cox et al., 2023). A minimum distance of 100 m was maintained between plots in order to reduce spatial autocorrelation and avoid pseudoreplication (Rodrigues Silva et al., 2019; Aguirre Mendoza et al., 2021b).
Additionally, to evaluate the representativeness and adequacy of the sampling effort, species accumulation curves were analyzed based on the cumulative increase in species richness as a function of the number of sampled plots per ecosystem (seasonally dry tropical forest and montane forest). This analysis was conducted using randomization procedures in the R statistical environment, employing the vegan and iNEXT packages (Callaghan et al., 2022; Sánchez Zamora et al., 2024; Repetto et al., 2024). The tendency of the curves to approach an asymptote was used as an indicator of sampling completeness, whereas the lack of stabilization was interpreted as a limitation of the applied effort (Castro-Souza et al., 2024). Within each plot, all tree with a diameter at breast height (DBH) ≥ 10 cm, measured at 1.30 meters above the base of the trunk, were assessed. For each individual, an identification code, total height, and bole height were recorded, following standardized protocols (Rodrigues Silva et al., 2019; Toasa et al., 2020). Tree species were identified directly in the field by botanists experienced in the local flora, based on the recognition of vegetative and reproductive morphological characters. When necessary, identifications were verified using specialized taxonomic literature and reference collections, following standard procedures commonly applied in tropical and montane forest inventories (Gaem et al., 2022; García-Cox et al., 2023).
2.3 Data processing and analysis
The tree composition of the montane forests was analyzed by estimating species richness (S) through the direct count of the total number of recorded families, genera, and species, which constitutes a basic yet fundamental measure for characterizing local floristic diversity (Carvajal-Hernández et al., 2014; Ramírez Huila and Ayoví Garces, 2022). Additionally, the Importance Value Index (IVI) was estimated for each species by combining three structural components: relative abundance (RA), relative frequency (RF), and relative dominance (RD), the latter based on the total basal area of each species. The IVI was then used to compare the most representative species along the altitudinal gradient, allowing the identification of those with the highest ecological relevance, following the approach proposed by Yeboah et al. (2022). To calculate the IVI, the following formula was used:
Where:
Alpha diversity was assessed using the Hill numbers framework, which parsimoniously integrates traditional diversity metrics (Shannon and Simpson) within a unified framework of effective diversity. This approach allows comparisons of species richness (q = 0), abundance-weighted diversity (q = 1), and the dominance of common species (q = 2), thereby reducing redundancy among indices and facilitating consistent ecological interpretations across ecosystems and altitudinal strata (Hsieh et al., 2016; Penny et al., 2025). The equation applied was as follows:
Where D is diversity, S is the number of species, pᵢ is the proportion of all individuals belonging to species i, ri is the rarity of species i, defined as 1/pᵢ, and ℓ is the exponent that determines the scale of rarity over which the mean is taken (Roswell et al., 2021).
In addition, beta diversity was assessed using the Sørensen similarity index (S), based on presence–absence matrices of tree species among plots and across altitudinal strata. This index allowed the quantification of floristic turnover along the altitudinal gradient and represents a synthetic, robust, and widely used metric in studies comparing plant communities (Carvajal-Hernández et al., 2014; Karami et al., 2021):
Where a represents the number of shared species between two sites, and b and c correspond to the species exclusive to each site (Karami et al., 2021).
Forest structure was characterized through the distribution of individuals into diameter classes (5-cm intervals) (De Cáceres et al., 2019; Abreu Neto et al., 2021) and height classes (5-m intervals) (Junyan et al., 2014), which allowed identifying structural trends, regeneration patterns, and successional stages of the forest.
Finally, a Multiple Correspondence Analysis (MCA) was performed using the FactoMineR package in RStudio v4.4.1 (Lê et al., 2008) to explore the associations among the abundance of taxonomic families, DBH classes, height classes, and altitudinal ranges. This analysis focused on the most dominant taxonomic families, enabling the identification of key structural and ecological patterns in relation to the environmental gradient.
3 Results
3.1 Effort and representativeness of floristic sampling
The species accumulation curve estimated for the SDTF of the Sonche district, fitted using the Clench model, showed a progressive increase in species richness as the sampled area increased. The shape of the curve exhibited a clear tendency toward saturation, although it did not fully reach the asymptote. The estimated total richness (S* = 79.51 species) exceeded the observed number of species, suggesting the presence of additional species that were not recorded during sampling. Similarly, in montane forests, the species accumulation curve displayed a progressive trend toward stabilization as the sampled area increased. The initial increase in richness was rapid, followed by a gradual decrease in slope, indicating a reduction in the rate of incorporation of new species. The approach of the curve to the estimated asymptote (S* = 126.78) suggests that the applied sampling effort was adequate to capture a representative proportion of the floristic diversity of this ecosystem. Overall, although complete stabilization was not achieved in either case, the results indicate that the sampling effort was sufficient to describe general diversity patterns, while acknowledging that increased sampling could allow the detection of additional species (Figure 2).
Figure 2

Species–area curves fitted to Clench’s model in SDTF and montane forests in the Sonche district.
3.2 Tree composition
In the forests of the Sonche district, 133 tree species were recorded, belonging to 47 families and 76 genera (Supplementary Table 1). Species, genus, and family richness exhibited a pattern clearly structured by elevation and ecosystem type (Figures 3a–c), reflecting a pronounced floristic differentiation along the gradient. In seasonally dry tropical forests, occurring between 1,900 and 2,300 m a.s.l., the lowest levels of tree diversity were observed, consistent with the more restrictive climatic conditions of this altitudinal belt. In contrast, the 2,300–2,500 m a.s.l. interval, corresponding to montane forests, concentrated the highest floristic richness, indicating more favorable environmental conditions for the establishment and coexistence of a greater number of taxa. Above 2,500 m a.s.l., a slight decline in tree richness was recorded, suggesting a possible combined effect of lower temperatures and edaphic limitations. Overall, these results reveal a unimodal richness pattern along the altitudinal gradient, with a peak in the mid-montane zone and a decline at both the lower dry forest elevations and the uppermost altitudes.
Figure 3

Richness of tree flora in the forests of the Sonche district along different altitudinal gradients: (a) species richness, (b) genus richness, and (c) family richness.
3.2.1 Importance value index
Table 1 presents the Importance Value Index (IVI) of tree species along the altitudinal gradient from 1900 to 2,700 m a.s.l. in the forests of the Sonche district. In the lower altitude range (1900–2,100 m), Vachellia aroma exhibited the highest IVI (12.97), associated with its high abundance and relative dominance, followed by Inga adenophylla and Clusia rigida, wich consistently contributed to the characteristic forest structure of SDTF. Between 2,100 and 2,300 m, Escallonia paniculata and Myrsine oligophylla reached the highest IVI values (>10), reflecting a floristic transition with a progressively more uniform distribution of dominance among various taxa. In the 2,300–2,500 m range, Aiouea montana stood out for its high structural dominance, while Ilex scopulorum and Hieronyma oblonga maintained intermediate values. Finally, at 2500–2700 m, Clethra revoluta and Clusia hylaeae were the most important tree species. These patterns confirm a well-defined altitudinal floristic succession and high structural complexity within the ecosystem.
Table 1
| Altitude range (m.a.l.s) | Species | AA | RA (%) | AF | RF (%) | AD | RD (%) | IVI |
|---|---|---|---|---|---|---|---|---|
| 1900–2,100 | Vachellia aroma | 54.00 | 18.00 | 4.00 | 5.33 | 9.83 | 15.58 | 12.97 |
| Inga adenophylla | 22.00 | 7.33 | 4.00 | 5.33 | 6.12 | 9.70 | 7.46 | |
| Clusia rigida | 29.00 | 9.67 | 4.00 | 5.33 | 4.00 | 6.34 | 7.11 | |
| Ficus maroma | 12.00 | 4.00 | 2.00 | 2.67 | 5.57 | 8.83 | 5.16 | |
| Vernonanthura patens | 20.00 | 6.67 | 3.00 | 4.00 | 2.98 | 4.72 | 5.13 | |
| Buddleja longifolia | 17.00 | 5.67 | 3.00 | 4.00 | 2.99 | 4.74 | 4.80 | |
| Escallonia pendula | 10.00 | 3.33 | 3.00 | 4.00 | 4.13 | 6.55 | 4.63 | |
| Allophylus densiflorus | 15.00 | 5.00 | 3.00 | 4.00 | 2.72 | 4.31 | 4.44 | |
| Ficus maxima | 11.00 | 3.67 | 2.00 | 2.67 | 4.26 | 6.75 | 4.36 | |
| Solanum asperolanatum | 12.00 | 4.00 | 4.00 | 5.33 | 1.30 | 2.06 | 3.80 | |
| 2,100–2,300 | Escallonia paniculata | 45.00 | 14.24 | 3.00 | 4.17 | 6.51 | 13.65 | 10.68 |
| Myrsine oligophylla | 46.00 | 14.56 | 4.00 | 5.56 | 4.82 | 10.10 | 10.07 | |
| Vachellia aroma | 26.00 | 8.23 | 3.00 | 4.17 | 5.91 | 12.39 | 8.26 | |
| Vernonanthura patens | 27.00 | 8.54 | 4.00 | 5.56 | 3.06 | 6.42 | 6.84 | |
| Allophylus densiflorus | 20.00 | 6.33 | 2.00 | 2.78 | 4.25 | 8.91 | 6.01 | |
| Clusia rigida | 24.00 | 7.59 | 3.00 | 4.17 | 2.40 | 5.03 | 5.60 | |
| Alnus acuminata | 11.00 | 3.48 | 3.00 | 4.17 | 3.68 | 7.71 | 5.12 | |
| Roupala monosperma | 18.00 | 5.70 | 2.00 | 2.78 | 2.60 | 5.45 | 4.64 | |
| Mauria peruviana | 13.00 | 4.11 | 4.00 | 5.56 | 1.30 | 2.73 | 4.13 | |
| Ferreyranthus excelsus | 6.00 | 1.90 | 3.00 | 4.17 | 0.80 | 1.68 | 2.58 | |
| 2,300–2,500 | Aiouea montana | 50.00 | 10.48 | 4.00 | 3.01 | 18.55 | 15.30 | 9.60 |
| Ilex scopulorum | 30.00 | 6.29 | 4.00 | 3.01 | 10.22 | 8.43 | 5.91 | |
| Hieronyma oblonga | 24.00 | 5.03 | 4.00 | 3.01 | 7.64 | 6.30 | 4.78 | |
| Critiomopsis pycnantha | 25.00 | 5.24 | 3.00 | 2.26 | 7.12 | 5.87 | 4.46 | |
| Myrcianthes rhopaloides | 21.00 | 4.40 | 4.00 | 3.01 | 4.96 | 4.09 | 3.83 | |
| Cyathea austropallescens | 25.00 | 5.24 | 4.00 | 3.01 | 3.53 | 2.91 | 3.72 | |
| Clusia multiflora | 23.00 | 4.82 | 3.00 | 2.26 | 4.58 | 3.78 | 3.62 | |
| Clethra revoluta | 15.00 | 3.14 | 4.00 | 3.01 | 4.70 | 3.88 | 3.34 | |
| Mollinedia lanceolata | 19.00 | 3.98 | 3.00 | 2.26 | 3.02 | 2.49 | 2.91 | |
| Cyathea caracasana | 16.00 | 3.35 | 4.00 | 3.01 | 2.40 | 1.98 | 2.78 | |
| 2,500–2,700 | Clethra revoluta | 34.00 | 7.85 | 4.00 | 3.45 | 7.13 | 8.17 | 6.49 |
| Clusia hylaeae | 21.00 | 4.85 | 3.00 | 2.59 | 6.70 | 7.68 | 5.04 | |
| Hieronyma oblonga | 18.00 | 4.16 | 4.00 | 3.45 | 5.37 | 6.16 | 4.59 | |
| Ilex quitensis | 29.00 | 6.70 | 3.00 | 2.59 | 3.70 | 4.24 | 4.51 | |
| Hesperomeles ferruginea | 28.00 | 6.47 | 2.00 | 1.72 | 4.07 | 4.67 | 4.29 | |
| Alchornea triplinervia | 13.00 | 3.00 | 2.00 | 1.72 | 6.21 | 7.12 | 3.95 | |
| Cyathea delgadii | 22.00 | 5.08 | 3.00 | 2.59 | 3.27 | 3.75 | 3.81 | |
| Miconia neriifolia | 19.00 | 4.39 | 3.00 | 2.59 | 2.78 | 3.19 | 3.39 | |
| Nectandra laurel | 15.00 | 3.46 | 4.00 | 3.45 | 2.83 | 3.24 | 3.39 | |
| Myrcianthes myrsinoides | 18.00 | 4.16 | 2.00 | 1.72 | 2.85 | 3.27 | 3.05 |
Tree species with the highest Importance Value Index (IVI) by altitudinal range in the forests of the Sonche district, northeastern Peru.
3.2.2 Predominance of tree flora by altitude gradient
The predominance of tree species in the forests of Sonche is influenced by elevation and the ecological characteristics of the ecosystem (Supplementary Table 1; Table 1). In the altitudinal range of 1900–2,100 m a.s.l., there is a high dominance of species adapted to dry and warm conditions, including Vachellia aroma, Clusia rigida, Inga adenophylla, Vernonanthura patens, and Buddleja longifolia (Figure 4a). In the 2,100–2,300 m range, the floristic composition reflects a transition zone toward humid montane forest. Although important records of species typical of dry environments were still found, such as Vachellia aroma, Clusia rigida, and Vernonanthura patens, the most abundant species were Myrsine oligophylla and Escallonia paniculata, which indicate the presence of more temperate and humid conditions (Figure 4b). Between 2,300 and 2,500 m a.s.l., the presence of species characteristic of humid montane forests increases, including Aiouea montana, Ilex scopulorum, Critoniopsis pycnantha, Cyathea austropallescens, Hieronyma oblonga, and Clusia multiflora (Figure 4c). Finally, in the 2,500–2,700 m altitudinal range, species typical of high and cold environments prevail, such as Clethra revoluta, Ilex quitensis, Hesperomeles ferruginea, Cyathea delgadii, and Clusia hylaeae (Figure 4c). This pattern demonstrates floristic turnover along the altitudinal gradient, primarily driven by variations in temperature, humidity, and forest structure, factors that directly influence the composition and distribution of tree communities.
Figure 4

Rank–abundance curves of tree species across different altitudinal gradients in the forests of the Sonche district: (a) 1900–2100 m a.s.l., (b) 2100–2300 m a.s.l., (c) 2300–2500 m a.s.l., and (d) 2500–2700 m a.s.l.
Distribution of tree flora by ecosystem of the 15 most important tree species recorded in the forests of the Sonche district, 11 were found exclusively in a single ecosystem, indicating a marked ecological segregation. Six species were restricted to dry forests, while Escallonia paniculata, although present in montane forests, showed a strong preference for dry forests, reflecting the dominance of certain species in this ecosystem. Standardizing the data as percentages allows for comparison of the relative contribution of each ecosystem, highlighting species’ ecological specialization and emphasizing the complementary importance of dry and montane forests for the conservation of local tree diversity (Figure 5).
Figure 5
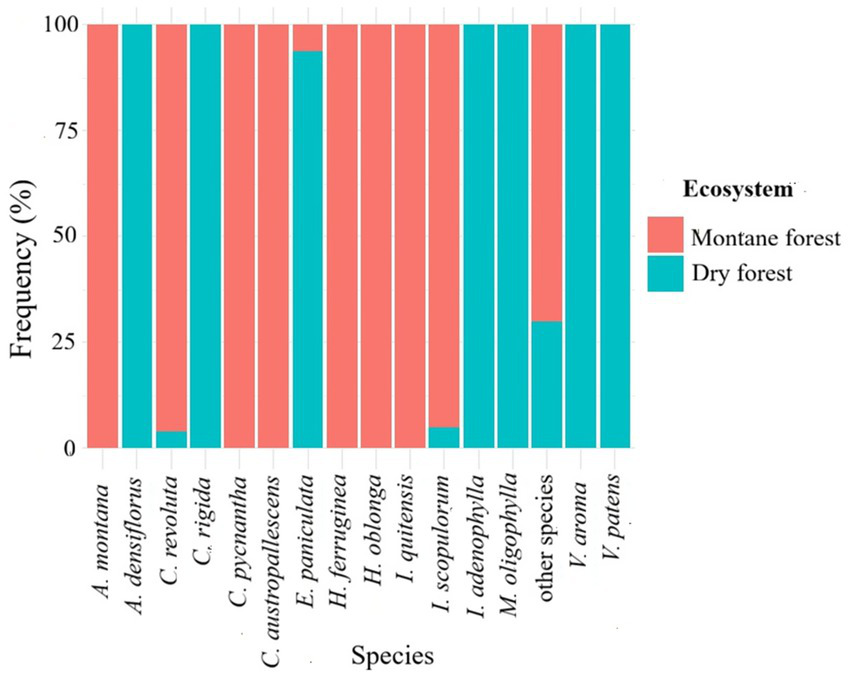
Relative abundance of the most important tree species in the forests of the Sonche district in relation to ecosystem type.
3.3 Diversity indices
3.3.1 Alpha diversity
The results of the alpha diversity analysis based on Hill numbers, presented in Table 2, reveal contrasting patterns between SDTF and montane forests. In the SDTF (1900–2,300 m a.s.l.), alpha diversity was moderate, although clear variations were observed between the two altitudinal ranges evaluated. In plots located between 1900 and 2,100 m a.s.l. (S01–S04), species richness (Hill q0) was relatively high and homogeneous (17–23 species), accompanied by moderate values of Hill q1 and q2, suggesting communities with intermediate evenness and moderate dominance.
Table 2
| Sampling plots | Hill_q0 | Hill_q1 | Hill_q2 |
|---|---|---|---|
| S01 | 23 | 15.8770 | 10.9523 |
| S02 | 17 | 11.3627 | 7.8671 |
| S03 | 18 | 11.1956 | 7.3359 |
| S04 | 19 | 13.7764 | 10.7761 |
| S05 | 21 | 12.9405 | 8.5765 |
| S06 | 13 | 9.3431 | 7.4377 |
| S07 | 21 | 13.1343 | 9.1721 |
| S08 | 19 | 9.3933 | 5.1941 |
| S09 | 34 | 22.5930 | 15.1595 |
| S10 | 34 | 22.3271 | 13.7778 |
| S11 | 30 | 24.1812 | 20.3636 |
| S12 | 33 | 20.9420 | 14.3949 |
| S13 | 31 | 20.3419 | 14.9695 |
| S14 | 31 | 23.5398 | 18.5274 |
| S15 | 24 | 13.1279 | 8.8259 |
| S16 | 31 | 22.7642 | 18.0505 |
Alpha diversity of tree communities in seasonally dry tropical forests (SDTF) and montane forests in the district of Sonche, Chachapoyas Province, estimated using Hill numbers (q0: species richness; q1: Shannon effective diversity; q2: Simpson effective diversity).
In contrast, in the 2,100–2,300 m a.s.l. range (S05–S08), greater variability in richness (13–21 species) and a more pronounced reduction in q1 and q2 relative to q0 were observed, particularly in plots S06 and S08. This pattern indicates lower evenness and a stronger influence of dominant species in SDTF plots at higher elevations. Conversely, montane forests (2300–2,700 m a.s.l.; S09–S16) exhibited the highest alpha diversity values. In plots located between 2,300–2,500 m a.s.l. (S09–S12), species richness (Hill q0) was high (30–34 species), together with elevated Hill q1 and q2 values, indicating diverse and relatively even communities with moderate dominance. In the upper range, between 2,500–2,700 m a.s.l. (S13–S16), species richness remained comparable (24–31 species), although greater variability in q1 and q2 was observed. Plots such as S14 and S16 showed high evenness, whereas S15 exhibited higher dominance.
Overall, these results indicate a decrease in tree community evenness with increasing elevation in both ecosystems, as well as clear structural differences between SDTF and montane forests.
3.3.2 Beta diversity (similarity)
The analysis of floristic similarity among tree species in the evaluated plots of the forests of the Sonche district, based on the Sørensen index, reveals three well-defined groups (Figure 6). The first group (S01–S07) is associated with lower elevations and SDTF, with a mean similarity of 44% (range: 22–77%). These plots are characterized by lower plant diversity and a higher dominance of a few species, reflecting more homogeneous environmental conditions. The second group (S09–S16) comprises higher-elevation areas and plots located in montane forests, with an average similarity of 43.7% (range: 28–68%). This group is dominated by communities adapted to cold and humid environments, exhibiting high diversity and a relatively even distribution of species. Finally, plot S08 forms an independent group because it is located in a transitional zone, with a mixed floristic composition that combines elements from both groups, representing an intermediate ecosystem with distinct characteristics. Overall, these results demonstrate a clear floristic differentiation associated with altitudinal gradients and local ecological conditions in the forests of Sonche.
Figure 6

Analysis of floristic similarity between plots in the forests of the Sonche district, based on the Sorensen index.
3.4 Diametric and altimetric structure of trees
The graphs in Figure 7 show the frequency distribution of trees in the SDTF and montane forests of the Sonche district according to diameter classes. In the SDTF (Figure 7a), the diameter structure exhibits a typical inverted “J” pattern, with a marked dominance of small-diameter individuals. The highest frequency occurs in the 10–15 cm DBH class (409 individuals), followed by the 15–20 cm class (151 individuals). Beyond 20 cm in diameter, abundance decreases sharply, with fewer than 40 individuals in the 20–25 cm class and very low values in diameter classes above 30 cm, indicating a limited representation of large trees and a relatively homogeneous structure.
Figure 7

Distribution of tree frequency according to diameter in the forests of the Sonche district: (a) diameter class of dry forests, and (b) diameter class of montane forests.
In montane forests (Figure 7b), a similar structural pattern is observed, although with a wider range of diameter classes. The 10–15 cm class shows the highest frequency (502 individuals), followed by the 15–20 cm (244 individuals) and 20–25 cm (82 individuals) classes. Unlike SDTF, montane forests include individuals in larger diameter classes, reaching up to 45–50 cm, although at low frequencies (<10 individuals). Overall, the results indicate forests structurally dominated by young trees, with differences associated with the ecological conditions of each ecosystem.
Figure 8 presents the histograms of tree height classes for the two ecosystems evaluated in the Sonche district. In the SDTF, a marked dominance of low- to medium-height individuals is observed. The 0–5 m (128 individuals) and 5–10 m (429 individuals) classes account for the highest frequencies, together representing more than 90% of the recorded individuals. In contrast, height classes above 10 m show very low frequencies (<10%), indicating a limited presence of tall trees and reflecting a simple vertical structure dominated primarily by young and developing individuals.
Figure 8

Distribution of tree height classes in the forests of the Sonche district: (a) height class in dry forests, and (b) height class in montane forests.
In turn, montane forests exhibit a more complex vertical structure compared to SDTF. The greatest abundance is concentrated in intermediate height classes, particularly 5–10 m (639 individuals) and 10–15 m (141 individuals), which together comprise more than 85% of the recorded individuals. Lower classes (≤5 m) also maintain a substantial representation (130 individuals), suggesting continuous recruitment. In addition, the presence of individuals in height classes above 15 m, although at low frequencies (<10%), indicates greater vertical stratification and a relatively better-developed forest structure.
Floristic-structural variation as a function of the altitudinal gradient Multiple correspondence analysis (MCA) enabled an integrated visualization of the distribution and associations of the ten most dominant tree families in the forests of the Sonche district along the altitudinal gradient and between ecosystem types, simultaneously incorporating individual abundance and structural attributes (diameter and height classes) (Figure 9). The main MCA axes effectively captured the floristic and structural differentiation associated with environmental variation. At lower elevations (1900–2,100 m a.s.l.), Fabaceae and Clusiaceae clustered closely, whereas between 2,100 and 2,300 m a.s.l. a marked association between Asteraceae and Primulaceae was observed, reflecting tree communities dominated by shorter individuals with intermediate diameters. From a structural perspective, this pattern confirms that the water stress characteristic of dry forests constrains vertical tree growth. In contrast, at higher elevations (2300–2,700 m a.s.l.), Lauraceae, Melastomataceae, Clethraceae, and Aquifoliaceae predominated, being associated with trees of larger diameters and greater heights adapted to colder and more humid conditions. Overall, the analysis reveals a gradual segregation of families between ecosystems and along the altitudinal gradient, highlighting elevation and environmental conditions as key determinants of forest composition and structure in the Sonche district.
Figure 9
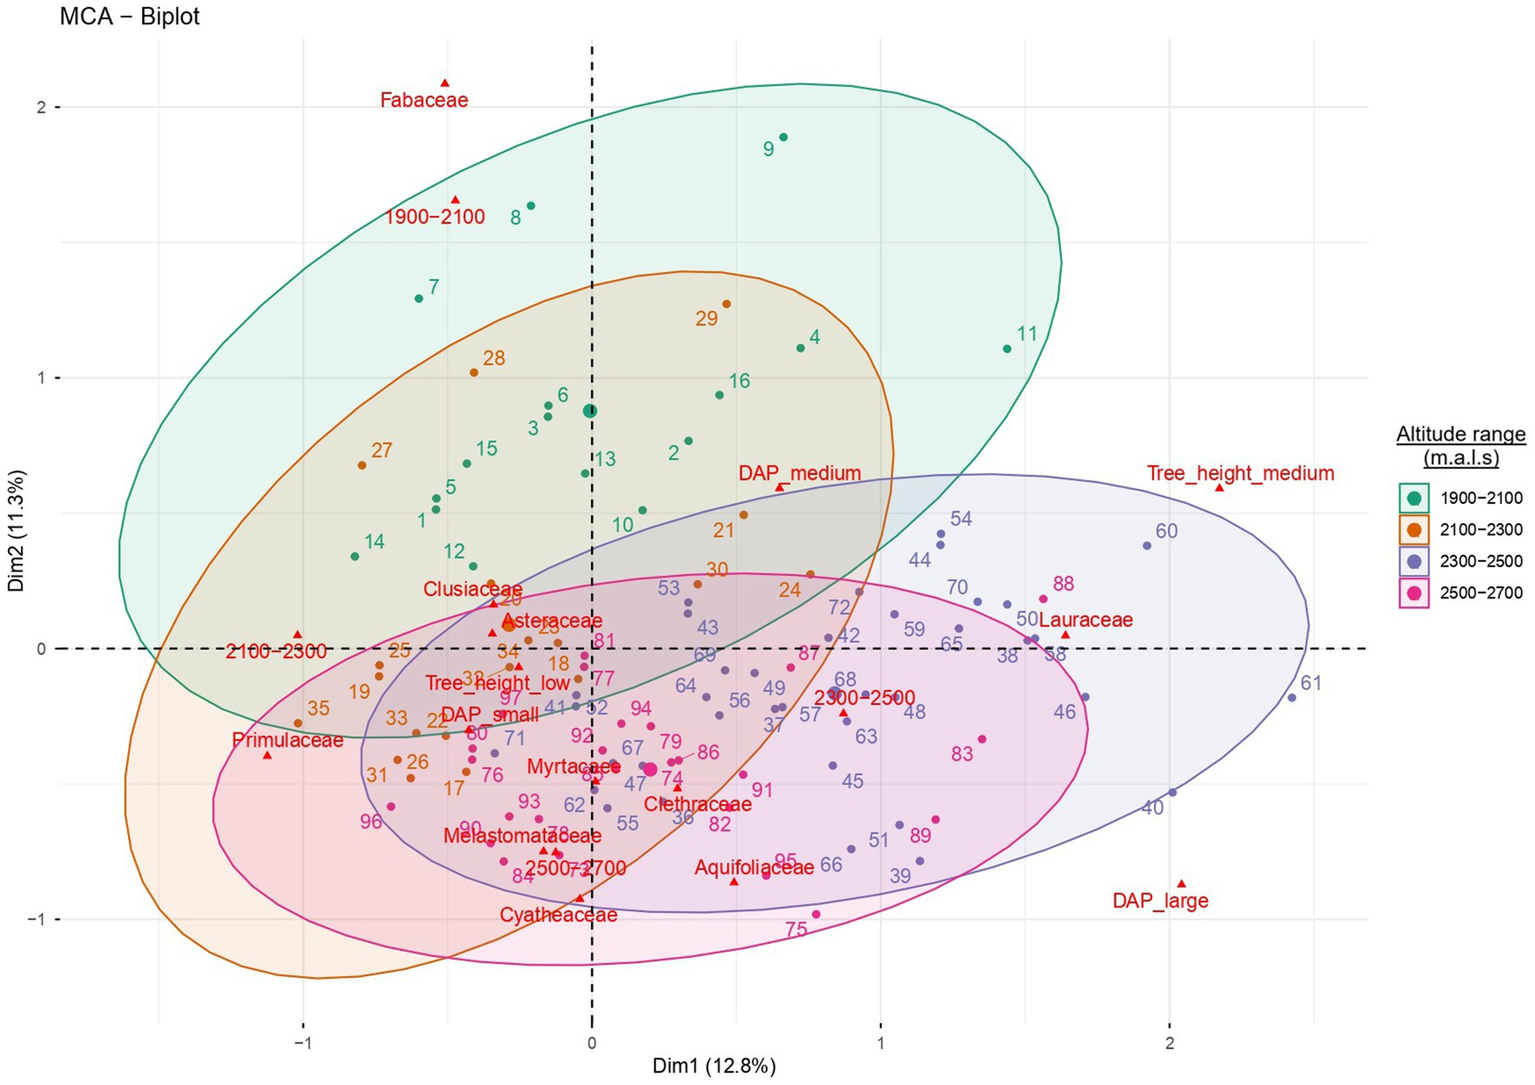
Multiple correspondence analysis (MCA) showing the floristic-structural differentiation of the dominant families according to the altitudinal gradient.
4 Discussion
The results of this study provide relevant empirical evidence on the ecological role of seasonally dry tropical forests (SDTFs) at altitudinal limits and their transition toward montane forests, a component that has historically been underrepresented in Andean ecological research (Cueva et al., 2019). Although tropical dry forests have been widely recognized for their high functional specialization, pronounced climatic seasonality, and high proportion of endemic species, most studies have focused on latitudinal gradients or lowland environments (Siyum, 2020). In contrast, altitudinal gradients linking these ecosystems with montane forest formations have received limited attention, constraining our understanding of the ecological processes that structure such transitions (Murga-Orrillo et al., 2021).
In the Sonche district, SDTFs exhibited a relatively homogeneous floristic structure, characterized by low tree species richness and strong dominance by a few species, notably Vachellia aroma, Inga adenophylla, Clusia rigida, and Myrsine oligophylla (Aguirre Mendoza et al., 2021a, 2021b). This pattern reflects communities dominated by species highly tolerant to water stress (Dirzo et al., 2011; Galván-Cisneros et al., 2023; Rodríguez and Oyuela-Andino, 2023), with high relative density, small to intermediate diameters, and a predominance of young individuals (Montenegro-Hoyos et al., 2022; Ramírez et al., 2022). Consequently, the observed structural dominance suggests a simplified forest organization typical of Andean and Neotropical SDTFs, where a small number of species control most of the space and resources, limiting vertical stratification and promoting rapid regeneration dynamics (Pennington et al., 2000).
The vertical structure of SDTFs further supports this interpretation, as individuals between 0 and 10 m in height predominate. In dry environments, limited water availability constrains vertical stem growth and favors species adapted to seasonal stress conditions (Pennington et al., 2000). These adaptations include functional strategies such as deciduous phenology, small or semi-persistent leaves, and deep root systems that optimize water use but do not necessarily promote the development of tall, complex canopies (Miles et al., 2006). However, this pattern may also reflect continuous recruitment coupled with lower survival of mature trees under prolonged drought conditions. Consistently, the inverted “J-shaped” diameter distribution recorded in SDTFs is characteristic of forests with high regeneration rates and elevated mortality of large individuals, a pattern widely documented in dry forests across Latin America (Reis et al., 2017).
In contrast, montane forests exhibited greater floristic heterogeneity and more evenly distributed Importance Value Index (IVI) values among multiple species, including Aiouea montana, Clethra revoluta, Ilex quitensis, Ilex scopulorum, Hieronyma oblonga, and Clusia multiflora. This pattern reflects less restrictive environmental conditions, associated with higher precipitation and moderate temperatures (Cueva et al., 2019). Tree species richness peaked between 2,300 and 2,500 m a.s.l., following a unimodal pattern characteristic of montane ecosystems, where diversity reaches its maximum at mid-elevations (Li et al., 2023). This pattern has been attributed to a combination of favorable climatic conditions, increased moisture availability, and high structural heterogeneity, which facilitate the coexistence of species with both tropical and montane affinities (Sánchez Zamora et al., 2024). Conversely, at elevations above 2,500 m a.s.l., diversity declines progressively due to thermal constraints and more severe environmental filters that limit the establishment of less-adapted species (Bañares-de-Dios et al., 2024).
The transition between SDTFs and montane forests along the altitudinal gradient highlights the central role of water availability and elevation-modulated climatic conditions in shaping forest composition and architecture, in agreement with patterns observed in other Andean gradients (Blundo et al., 2012). Beta diversity analysis using the Sørensen index confirmed a clear floristic differentiation between both ecosystems; however, this transition is not abrupt. Instead, an ecological continuum is evident, where typical dry forest species coexist with montane forest elements, particularly in ecotonal plots such as S08. This pattern of floristic overlap has been widely documented in tropical altitudinal gradients and reflects the interaction of climatic, edaphic, and topographic factors rather than the presence of rigid environmental thresholds (Veintimilla et al., 2019; Guzmán et al., 2025). In this context, altitude modulates the hydric filters characteristic of dry forests through its interaction with thermal gradients and changes in soil structure, allowing the persistence of mixed communities (Krömer et al., 2013).
From a biogeographic perspective, the tree species composition recorded at altitudinal limits supports the hypothesis that montane dry forests function as contact zones and potential ecological corridors between contrasting bioclimatic regions (Blundo et al., 2012). Nevertheless, most available studies lack spatial designs capable of capturing this complexity, as they are based on isolated plots or inventories without altitudinal continuity (Malizia et al., 2020). In this regard, the scarcity of permanent plots in dry forests of northern Peru limits the assessment of temporal dynamics, species turnover rates, and responses to climatic variability—processes that require continuous sampling along environmental gradients (Baez et al., 2015; Malizia et al., 2020).
Multiple correspondence analysis (MCA) reinforced these patterns by revealing clear associations between dominant plant families and specific environmental conditions. In lower SDTF zones, Fabaceae and Clusiaceae were associated with warm and dry environments, characterized by fast-growing species with efficient water use (Aguirre Mendoza et al., 2021a, 2021b; Galván-Cisneros et al., 2023). At intermediate elevations, Asteraceae and Primulaceae were linked to smaller-stature trees, suggesting nutrient limitations that constrain structural development (Montenegro-Hoyos et al., 2022). In montane forests, Lauraceae, Melastomataceae, Clethraceae, and Aquifoliaceae dominated the floristic composition, reflecting adaptations to cold and humid environments and to organic matter–rich soils (Tejedor Garavito et al., 2014; Guzmán et al., 2022).
From a conservation perspective, our results support a shift toward strategies that recognize the altitudinal gradient as an integrated ecological unit, in which the conservation of SDTFs and montane forests is complementary for maintaining connectivity, ecosystem resilience, and the provision of ecosystem services under climate change (Killeen and Solorzano, 2008). The conservation of ecological corridors between 1900 and 2,700 m a.s.l. is a priority to facilitate species movements and altitudinal range shifts associated with global warming (Meza Mori et al., 2020; Meza-Mori et al., 2025). SDTFs are not merely the lower end of the altitudinal gradient, but rather a distinct and vulnerable component of the Andean ecological system, structured by restrictive environmental conditions that favor communities dominated by a few drought-adapted species (Pennington et al., 2009). Their degradation would have disproportionate effects on landscape connectivity, hydrological regulation, and the ecological stability of the entire system (Miles et al., 2006; Malhi et al., 2014; Dryflor et al., 2016).
Likewise, the values of the Importance Value Index (IVI) provide a robust empirical basis for linking observed structural patterns with concrete actions in ecological restoration and climate change adaptation. In the 1900–2,100 m a.s.l. range (seasonally dry tropical forest), low diversity and high dominance of Vachellia aroma and Inga adenophylla reflect functionally simplified communities that are nonetheless critical for system stability. Their high abundance, drought tolerance, wide distribution, and capacity for biological nitrogen fixation (Bax et al., 2021) make them priority candidates for the revegetation of degraded soils and for facilitating the establishment of less stress-tolerant species (Fremout et al., 2021; de Araújo et al., 2024). However, these species are highly vulnerable to the projected increase in the duration and intensity of dry periods, which may increase mortality and reduce natural regeneration (Campo et al., 2023). In the transitional zone between 2,100 and 2,300 m a.s.l., the pronounced ecotonal character is expressed in a relatively balanced community structure, indicating high sensitivity to relatively small changes in temperature and precipitation at the climatic boundary between dry and montane forests (Elsen et al., 2018). In the mid-montane forest (2300–2,500 m a.s.l.), where the unimodal peak of diversity is concentrated, climate vulnerability increases due to the dominance of species adapted to environmentally stable conditions, with low thermal variability and predictable hydrological regimes (Gillani et al., 2025). Furthermore, in the high montane forest (2500–2,700 m above sea level), species adapted to cold and humid climates face a high risk of local extinction due to the lack of available altitudinal space to migrate in the face of the upward shift of climatic niches (Mata-Guel et al., 2023).
Finally, this study presents limitations that should be considered when interpreting the results. Increased sampling effort would improve the representativeness of tree diversity, particularly in transition zones between SDTFs and montane forests (Chao et al., 2014). Moreover, the absence of soil analyses and biomass estimates constrains our understanding of the functional processes regulating forest structure and productivity (Pan et al., 2011; Poorter et al., 2015). Future research should integrate edaphic variables, carbon stocks, and population dynamics to more accurately assess the ecological resilience of these ecosystems under climate change.
5 Conclusion
This study demonstrates that tree diversity along the altitudinal gradient in the district Sonche does not follow a non-linear pattern, but rather a unimodal one, with a maximum between 2,300 and 2,500 m a.s.l., near the transition zone between SDTF and montane forest. In this context, this diversity peak, together with the systematic shifts in species dominance, confirms the existence of a well-defined altitudinal floristic succession and a high level of structural complexity within the ecosystem. Furthermore, our results allow a precise identification of both the most sensitive segments of the gradient and the structurally most important species, which are simultaneously the most vulnerable to climate change. At lower elevations (1900–2,100 m), communities dominant by Vachellia aroma and Inga adenophylla which are key to the stability of the SDTF, are highly sensitive to the projected increase in the duration and intensity of dry periods, potentially increasing mortality and limiting regeneration. Similarly, in the mid-montane forest (2300–2,500 m), where the diversity maximum is concentrated, dominant species adapted to historically stable environmental conditions show high vulnerability to rising temperatures and changes in precipitation seasonality. Finally, in the upper montane forest (2500–2,700 m), strictly montane species that sustain canopy structure under cold and humid climates face a high risk of local extinction due to the lack of available altitudinal space for upward migration. Taken together, we propose that conservation should focus on the entire altitudinal gradient as an integrated functional unit, as the loss of dry forest at lower elevations or montane forest at higher elevations would compromise ecological integrity, landscape connectivity, and the provision of ecosystem services throughout the system.
Statements
Data availability statement
The original contributions presented in the study are included in the article/Supplementary material, further inquiries can be directed to the corresponding authors.
Author contributions
EC-C: Methodology, Writing – review & editing, Writing – original draft, Investigation, Conceptualization. EP-M: Formal analysis, Methodology, Data curation, Writing – review & editing. RR: Conceptualization, Writing – review & editing, Methodology, Formal analysis, Investigation, Data curation, Validation. JC: Software, Methodology, Writing – review & editing. AD: Methodology, Writing – review & editing, Software. MO-C: Supervision, Writing – review & editing, Resources, Funding acquisition. AH-P: Project administration, Writing – review & editing, Methodology, Writing – original draft.
Funding
The author(s) declared that financial support was received for this work and/or its publication. This research was primarily funded by Project CUI 2314090, “Creation of Herbarium and Plant Species Adaptation Center Services at Toribio Rodríguez de Mendoza National University - Amazonas Region,” and the Vice-Rectorate for Research at Toribio Rodríguez de Mendoza National University of Amazonas.
Acknowledgments
The authors thank the Instituto de Investigación para el Desarrollo Sistentable de Ceja de Selva (INDESCES) for the financial support provided for the execution of this research. They also acknowledge the Vice-Rectorate for Research of the Universidad Nacional Toribio Rodríguez de Mendoza de Amazonas, for funding the publication of this manuscript. The authors likewise express their sincere gratitude to Julio César Chacón Cabanillas and Héctor Tauma Alvarado for their assistance during field data collection. Finally, they thank Biol. Ítalo Revilla Pantigoso, an expert in the botany of Peruvian tropical forests, for his guidance and support in validating the taxonomic identification of tree species.
Conflict of interest
The author(s) declared that this work was conducted in the absence of any commercial or financial relationships that could be construed as a potential conflict of interest.
Generative AI statement
The author(s) declared that Generative AI was not used in the creation of this manuscript.
Any alternative text (alt text) provided alongside figures in this article has been generated by Frontiers with the support of artificial intelligence and reasonable efforts have been made to ensure accuracy, including review by the authors wherever possible. If you identify any issues, please contact us.
Publisher’s note
All claims expressed in this article are solely those of the authors and do not necessarily represent those of their affiliated organizations, or those of the publisher, the editors and the reviewers. Any product that may be evaluated in this article, or claim that may be made by its manufacturer, is not guaranteed or endorsed by the publisher.
Supplementary material
The Supplementary material for this article can be found online at: https://www.frontiersin.org/articles/10.3389/ffgc.2026.1765957/full#supplementary-material
References
1
Abreu Neto R. D. Abreu M. C. Soares A. A. V. Monte M. A. Araújo E. J. G. D. Curto R. D. A. et al . (2021). De-scribing the structure and relationship of height and diameter in an old unmanaged Eucalyptus spp. plantation. Florest. Ambient.28:e20200087. doi: 10.1590/2179-8087-FLORAM-2020-0087
2
Aguirre Mendoza Z. Chamba Valarezo M. Díaz López M. Pacheco Pineda E. (2021a). Composición florística y estructura de un remanente de bosque seco en la Estación Experimental Zapotepamba, Loja, Ecuador. Bosques Latitud Cero11, 97–112.
3
Aguirre Mendoza Z. Orellana Orellana F. Jaramillo Díaz N. Peña Tamayo J. Quizhpe Coronel W. (2021b). Composición florística, estructura y endemismo del componente leñoso en una parcela permanente en el bosque protector El Sayo, Loja, Ecuador. Cienc. Lat. Rev. Multidiscip.5:3062. doi: 10.37811/cl_rcm.v5i3.506
4
Añazco Urbina B. Rivera López R. Y. Pariente Mondragón E. (2021). Diversidad y composición florística de un área de bosque montano, San Carlos, Bongará, Amazonas. Arnaldoa28, 441–458. doi: 10.22497/arnaldoa.283.28301
5
Baez S. Malizia A. Carilla J. Blundo C. Aguilar M. Aguirre N. et al . (2015). Large-scale patterns of turnover and basal area change in Andean forests. PLoS One10:e0126594. doi: 10.1371/journal.pone.0126594,
6
Bañares-de-Dios G. Macía M. J. Arellano G. Granzow-de la Cerda Í. Vega-Álvarez J. Arnelas I. et al . (2024). Woody plant taxonomic, functional, and phylogenetic diversity decrease along elevational gradients in Andean tropical montane forests: environmental filtering and arrival of temperate taxa. Plant diversity46, 491–501. doi: 10.1016/j.pld.2024.03.005,
7
Bax V. Castro-Nunez A. Francesconi W. (2021). Assessment of potential climate change impacts on montane forests in the peruvian Andes: implications for conservation prioritization. Forests12:375. doi: 10.3390/f12030375
8
Blundo C. Malizia L. R. Blake J. G. Brown A. D. (2012). Tree species distribution in Andean forests: influence of regional and local factors. J. Trop. Ecol.28, 83–95. doi: 10.1017/S0266467411000617
9
Bricca A. Zerbe S. Fellin H. Alessi N. Maccherini S. Bonari G. (2025). Passive rewilding of old-established plantations into native forests. J. Veg. Sci.36:e70085. doi: 10.1111/jvs.70085
10
Callaghan C. T. Bowler D. E. Blowes S. A. Chase J. M. Lyons M. B. Pereira H. M. (2022). Quantifying effort needed to estimate species diversity from citizen science data. Ecosphere13:e3966. doi: 10.1002/ecs2.3966
11
Campo J. Giardina C. P. Dirzo R. (2023). Tropical dry forest restoration in an era of global change: ecological and social dimensions. Sustainability15:3052. doi: 10.3390/su15043052
12
Carvajal-Hernández C. I. Krömer T. Vázquez-Torres M. (2014). Riqueza y composición florística de pteridobiontes en bosque mesófilo de montaña y ambientes asociados en el centro de Veracruz, México. Rev. Mex. Biodivers.85, 491–501. doi: 10.7550/rmb.41292
13
Castro-Souza R. A. Tessarolo G. Stropp J. Diniz-Filho J. A. Ladle R. J. Szinwelski N. et al . (2024). Mapping ignorance to uncover shortfalls in the knowledge on global Orthoptera distribution. NPJ Biodivers.3:22. doi: 10.1038/s44185-024-00059-1
14
Chao A. Gotelli N. J. Hsieh T. C. Sander E. L. Ma K. H. Colwell R. K. et al . (2014). Rarefaction and extrapolation with hill numbers: a framework for sampling and estimation in species diversity studies. Ecol. Monogr.84, 45–67. doi: 10.1890/13-0133.1
15
Coronel-Castro E. Meza-Mori G. Torres-Guzmán C. Oliva-Cruz M. Pariente-Mondragón E. Sopla-Tafur R. et al . (2024). Impact of subsistence hunting on the diversity of wildlife species in the Amazonian Andes of northeastern Peru. Biodiversitas25, 4816–4828. doi: 10.13057/biodiv/d251218
16
Cueva E. Lozano D. Yaguana C. (2019). Efecto de la gradiente altitudinal sobre la composición florística, estructura y biomasa arbórea del bosque seco andino, Loja, Ecuador. Bosque (Valdivia)40, 365–378. doi: 10.4067/S0717-92002019000300365
17
Culqui L. Leiva-Tafur D. Haro N. Juarez-Contreras L. Vigo C. N. Quintana J. L. M. et al . (2024). Native species diversity associated with Bosque Palmeras de Ocol in the Amazonas region, Peru. Trees, Forests and People16:100580. doi: 10.1016/j.tfp.2024.100580
18
de Araújo G. B. Vital M. V. C. Campos-Silva J. V. de Lima M. M. Justino G. C. Moura F. (2024). Facilitation in Brazilian semiarid zone: remnant trees show a positive effect on caatinga regeneration. Acta Oecol.122:103977. doi: 10.1016/j.actao.2023.103977
19
De Cáceres M. Martín-Alcón S. González-Olabarria J. R. Coll L. (2019). Un método general para la clasificación de masas forestales mediante la composición de especies y la estructura vertical y horizontal. Ann. For. Sci.76:40. doi: 10.1007/s13595-019-0824-0
20
Delgado-Paredes G. E. Rojas-Idrogo C. Huamà A. (2020). Seasonally dry tropical forests of Peru: current status and conservation with social responsibility. Agri. Res. Tech: Open Access J.24, 96–99. doi: 10.19080/ARTOAJ.2020.24.556269
21
Dirzo R. Young H. S. Mooney H. A. Ceballos G. (2011). Seasonally dry tropical forests: Ecology and conservation. Washington, DC: Island Press.
22
Dryflor Banda-R K. Delgado-Salinas A. Dexter K. G. Linares-Palomino R. Oliveira-Filho A. et al . (2016). Plant diversity patterns in neotropical dry forests and their conservation implications. Science353, 1383–1387. doi: 10.1126/science.aaf5080
23
Elsen P. R. Monahan W. B. Merenlender A. M. (2018). Global patterns of protection of elevational gradients in mountain ranges. Proc. Natl. Acad. Sci.115, 6004–6009. doi: 10.1073/pnas.1720141115,
24
Farr T. G. Rosen P. A. Caro E. Crippen R. Duren R. Hensley S. et al . (2007). The shuttle radar topography mission. Rev. Geophys.45. doi: 10.1029/2005RG000183
25
Figueroa J. Stucchi M. Rojas-VeraPinto R. (2016). Modelación de la distribución del oso andino Tremarctos ornatus en el bosque seco del Marañón (Perú). Rev. Mex. Biodivers.87, 230–238. doi: 10.1016/j.rmb.2016.01.008
26
Fremout T. Gutiérrez-Miranda C. E. Briers S. Marcelo-Peña J. L. Cueva-Ortiz E. Linares-Palomino R. et al . (2021). The value of local ecological knowledge to guide tree species selection in tropical dry forest restoration. Restor. Ecol.29:e13347. doi: 10.1111/rec.13347
27
Fujiki S. Aoyagi R. Tanaka A. Imai N. Kusma A. D. Kurniawan Y. et al . (2016). Large-scale mapping of tree-community composition as a surrogate of forest degradation in Bornean tropical rain forests. Land5:45. doi: 10.3390/land5040045
28
Gaem P. H. Andrade A. Mazine F. F. Vicentini A. (2022). Tree species delimitation in tropical forest inventories: perspectives from a taxonomically challenging case study. For. Ecol. Manag.505:119900. doi: 10.1016/j.foreco.2021.119900
29
Galván-Cisneros C. M. Montaño L. R. S. Ojeda-Rodríguez A. E. Meira-Neto J. A. A. (2023). Structures of tropical dry forests in the Andes: forest conservation, composition and the role of fabaceae and myrtaceae. Cerne29:e-1033189. doi: 10.1590/01047760202329013189
30
García-Cox W. López-Tobar R. Herrera-Feijoo R. J. Tapia A. Heredia-R M. Toulkeridis T. et al . (2023). Floristic composition, structure, and aboveground biomass of the Moraceae family in an evergreen Andean Amazon forest, Ecuador. Forests14:1406. doi: 10.3390/f14071406
31
Gillani S. W. Ahmad M. Manzoor M. Waheed M. Al-Andal A. Fonge B. A. (2025). Altitudinal gradients shaping tree diversity and regeneration dynamics in mountainous ecosystems. BMC Plant Biol.25:652. doi: 10.1186/s12870-025-06677-6,
32
Girardin C. A. Farfan-Rios W. Garcia K. Feeley K. J. Jørgensen P. M. Murakami A. A. et al . (2014). Spatial patterns of above-ground structure, biomass and composition in a network of six Andean elevation transects. Plant Ecol. Divers.7, 161–171. doi: 10.1080/17550874.2013.820806
33
Guzmán P. Benítez Á. Carrión-Paladines V. Salinas P. Cumbicus N. (2022). Elevation and soil properties determine community composition, but not vascular plant richness in tropical andean roadside. Forests13:685. doi: 10.3390/f13050685
34
Guzman B. K. García-Bravo A. Allauja-Salazar E. E. Mejía I. A. Guzmán C. T. Oliva M. (2021). Endemism of woody flora and tetrapod fauna, and conservation status of the inter-Andean seasonally dry tropical forests of the Marañón valley. Glob. Ecol. Conserv.28:e01639. doi: 10.1016/j.gecco.2021.e01639
35
Guzmán N. Gentili R. Jiménez M. Ansaloni R. Citterio S. Minga D. (2025). Exploring plant α-and β-diversity patterns along tropical altitudinal gradients in the southern Andes of Ecuador: a potential pathway to biodiversity conservation. doi: 10.21203/rs.3.rs-8295166/v1
36
Hoekstra J. M. Boucher T. M. Ricketts T. H. Roberts C. (2005). Confronting a biome crisis: global disparities of habitat loss and protection. Ecol. Lett.8, 23–29. doi: 10.1111/j.1461-0248.2004.00686.x
37
Hsieh T. C. Ma K. Chao A. (2016). iNEXT: an R package for rarefaction and extrapolation of species diversity (H ill numbers). Methods Ecol. Evol.7, 1451–1456. doi: 10.1111/2041-210X.12613
38
Instituto Nacional de Recursos Naturales (INRENA) (1995). Mapa Ecologico del Peru. Guia Explicativa. Lima, Perú: INRENA.
39
Junyan Z. Kewu C. Runguo Z. Yi D. (2014). Changes in floristic composition, community structure and species diversity across a tropical coniferous-broadleaved forest ecotone. Trop. Conserv. Sci.7, 126–144. doi: 10.1177/194008291400700104
40
Karami P. Bandak I. Karaji M. G. Dragovich D. (2021). Effects of seasonal grazing and annual mowing on floristic composition and plant diversity in the Saral rangeland, Kurdistan, Iran. Glob. Ecol. Conserv.27:e01515. doi: 10.1016/j.gecco.2021.e01515
41
Khadanga S. S. Dar A. A. Jaiswal N. Dash P. K. Jayakumar S. (2023). Elevation patterns of tree diversity, composition and stand structure in Mahendragiri Hill Forest, eastern Ghats of Odisha, India. J. Asia-Pac. Biodivers.16, 391–405. doi: 10.1016/j.japb.2023.04.004
42
Killeen T. J. Solorzano L. A. (2008). Conservation strategies to mitigate impacts from climate change in Amazonia. Philosophic. Trans.363, 1881–1888. doi: 10.1098/rstb.2007.0018,
43
Krömer T. Acebey A. Kluge J. Kessler M. (2013). Efectos de la altitud y el clima en la determinación de los patrones altitudinales de riqueza de especies vegetales: un estudio de caso en Los Tuxtlas, México. Flora208, 197–210. doi: 10.1016/j.flora.2013.03.003
44
Lê S. Josse J. Husson F. (2008). Factominer: an R package for multivariate analysis. J. Stat. Softw.25, 1–18. doi: 10.18637/jss.v025.i01
45
Li J. Luo Y. Song X. Jiang D. He Q. Bai A. et al . (2023). Effects of the dominate plant families on elevation gradient pattern of community structure in a subtropical forest. Forests14:1860. doi: 10.3390/f14091860
46
Linares-Palomino R. Huamantupa-Chuquimaco I. Padrón E. La Torre-Cuadros M. D. L. Á. Roncal-Rabanal M. Choquecota N. et al . (2022). Los bosques estacionalmente secos del Perú: un re-análisis de sus patrones de diversidad y relaciones florísticas. Rev. Peru. Biol.29:e21613. doi: 10.15381/rpb.v29i4.21613
47
Linares-Palomino R. Oliveira-Filho A. T. Pennington R. T. (2011). “Neotropical seasonally dry forests: diversity, endemism, and biogeography of Woody plants” in Seasonally dry tropical forests. eds. DirzoR.YoungH. S.MooneyH. A.CeballosG. (Washington, DC: Island Press).
48
Malhi Y. Gardner T. A. Goldsmith G. R. Silman M. R. Zelazowski P. (2014). Tropical forests in the Anthropocene. Annu. Rev. Environ. Resour.39, 125–159. doi: 10.1146/annurev-environ-030713-155141
49
Malhi Y. Silman M. Salinas N. Bush M. Meir P. Saatchi S. (2010). Introduction: elevation gradients in the tropics: laboratories for ecosystem ecology and global change research. Glob. Change Biol.16, 3171–3175. doi: 10.1111/j.1365-2486.2010.02323.x
50
Malizia A. Blundo C. Carilla J. Osinaga Acosta O. Cuesta F. Duque A. et al . (2020). Elevation and latitude drives structure and tree species composition in Andean forests: results from a large-scale plot network. PLoS One15:e0231553. doi: 10.1371/journal.pone.0231553,
51
Mapcarta (2025) “Cerro Chuchiría.” Accessed September 10, 2025. Available online at: https://mapcarta.com/es/25112624
52
Marcelo-Peña J. L. Huamantupa I. Särkinen T. Tomazello M. (2016). Identifying conservation priority areas in the Marañón valley (Peru) based on floristic inventories. Edinb. J. Bot.73, 95–123. doi: 10.1017/S0960428615000281
53
Marcelo-Peña J. L. López-Fernandez K. Linares-Palomino R. Dexter K. (2025). Dynamics of the seasonally dry tropical forests of the Marañón Valley, northern Peru. Trees Forests People21:100900. doi: 10.1016/j.tfp.2025.100900
54
Marrufo Huamán N. D. R. (2023) Composición y diversidad florística de una gradiente altitudinal del bosque seco del Marañón, Vijus y Chagual, Pataz-La Libertad [Tesis de pregrado, Universidad Nacional de Cajamarca] Repositorio Institucional de la Universidad Nacional de Cajamarca Available online at: https://repositorio.unc.edu.pe/handle/20.500.14074/5831 (Accessed January 08, 2026).
55
Mata-Guel E. O. Soh M. C. Butler C. W. Morris R. J. Razgour O. Peh K. S. H. et al . (2023). Impacts of anthropogenic climate change on tropical montane forests: an appraisal of the evidence. Biol. Rev.98, 1200–1224. doi: 10.1111/brv.12950,
56
Meza Mori G. Barboza Castillo E. Torres Guzman C. Cotrina Sanchez D. A. Guzman Valqui B. K. Oliva M. et al . (2020). Predictive modelling of current and future potential distribution of the spectacled bear (Tremarctos ornatus) in Amazonas, Northeast Peru. Animals10:1816. doi: 10.3390/ani10101816,
57
Meza-Mori G. Nematollahi S. Amasifuen Guerra C. A. Oliva-Cruz M. Coronel-Castro E. Torres Guzmán C. et al . (2025). Integrating MaxEnt and InVEST modeling methods to identify priority areas for the conservation of emblematic and endemic wildlife in the Peruvian tropical Andes. Glob. Ecol. Conserv.62:e03626. doi: 10.1016/j.gecco.2025.e03626
58
Miles L. Newton A. C. DeFries R. S. Ravilious C. May I. Blyth S. et al . (2006). A global overview of the conservation status of tropical dry forests. J. Biogeogr.33, 491–505. doi: 10.1111/j.1365-2699.2005.01424.x
59
Ministerio del Ambiente (MINAM) . (2019). Mapa Nacional de Ecosistemas. Lima, Perú: SINIA. Available online at: https://sinia.minam.gob.pe/mapas/mapa-nacional-ecosistemas-peru (Accessed October 25, 2025).
60
Ministerio del Ambiente (MINAM) (2021). Estudio para la Identificación de Áreas Degradadas y Propuesta de Monitoreo. Lima, Perú: MINAM.
61
Montenegro-Hoyos A. Vega N. Linares-Palomino R. (2022). Plant diversity and structure in desert communities of the Andean piedmont in Ica, Peru. Vegetation Classif. Survey3, 53–66. doi: 10.3897/VCS.68006
62
Murga-Orrillo H. Coronado Jorge M. F. Abanto-Rodríguez C. Almeida Lobo F. D. (2021). Gradiente altitudinal y su influencia en las características edafoclimáticas de los bosques tropicales. Madera Bosques27:e2732271. doi: 10.21829/myb.2021.2732271
63
Pan Y. Birdsey R. A. Fang J. Houghton R. Kauppi P. E. Kurz W. A. et al . (2011). A large and persistent carbon sink in the world’s forests. Science333, 988–993. doi: 10.1126/ciencia.1201609
64
Pennington R. T. Lavin M. Oliveira-Filho A. (2009). Woody plant diversity, evolution, and ecology in the tropics: perspectives from seasonally dry tropical forests. Annu. Rev. Ecol. Evol. Syst.40, 437–457. doi: 10.1146/annurev.ecolsys.110308.120327
65
Pennington R. T. Prado D. E. Pendry C. A. (2000). Neotropical seasonally dry forests and quaternary vegetation changes. J. Biogeogr.27, 261–273. doi: 10.1046/j.1365-2699.2000.00397.x
66
Penny A. M. Chao A. Davies A. L. Magurran A. E. (2025). Applying a unified framework to compare taxonomic, functional and phylogenetic diversity in Holocene pollen records. J. Ecol.113, 2314–2331. doi: 10.1111/1365-2745.70093
67
Poorter L. Bongers F. Aide T. M. Almeyda Zambrano A. M. Balvanera P. Becknell J. M. et al . (2016). Biomass resilience of Neotropical secondary forests. Nature530, 211–214. doi: 10.1038/nature16512,
68
Poorter L. van der Sande M. T. Thompson J. Arets E. J. Alarcón A. Álvarez-Sánchez J. et al . (2015). Diversity enhances carbon storage in tropical forests. Glob. Ecol. Biogeogr.24, 1314–1328. doi: 10.1111/geb.12364
69
Queinnec M. Coops N. C. White J. C. McCartney G. Sinclair I. (2022). Developing a forest inventory approach using airborne single photon lidar data: from ground plot selection to forest attribute prediction. Forestry95, 347–362. doi: 10.1093/forestry/cpab051
70
Ramírez Huila W. Ayoví Garces N. E. (2022). Estructura y composición arbórea del bosque seco tropical en el valle Sancán, Manabí, Ecuador. Rev. Cubana Cienc. For.10, 169–181.
71
Ramírez L. A. Llambí L. D. Azocar C. J. Fernandez M. Torres J. E. Bader M. Y. (2022). Patterns in climate and seedling establishment at a dry tropical treeline. Plant Ecol.223, 1047–1068. doi: 10.1007/s11258-022-01257-2
72
Reis G. H. Terra M. D. C. N. S. Tng D. Y. P. Apgaua D. M. G. Coelho P. A. dos Manoel Santos R. et al . (2017). Temporal vegetation changes in a seasonally dry tropical forest enclave in an ecotonal region between savanna and semiarid zones of Brazil. Aust. J. Bot.65, 85–93. doi: 10.1071/BT16188
73
Repetto M. F. Torchin M. E. Ruiz G. M. Schlöder C. Freestone A. L. (2024). Biogeographic and seasonal differences in consumer pressure underlie strong predation in the tropics. Proc. R. Soc. B291:20240868. doi: 10.1098/rspb.2024.0868,
74
Rodrigues Silva W. R. Angulo Villacorta C. D. Oliveira Perdiz R. Farias H. L. S. Sampaio Oliveira A. Camurça Citó A. et al . (2019). Floristic composition in ecotone forests in northern Brazilian Amazonia: preliminary data. Biodivers. Data J.7:e47025. doi: 10.3897/BDJ.7.e47025
75
Rodríguez Achung F. Limachi Huallpa L. Reátegui Reátegui F. Escobedo Torres R. Ramírez Barco J. Cajañaupa F. E. et al . (2010). Zonificación Ecológica y Económica del departamento de Amazonas. Iquitos, Perú: Instituto de Investigaciones de la Amazonía Peruana (IIAP).
76
Rodríguez M. J. Oyuela-Andino O. (2023). Composición, estructura y diversidad de la comunidad de plantas leñosas en fragmentos de bosque tropical estacionalmente seco en Choluteca, Honduras. Rev. For. Peru38, 240–260. doi: 10.21704/rfp.v38i2.2080
77
Roswell M. Dushoff J. Winfree R. (2021). A conceptual guide to measuring species diversity. Oikos130, 321–338. doi: 10.1111/oik.07202
78
Sánchez Zamora Y. Sopla Mas B. Coronel-Castro E. Rivera López R. Y. Silva E. A. A. Fernández Jeri A. B. et al . (2024). Tree species composition and structure of a vegetation plot in a montane forest in the department of Amazonas, Peru. Forests15:1175. doi: 10.3390/f15071175
79
Sánchez-Azofeifa A. Powers J. S. Fernandes G. W. Quesada M. (2014). Tropical dry forests in the Americas: Ecology, conservation, and management. Boca Raton: CRC Press Taylor & Francis Group.
80
Särkinen T. Pennington R. T. Lavin M. Simon M. F. Hughes C. E. (2012). Evolutionary islands in the Andes: persistence and isolation explain high endemism in Andean dry tropical forests. J. Biogeogr.39, 884–900. doi: 10.1111/j.1365-2699.2011.02644.x
81
Siyum Z. G. (2020). Tropical dry forest dynamics in the context of climate change: syntheses of drivers, gaps, and management perspectives. Ecol. Process.9, 1–16. doi: 10.1186/s13717-020-00229-6
82
Tarrillo Cieza M. L. (2024) Diversidad y composición florística en un área de bosque seco, Utcubamba, Amazonas, Perú. [Tesis de pregrado, Universidad Nacional Toribio Rodríguez de Mendoza de Amazonas]. Repositorio Institucional de la Universidad Nacional Toribio Rodríguez de Mendoza de Amazonas Available online at: https://repositorio.untrm.edu.pe/handle/20.500.14077/4017 (Accessed January 08, 2026).
83
Tejedor Garavito N. Álvarez Dávila E. Arango Caro S. Araujo Murakami A. Baldeón S. Beltrán H. et al . (2014). A regional red list of montane tree species of the tropical Andes: Trees at the top of the world. Botanic Richmond, UK: Gardens Conservation International, Richmond.
84
Toasa G. Morochz C. Oleas N. H. (2020). Dataset of permanent plots of trees with dbh> 10cm in Mashpi rainforest bio-diversity reserve, a remnant of the Chocó forest in northern Ecuador. Data Brief31:105845. doi: 10.1016/j.dib.2020.105845,
85
Veintimilla D. Ngo Bieng M. A. Delgado D. Vilchez-Mendoza S. Zamora N. Finegan B. (2019). Drivers of tropical rainforest composition and alpha diversity patterns over a 2,520 m altitudinal gradient. Ecol. Evol.9, 5720–5730. doi: 10.1002/ece3.5155,
86
Yeboah S. O. Nasare L. I. Abunyewa A. A. (2022). Effect of landuse on floristic composition and diversity of medicinal plants in the Guinea savanna zone of Ghana. Heliyon8:e10203. doi: 10.1016/j.heliyon.2022.e10203,
Summary
Keywords
altitudinal gradient, Chachapoyas, diversity indices, floristic diversity, montane forests, seasonally dry tropical forest
Citation
Coronel-Castro E, Pariente-Mondragón E, Rivera RY, Chacón J, Delgado A, Oliva-Cruz M and Huamán-Pilco AF (2026) Biodiversity and structural analysis of forests at the altitudinal boundary between dry and montane forests: response of tree diversity to altitudinal variation in the northeastern Peruvian Andes. Front. For. Glob. Change 9:1765957. doi: 10.3389/ffgc.2026.1765957
Received
11 December 2025
Revised
30 January 2026
Accepted
03 February 2026
Published
19 February 2026
Volume
9 - 2026
Edited by
Ezequiel Zamora-Ledezma, Technical University of Manabi, Ecuador
Reviewed by
Salas-Macías Carlos A., Technical University of Manabi, Ecuador
Lizardo Reyna, University of Agriculture in Krakow, Poland
Updates
Copyright
© 2026 Coronel-Castro, Pariente-Mondragón, Rivera, Chacón, Delgado, Oliva-Cruz and Huamán-Pilco.
This is an open-access article distributed under the terms of the Creative Commons Attribution License (CC BY). The use, distribution or reproduction in other forums is permitted, provided the original author(s) and the copyright owner(s) are credited and that the original publication in this journal is cited, in accordance with accepted academic practice. No use, distribution or reproduction is permitted which does not comply with these terms.
*Correspondence: Elver Coronel-Castro, elver.coronel@untrm.edu.pe; Manuel Oliva-Cruz, manuel.oliva@untrm.edu.pe
Disclaimer
All claims expressed in this article are solely those of the authors and do not necessarily represent those of their affiliated organizations, or those of the publisher, the editors and the reviewers. Any product that may be evaluated in this article or claim that may be made by its manufacturer is not guaranteed or endorsed by the publisher.