 Tarun Shankar Choudhary1,2*
 Mohan Kumar1
 Bireshwar Sinha3,4
 Saijuddin Shaikh3
 Sarmila Mazumder3Sunita Taneja3
 Nita Bhandari1
- 1Knowledge Integration and Transformation Platform at Centre for Health Research and Development, Society for Applied Studies, New Delhi, India
- 2Department of Global Public Health and Primary Care, University of Bergen, Bergen, Norway
- 3Centre for Health Research and Development, Society for Applied Studies, New Delhi, India
- 4DBT/Wellcome India Alliance Clinical and Public Health Fellow, Hyderabad, India
Background: Low birthweight (LBW) babies (<2.5 kg) are at higher risk of mortality and weight for height z score is currently recommended for identifying infants at risk of mortality.
Objective: To compare different anthropometric measures at 28-day of age in a cohort of LBW Indian infants for predicting mortality between 28-day and 180-day of age.
Methods: We used data from an individually randomized controlled trial of LBW infants weighing between 1,500 and 2,250 g. Sensitivity, specificity, positive, and negative likelihood ratios, positive and negative predictive values, and area under receiver operating characteristics curves (AUC) were used to estimate the discrimination of mortality risk. The Cox regression was used to estimate hazard ratios and population attributable fraction for each anthropometric indicator. These estimates were calculated for individual as well as combinations of anthropometric indicators at the cut-off of –2 and –3 SD of the WHO 2006 growth standards.
Results: Severe underweight (weight-for-age z-scores [WAZ] < –3) had a sensitivity of 75.0%, specificity of 68.0% with an AUC of 0.72. The risk of death was higher (HR 6.18; 95% CI 4.29–8.90) with a population attributable fraction of 0.63 (95% CI 0.52–0.72) for infants severely underweight at 28-day of age. Combination of different anthropometric measures did not perform better than individual measures.
Conclusion: Severe underweight (WAZ < –3) better discriminated deaths among LBW infants < 6 months of age. It can be considered for diagnosis of nutritionally at-risk infants in this age group.
Clinical Trial Registration: [ClinicalTrials.gov], identifier [NCT02653534].
Introduction
Low birthweight (LBW, birthweight < 2,500 g) is a global public health problem and these infants are at a high risk of mortality (1). Global estimates suggest that in 2015, 20.5 million infants or 14.6% of all live births were born LBW, of which 7.8 million (39%) were in India (2). More than four-fifth of all neonatal deaths in India are among LBW neonates (3–6). Studies have shown that the adjusted risk of neonatal and post-neonatal (28–364 days) mortality in LBW infants is 25, and 7 times higher, respectively, compared to infants with birthweight ≥ 2,500 g (7–9). Therefore, identification of predictors of mortality among LBW infants is critical for timely management.
Infant anthropometric indicators including weight and length are frequently measured as a part of routine postnatal care and to assess nutritional status in public health programs. Studies have shown association between anthropometric indicators and infant mortality (10). Parameters like weight-for-age z-scores (WAZ), weight-for-length z-scores (WLZ), length-for-age z-scores (LAZ), and mid-upper-arm circumference (MUAC) have been used as indicators to identify children with high risk of mortality (11–15). The World Health Organization (WHO) recommends a WLZ < –3 SD for all under-five children (including 0–5 months) and a cut-off of MUAC < 115 mm for children aged 6–59 months to identify severe acute malnutrition, given the high risk of mortality in these children (16–18). Nonetheless, WLZ cannot be calculated using the WHO 2006 growth standards for infants shorter than 45 cm and there are concerns about accuracy of length measurement especially in early infancy (15, 19, 20). Recent evidence suggests that WAZ is better at identifying infants at high risk of death or morbidities compared to WLZ, which had poor reliability and poor prognostic ability (10, 21). Currently, there is no clear consensus on which anthropometric indicator can best predict mortality in the first 6 months of life. Moreover, data specific to the group of LBW children are limited. The aim of our study was to compare WLZ, LAZ, and WAZ measured at 1 month of age, individually and in different combinations, as predictors for the risk of death between 1 and 6 months of age in a cohort of LBW Indian infants.
Subjects and Methods
Study Description
We present findings from secondary analysis of an individually randomized controlled trial conducted to assess the impact of supporting mothers in providing kangaroo mother care in community settings on mortality in neonatal period and early infancy (22). The trial was conducted in Faridabad and Palwal districts of Haryana, India between July 2015 to October 2018. Detailed study methodology has been published earlier (22, 23). We enrolled infants within 72 h of birth if they weighed between 1,500 and 2,250 g. We excluded infants who were unable to feed, had difficulty in breathing, had less than normal movements, had gross congenital malformations, kangaroo mother care was initiated in hospital, or whose caregivers intended to move away over the next 6 months or refused participation. Written informed consent was obtained from the infant’s parents at enrolment. The primary trial was approved by the ethics committee of Society for Applied Studies in India, the Regional Committee for Medical and Health Research Ethics in Norway, and World Health Organization, Geneva. The trial is registered at ClinicalTrials.gov (NCT02653534).
Anthropometric Measurements
Trained interviewers collected household socioeconomic and demographic information at enrollment. Anthropometry was assessed at enrollment, 28-day, 90-day, and 180-day visits by an independent team. Weight to the nearest 10 g was measured using a digital hanging weighing scale (AWS-SR-20; American Weigh Scale, Cumming, GA, United States), calibrated every morning using standard weights. Recumbent length was measured to the nearest 0.1 cm using an Infantometer (model 417; seca GmbH & Co KG). Outcome assessment teams were trained and standardized before study initiation as per WHO guidelines (24, 25). Retraining exercises were conducted every 6 months (26, 27). A team of two workers took two measurements for length and weight and the mean value was used for all analyses.
Inclusion and Exclusion Criteria
We included infants for whom both, anthropometric assessment at 28-day visit and survival status at 6 months were available. We excluded infants with WAZ < –5 and > + 5, LAZ < –6 and > + 6, and WLZ z scores < –6 and > + 5 were excluded from the analysis (25).
Statistical Analysis
Categorical and continuous variables were presented as n (%) and mean ± SD, respectively. WLZ, LAZ, and WLZ scores were calculated based on the WHO 2006 growth standards using “zscore06” (28). Underweight, stunted, and wasted were defined as WAZ < –2, LAZ < –2, and WLZ < –2 and severe underweight, severe stunted, and severe wasted were identified as WAZ < –3, LAZ < –3 and WLZ < –3, respectively (20). We also generated combinations for these, i.e., concurrent wasting and stunting, concurrent wasting and underweight, concurrent stunting and underweight, concurrent severe wasting and severe stunting, concurrent severe wasting and severe underweight, and concurrent severe stunting and severe underweight. We estimated sensitivity, specificity, positive, and negative likelihood ratios, positive and negative predictive values, and area under receiver operating characteristics curves (AUC) for different anthropometric indicators at 28-day for estimating the ability to predict death between 28-day and 180-day of life. We used “roccomp” to compare AUC for different anthropometric indicators. We also calculated the hazard ratio (HR) [95% confidence intervals (CI)], Population Attributable Fractions (95% CI) and estimated the model fit using Harrell’s C concordance for death between 28-day and 180-day for stunting, wasting, underweight, severe stunting, severe wasting, severe underweight, concurrent wasting and stunting, concurrent wasting and underweight, concurrent stunting and underweight, concurrent severe wasting and severe stunting, concurrent severe wasting and severe underweight, and concurrent severe stunting and severe underweight. All analyses were conducted at the cut-off of -2 SD and -3 SD. The analyses were adjusted for the intervention and cluster robust standard errors were used to account for clustering of deaths in households with multiple births and for infants enrolled from the same household. A p-value < 0.05 was considered statistically significant. All analyses were conducted in Stata 17 (29).
Results
The primary trial included 8,402 LBW infants. The valid anthropometry data at 28-day and vital status at 180-day were available for 6,797 (82.7%), 6,637 (80.7%), and 6,815 (82.9%) infants for HAZ, WLZ, and WAZ, respectively, as shown in Figure 1.
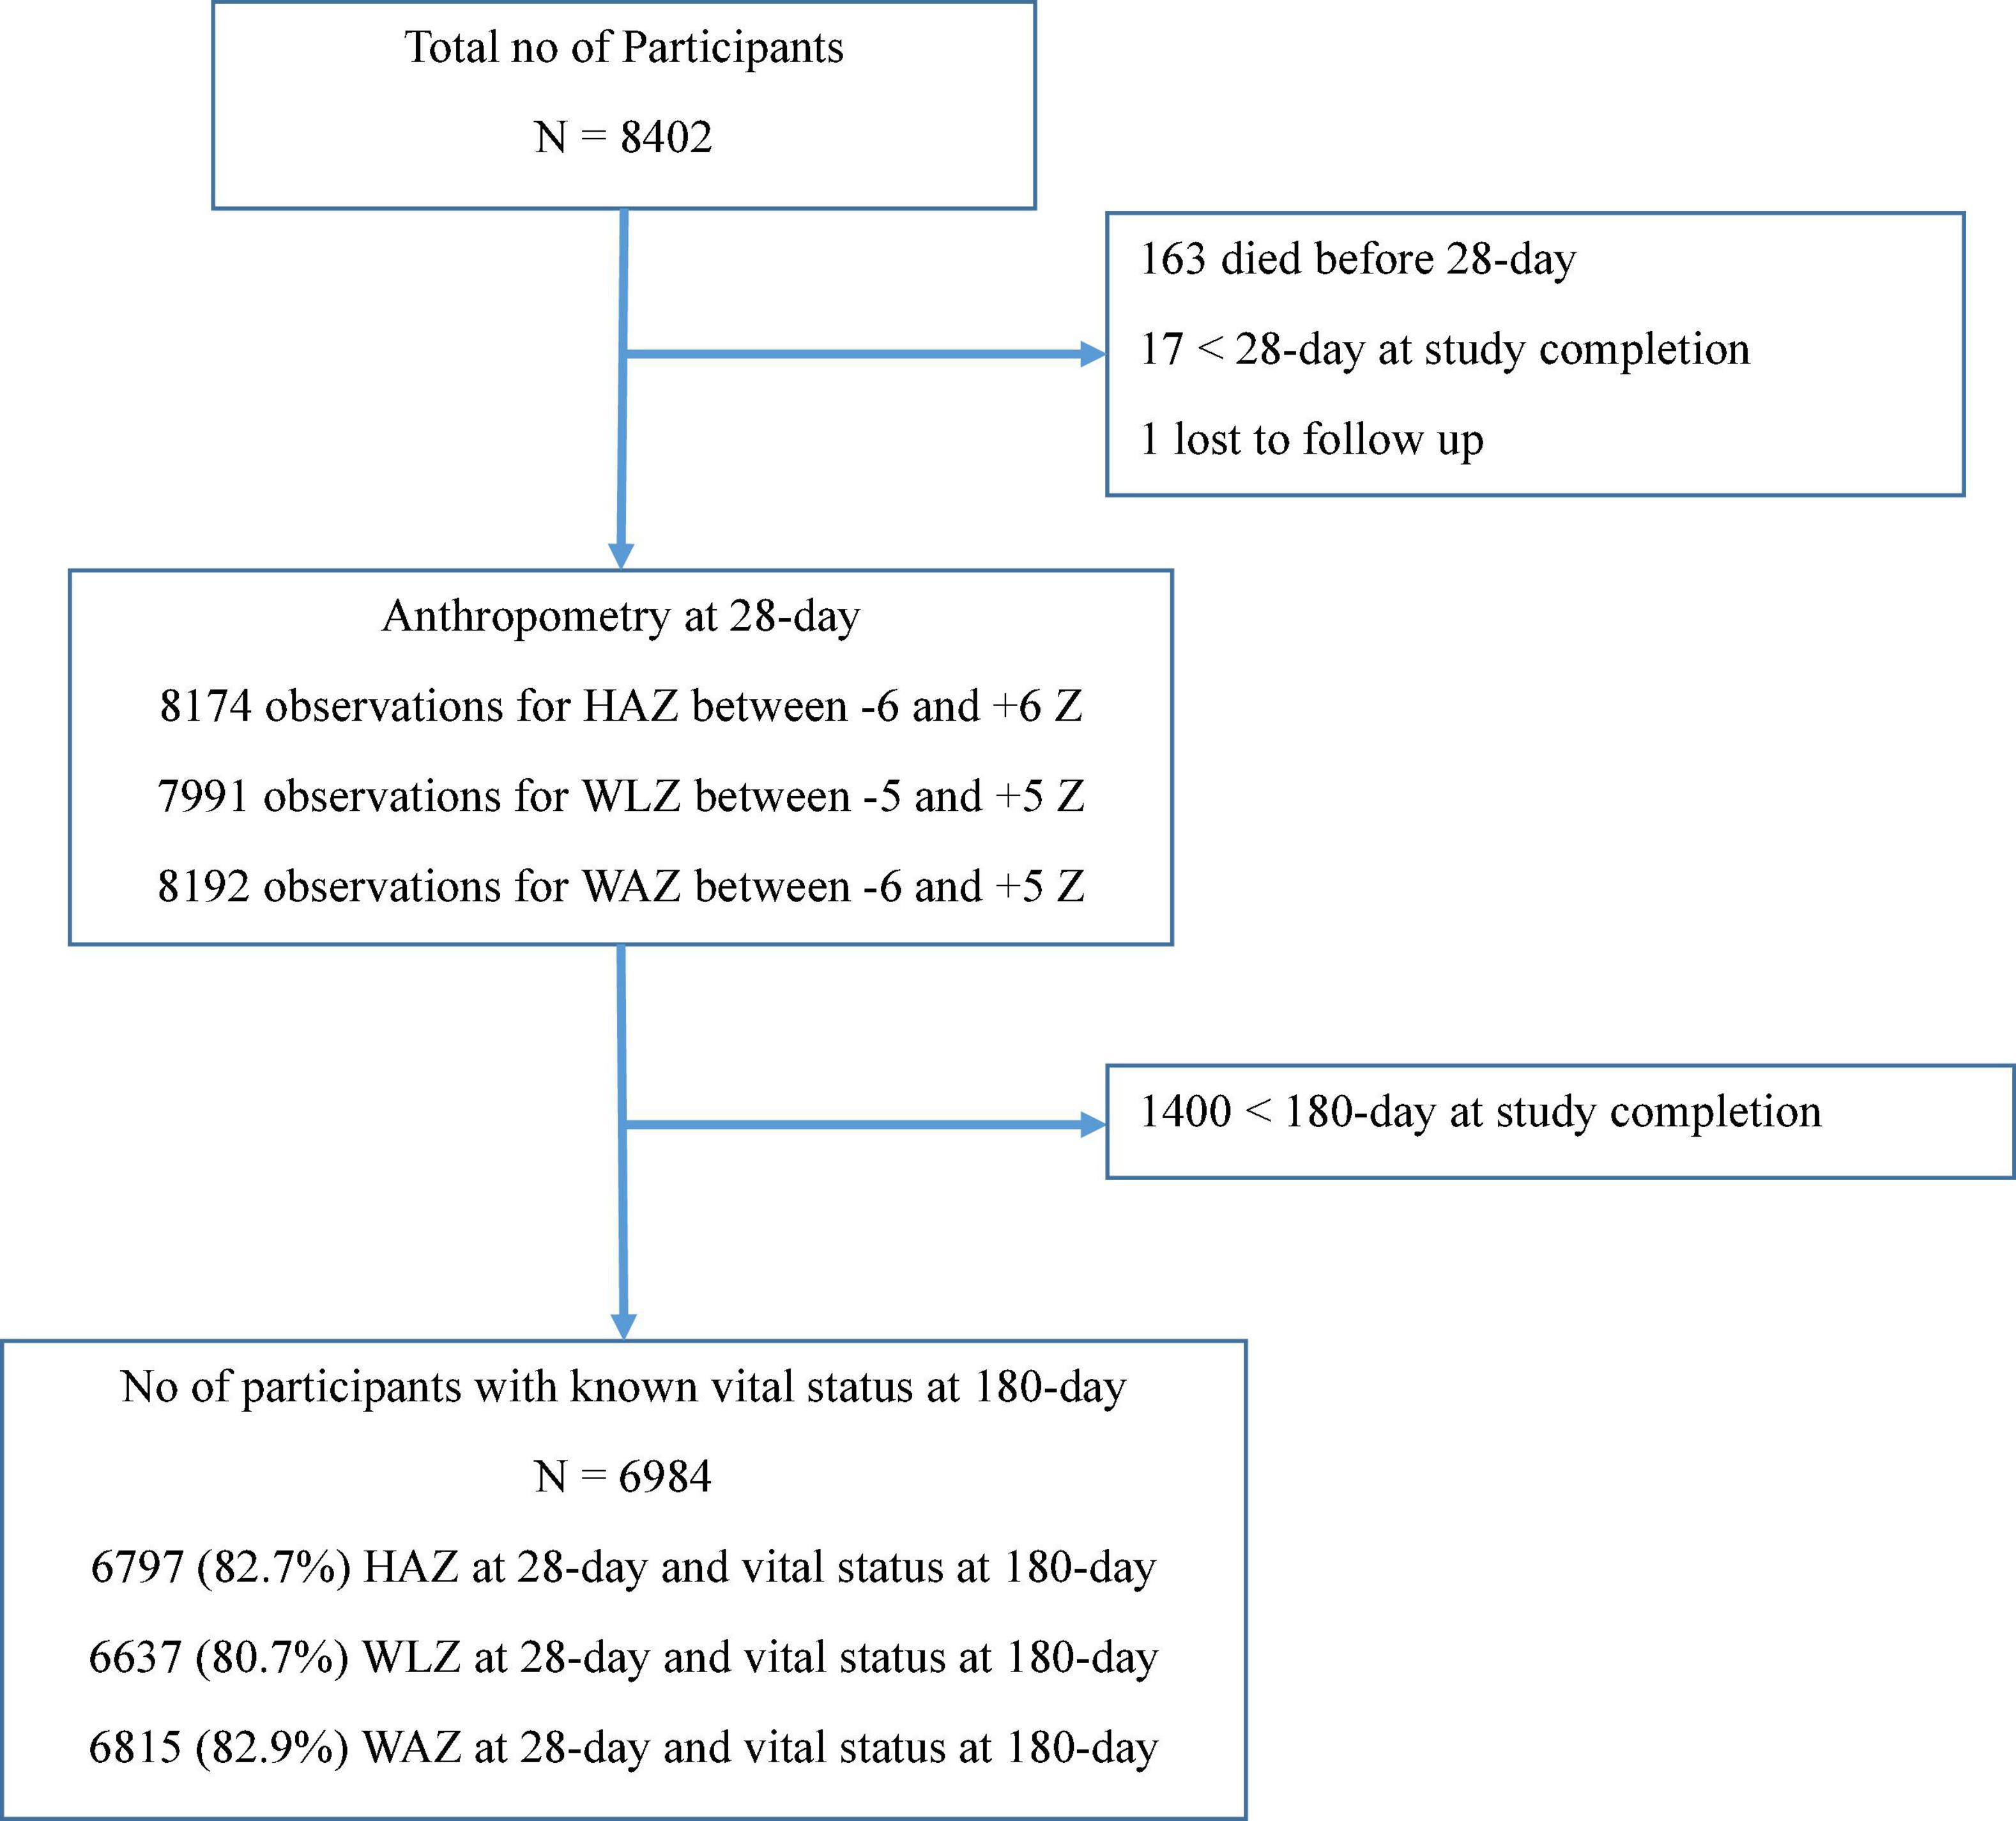
Figure 1. Flowchart showing the number of infants included in the analysis.
Mean birthweight (SD) of the infants was 2,069 (168) g. The Mean (SD) weight and length at 28-day of age was 2.9 kg (0.4) and 49.2 cm (1.9), respectively. Mean (SD) of the WLZ, LAZ, and WAZ score was –1.03 (1.06), –2.49 (0.97), and –2.71 (0.92), respectively. Underweight (76.6%) was the most common anthropometric deficit followed by stunting (67.1%) and severe underweight (32.9%) as shown in Table 1.
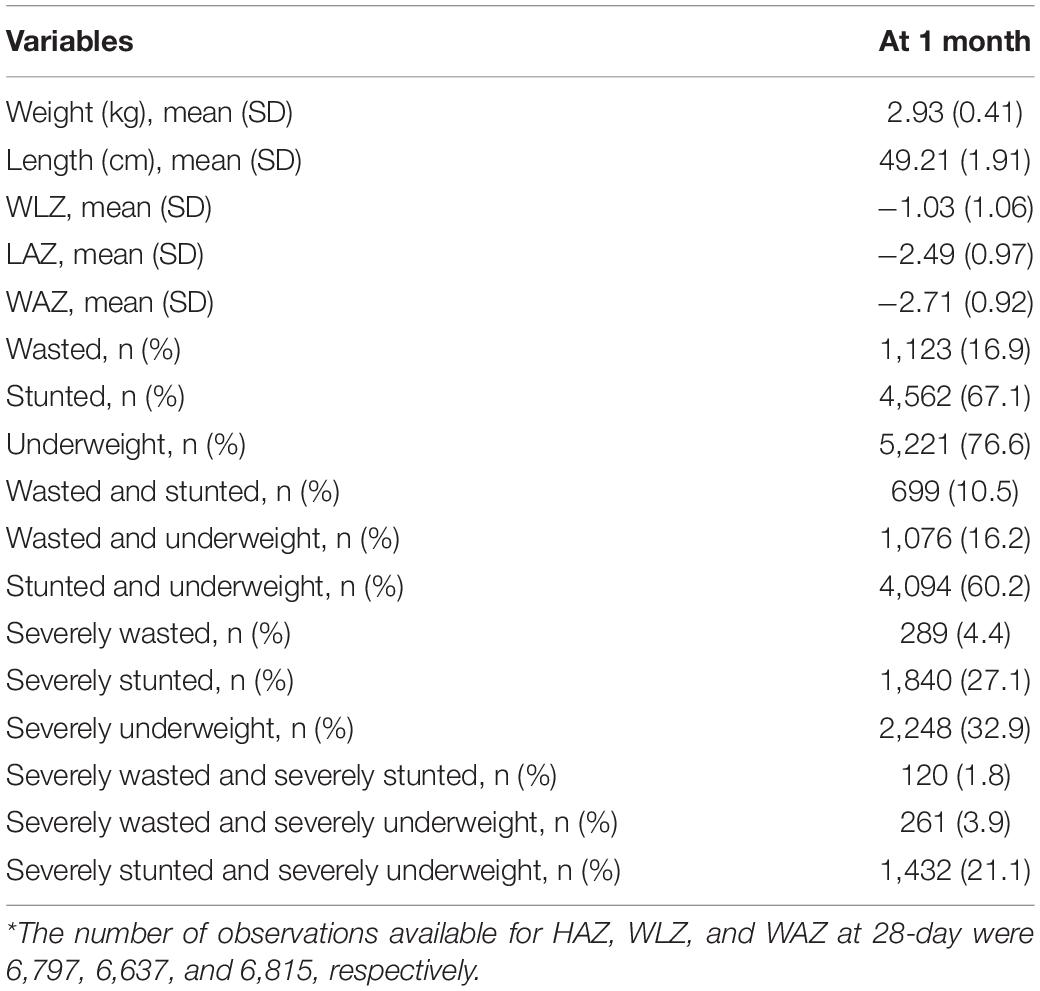
Table 1. Anthropometric status at 28-day of age*.
Sensitivity, specificity, positive, and negative likelihood ratio, positive, and negative predictive values, AUC for different anthropometric indicators are presented in Table 2. Sensitivity was highest for WAZ < –2 (94.2%), followed by LAZ < –2 (90.7%) and WAZ < –3 (75.0%). Specificity was highest for WLZ < –2 (83.6%), followed by LAZ < –3 (73.6%) and WAZ < –3 (68.0%). Overall, among individual measures AUC was maximum for WAZ < –3 (0.72). Among composite measures, AUC was similar for all combinations at the cut-off of -2 (0.66). Concurrent severe underweight and severe stunting had the highest AUC at the cut-off of –3 (0.67).
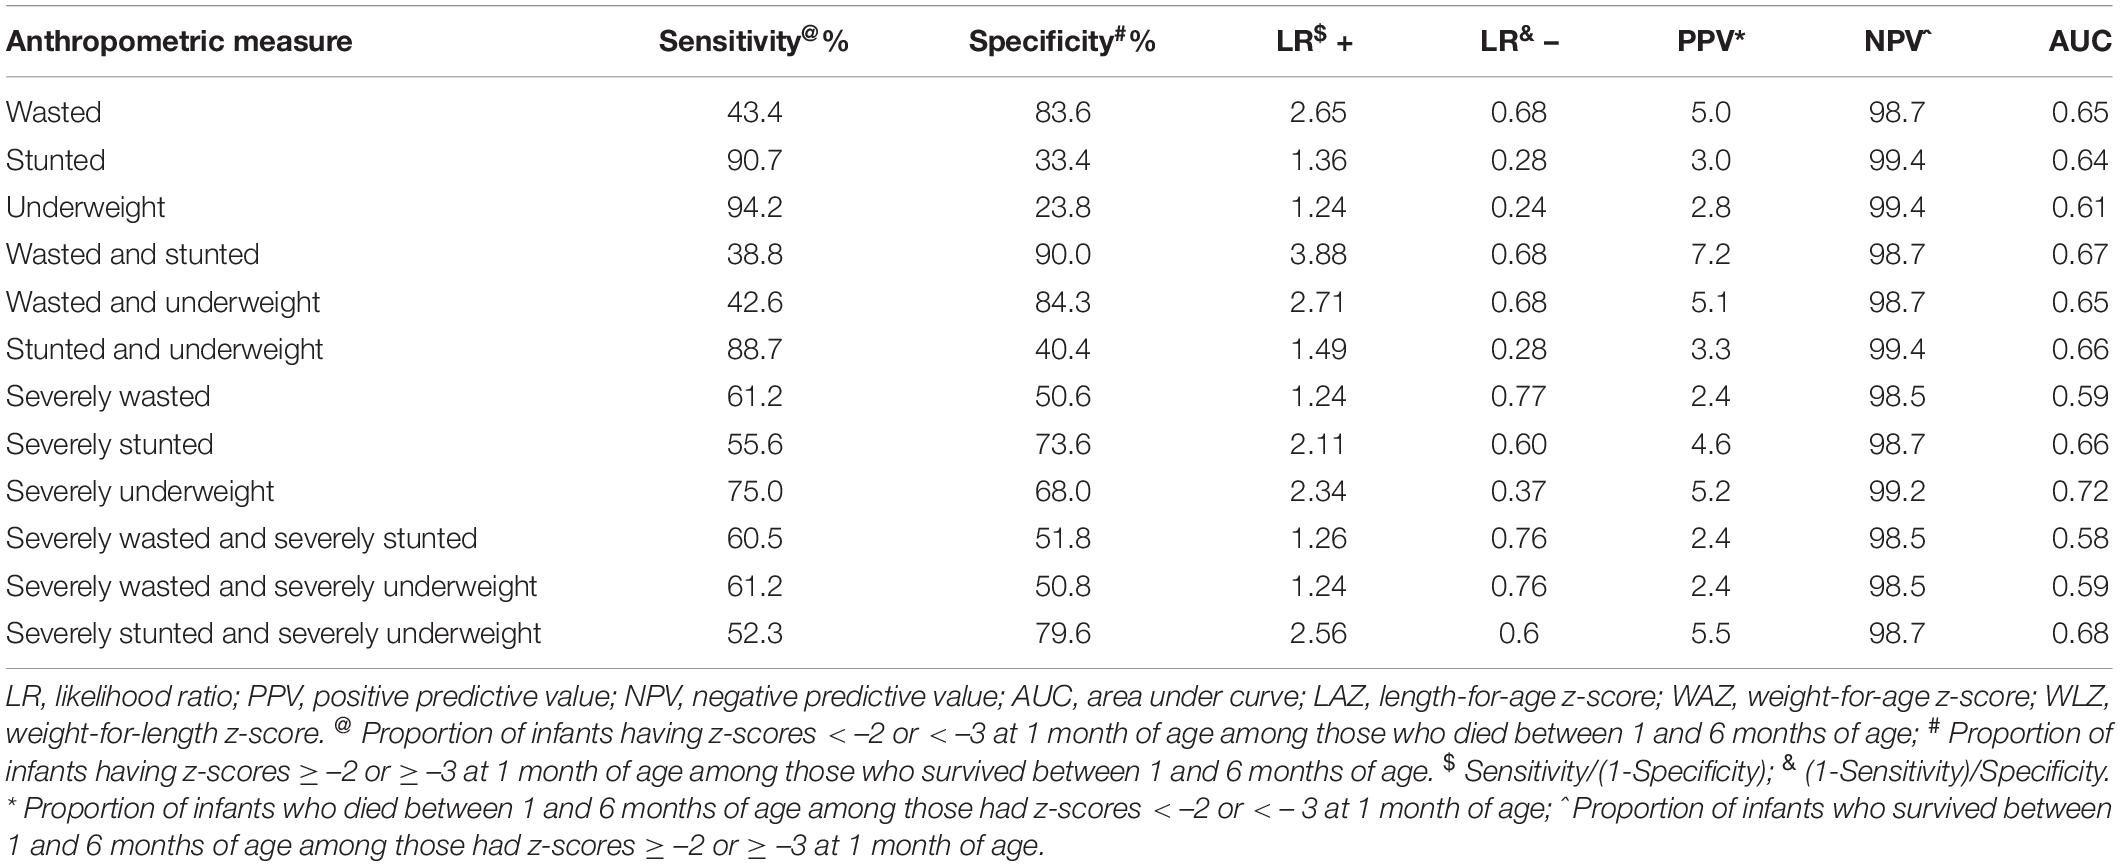
Table 2. Sensitivity, specificity, positive and negative likelihood ratios, positive, and negative predictive values for cut-off point of anthropometry at 1 month of age and mortality between 1 and 6 months of age.
Stunting (4.81, 95% CI 2.77–8.36), wasting (3.78, 95% CI 2.65–5.38), and underweight (4.97, 95% CI 2.53–9.77) at 28-day were associated with higher risk of deaths between 28-day and 180-day of life compared to infants who were not stunted, wasted, and underweight, respectively. The risk of mortality was highest for concurrent severe wasting and severe stunting (6.90, 95% CI 3.94–12.08) although the PAF (0.10) was low. We found that severe underweight infants had higher risk (6.18, 95% CI 4.29–8.90) of mortality, the PAF was 0.63, and had the highest Harrell’s C concordance of 0.72 (Table 3).
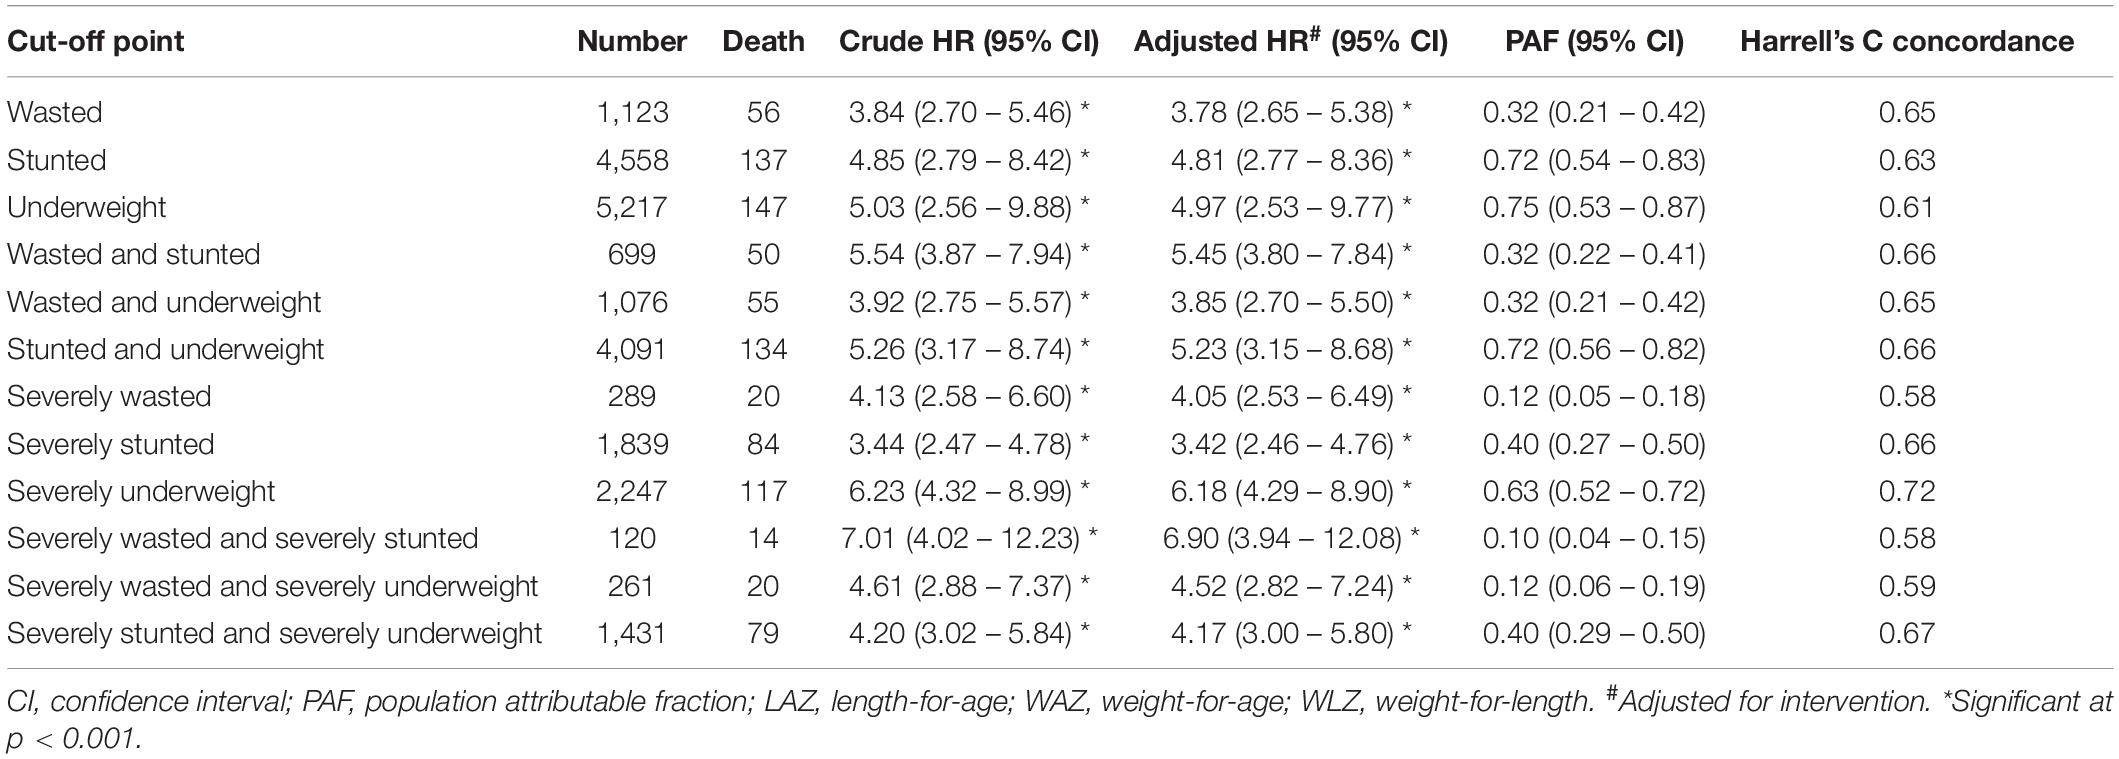
Table 3. Month 1 anthropometry and child mortality (n = 170) from 1 to 6 months of age.
Discussion
Using data from a large individually controlled trial, we found that WAZ < –3 SD (severe underweight) measured at 28-day is the best predictor of mortality between 28-day and 180-day of life among LBW Indian children. Combination of different anthropometric measures did not perform better than individual measures. The hazard of death between 28-day and 180-day of life was higher among malnourished children for all anthropometric indicators.
Although evidence specific to LBW infants in the first 6 months of life is scarce, secondary analysis of data from India has also shown that WAZ < –3 SD was a better predictor of mortality during infancy (30). Information on birthweight was not available in this study (31). A recent systematic review of studies done, mostly from sub-Saharan Africa concluded that WAZ was better at identifying infants at risk of mortality/morbidity in the first 6 months of life (21).
The previous studies have shown that length measurement in field settings, especially during the first year of life is error prone (19). Additionally, WLZ cannot be assessed for all LBW infants as the same is defined only for ≥ 45 cm (25). Although LBW is a known risk factor for morbidity and mortality, our findings support identification of malnutrition in these infants to differentiate infants born LBW and growing normally requiring no intervention, from those malnourished and at higher risk of death requiring timely intervention. Supporting severely underweight LBW infants can potentially reduce mortality in this group by 63% (95% CI 52–72%). Although the risk of mortality was highest for concurrent severe wasting and severe stunting similar to previous studies, the population attributable fraction was low (16, 32, 33).
Weight estimation is easier, less error prone in field setting and is already integrated in the current national nutritional program in India (ICDS) for monitoring growth (34). The Home-Based Care for Young Children (HBYC) program currently includes additional visits for LBW infants. Using weight to track growth and nutritional status and identifying vulnerable infants will help streamline the ICDS and HBYC program (35). The potential challenge of having different anthropometric screening criteria for < 6 and 6–59 months can be overcome by rigorous training of frontline health workers in the assessment of both weight and length (30). Stunting, wasting, and underweight capture different aspects of growth in the same child. All three measures should be used concurrently, and not in isolation, to ensure survival and thrive of under five children. Since WAZ will identify a higher number of children as malnourished simultaneous strengthening of the health system in terms of inpatient and outpatient services for infants identified as SAM is necessitated (30).
To our knowledge, this is the first description of mortality in relation to anthropometric indicators exclusively among LBW infants. We used data from a large randomized controlled trial with minimal loss to follow up (31). Weight and length assessment was done by a standardized team and individual as well as combinations of anthropometric measures were used. Children with gross congenital malformations were excluded from the study and hence most of extreme wasting or underweight would be nutritional in origin. Our findings should be interpreted knowing that we used anthropometric indicators assessed at 28-day and hence we cannot comment on prediction of mortality in the neonatal period. Our sample did not include all LBW infants. The study setting had high burden of LBW and findings might differ in setting with lower prevalence. We could not analyze the predictive ability for specific causes of death as the same was not available in the data and the primary trial was powered to assess all-cause mortality.
Conclusion
Severe underweight (WAZ < –3) better discriminated deaths among LBW infants < 6 months of age. It can be considered for diagnosis of nutritionally at-risk infants in this age group.
Data Availability Statement
The dataset pertaining to the results reported in the manuscript will be made available to others only for health and medical research, subject to constraints of the consent under which the data was collected. De-identified individual participant data will be made available. Data will be available beginning 6 months and ending 5 years after publication of this article. Requests for data should be made to TC, dGFydW4uY2hvdWRoYXJ5QHVpYi5ubw==. A data sharing agreement that meets the data sharing requirements of the Society for Applied Studies (New Delhi, India) and Centre for International Health, University of Bergen (Norway) will be signed with the data requester.
Ethics Statement
The study involved human participants. Written informed consent was obtained from the infant’s parents at enrollment. The primary trial was approved by the Ethics Committee of Society for Applied Studies in India, the Regional Committee for Medical and Health Research Ethics in Norway, and World Health Organization, Geneva.
Author Contributions
TC: conceptualization, data acquisition, data analysis and interpretation, writing the first draft, manuscript editing, and finalization. BS, SS, and MK: data analysis and interpretation, manuscript editing, and finalization. SM, ST, and NB: interpretation of findings, critical revisions of the manuscript, and finalization. All authors read and approved the final manuscript.
Conflict of Interest
The authors declare that the research was conducted in the absence of any commercial or financial relationships that could be construed as a potential conflict of interest.
Publisher’s Note
All claims expressed in this article are solely those of the authors and do not necessarily represent those of their affiliated organizations, or those of the publisher, the editors and the reviewers. Any product that may be evaluated in this article, or claim that may be made by its manufacturer, is not guaranteed or endorsed by the publisher.
Acknowledgments
We sincerely thank Halvor Sommerfelt, Director, Centre for Intervention Science in Maternal and Child Health and Professor, Department of Global Public Health and Primary Care, University of Bergen, Norway; Jose Martines, Scientific Coordinator, Centre for Intervention Science in Maternal and Child Health, Bergen, Norway; and Rajiv Bahl, Department of Maternal, Newborn, Child and Adolescent Health, World Health Organization, Geneva, Switzerland for their support and guidance. We acknowledge the contribution and support of the mothers and families of participating babies and infants and others in the community who supported the primary study. The Society for Applied Studies acknowledges the core support provided by the Department of Maternal, Newborn, Child and Adolescent Health, World Health Organization, Geneva (WHO Collaborating Centre IND-158); the Centre for Intervention Science in Maternal and Child Health (RCN Project No. 223269), Centre for International Health, University of Bergen (Norway); and Knowledge Integration and Translational Platform (KnIT), a Grand Challenges Initiative of the Biotechnology Industry Research Assistance Council (BIRAC), Department of Biotechnology, Government of India and Bill & Melinda Gates Foundation (United States). The primary study was supported by the Research Council of Norway through its Centers of Excellence Scheme (223269) and by the University of Bergen through funding to the Centre for Intervention Science in Maternal and Child Health.
Abbreviations
LBW, low birthweight; KMC, kangaroo mother care; WLZ, weight-for-length z-score; LAZ, length-for-age z-score; WAZ, weight-for-age z-score; AUC, area under receiver operating characteristics curves; MUAC, mid-upper-arm circumference; LMIC, lower- and middle-income countries; SD, standard deviation.
References
1. Blencowe H, Cousens S, Jassir FB, Say L, Chou D, Mathers C, et al. National, regional, and worldwide estimates of stillbirth rates in 2015, with trends from 2000: a systematic analysis. Lancet Global Health. (2016) 4:e98–108. doi: 10.1016/S2214-109X(15)00275-2
2. Blencowe H, Krasevec J, de Onis M, Black RE, An X, Stevens GA, et al. National, regional, and worldwide estimates of low birthweight in 2015, with trends from 2000: a systematic analysis. Lancet Global Health. (2019) 7:e849–60. doi: 10.1016/S2214-109X(18)30565-5
3. Lawn JE, Blencowe H, Oza S, You D, Lee AC, Waiswa P, et al. Every Newborn: progress, priorities, and potential beyond survival. Lancet. (2014) 384:189–205.
4. Katz J, Lee AC, Kozuki N, Lawn JE, Cousens S, Blencowe H, et al. Mortality risk in preterm and small-for-gestational-age infants in low-income and middle-income countries: a pooled country analysis. Lancet. (2013) 382:417–25.
5. Lee ACC, Katz J, Blencowe H, Cousens S, Kozuki N, Vogel JP, et al. National and regional estimates of term and preterm babies born small for gestational age in 138 low-income and middle-income countries in 2010. Lancet Global Health. (2013) 1:e26–36. doi: 10.1016/S2214-109X(13)70006-8
6. Blencowe H, Cousens S, Oestergaard MZ, Chou D, Moller AB, Narwal R, et al. National, regional, and worldwide estimates of preterm birth rates in the year 2010 with time trends since 1990 for selected countries: a systematic analysis and implications. Lancet. (2012) 379:2162–72. doi: 10.1016/S0140-6736(12)60820-4
7. Paixao ES, Blencowe H, Falcao IR, Ohuma EO, Rocha AdS, Alves FJO, et al. Risk of mortality for small newborns in Brazil, 2011-2018: a national birth cohort study of 17.6 million records from routine register-based linked data. Lancet Reg Health Am. (2021) 3:100045. doi: 10.1016/j.lana.2021.100045
8. Watkins WJ, Kotecha SJ, Kotecha S. All-Cause mortality of low birthweight infants in infancy, childhood, and adolescence: population study of england and wales. PLoS Med. (2016) 13:e1002018. doi: 10.1371/journal.pmed.1002018
9. Upadhyay RP, Martines JC, Taneja S, Mazumder S, Bahl R, Bhandari N, et al. Risk of postneonatal mortality, hospitalisation and suboptimal breast feeding practices in low birthweight infants from rural Haryana, India: findings from a secondary data analysis. BMJ Open. (2018) 8:e020384.
10. Mwangome M, Ngari M, Bwahere P, Kabore P, McGrath M, Kerac M, et al. Anthropometry at birth and at age of routine vaccination to predict mortality in the first year of life: a birth cohort study in BukinaFaso. PLoS One. (2019) 14:e0213523. doi: 10.1371/journal.pone.0213523
11. Samal GCSA. Calf circumference as an alternative to birth weight to predict low birth weight babies. Indian Pediatr. (2001) 38:275–7.
12. Thi HN, Khanh DK, Thu Hle T, Thomas EG, Lee KJ, Russell FM. Foot length, chest circumference, and mid upper arm circumference are good predictors of low birth weight and prematurity in ethnic minority newborns in vietnam: a hospital-based observational study. PLoS One. (2015) 10:e0142420. doi: 10.1371/journal.pone.0142420
13. Dhar B, Mowlah G, Kabir DM. Newborn anthropometry and its relationship with maternal factors. Bangladesh Med Res Counc Bull. (2003) 29:48–58.
14. Chen LC, Chowdhury A, Huffman SL. Anthropometric assessment of energy-protein malnutrition and subsequent risk of mortality among preschool aged children. Am J Clin Nutr. (1980) 33:1836–45. doi: 10.1093/ajcn/33.8.1836
15. Mwangome MK, Berkley JA. The reliability of weigh” for length/height Z scores in children. Matern Child Nutr. (2014) 10:474–80. doi: 10.1111/mcn.12124
16. WHO. Guideline: Updates on the Management of Severe Acute Malnutrition in Infants and Children. Geneva: World Health Organization (2013).
17. Ministry of Health and Family Welfare, Government of India. Operational Guidelines on Facility Based Management of Children with Severe Acute Malnutrition. (2011). Available online at: http://rajswasthya.nic.in/MTC%20Guideline-%20MOHFW.pdf (accessed March 21, 2022).
18. WHO. Management of Infants Under 6 Months of age with Severe Acute Malnutrition. Geneva: World Health Organization (2019).
19. Mwangome MK, Fegan G, Mbunya R, Prentice AM, Berkley JA. Reliability and accuracy of anthropometry performed by community health workers among infants under 6 months in rural Kenya. Trop Med Int Health. (2012) 17:622–9. doi: 10.1111/j.1365-3156.2012.02959.x
20. Department of Nutrition for Health and Development, WHO. WHO Child Growth Standards. Geneva: World Health Organization (2006).
21. Hoehn C, Lelijveld N, Mwangome M, Berkley JA, McGrath M, Kerac M. Anthropometric criteria for identifying infants under 6 months of age at risk of morbidity and mortality: a systematic review. Clin Med Insights Pediatr. (2021) 15:11795565211049904. doi: 10.1177/11795565211049904
22. Mazumder S, Taneja S, Dube B, Bhatia K, Ghosh R, Shekhar M, et al. Effect of community-initiated kangaroo mother care on survival of infants with low birthweight: a randomised controlled trial. Lancet. (2019) 394: 1724–36.
23. Mazumder S, Taneja S, Dalpath SK, Gupta R, Dube B, Sinha B, et al. Impact of community-initiated Kangaroo mother care on survival of low birth weight infants: study protocol for a randomized controlled trial. Trials. (2017) 18:262. doi: 10.1186/s13063-017-1991-7
24. de Onis M, Garza C, Victora CG, Onyango AW, Frongillo EA, Martines J. The WHO multicentre growth reference study: planning, study design, and methodology. Food Nutr Bull. (2004) 25(Suppl. 1):S15–26. doi: 10.1177/15648265040251S103
25. WHO. Recommendations for Data Collection, Analysis and Reporting on Anthropometric Indicators in Children under 5 Years Old. Geneva: World Health Organization (2019).
26. Jelliffe DB, World Health O. The Assessment of the Nutritional Status of the Community (with Special Reference to Field Surveys in Developing Regions of the World/Derrick B. Jelliffe; Prepared in Consultation with Twenty-five Specialists in Various Countries. Geneva: World Health Organization (1966).
27. WHO. Multicentre growth reference study group. reliability of anthropometric measurements in the who multicentre growth reference study. Acta Paediatr Suppl. (2006) 450:38–46.
28. Leroy J. ZSCORE06: Stata Module to Calculate Anthropometric z-Scores Using the 2006 WHO Child Growth Standards. Statistical Software Components S457279. Boston, MA: College Department of Economics (2011).
29. StataCorp. Stata Statistical Software: Release 17. College Station. College Station, TX: StataCorp LLC (2021).
30. Chowdhury R, Nitika, Choudhary TS, Taneja S, Martines J, Bhandari N, et al. Diagnostic measures for severe acute malnutrition in Indian infants under 6 months of age: a secondary data analysis. BMC Pediatr. (2021) 21:158. doi: 10.1186/s12887-021-02629-9
31. Martines J, Arthur P, Bahl R, Bhan MK, Kirkwood BR, Moulton LH, et al. Randomised trial to assess benefits and safety of vitamin A supplementationlinked to immunisation in early infancy. Lancet (1998) 352:1257–63.
32. WHO. Child Growth Standards and the Identification of Severe AcuteMalnutrition in Infants and Children : Joint Statement by the World HealthOrganization and the United Nations Children’s Fund. Geneva: World HealthOrganization (2009).
33. Myatt M, Khara T, Schoenbuchner S, Pietzsch S, Dolan C, Lelijveld N, et al. Children who are both wasted and stunted are also underweight and have a high risk of death: a descriptive epidemiology of multiple anthropometric deficits using data from 51 countries. Arch Public Health. (2018) 76:28. doi: 10.1186/s13690-018-0277-1
34. Ministry of Women and Child Development. Integrated Child Development Services 2022. Available online at: http://icds-wcd.nic.in/icds.aspx (accessed March 21, 2022).
35. Home Based Care for Young Child (Hbyc). Strengthening of Health & Nutrition Through Home Visits - Operational Guidelines April. (2018). Available online at: https://www.aspirationaldistricts.in/wp-content/uploads/2019/02/Home-Based-Care-for-Young-Child-Guidelines.pdf (accessed March 21, 2022).
Keywords: anthropometry, low birthweight (LBW), mortality, India, infant
Citation: Choudhary TS, Kumar M, Sinha B, Shaikh S, Mazumder S, Taneja S and Bhandari N (2022) Anthropometric Indicators as Predictors of Mortality in Early Life Among Low Birthweight Indian Infants. Front. Nutr. 9:884207. doi: 10.3389/fnut.2022.884207
Received: 25 February 2022; Accepted: 10 June 2022;
Published: 12 July 2022.
Edited by:
Anders Elfvin, University of Gothenburg, SwedenReviewed by:
Alan Emond, University of Bristol, United KingdomRamachandran Thiruvengadam, Translational Health Science and Technology Institute, India
Copyright © 2022 Choudhary, Kumar, Sinha, Shaikh, Mazumder, Taneja and Bhandari. This is an open-access article distributed under the terms of the Creative Commons Attribution License (CC BY). The use, distribution or reproduction in other forums is permitted, provided the original author(s) and the copyright owner(s) are credited and that the original publication in this journal is cited, in accordance with accepted academic practice. No use, distribution or reproduction is permitted which does not comply with these terms.
*Correspondence: Tarun Shankar Choudhary, dGFydW4uY2hvdWRoYXJ5QHVpYi5ubw==