- 1Department of Urology, Ningbo Mingzhou Hospital, Zhejiang, China
- 2The Division of Nephrology, The Sixth Affiliated Hospital, Sun Yat-sen University, Guangzhou, Guangdong, China
- 3Biomedical Innovation Center, The Sixth Affiliated Hospital, Sun Yat-sen University, Guangzhou, Guangdong, China
Background: The relationship between niacin and the risk of mortality in chronic kidney disease (CKD) patients remains unclear. This study aims to investigate the potential correlation.
Methods: This cohort study utilized data from the 2003–2018 National Health and Nutrition Examination Survey (NHANES). The study included 6,110 patients with CKD aged 18 years or older. Weighted Cox proportional hazards models and restricted cubic splines (RCS) were employed to estimate hazard ratios for all-cause mortality and cardiovascular disease (CVD) mortality. Niacin intake was estimated using the 24 h dietary recall method, based on the type and amount of food consumed. All-cause mortality and cardiac mortality rates were determined using National Death Index (NDI) mortality data (as of 31 December 2018).
Results: The median niacin intake was 20.89 mg/day, with an interquartile range of 15.67–27.99 mg/day. During the follow-up period (median of 87 months), there were 1,984 all-cause deaths, including 714 CVD deaths. Compared with low niacin intake, the multivariate-adjusted hazard ratio for dietary intake of 22 mg or higher was 0.71 (95% CI, 0.57–0.88) for all-cause mortality and 0.75 (95% CI, 0.57, 0.98) for CVD mortality.
Conclusion: Dietary niacin intake is associated with a reduction in all-cause and cardiac mortality among CKD patients.
Introduction
Chronic kidney disease (CKD) is an important factor in non-communicable disease morbidity and mortality, representing both a global public health problem and a large medical and financial burden (1, 2). Globally, the global number of deaths from CKD is significant and increasing, with the incidence of CKD increasing by 89%, its prevalence by 87%, and deaths caused by CKD (3) in CKD patients. Therefore, reducing the disease burden and the risk of death from CKD is particularly important.
The importance of nutrition in promoting health has garnered significant attention. Niacin (vitamin B3) serves as a precursor for the synthesis of nicotinamide adenine dinucleotide phosphate (NADP) and nicotinamide adenine dinucleotide (NAD), both of which are crucial in mitigating oxidative stress, inflammation, and endothelial dysfunction (4) These properties have positioned niacin as a significant target of research aimed at reducing all-cause and cardiovascular mortality in CKD patients. Niacin Lower low-density lipoprotein (LDL) and triacylglycerol levels, while increasing high-density lipoprotein (HDL) levels, which helps to improve cardiovascular health (5). In most prospective studies, triglyceride and / or high-density lipoprotein cholesterol (HDL-C) levels were identified as predictors of the development or progression of CKD (6). Oxidative stress has been identified as a major factor in the progression of CKD (7). Niacin may attenuate systemic inflammation and lower the risk of cardiovascular events by inhibiting the production of pro-inflammatory cytokines (6). Furthermore, its protective effects on endothelial cells may enhance vasodilatory function, thereby contributing to a further reduction in cardiovascular risk (8–10).
However, there are still no prospective studies evaluating the association between intake of niacin from food and mortality risk in patients with CKD. This is the first study to investigate the relationship between dietary intake of niacin and all-cause mortality and CVD mortality in CKD patients, using a nationally representative sample of adults in the United States.
Methods
Study design and demographics
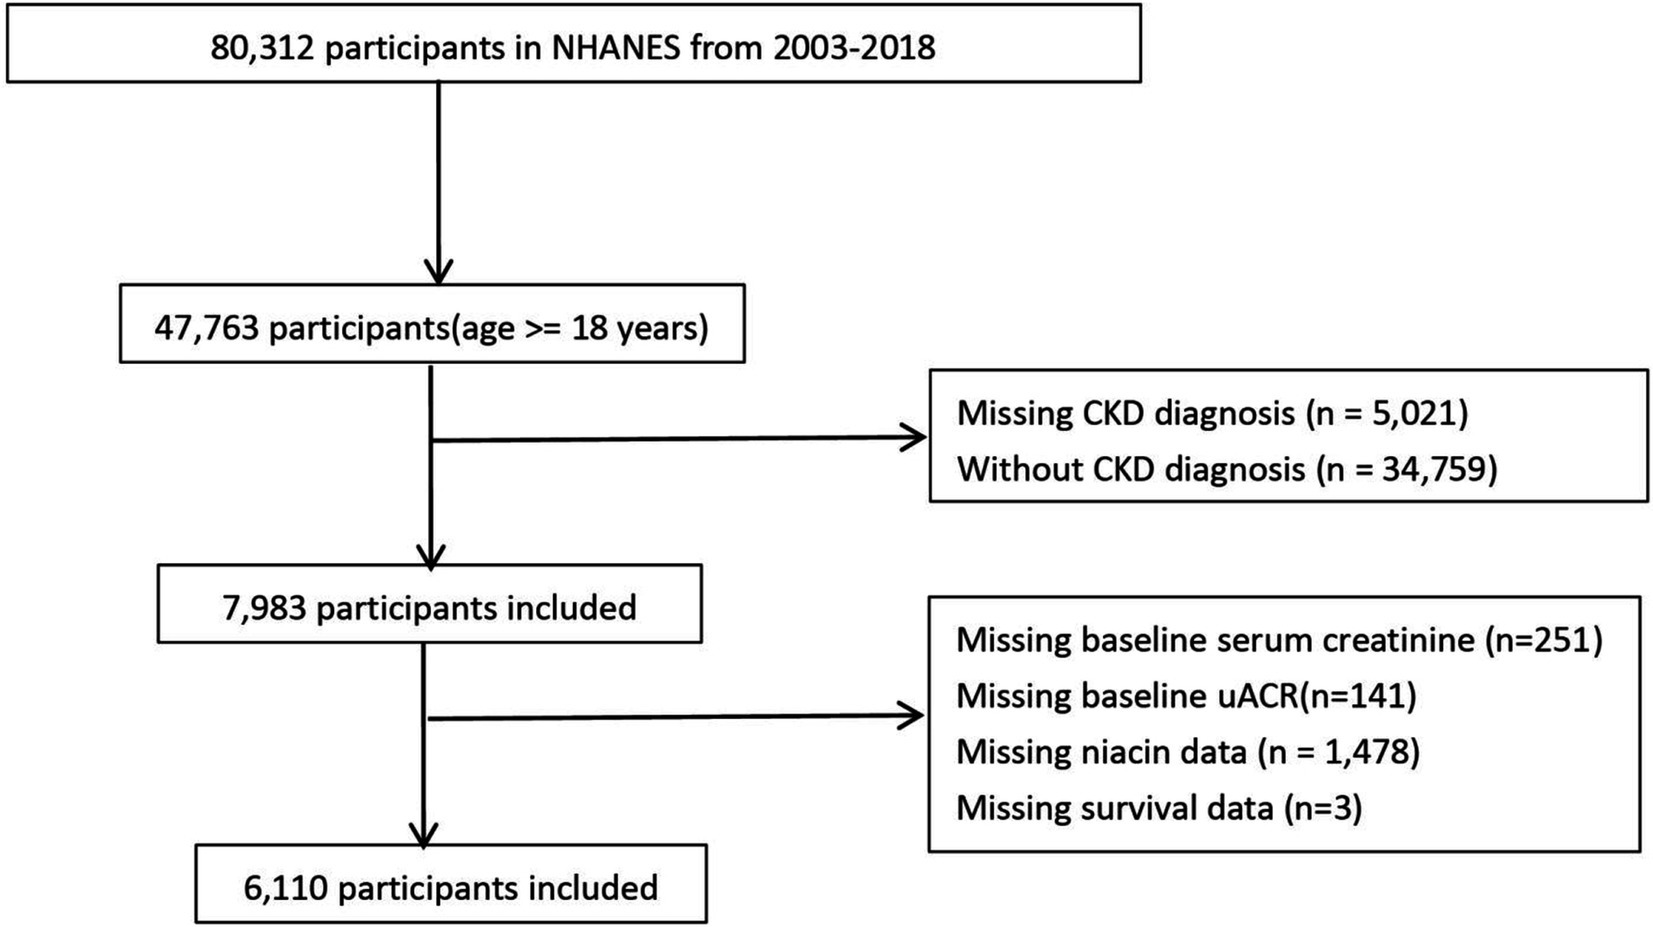
The National Health and Nutrition Examination Survey (NHANES) is a cross-sectional study conducted by the Centers for Disease Control and Prevention (CDC) to assess the health and nutritional status of adults and children in the United States. This cohort study used data from the NHANES, a screening program to assess the health and nutritional status of non-institutional general U. S. residents. NHANES adopts a multi-stage probability sampling design, and over-sampling, stratification and weighting to ensure its data accurately represent the American population, with information collected every 2 years (11). We used NHANES adult data for 8 cycles from 2003 to 2018. Of the 80,312 people from 2003 to 2018, 7,983 people had CKD. Participants with missing baseline creatinine, urinary protein, survival data, baseline niacin data will be further excluded.
Determination of dietary niacin intake
The dietary interview was conducted in collaboration with the United States Department of Agriculture (USDA) and the US Department of Health and Human Services, utilizing a standardized automated multiple-pass method (AMPM). Nutrient and food composition data for all foods were calculated using the USDA Diet Research Food and Nutrition Database. Dietary niacin intake was assessed through a 24 h dietary recall interview, where participants reported the type and amount of food consumed in the 24 h preceding the interview. The first food recall was administered in person at the Mobile Inspection Center, while the second recall took place via telephone interviews approximately 3 to 10 days later. For this study, the average of the participants’ two dietary recalls was used.
Definition of CKD
CKD encompasses chronic renal structure and dysfunction arising from various causes, characterized by a history of renal impairment lasting more than 3 months. This includes normal and abnormal renal GFR pathology, abnormal blood or urine composition, abnormal imaging findings, or an unexplained decline in GFR (less than 60 mL/min/1.73m2) persisting for more than 3 months (12). The eGFR is calculated using the formula from the 2009 Chronic Kidney Disease Epidemiology Collaboration (CKD-EPI) (13).
Ascertainment of mortality
The study accessed the NDI through December 31, 2019, to gather data on deaths and follow-up durations. Causes of death were identified using codes from the International Statistical Classification of Diseases, Tenth Revision (ICD-10). CVD mortality encompasses various causes of death. Cardiovascular mortality was specifically defined as deaths from cerebrovascular disease (codes I60-I69) and heart disease (codes I00-I09, I11, I13, and I20-I51). The follow-up duration was measured in months, from the date of the family interview to either the date of death or the end of the follow-up period.
Definition of covariates
Participant demographic information was collected through a family interview questionnaire. Age was grouped into two categories: under 60 years and 60 years or older. Ethnicity was divided into five categories: White, Black, Mexican American, and Other. Household income was categorized into three levels based on the poverty index: above 3.5 (high income), between 1.3 and 3.5 (middle income), and below 1.3 (low income). Marital status was classified as either coupled (married or in a committed relationship) or single (not married and not in a committed relationship). Educational attainment was sorted into four levels: college graduate or higher, some college or associate degree, high school graduate, and less than high school. Body mass index (BMI) was categorized as obesity (30 or above) and non-obesity (below 30). Alcohol consumption was classified as drinkers and non-drinkers, while smoking status was categorized into former smokers, current smokers, and never smokers. During physical examinations, key biometric measurements such as blood pressure, height, and BMI were taken, with BMI calculated by dividing weight in kilograms by height in meters squared. The study also included laboratory tests measuring serum urea, creatinine, carbon dioxide, uric acid, urine albumin-to-creatinine ratio (uACR), among others. Conditions like hypertension, diabetes, and CVD were diagnosed by doctors and additionally reported by the participants.
Statistical analysis
This study utilized the complex sampling structure of NHANES to ensure that the results accurately represent the U.S. population, incorporating elements such as sample weighting, clustering, and stratification in all analyses. The baseline characteristics of participants with CKD were detailed using statistical techniques. For continuous variables, we presented weighted medians, interquartile ranges (IQRs), and their respective confidence intervals (CIs). Categorical variables were described through weighted percentages. For comparing continuous variables, multiple sample tests were employed, while categorical variables were analyzed using Fisher’s exact test or the Chi-squared test.
To address missing data, the study implemented a sophisticated multilevel imputation technique tailored for survey data, utilizing the “jomo” R package (14). Ten imputed datasets were generated using a Gibbs sampling method, starting with a 500-iteration burn-in phase followed by 100 updates. This approach ensured that each imputed dataset was statistically independent. For the statistical analysis, a complete case approach was used. “jomo” R package is particularly advantageous due to its flexibility in handling both continuous and categorical variables, as well as its ability to model complex relationships within multivariate datasets. This method allows for capturing the uncertainty associated with imputed values, thereby enhancing the robustness of our estimates. The optimal niacin cutoff, which showed the strongest correlation with survival outcomes, was identified using the MSRSM provided by the “maxstat” package. Based on this cutoff, participants were divided into groups with high and low niacin levels (15).
We selected confounding variables including basic demographic information, laboratory information related to CKD, niacin-related lipid indicators, diet-related indicators, and medication. RCS regression was utilized to investigate potential non-linear relationships between niacin intake and mortality risk among CKD patients. We evaluated the existence of non-linearity by conducting the likelihood ratio test. To further examine the association between niacin and mortality risk, survey-weighted univariate and multivariate Cox regression analyses were conducted (weights: “wtdr2d”). The proportional hazards assumption was tested using Schoenfeld residuals, and no violation was observed. Five models were constructed. Crude Model did not adjust for any covariate. Model 1 adjusted for age, gender, marital, poverty, ethnicity, smoking, drinking, and obesity. Model 2 additionally adjusted for HbA1c, hemoglobin (Hb), NLR, serum uric_acid, blood_urea_nitrogen, serum bicarbonate, serum creatinine, serum albumin, and uACR. Model 3 additionally adjusted for systemic immune inflammation Index (SII), dietary energy, dietary protein, dietary_fiber, dietary sodium, dietary potassium. Model 4 additionally adjusted for CVD history, hypertension, hyperlipidemia, the use of hyperlipidemic drug, the use of hypertensive drug. Potential confounding factors were considered in stratified analysis, taking into account factors such as age, serum creatinine, uACR, BMI, uric acid levels, blood urea nitrogen levels, bicarbonate levels, Hb, serum albumin, HbA1c, and etc. The significance of the interaction between each stratification factor was assessed, with p-values presented accordingly. All statistical analyses were conducted using R version 4.3.1 (R Foundation for Statistical Computing, Vienna, Austria). A p-value of less than 0.05 was deemed statistically significant in all two-tailed tests.
Results
A total of 6,110 CKD patients were included in this study (Figure 1), with weighted mean age 59.93 years, 2,835 males (weighted 42.48%). The cohort were grouped into high level and low level according to the optimal niacin cutoff (22.26 for CVD mortality; 22.07 for CVD mortality). The optimal NLR cutoff was calculated by the MSRSM and corresponded the most significant correlation for survival (Figure 2). Participants exhibiting higher niacin intake levels were more inclined to be younger, male, without hypertension, without cardiovascular history, more energy intake, more protein intake, higher uric acid, and more urinary protein (Table 1). There was no significance between serum creatinine, blood urea nitrogen, serum bicarbonate and SII in different level.
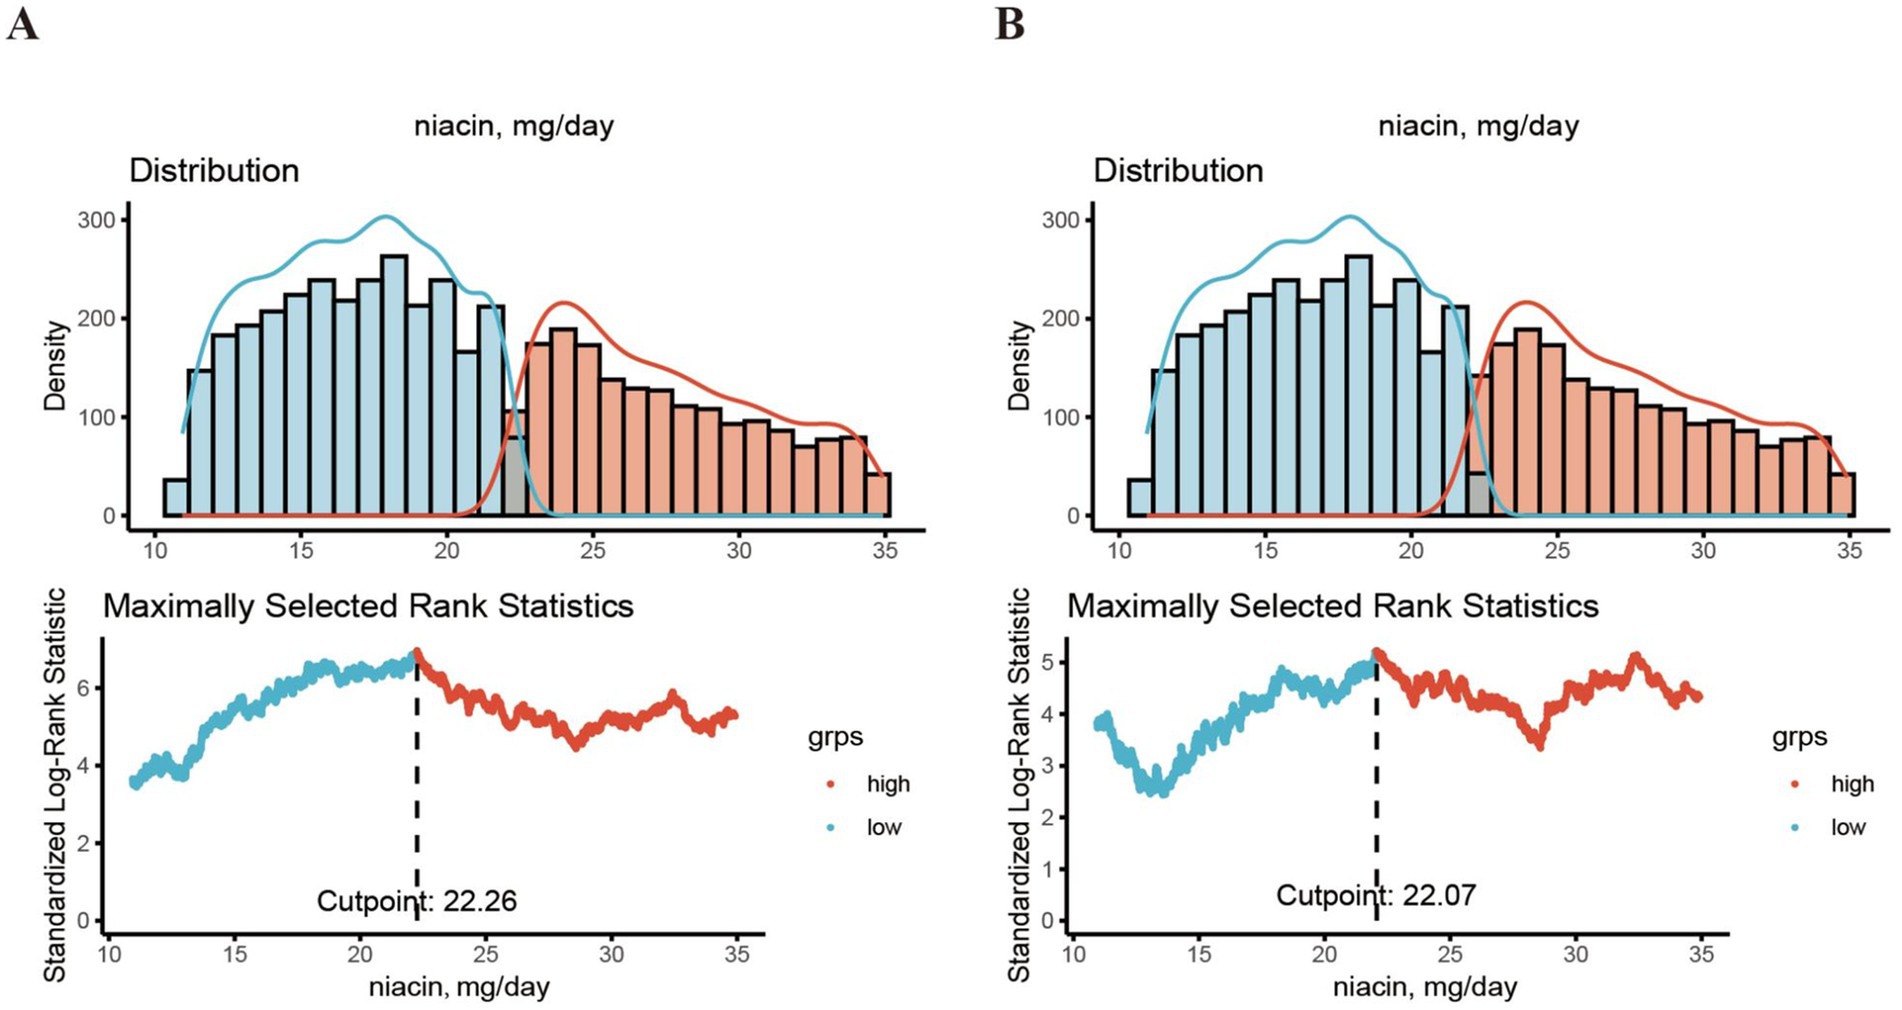
Figure 2. The cutoff point was calculated using the MMRSM using maxstat package. The cutoff point was calculated using the MMRSM for all-cause mortality (A) and CVD mortality (B).
Dietary niacin intake and CVD and all-cause mortality
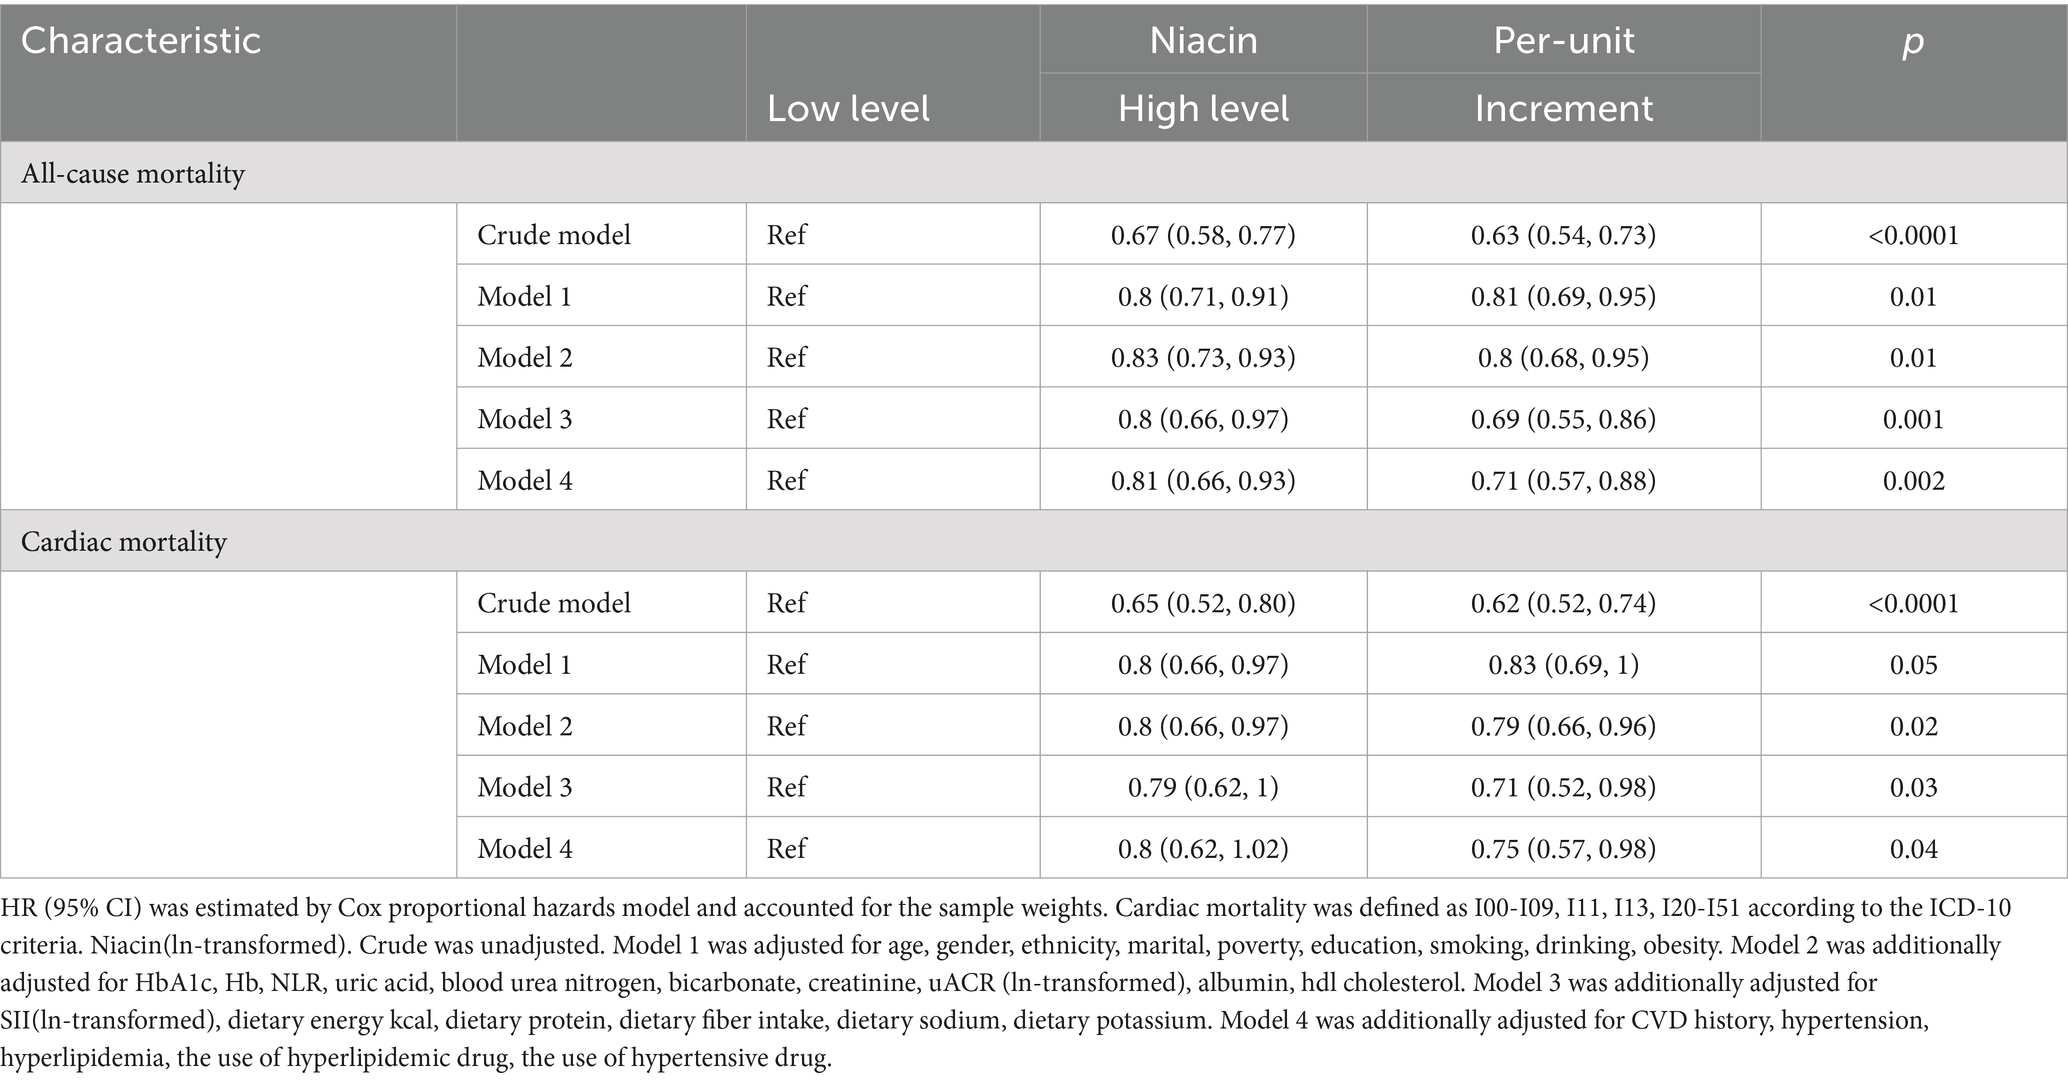
During the end of the follow-up, the median follow-up time was 87.06 (IQR, 84.52–89.60) months, with 1,984 CVD deaths (714 CVD deaths). In crude model, the HR for CVD mortality was 0.65 (95% CI, 0.52–0.8) in higher niacin when compared to the lower group (p < 0.001) (Table 2). For each unit increase of niacin (ln-transformed), the HR for CVD mortality in crude model was 0.62 (95% CI, 0.52–0.74). For CVD mortality, when compared to the lower group in model 1, model 2, model 3 and model 4, the HR in the higher niacin group was 0.8, 0.8, 0.79, 0.8, separately. In models 4, higher niacin has protective significance, but it does not reach statistical significance compared to lower niacin. For each unit increase of niacin (ln-transformed), the HRs for CVD mortality in model 1, model 2, model 3 and model 4 were 0.83, 0.79, 0.71, and 0.75, respectively. For all-cause mortality, the HR was 0.67 (95% CI, 0.58–0.77) in higher niacin when compared to the lower group (p < 0.001) in crude model (Table 2). For each unit increase of niacin (ln-transformed), the HR for all-cause mortality in crude model was 0.63 (95% CI, 0.54–0.73). For all-cause mortality, when compared to the lower group in model 1, model 2, model 3 and model 4, the HR in the higher niacin group were 0.8 (95% CI, 0.71–0.91), 0.83 (95% CI, 0.73–0.93), 0.8 (95% CI, 0.66–0.97), 0.81 (95% CI, 0.66–0.93), respectively (all p < 0.05) (Table 2). For each unit increase of niacin (ln-transformed), the HRs for all-cause mortality in model 1, model 2, model 3, and model 4 were 0.81 (95% CI, 0.69–0.95), 0.8 (95% CI, 0.68–0.95), 0.69 (95% CI, 0.55–0.86), and 0.71 (95% CI, 0.57–0.88), respectively (all p < 0.05) (Table 2).
The dose–response relationship between dietary intake of niacin and CVD and all-cause mortality is shown in Figure 3. In the restricted cubic spline, there was no significant nonlinear association between dietary niacin intake and all-cause mortality (nonlinear p = 0.17) or CVD mortality (nonlinear p = 0.09) in crude model (all p < 0.05). After adjusting variables, the linear association changed between dietary intake of niacin and all-cause mortality (nonlinear p < 0.05). After adjusting the variables, there was reach the significant association between dietary niacin intake and all-cause/CVD mortality in the restricted cubic spline. In K-M plot, the high niacin level had longer survival from all-cause and CVD mortality (Figure 4).
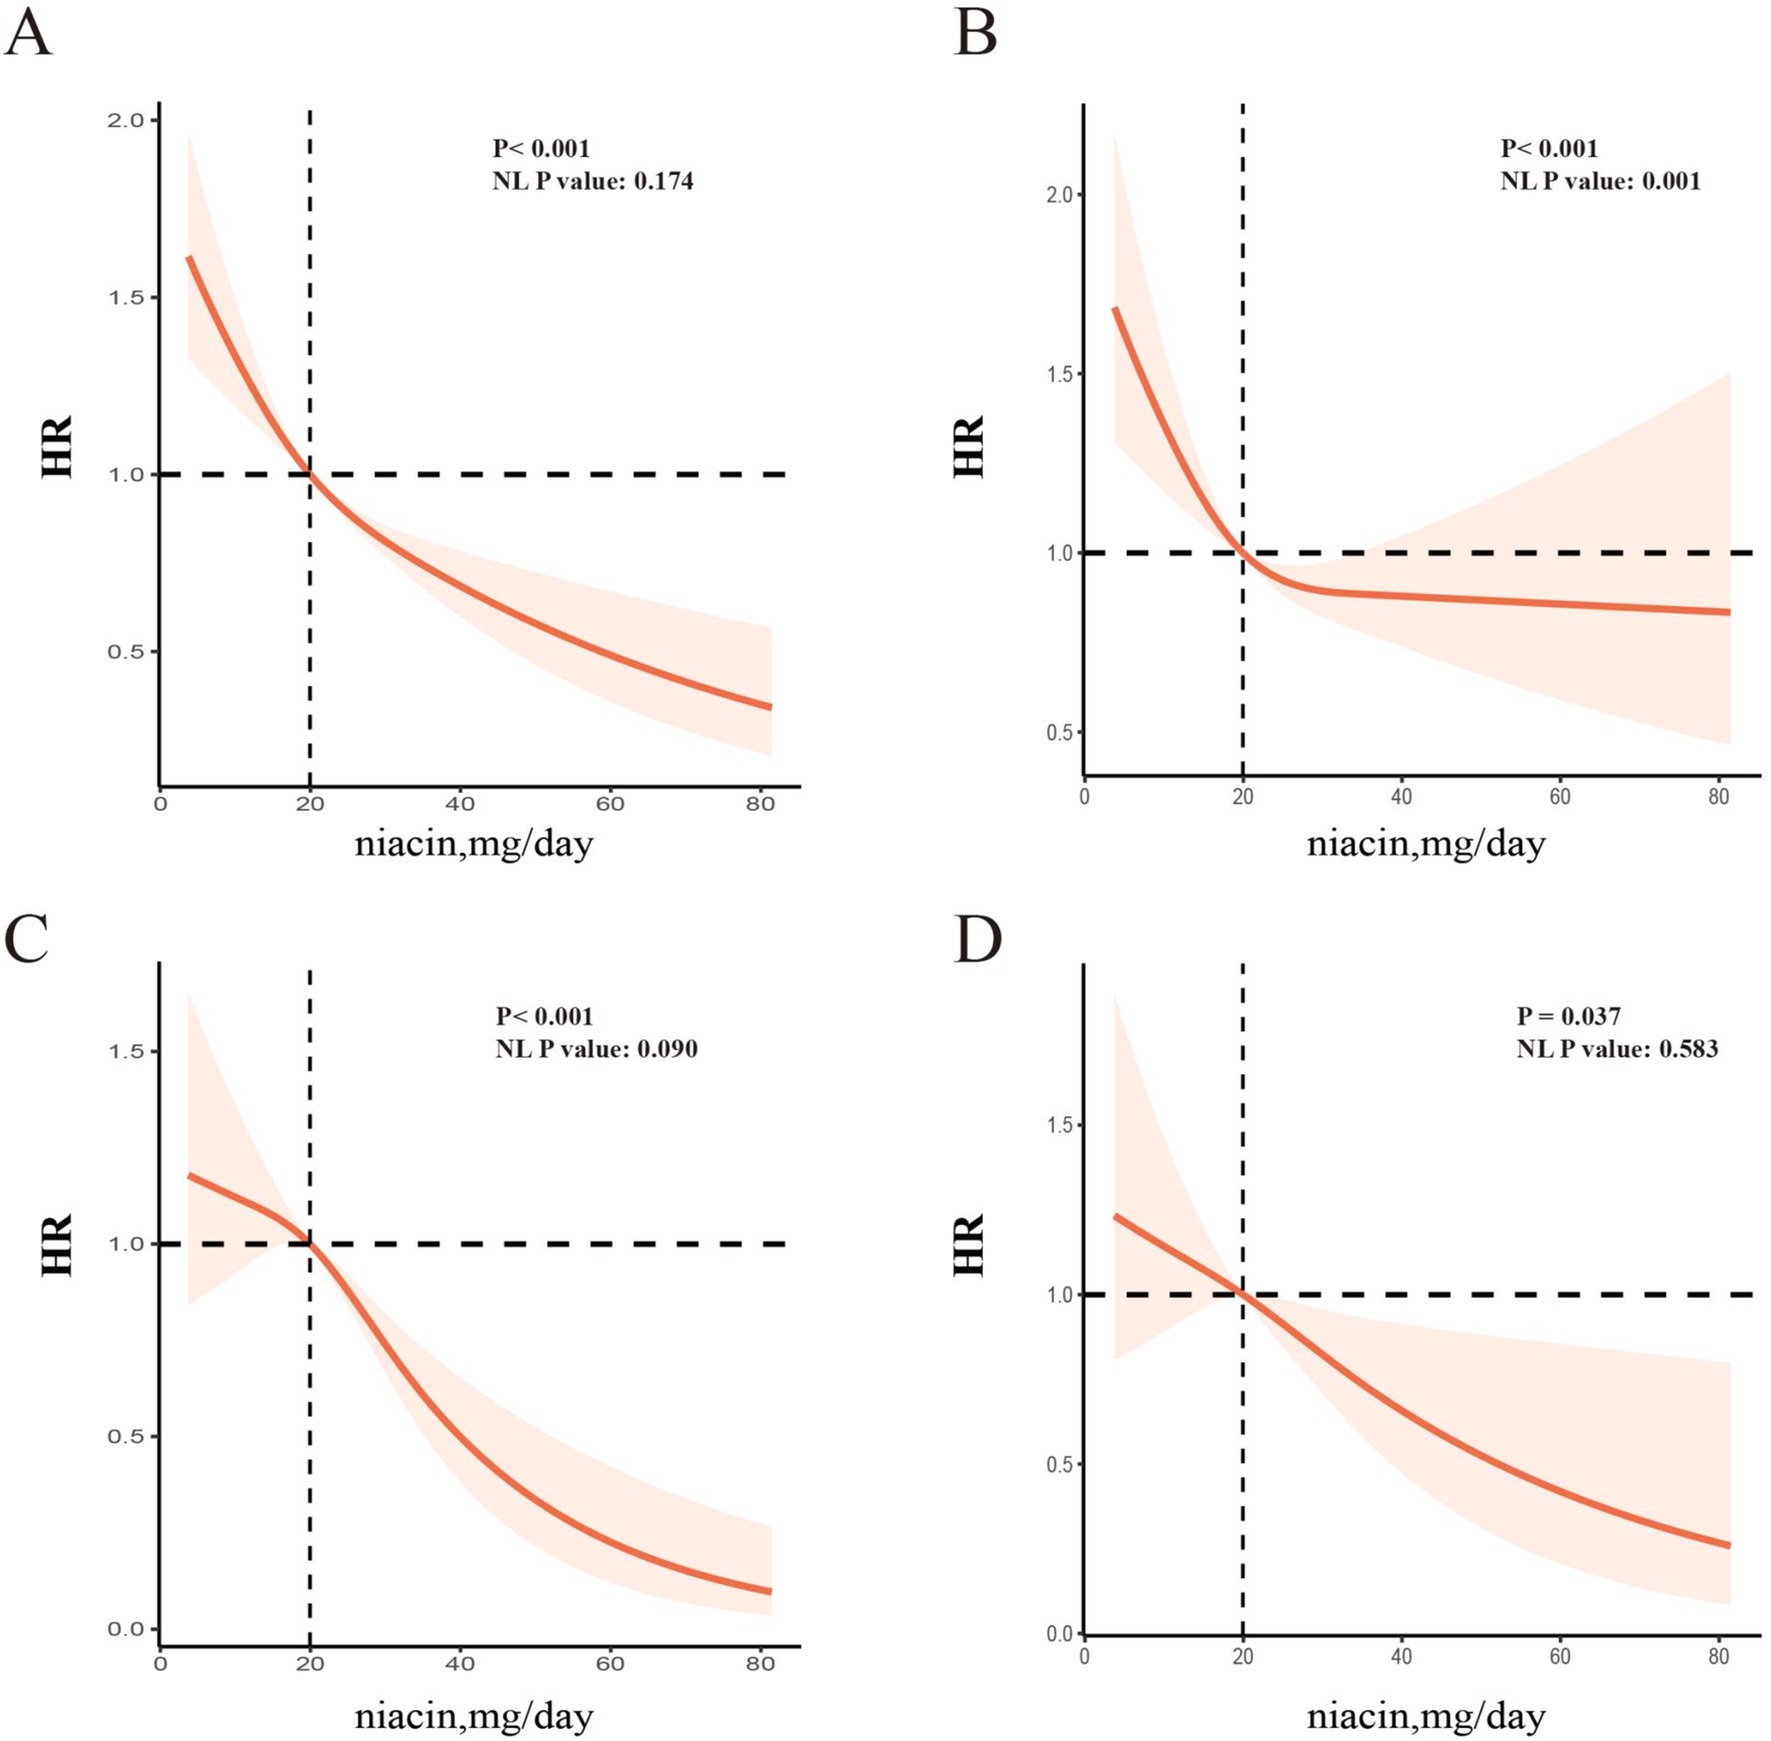
Figure 3. RCS analysis between niacin and all-cause mortality and cardiac mortality among CKD patients [All-cause mortality, unadjusted HR (A); adjusted HR (B); CVD mortality, unadjusted HR (C); adjusted HR (D)]. The spline model was adjusted for consistent confounding factors, including age, gender, ethnicity, marital, poverty, education, smoking, drinking, obesity, HbA1c, Hb, NLR, uric acid, blood urea nitrogen, bicarbonate, creatinine, uACR (ln-transformed), albumin, hdl cholesterol, SII(ln-transformed), dietary energy kcal, dietary protein, dietary fiber intake, dietary sodium, dietary potassium, CVD history, hypertension, hyperlipidemia, the use of hyperlipidemic drug, the use of hypertensive drug. NL-P, p for non-linearity.
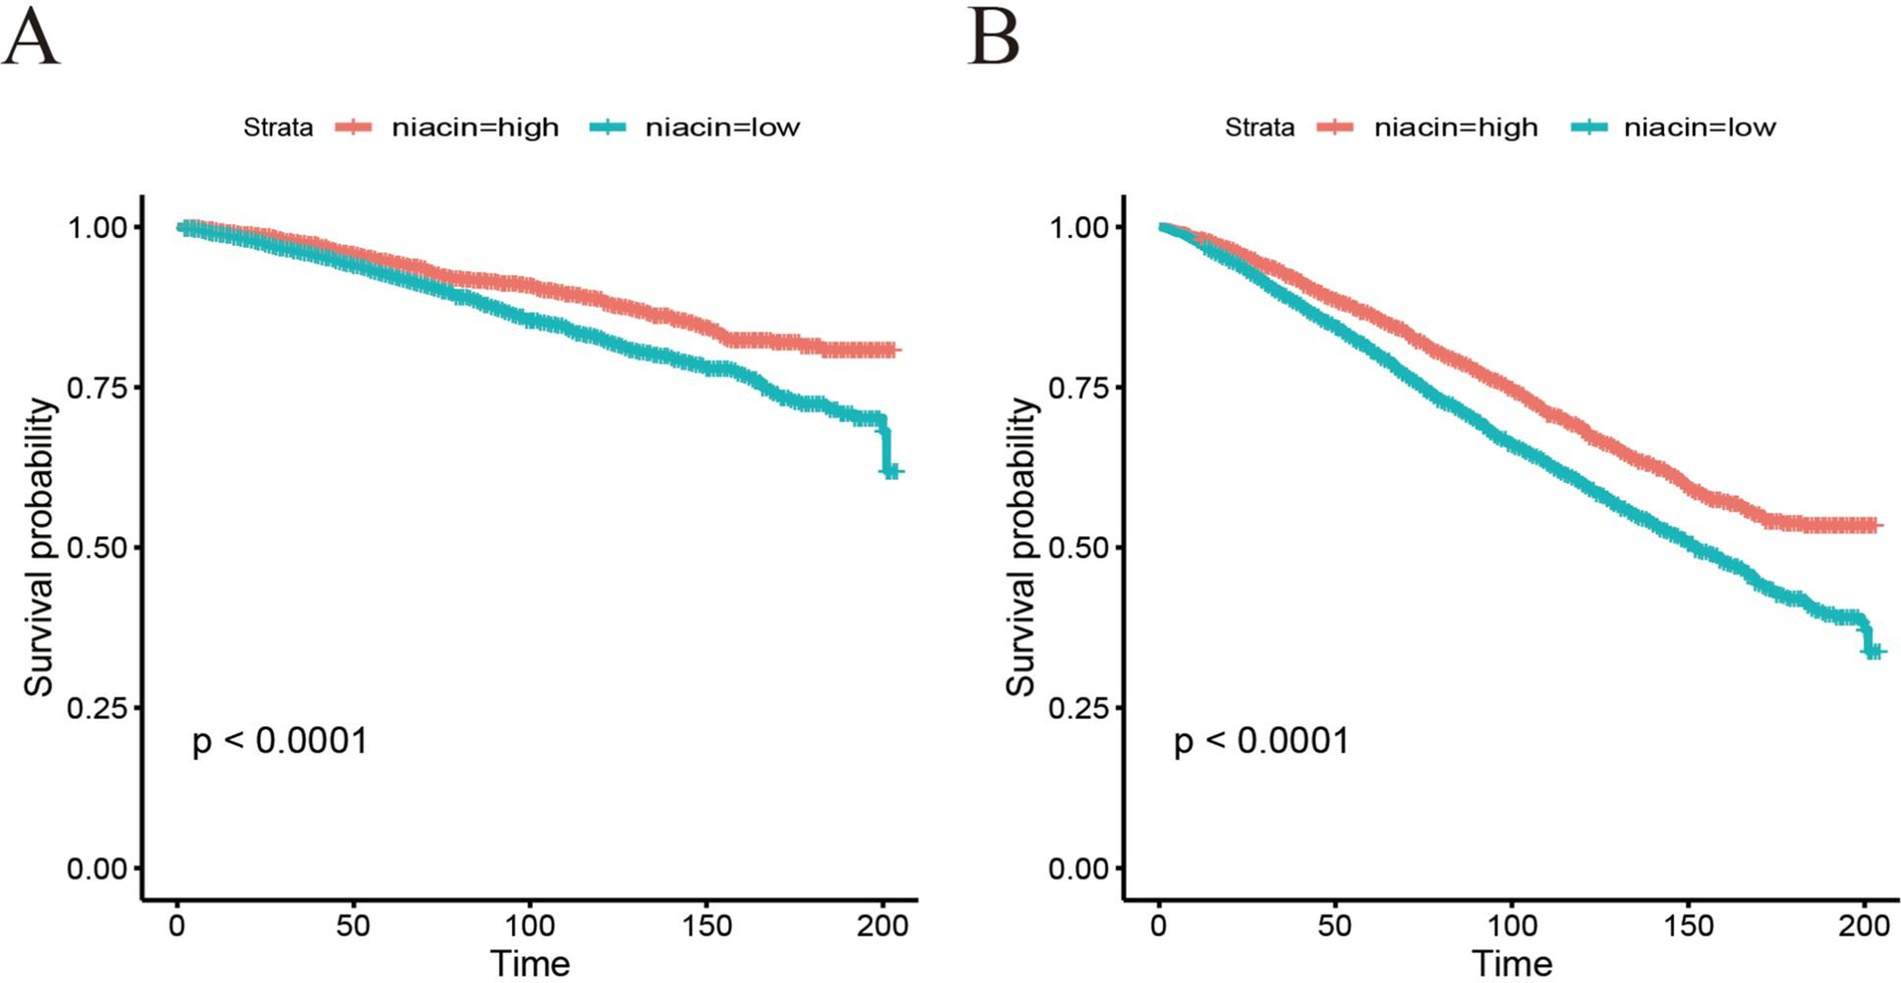
Figure 4. Kaplan–Meier survival curve of all-cause mortality (A) and CVD mortality (B) based on cut-off of niacin among CKD patients.
Stratified and sensitivity analyses
Stratified analyses show significant association in all ages, the White, lower family income, smoking, drinking, HbA1c < 7, all eGFR strata, more energy intake, with and without hyperlipidemic medication, without hypertensive medication, more protein intake, hypertension, without CVD history, without hyperlipidemia subgroup for niacin intake in all-cause mortality (Figure 5). Stratified analyses show significant association smoking, more energy intake, hypertension, without CVD history, with hyperlipidemic medication, subgroup for niacin intake in CVD mortality (Figure 6).
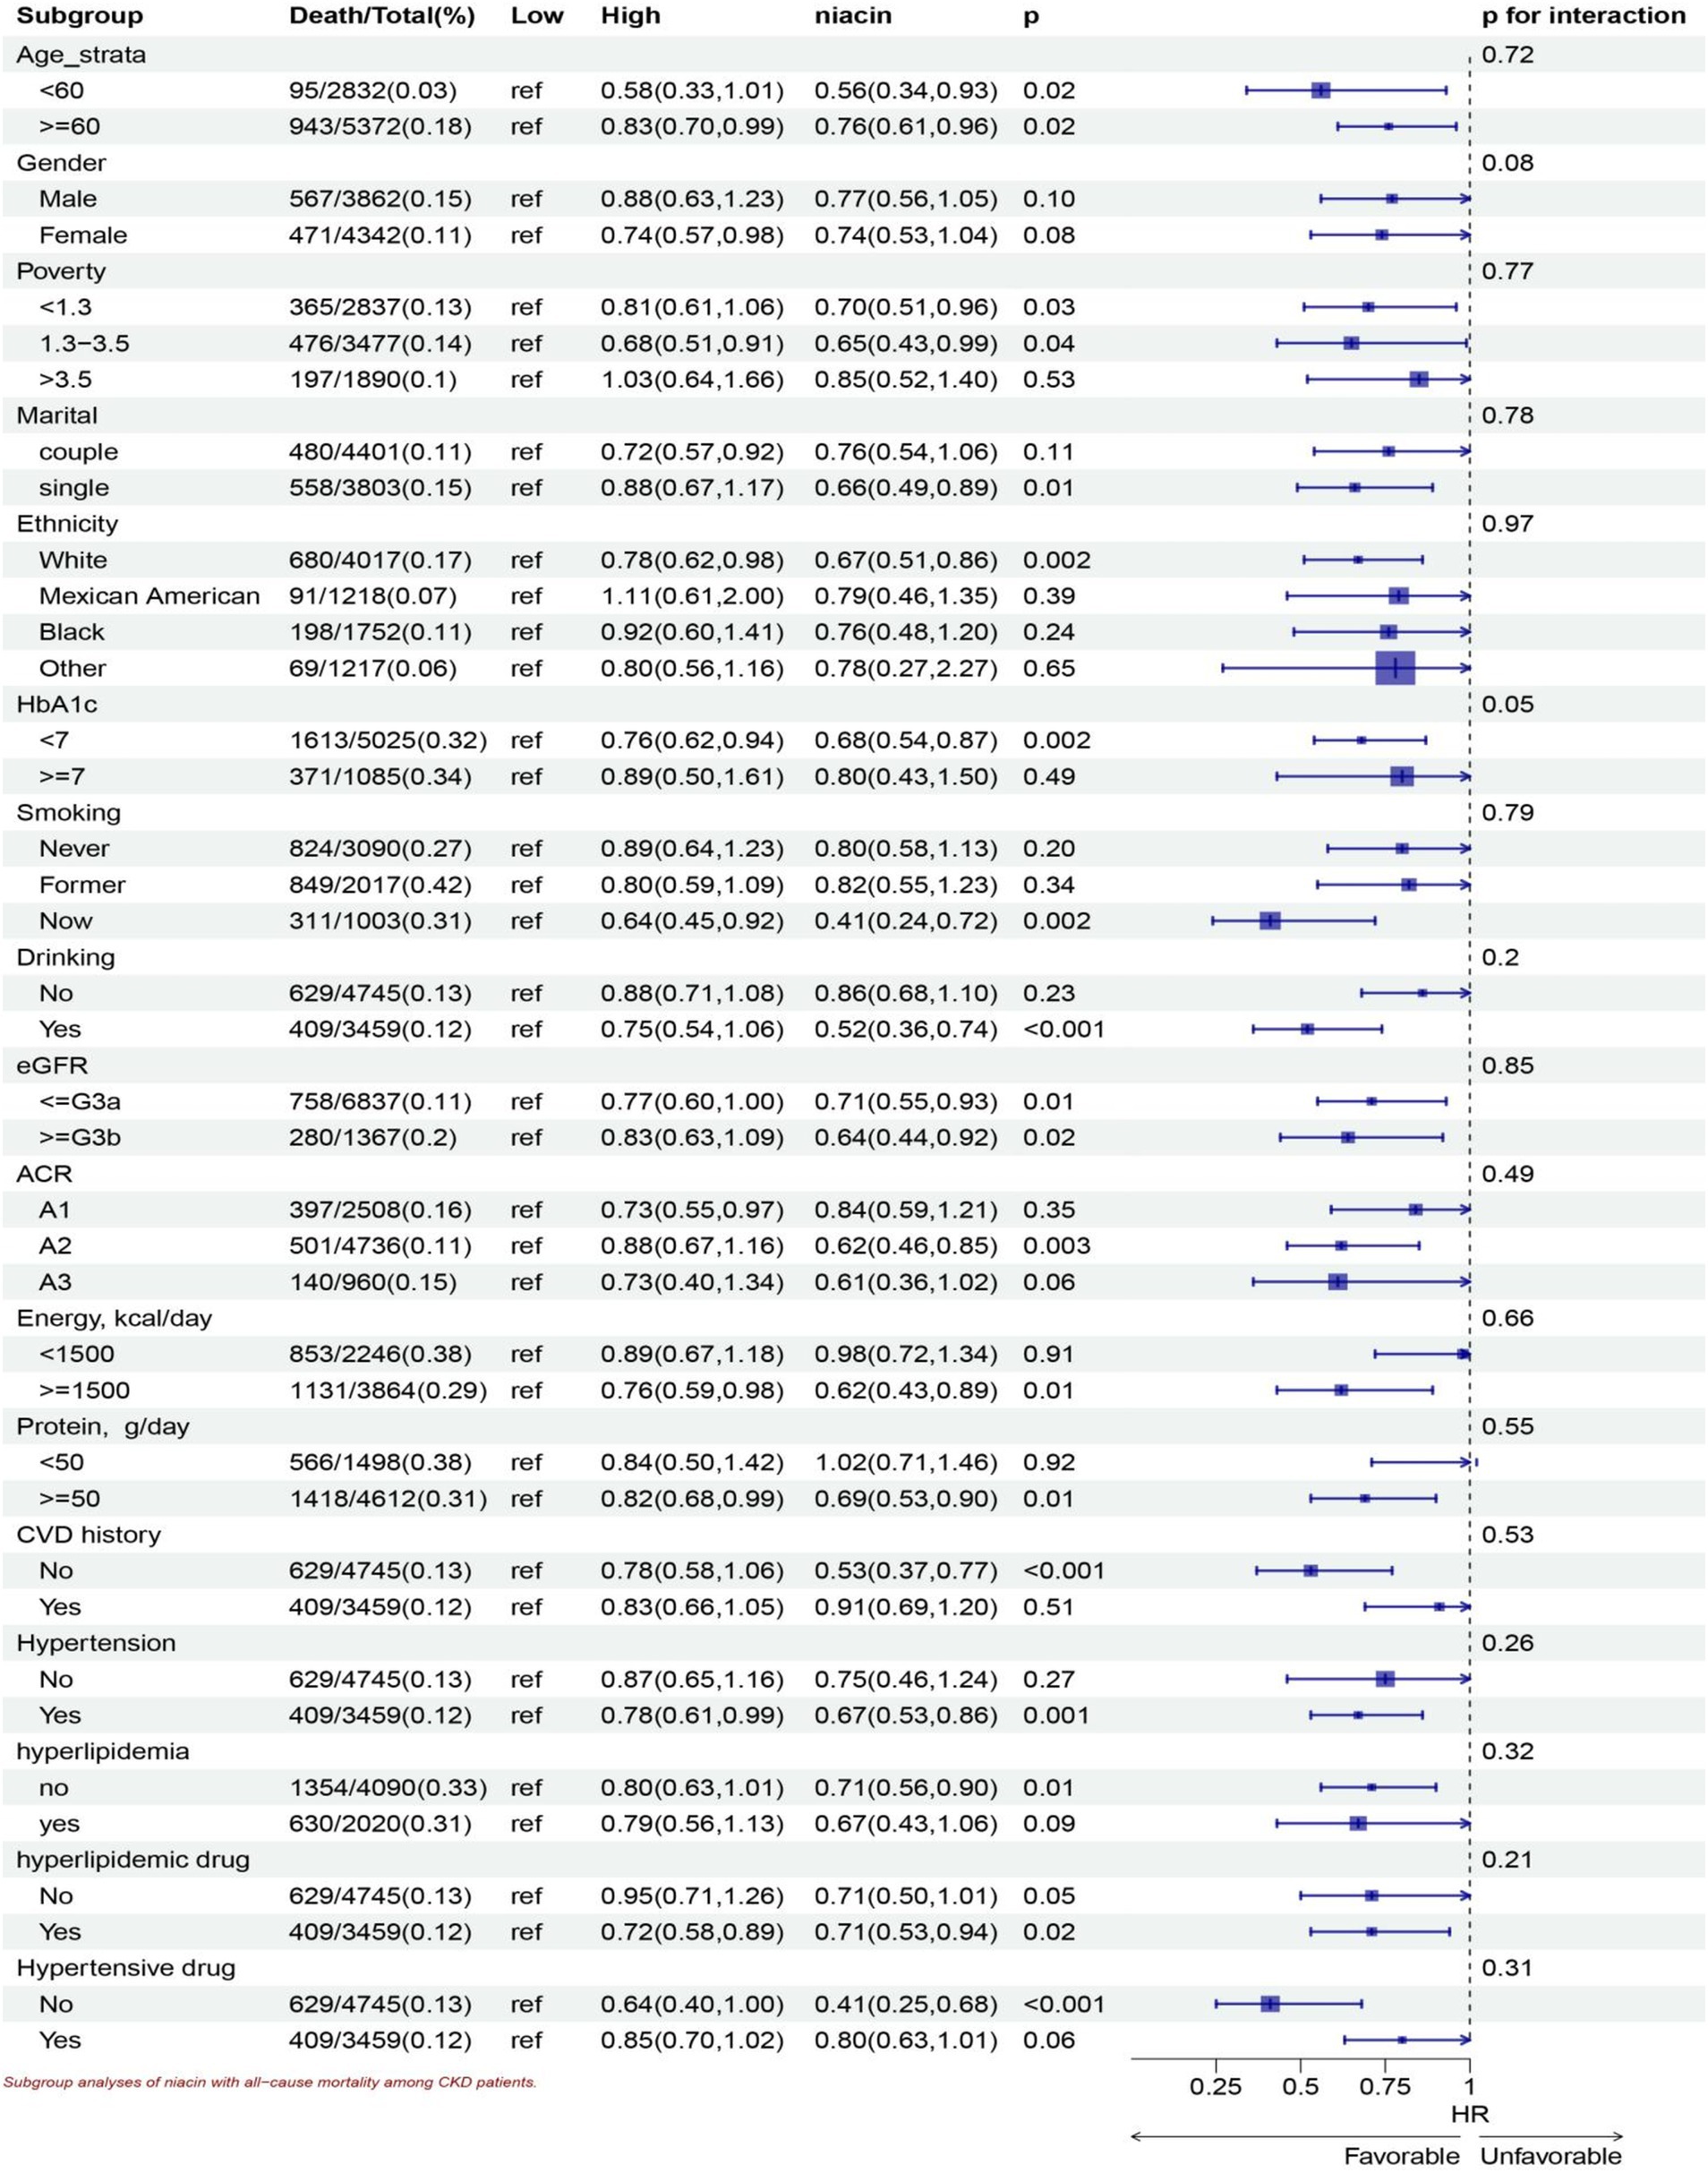
Figure 5. Subgroup analyses of niacin with all-cause mortality among CKD patients. HR (95% CI) was assessed by Cox proportional hazards model. The model was adjusted for consistent confounding factors, including age, gender, ethnicity, marital, poverty, education, smoking, drinking, obesity, HbA1c, Hb, NLR, uric acid, blood urea nitrogen, bicarbonate, creatinine, uACR (ln-transformed), albumin, hdl cholesterol, SII(ln-transformed), dietary energy kcal, dietary protein, dietary fiber intake, dietary sodium, dietary potassium, CVD history, hypertension, hyperlipidemia, the use of hyperlipidemic drug, the use of hypertensive drug uACR, A1, <30 mg/g; A2 30–300 mg/g; A3 > 300 mg/g; eGFR, <=G3a, eGFR > = 45 mL/(min • 1.73 m2), > = G3b, eGFR >45 mL/(min • 1.73 m2).
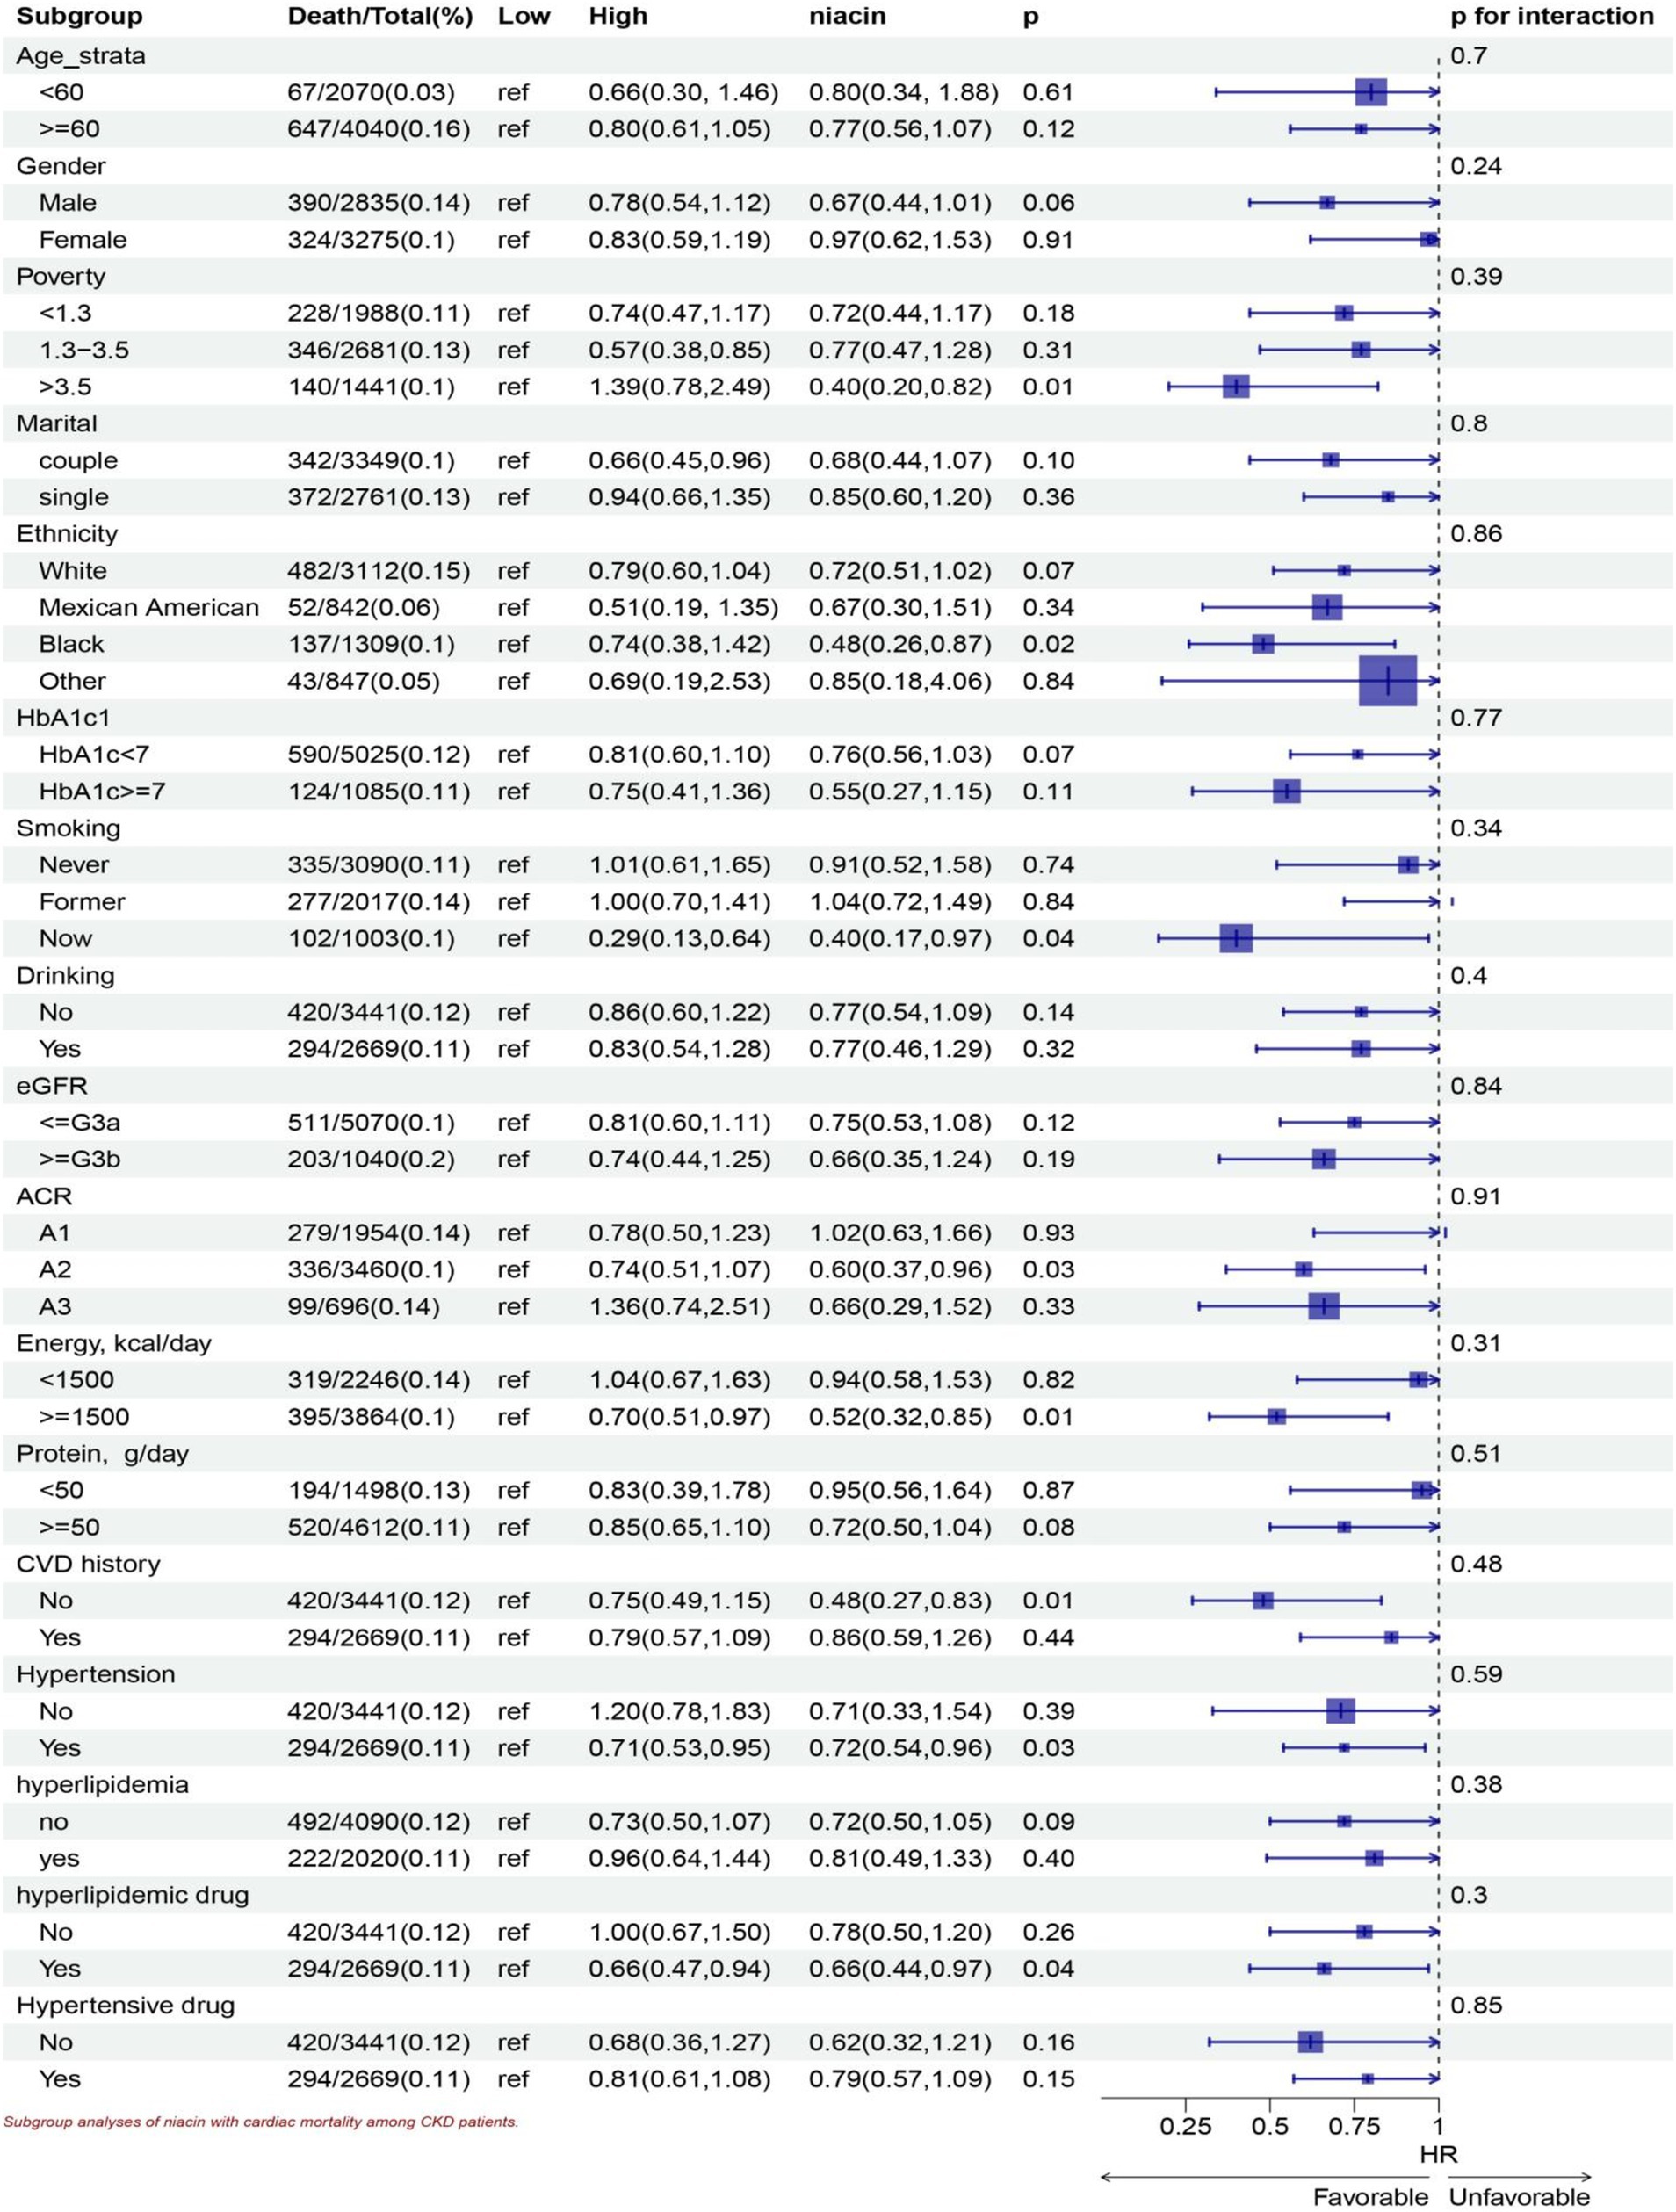
Figure 6. Subgroup analyses of niacin with CVD mortality among CKD patients. HR (95% CI) was assessed by Cox proportional hazards model. The model was adjusted for consistent confounding factors, including age, gender, ethnicity, marital, poverty, education, smoking, drinking, obesity, HbA1c, Hb, NLR, uric acid, blood urea nitrogen, bicarbonate, creatinine, uACR (ln-transformed), albumin, hdl cholesterol, SII(ln-transformed), dietary energy kcal, dietary protein, dietary fiber intake, dietary sodium, dietary potassium, CVD history, hypertension, hyperlipidemia, the use of hyperlipidemic drug, the use of hypertensive drug uACR, A1, <30 mg/g; A2 30–300 mg/g; A3 > 300 mg/g; eGFR, <=G3a, eGFR > = 45 mL/(min • 1.73 m2), > = G3b, eGFR >45 mL/(min • 1.73 m2).
Discussion
Our study is the first large-scale prospective cohort study to explore the association between dietary niacin intake and all-cause and cardiovascular mortality in patients with CKD. Our results showed that higher dietary niacin intake was associated with lower all-cause mortality and cardiovascular mortality. The results are consistent after adjusting for multiple confounding factors. However, the relationship between dietary niacin intake and mortality in CKD patients remains unclear.
Dyslipidemia (16), characterized by low-density lipoprotein cholesterol (LDL-C), elevated triglycerides, and decreased HDL-C, is common in patients with CKD and significantly leads to cardiovascular mortality (17). Numerous studies have demonstrated that dyslipidemia exacerbates renal disease (18, 19) while lipid-lowering strategies have been shown to slow the progression of this condition in both humans (20, 21) and experimental animals (22–24). Niacin was first used as a therapeutic drug to reduce blood lipids (25). A post-hoc analysis of AIM-HIGH showed that extended-release niacin slowed the decrease in eGFR, improved triglyceride and high-density lipoprotein-cholesterol concentrations, and a small subgroup of subjects with baseline dyslipidemia showed possible benefit (26). Our results showed that in subgroup analysis, higher niacin intake has protective significance in patients with lipid-lowering drugs, and all-cause death and cardiovascular death have decreased 28, 34% respectively, but the protective effect in patients with dyslipidemia has not reached statistical significance. This may be related to the decrease in blood lipid after taking lipid-lowering drugs in patients with dyslipidemia. This finding is consistent and reasonable with the existing underlying theory.
Endothelial dysfunction is a hallmark of CKD and is a key factor in the development of atherosclerosis and cardiovascular complications (8, 27). Niacin improves endothelial function by increasing the bioavailability of nitric oxide (NO), thereby enhancing vasodilation and reducing vascular inflammation (9, 10). In our study, niacin was more effective in reducing mortality of patients with hypertension. For each unit of niacin intake, cardiovascular mortality is reduced by 28%, and all-cause mortality is reduced by 33%. Meanwhile, each unit of niacin intake reduced all-cause death by 59% in patients without hypertensive medication. Considering the protective effect of niacin, improved endothelial function can better regulate blood pressure and vascular tone, thereby reducing mortality in patients with CKD.
Niacin has the potent antioxidant and anti-inflammatory properties (28). Previous basic study show that niacin supplementation helps to attenuate histological injury and mitigate upregulation of oxidative and inflammatory systems in the remnant kidney of rat (29). At the same time, niacin can play a role in improving oxidative stress, inflammation, and endothelial dysfunction (29), thus reducing proteinuria and eGFR decline. In our study, the protective effect of niacin remained after adjusting for the inflammatory markers NLR and SII. After adjusting for blood lipids, the protective effect of niacin also remained, considering the anti-inflammatory effect of niacin independently of its lipid-lowering effect (30, 31).
Niacin has been reported to increase blood glucose levels in diabetic patients (32, 33). In our study, in the Hb1Ac <7 subgroup, the HR of higher dietary intake of niacin and all-cause and cardiovascular mortality were 0.76 (0.62, 0.94) and 0.81(0.6, 1.01) (p for interaction >0.05). In the Hb1Ac ≥ 7 subgroup, the protective effect of niacin did not reach statistical significance. Considering the effect of niacin on elevated glucose and the effect of diabetes itself on CKD patients, combined with the results of our subgroup analysis, we believe that increased niacin intake may be more strongly associated with a lower mortality risk in CKD patients with Hb1Ac <7.
Another notable finding of this study is that high energy intake patients benefit more from dietary niacin intake. In the high energy intake group, higher niacin intake can reduce all-cause mortality by 24% and CVD mortality by 30%, respectively. The synthesis of niacin requires energy, and high energy intake promotes the synthesis and utilization of niacin, and promotes cell function and energy balance (34). At the same time, adequate energy intake helps to maintain overall health, and niacin supplementation may provide additional protection. Niacin intake can reduce all-cause mortality in the higher protein intake group, with 18% decreased mortality. High protein intake may lead to increased nitrogen load, and the metabolic effect of niacin helps to improve nitrogen utilization and reduce renal burden (35). At the same time, sufficient protein and niacin combination can promote muscle synthesis and maintain the overall nutritional status, thus improving the survival rate.
The strength of our study is the use of a large sample size representing adults across the US to include the national population. Furthermore, our study spans 16 years and is the largest study cohort to date on the association between dietary niacin intake and CVD and all-cause mortality, filling a gap on the relationship between dietary niacin and CKD. Our study still has its limitations. First, since our study design is observational, a causal relationship cannot be established. Second, although dietary data were obtained from two 24 h dietary recalls, the presence of recall bias cannot be completely excluded, in which participants may inadvertently ignore the specific food items they consumed, resulting in an underestimation or overestimation of portion sizes. Furthermore, it is possible that some potential confounders are not adequately considered to allow the presence of residuals and unrecognized confounders that cannot be completely ruled out. Unmeasured or unknown factors could still influence the observed associations. Additionally, the inherent limitations of the observational study design should be acknowledged, as it precludes establishing causal relationships. While associations can be identified, causality cannot be definitively determined without randomized controlled trials.
In conclusion, our study showed that higher dietary niacin intake is associated with lower CKD all-cause mortality and cardiovascular mortality. Moreover, correlations still exist within the subgroups. The dose–response relationship between dietary nicotinate intake and reduced all-cause and CVD mortality in CKD patients requires further investigation to determine the optimal intake level. Future large-scale randomized trials are needed to further confirm the role of niacin in improving long-term outcomes in CKD patients.
Data availability statement
Publicly available datasets were analyzed in this study. This data can be found here: the NHANES dataset is publicly accessible via the NCHS, a division of the CDC. You can find the dataset at this website: https://www.cdc.gov/nchs/nhanes/.
Ethics statement
The studies involving humans were approved by The NHANES survey is conducted by the CDC and the NCHS. The NHANES study protocol received approval from the NCHS Research Ethics Review Committee. All participants provided written informed consent. The studies were conducted in accordance with the local legislation and institutional requirements. Written informed consent for participation in this study was provided by the participants’ legal guardians/next of kin. Written informed consent was obtained from the individual(s), and minor(s)’ legal guardian/next of kin, for the publication of any potentially identifiable images or data included in this article.
Author contributions
ZZ: Writing – original draft, Writing – review & editing. XY: Conceptualization, Data curation, Formal analysis, Funding acquisition, Investigation, Methodology, Project administration, Resources, Software, Supervision, Validation, Visualization, Writing – original draft, Writing – review & editing.
Funding
The author(s) declare that no financial support was received for the research, authorship, and/or publication of this article.
Acknowledgments
We extend our gratitude to the participants and staff of NHANES, as well as the NCHS, for their invaluable contributions. Special thanks to Zhang Jing from the Second Department of Infectious Disease at Shanghai Fifth People’s Hospital, Fudan University, for his exceptional work on the NHANES database. His creation of the nhanesR package and accompanying webpage has greatly facilitated our exploration of the NHANES database.
Conflict of interest
The authors declare that the research was conducted in the absence of any commercial or financial relationships that could be construed as a potential conflict of interest.
Publisher’s note
All claims expressed in this article are solely those of the authors and do not necessarily represent those of their affiliated organizations, or those of the publisher, the editors and the reviewers. Any product that may be evaluated in this article, or claim that may be made by its manufacturer, is not guaranteed or endorsed by the publisher.
References
1. GBD Chronic Kidney Disease Collaboration. Global, regional, and national burden of chronic kidney disease, 1990–2017: a systematic analysis for the global burden of disease study 2017. Lancet. (2020) 395:709–33. doi: 10.1016/S0140-6736(20)30045-3
2. Wang, J, Liu, X, Pan, D, Cai, X, Xue, Y, and Huang, J. Chronic kidney disease in the shadow of COVID-19: insights from the bibliometric analysis. Int Urol Nephrol. (2024) 56:683–97. doi: 10.1007/s11255-023-03706-x
3. Xie, Y, Bowe, B, Mokdad, AH, Xian, H, Yan, Y, Li, T, et al. Analysis of the global burden of disease study highlights the global, regional, and national trends of chronic kidney disease epidemiology from 1990 to 2016. Kidney Int. (2018) 94:567–81. doi: 10.1016/j.kint.2018.04.011
5. Miller, M. Niacin as a component of combination therapy for dyslipidemia. Mayo Clin Proc. (2003) 78:735–42. doi: 10.4065/78.6.735
6. Streja, E, Kovesdy, CP, Streja, DA, Moradi, H, Kalantar-Zadeh, K, and Kashyap, ML. Niacin and progression of CKD. Am J Kidney Dis. (2015) 65:785–98. doi: 10.1053/j.ajkd.2014.11.033
7. Daenen, K, Andries, A, Mekahli, D, Van Schepdael, A, Jouret, F, and Bammens, B. Oxidative stress in chronic kidney disease. Pediatr Nephrol. (2019) 34:975–91. doi: 10.1007/s00467-018-4005-4
8. Raptis, V, Kapoulas, S, and Grekas, D. Role of asymmetrical dimethylarginine in the progression of renal disease. Nephrology (Carlton). (2013) 18:11–21. doi: 10.1111/j.1440-1797.2012.01659.x
9. Warnholtz, A, Wild, P, Ostad, MA, Elsner, V, Stieber, F, Schinzel, R, et al. Effects of oral niacin on endothelial dysfunction in patients with coronary artery disease: results of the randomized, double-blind, placebo-controlled INEF study. Atherosclerosis. (2009) 204:216–21. doi: 10.1016/j.atherosclerosis.2008.08.003
10. Westphal, S, Borucki, K, Luley, C, Martens-Lobenhoffer, J, and Bode-Böger, SM. Treatment with niacin lowers ADMA. Atherosclerosis. (2006) 184:448–50. doi: 10.1016/j.atherosclerosis.2005.11.018
11. Zhu, Q, Chen, Y, Cai, X, Cai, L, Hong, J, Luo, Q, et al. The non-linear relationship between triglyceride-glucose index and risk of chronic kidney disease in hypertensive patients with abnormal glucose metabolism: a cohort study. Front Med (Lausanne). (2022) 9:1018083. doi: 10.3389/fmed.2022.1018083
12. Levin, A, and Stevens, PE. Summary of recommendation statements. Kidney Int Suppl. (2013) 3:5–14. doi: 10.1038/kisup.2012.77
13. Levey, AS, Stevens, LA, Schmid, CH, Zhang, Y, Castro, AF III, Feldman, HI, et al. A new equation to estimate glomerular filtration rate. Ann Intern Med. (2009) 150:604–12. doi: 10.7326/0003-4819-150-9-200905050-00006
14. Muntner, P, Hardy, ST, Fine, LJ, Jaeger, BC, Wozniak, G, Levitan, EB, et al. Trends in blood pressure control among US adults with hypertension, 1999–2000 to 2017–2018. JAMA. (2020) 324:1190–200. doi: 10.1001/jama.2020.14545
15. Kamarudin, AN, Cox, T, and Kolamunnage-Dona, R. Time-dependent ROC curve analysis in medical research: current methods and applications. BMC Med Res Methodol. (2017) 17:53. doi: 10.1186/s12874-017-0332-6
16. Arvanitis, M, and Lowenstein, CJ. Dyslipidemia. Ann Intern Med. (2023) 176:ITC81–96. doi: 10.7326/AITC202306200
17. Vallianou, NG, Mitesh, S, Gkogkou, A, and Geladari, E. Chronic kidney disease and cardiovascular disease: is there any relationship? Curr Cardiol Rev. (2019) 15:55–63. doi: 10.2174/1573403X14666180711124825
18. Abrass, CK. Cellular lipid metabolism and the role of lipids in progressive renal disease. Am J Nephrol. (2004) 24:46–53. doi: 10.1159/000075925
19. Moorhead, JF, Chan, MK, El-Nahas, M, and Varghese, Z. Lipid nephrotoxicity in chronic progressive glomerular and tubulo-interstitial disease. Lancet. (1982) 2:1309–11. doi: 10.1016/s0140-6736(82)91513-6
20. Cases, A, and Coll, E. Dyslipidemia and the progression of renal disease in chronic renal failure patients. Kidney Int Suppl. (2005) 68:S87–93. doi: 10.1111/j.1523-1755.2005.09916.x
21. Keane, WF, Kasiske, BL, O’Donnell, MP, and Schmitz, PG. Therapeutic implications of lipid-lowering agents in the progression of renal disease. Am J Med. (1989) 87:21N–4N.
22. Park, YS, Guijarro, C, Kim, Y, Massy, ZA, Kasiske, BL, Keane, WF, et al. Lovastatin reduces glomerular macrophage influx and expression of monocyte chemoattractant protein-1 mRNA in nephrotic rats. Am J Kidney Dis. (1998) 31:190–4. doi: 10.1053/ajkd.1998.v31.pm9428473
23. Vieira, JM, Mantovani, E, Rodrigues, LT, Dellê, H, Noronha, IL, Fujihara, CK, et al. Simvastatin attenuates renal inflammation, tubular transdifferentiation and interstitial fibrosis in rats with unilateral ureteral obstruction. Nephrol Dial Transplant. (2005) 20:1582–91. doi: 10.1093/ndt/gfh859
24. Yoshimura, A, Nemoto, T, Sugenoya, Y, Inui, K, Watanabe, S, Inoue, Y, et al. Effect of simvastatin on proliferative nephritis and cell-cycle protein expression. Kidney Int Suppl. (1999) 56:S84–7. doi: 10.1046/j.1523-1755.1999.07121.x
25. Meyers, CD, Kamanna, VS, and Kashyap, ML. Niacin therapy in atherosclerosis. Curr Opin Lipidol. (2004) 15:659–65. doi: 10.1097/00041433-200412000-00006
26. Kalil, RS, Wang, JH, de Boer, IH, Mathew, RO, Ix, JH, Asif, A, et al. Effect of extended-release niacin on cardiovascular events and kidney function in chronic kidney disease: a post hoc analysis of the AIM-HIGH trial. Kidney Int. (2015) 87:1250–7. doi: 10.1038/ki.2014.383
27. Yilmaz, MI, Saglam, M, Caglar, K, Cakir, E, Sonmez, A, Ozgurtas, T, et al. The determinants of endothelial dysfunction in CKD: oxidative stress and asymmetric dimethylarginine. Am J Kidney Dis. (2006) 47:42–50. doi: 10.1053/j.ajkd.2005.09.029
28. Ganji, SH, Qin, S, Zhang, L, Kamanna, VS, and Kashyap, ML. Niacin inhibits vascular oxidative stress, redox-sensitive genes, and monocyte adhesion to human aortic endothelial cells. Atherosclerosis. (2009) 202:68–75. doi: 10.1016/j.atherosclerosis.2008.04.044
29. Cho, K, Kim, H, Rodriguez-Iturbe, B, and Vaziri, ND. Niacin ameliorates oxidative stress, inflammation, proteinuria, and hypertension in rats with chronic renal failure. Am J Physiol Renal Physiol. (2009) 297:F106–13. doi: 10.1152/ajprenal.00126.2009
30. Walters, RW, Shukla, AK, Kovacs, JJ, Violin, JD, DeWire, SM, Lam, CM, et al. beta-Arrestin1 mediates nicotinic acid-induced flushing, but not its antilipolytic effect, in mice. J Clin Invest. (2009) 119:1312–21. doi: 10.1172/JCI36806
31. Holzhäuser, E, Albrecht, C, Zhou, Q, Buttler, A, Preusch, MR, Blessing, E, et al. Nicotinic acid has anti-atherogenic and anti-inflammatory properties on advanced atherosclerotic lesions independent of its lipid-modifying capabilities. J Cardiovasc Pharmacol. (2011) 57:447–54. doi: 10.1097/FJC.0b013e31820dc1db
32. Goldberg, RB, and Jacobson, TA. Effects of niacin on glucose control in patients with dyslipidemia. Mayo Clin Proc. (2008) 83:470–8. doi: 10.4065/83.4.470
33. Elam, MB, Hunninghake, DB, Davis, KB, Garg, R, Johnson, C, Egan, D, et al. Effect of niacin on lipid and lipoprotein levels and glycemic control in patients with diabetes and peripheral arterial disease: the ADMIT study: a randomized trial. Arterial disease multiple intervention trial. JAMA. (2000) 284:1263–70. doi: 10.1001/jama.284.10.1263
34. Peechakara, BV, and Gupta, M. “Vitamin B3,” StatPearls. Treasure Island (FL): StatPearls Publishing (2024). Available at: http://www.ncbi.nlm.nih.gov/books/NBK526107/ (accessed October 12, 2024).
35. Ivers, DJ, and Veum, TL. Effect of graded levels of niacin supplementation of a semipurified diet on energy and nitrogen balance, growth performance, diarrhea occurrence, and niacin metabolite excretion by growing swine. J Anim Sci. (2012) 90:282–8. doi: 10.2527/jas.2011-4035
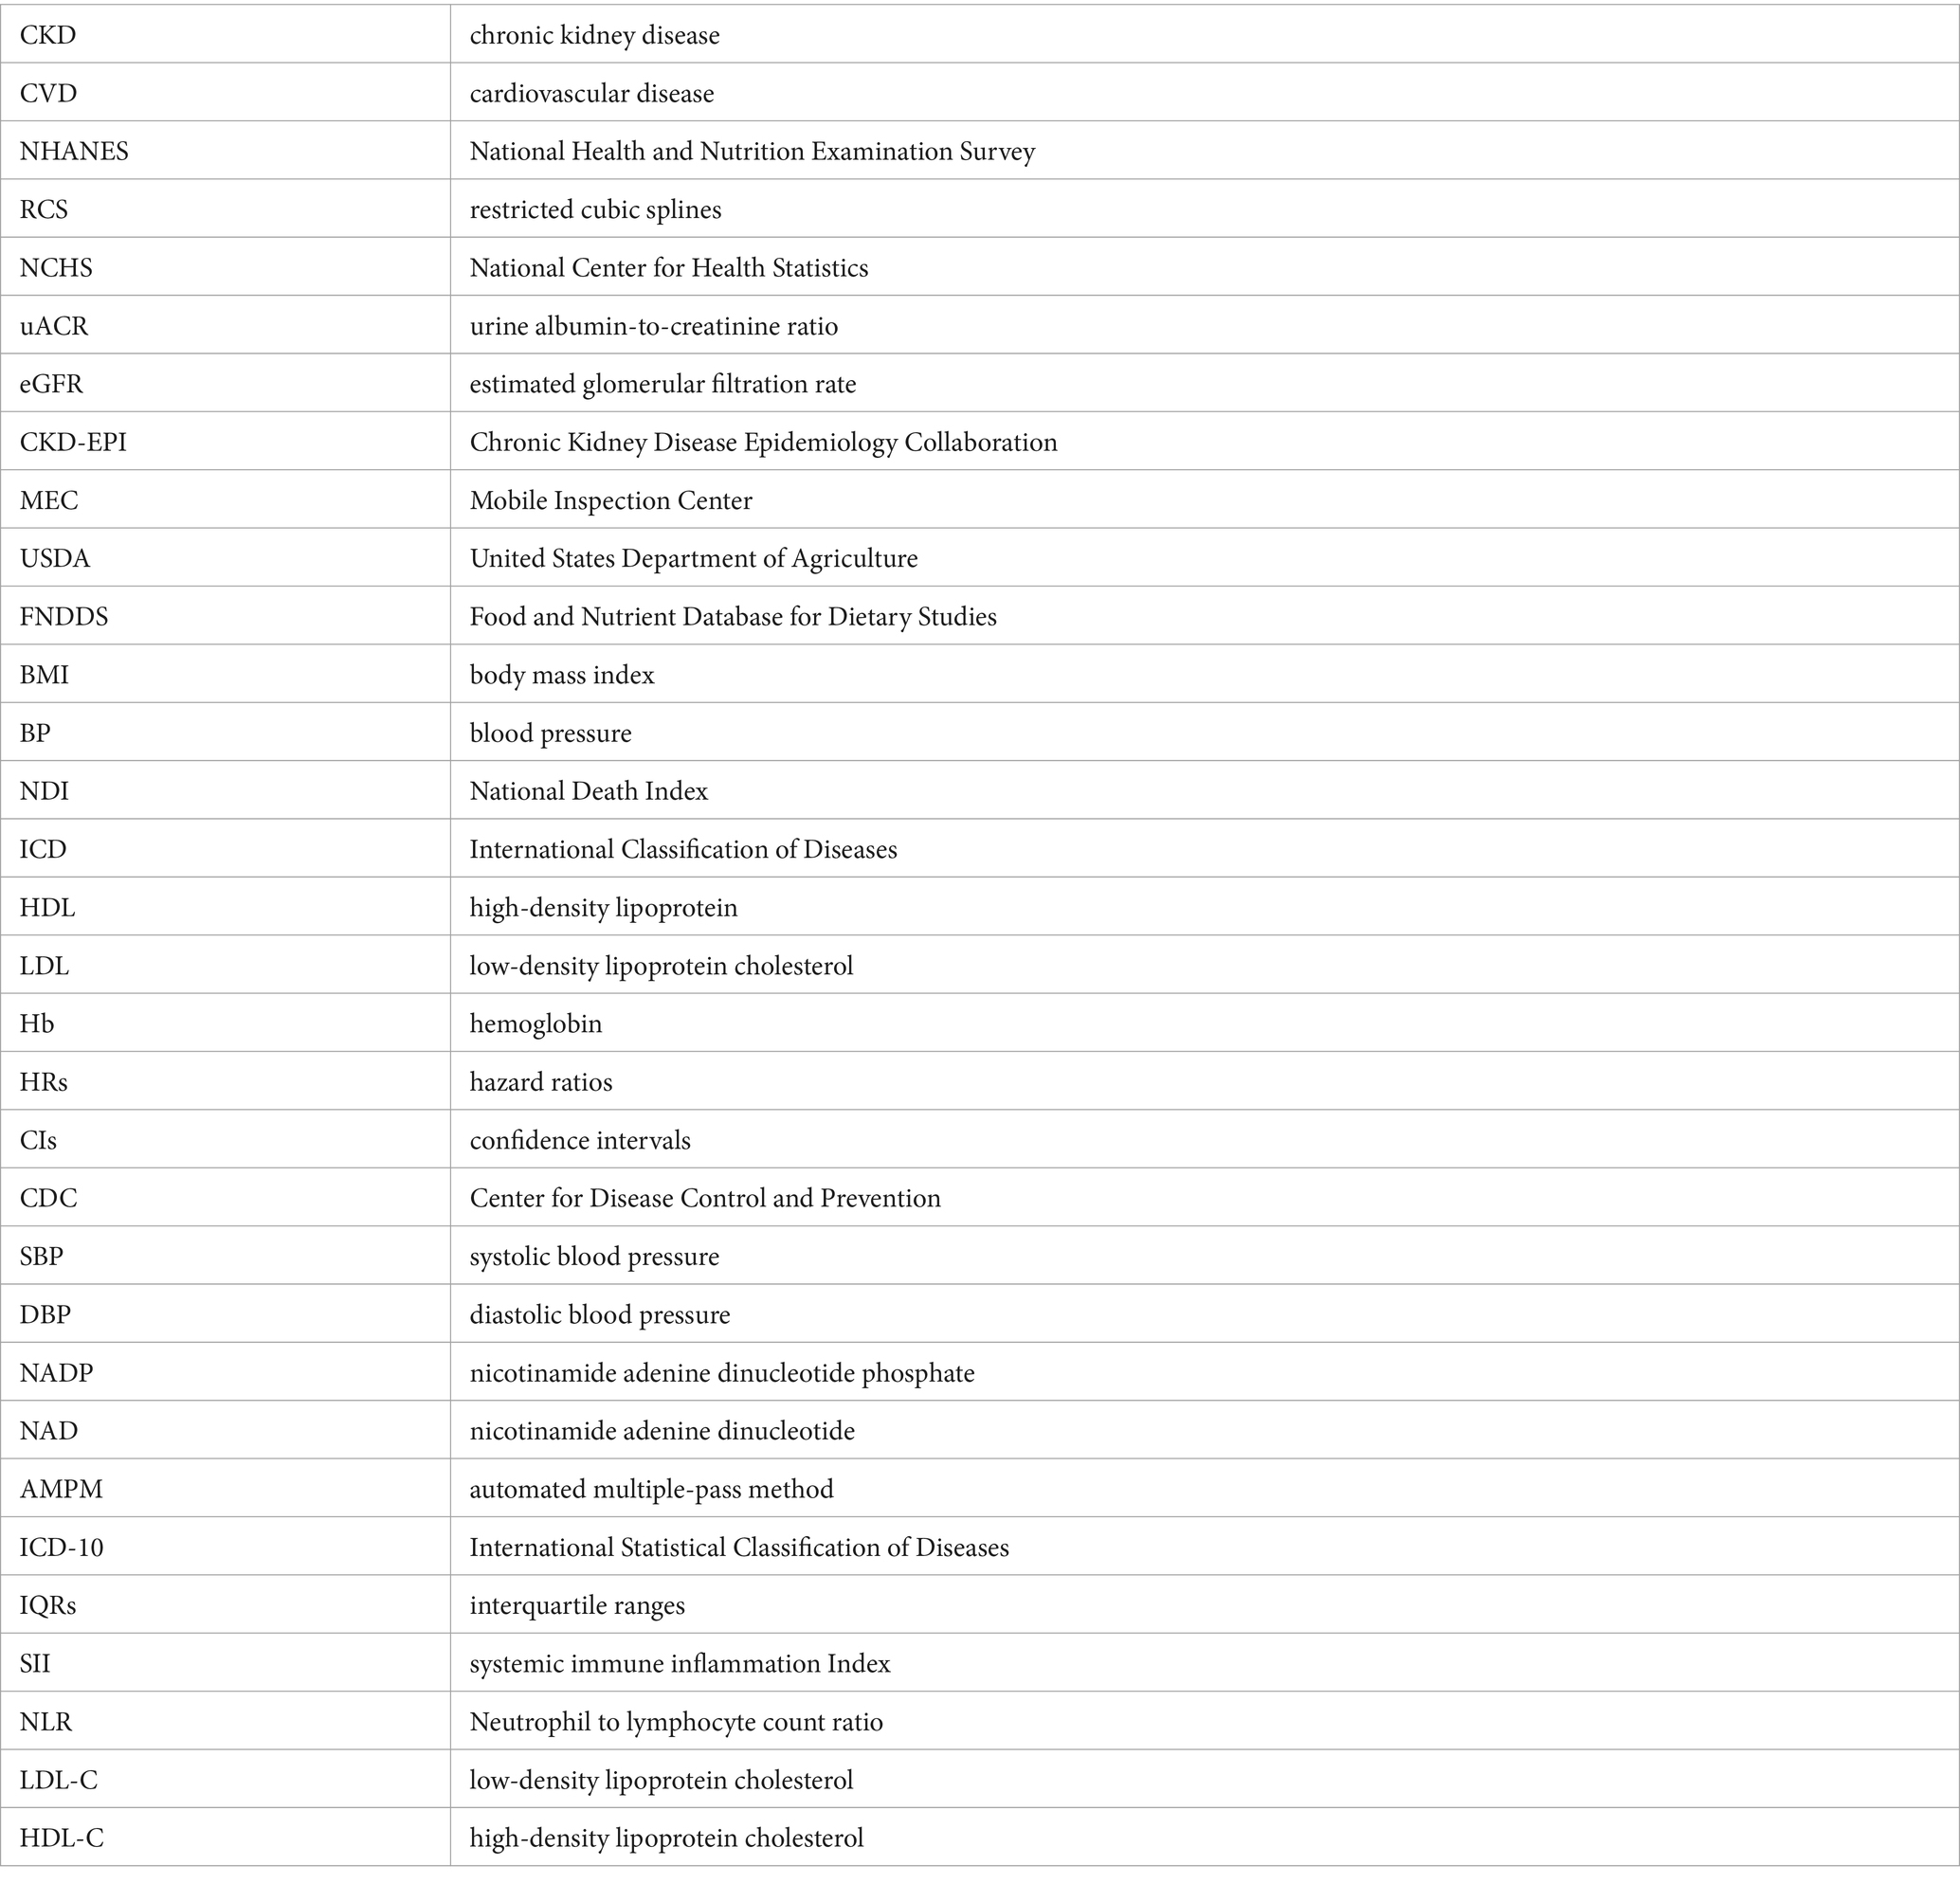
Glossary
Keywords: niacin, CKD, NHANES, all-cause mortality, cardiac mortality
Citation: Zhou Z and Yao X (2024) Dietary niacin intake and mortality among chronic kidney disease patients. Front. Nutr. 11:1435297. doi: 10.3389/fnut.2024.1435297
Edited by:
Tilakavati Karupaiah, Taylor’s University, MalaysiaReviewed by:
Xintian Cai, People’s Hospital of Xinjiang Uygur Autonomous Region, ChinaMunkhtuya Tumurkhuu, Wake Forest Baptist Medical Center, United States
Copyright © 2024 Zhou and Yao. This is an open-access article distributed under the terms of the Creative Commons Attribution License (CC BY). The use, distribution or reproduction in other forums is permitted, provided the original author(s) and the copyright owner(s) are credited and that the original publication in this journal is cited, in accordance with accepted academic practice. No use, distribution or reproduction is permitted which does not comply with these terms.
*Correspondence: Xiaotian Yao, eWFveHQ5QG1haWwuc3lzdS5lZHUuY24=: Zhengxi Zhou MTUwODAzODIyOEBxcS5jb20=
†These authors have contributed equally to this work and share first authorship
 Zhengxi Zhou1*†
 Xiaotian Yao