 Chaohui Jiang
 Jianfen Li
 Haiyan Yu
 Xingda Luo
 Lingfeng Wu
 Qilian Long
 Bin Zhang
- 1Department of Hematopathology, Jiangmen Central Hospital, Jiangmen, China
- 2Department of General Practice, Jiangmen Central Hospital, Jiangmen, China
- 3Department of Cardiology, The First Affiliated Hospital, Sun Yat-sen University, Guangzhou, China
- 4Department of Cardiovascular Disease and Clinical Experimental Center, Jiangmen Central Hospital, Jiangmen, China
Background: The relationship between red blood cell (RBC) folate levels and visceral adipose tissue (VAT) accumulation has not been well-explored. This study investigates the association between RBC folate and VAT in young and middle-aged adults in the United States.
Methods: A cross-sectional analysis was conducted using data from 7,591 individuals aged 20 to 59 years, drawn from the National Health and Nutrition Examination Survey (NHANES) 2011–2018. VAT was measured using dual-energy X-ray absorptiometry (DXA). RBC folate levels were quantified using a multi-step process combining microbiologic assays and liquid chromatography–tandem mass spectrometry (LC–MS/MS). Multivariate linear regression models were applied to assess the relationship between RBC folate and VAT mass.
Results: After adjusting for potential confounders, RBC folate levels were positively associated with VAT mass, with a β coefficient (95% CI) of 0.05 (0.03, 0.07). A J-shaped dose–response relationship was observed (nonlinear, p < 0.001), with a threshold effect identified at an RBC folate level of 397.18 ng/mL. Below this threshold, the association was negative [β (95% CI): −0.10 (−0.20, −0.01)], while above the threshold, the association became positive [β (95% CI): 0.06 (0.03, 0.09)].
Conclusion: The association between RBC folate and VAT mass in young and middle-aged American adults follows a J-shaped curve, with a threshold effect observed at an RBC folate level of 397.18 ng/mL. Further research is needed to explore the underlying mechanisms of this association.
Introduction
Obesity has emerged as a significant public health concern due to its rising global prevalence (1). It is associated with an increased risk of numerous non-communicable diseases, including diabetes, non-alcoholic steatohepatitis, cardiovascular diseases, gout, and various cancers (1–4). Recently, obesity has been redefined as a condition characterized by excess adiposity, with clinical obesity specifically recognized as a chronic, systemic illness where excess body fat impairs the function of organs, tissues, or the entire body, potentially leading to severe complications such as cardiovascular disease and renal failure (5). This nuanced definition highlights the need for comprehensive assessment methods beyond body mass index (BMI), emphasizing direct measures of adiposity and functional health impacts (5). Among obesity-related markers, visceral adipose tissue (VAT) is particularly important, with its assessment through computed tomography (CT) or magnetic resonance imaging (MRI) serving as a reliable indicator of metabolic and cardiovascular health (6, 7). Furthermore, abdominal fat accumulation is independently linked to poor physical fitness and chronic low-grade inflammation, regardless of BMI (8). Given VAT’s central role in metabolic dysfunction, understanding the factors that contribute to its accumulation is essential.
Folate, also referred to as vitamin B9, represents a family of water-soluble compounds collectively known as “reduced folates,” such as tetrahydrofolate (THF) and its derivatives (e.g., 5-methyltetrahydrofolate) (9). These biologically active forms are essential for various physiological functions, including DNA synthesis, cell division, and the prevention of neural tube defects (10). Naturally occurring folates are found in a variety of foods, including leafy green vegetables, legumes, citrus fruits, and fortified cereals (9). Folic acid, the synthetic oxidized form of folate, is commonly used in food fortification and dietary supplements. In the United States, mandatory fortification of enriched cereal grain products with folic acid was authorized in 1996 and fully implemented in 1998 (11, 12). Over time, public health concerns have shifted from insufficient folate intake to potential risks associated with excessive intake (13).
Serum folate primarily reflects recent folate intake, and a low level in serum alone cannot differentiate between a temporary drop due to short-term dietary insufficiency and a more prolonged state of folate deficiency (14, 15). In contrast, red blood cell folate levels provide a more accurate assessment of long-term folate status, typically over a period of up to 4 months, and are commonly used to evaluate the effectiveness of folic acid supplementation and correct deficiencies (16). Research suggests that measuring folate in red blood cells offers the most reliable assessment (17).
Previous studies have demonstrated a correlation between elevated RBC folate levels and obesity (18, 19). However, the relationship between RBC folate and visceral adipose tissue remains unclear. Visceral fat accumulation in young and middle-aged adults is a significant predictor of future cardiovascular health, metabolic syndrome, and overall quality of life in later years, making it an important factor to address (20, 21). This age group is particularly relevant for studying visceral fat accumulation, as early development of visceral adiposity can have long-lasting effects on health, and interventions at this stage could significantly reduce future health risks. Therefore, this study aimed to investigate the association between RBC folate and visceral adipose tissue in young and middle-aged adults in the United States, with a focus on the potential role of folate as a determinant of visceral adiposity, based on prior findings linking RBC folate levels to obesity.
Methods
Study population
This cross-sectional study utilized data from four cycles of the National Health and Nutrition Examination Survey (NHANES) conducted between 2011–2012, 2013–2014, 2015–2016, and 2017–2018, managed by the Centers for Disease Control and Prevention (CDC). NHANES provides a comprehensive overview of the health and nutritional status of the non-institutionalized U.S. population. Participants were selected through a stratified, multistage probability sampling method, ensuring a representative sample that reflects the demographic diversity of the American population (22). The survey collects a wide range of health-related information, including demographic data, physical examination results, laboratory test outcomes, and dietary habits. Data collection was conducted by the National Center for Health Statistics (NCHS) following ethical guidelines and with approval from an ethics review board. Informed consent was obtained from all participants prior to their inclusion in the survey. The NHANES dataset is publicly available on the official website.1 For this study, only individuals aged 20 years and older who completed the survey were included. Pregnant women and participants with incomplete data on dual-energy X-ray absorptiometry (DXA) scans, RBC folate, or covariates were excluded.
Assessment of RBC folate
In the NHANES 2011–2018, RBC folate was assessed using a multi-step process. Initially, whole blood folate concentration was measured using a microbiologic assay. This measurement was then adjusted for RBC volume. Subsequently, serum total folate concentration, calculated as the sum of individual serum folate forms, was used to correct the RBC folate values. Individual serum folate forms were quantified using liquid chromatography–tandem mass spectrometry (LC–MS/MS). For folate forms with concentrations below the limit of detection (LOD), values were imputed as LOD divided by the square root of 2. The serum folate forms included in the calculation of total folate were 5-methyl-tetrahydrofolate, folic acid, 5-formyl-tetrahydrofolate, tetrahydrofolate, and 5,10-methenyl-tetrahydrofolate. This comprehensive approach, combining microbiologic assays with LC–MS/MS measurements, ensured a thorough evaluation of RBC folate levels.
Assessment of VAT mass
Whole-body DXA scans were performed on NHANES participants aged 8–59 years using Hologic Discovery model A densitometers. DXA is widely used for body composition analysis due to its high precision and efficiency. In this study, we specifically analyzed VAT mass at the L4-L5 vertebral level within the abdominal cavity, as measured using Hologic APEX 4.0 software. To meet our inclusion criteria, we included only participants aged 20 to 59 years who completed the survey. VAT mass was reported in grams.
Covariates
A comprehensive set of covariates, derived from existing literature, was evaluated to account for potential confounders (23–25). These covariates included demographic, socioeconomic, lifestyle, and health-related factors, such as age, sex, marital status, race/ethnicity, education level, poverty income ratio (PIR), body mass index (BMI), height, smoking status, alcohol consumption, physical activity, energy intake, total carbohydrates, total protein intake, total fat intake, estimated glomerular filtration rate (eGFR), and albumin levels. Race/ethnicity was classified into the following categories: non-Hispanic White, non-Hispanic Black, Mexican American, and other racial/ethnic groups (26). Marital status was grouped into two categories: individuals who were married or living with a partner, and those living alone (27). Education levels were stratified into three groups: less than high school, high school or equivalent, and more than high school (26). Family income was divided into three categories based on the PIR. PIR was categorized as ≤1.30, 1.31–3.50, and >3.50 (28). Smoking status was classified into three groups: never smokers (having smoked fewer than 100 cigarettes in their lifetime), current smokers, and former smokers (those who quit after smoking more than 100 cigarettes) (27). Alcohol consumption was self-reported and categorized as never (fewer than 12 drinks in a lifetime), former (having consumed ≥12 drinks in 1 year but not in the past year), mild (women consuming ≤1 drink and men ≤2 drinks per day), moderate (women consuming ≤2 drinks and men ≤3 drinks per day), or heavy (women consuming ≥3 drinks and men ≥4 drinks per day) (28). Physical activity was quantified based on the metabolic equivalent of task (MET) criteria, expressed in minutes per week (29). Renal function was assessed by calculating the eGFR using the Chronic Kidney Disease Epidemiology Collaboration (CKD-EPI) equation, a validated method for evaluating kidney function.
Dietary intake was assessed using two non-consecutive 24-h dietary recalls, with the average intake calculated for the analysis. The variables analyzed included total energy intake, total carbohydrates, total protein intake, and total fat intake. Folate intake was not included as a covariate due to collinearity with red blood cell folate levels, though specific folate intake data are provided in Table 1. Total folate intake, expressed as Dietary Folate Equivalents (DFE), accounts for the differing bioavailability of folate from natural food sources and synthetic folic acid (1 μg food folate = 1 μg DFE; 1 μg synthetic folic acid with food = 1.7 μg DFE) (30). Since folic acid is mandatorily added to grain products in the United States, total starch intake was calculated by subtracting total sugar and total dietary fiber from total carbohydrate intake to examine the relationship between starch consumption and RBC folate levels. This variable represents the combined intake of folate from natural sources and folic acid from fortified foods. The nutrient composition of recalled food items was determined using the USDA Food and Nutrient Database for Dietary Studies (FNDDS).2
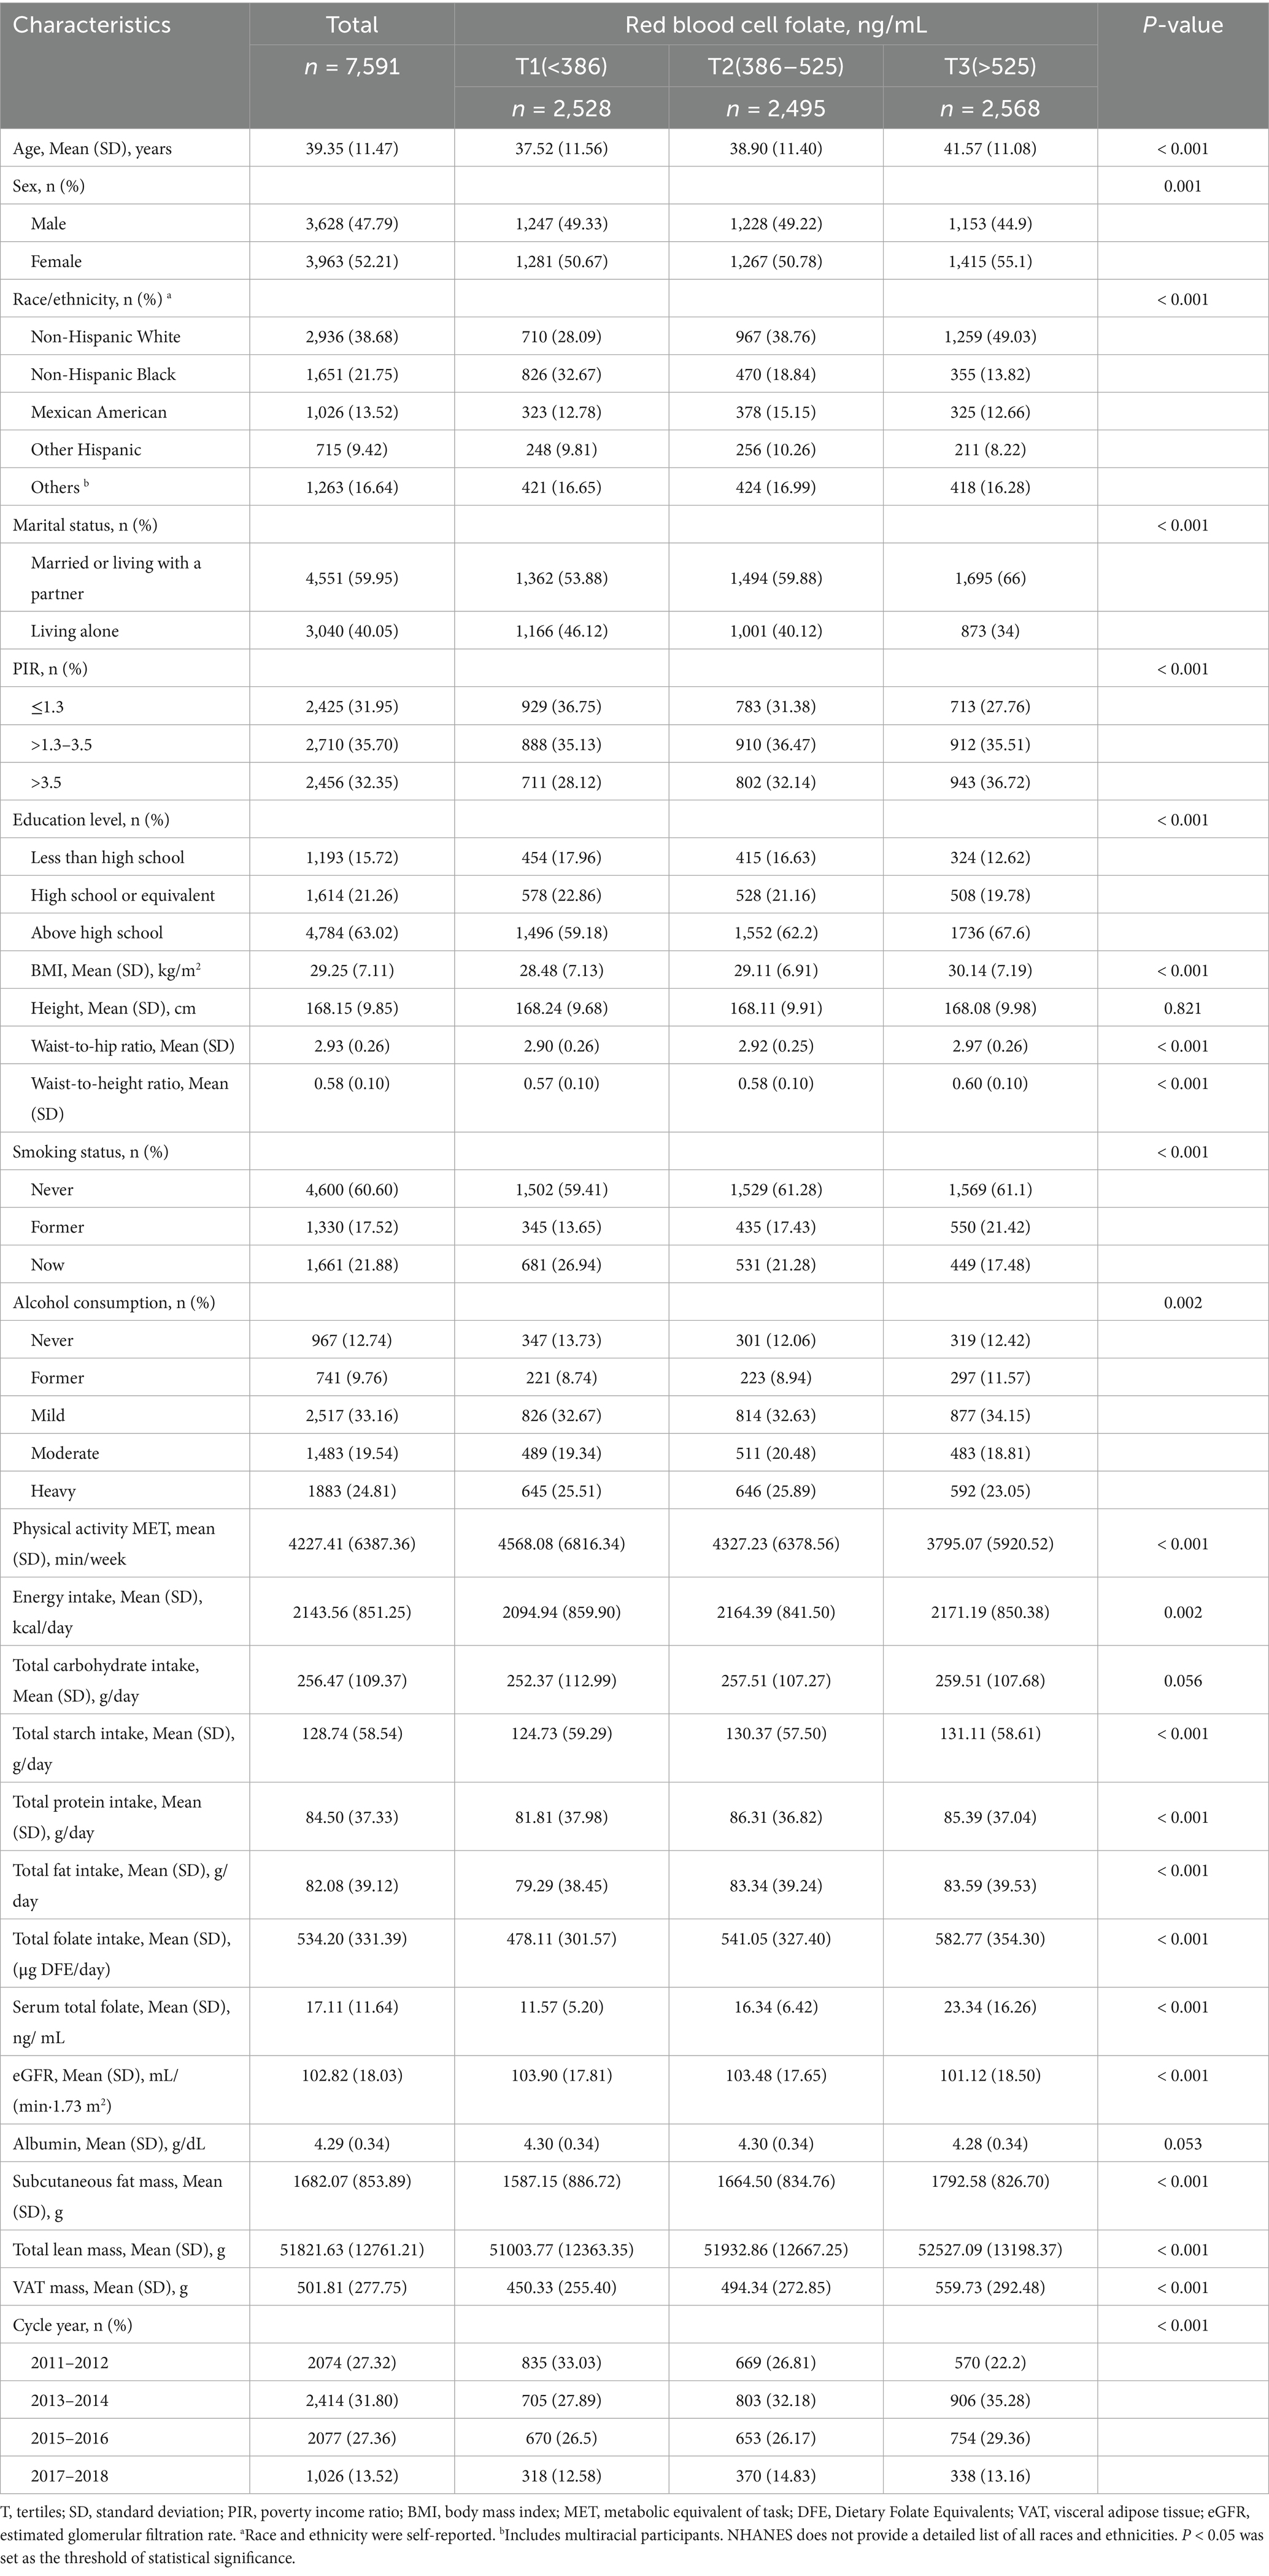
Table 1. Baseline characteristics by red blood cell folate level.
Statistical analysis
Unweighted counts and percentages are reported for categorical data, while continuous variables are presented as means with corresponding standard deviations. One-way analysis of variance (ANOVA) was used to assess differences in continuous variables across groups, and chi-square tests were employed to evaluate differences in categorical variables. To examine the relationship between RBC folate and VAT mass, a multivariate linear regression model was applied. Results are presented as regression coefficients (β) with 95% confidence intervals (CI). In Model 1, adjustments were made for demographic variables, including age, sex, marital status, race/ethnicity, PIR, and education level. Model 2 included additional adjustments for lifestyle factors, such as smoking status, alcohol consumption, physical activity, energy intake, total fat intake, total carbohydrate intake, and total protein intake, in addition to the variables adjusted for in Model 1. Model 3 incorporated further adjustments for height, eGFR, and albumin levels, in addition to the variables included in Model 2. Finally, Model 4 included additional adjustments for BMI, eGFR, and albumin levels, alongside the variables adjusted for Model 2.
A restricted cubic spline regression model was used to examine the dose–response relationship between RBC folate levels and visceral adipose tissue VAT mass. The knots for the spline were placed at the 5th, 35th, 65th, and 95th percentiles of RBC folate. This model was adjusted for the covariates specified in Model 4. Additionally, a two-piecewise linear regression model was applied to identify potential threshold effects, adjusting for relevant confounders.
Linear regression was used for interaction and subgroup analyses, stratified by age, sex, race/ethnicity, PIR, smoking status, alcohol consumption, physical activity, and BMI, with stratification factors adjusted for a spectrum of covariates in Model 4. Age was categorized into two groups: 20–39 years and 40–59 years. This division ensures balanced subgroup sizes, and the study by Shen et al. suggests that 40 years may be a key transition point in aging, with significant physiological and metabolic changes occurring around this age, particularly in cardiovascular health, lipid metabolism, and immune regulation (31). Physical activity was classified into three levels: low (MET score <600 per week), moderate (600–3,000), and vigorous (>3,000) (32). BMI was categorized into three groups: <25, 25–29.9, and ≥30 kg/m2 (33).
A sensitivity analysis was performed to assess the robustness of the results. Missing covariate data were handled using multiple imputations, which were based on five replications and the chained equation approach implemented in the R mice procedure. This method was employed to maximize statistical power and minimize bias arising from missing data. The covariates imputed included age, sex, PIR, race/ethnicity, education level, marital status, smoking status, alcohol consumption, physical activity, energy intake, total fat intake, total carbohydrate intake, total protein intake, BMI, eGFR, and albumin. Five datasets were generated and analyzed together to produce pooled results.
No formal power calculation was performed, as the sample size was determined by the available data. All analyses were conducted using R Statistical Software (Version 4.2.2,3 The R Foundation) and the Free Statistics analysis platform (Version 1.9.2, Beijing, China).4 Descriptive statistics were computed for all participants, and statistical significance was evaluated using two-tailed tests with a p-value of <0.05.
Results
Baseline characteristics of the study population
A total of 7,591 individuals met the inclusion criteria and were included in the final analysis. The selection process is detailed in Figure 1. The baseline characteristics of participants aged 20–59 years are presented in Table 1. The mean age of participants was 39.35 (11.47) years, with 3,628 (47.79%) being male. Participants were stratified into three groups based on tertiles of RBC folate: Tertile 1 (T1, n = 2,528; <386 ng/mL), Tertile 2 (T2, n = 2,495; 386–525 ng/mL), and Tertile 3 (T3, n = 2,568; >525 ng/mL). The mean visceral adipose tissue (VAT) mass was 501.81 (277.75) g, with T1 exhibiting lower VAT levels compared to the other groups.
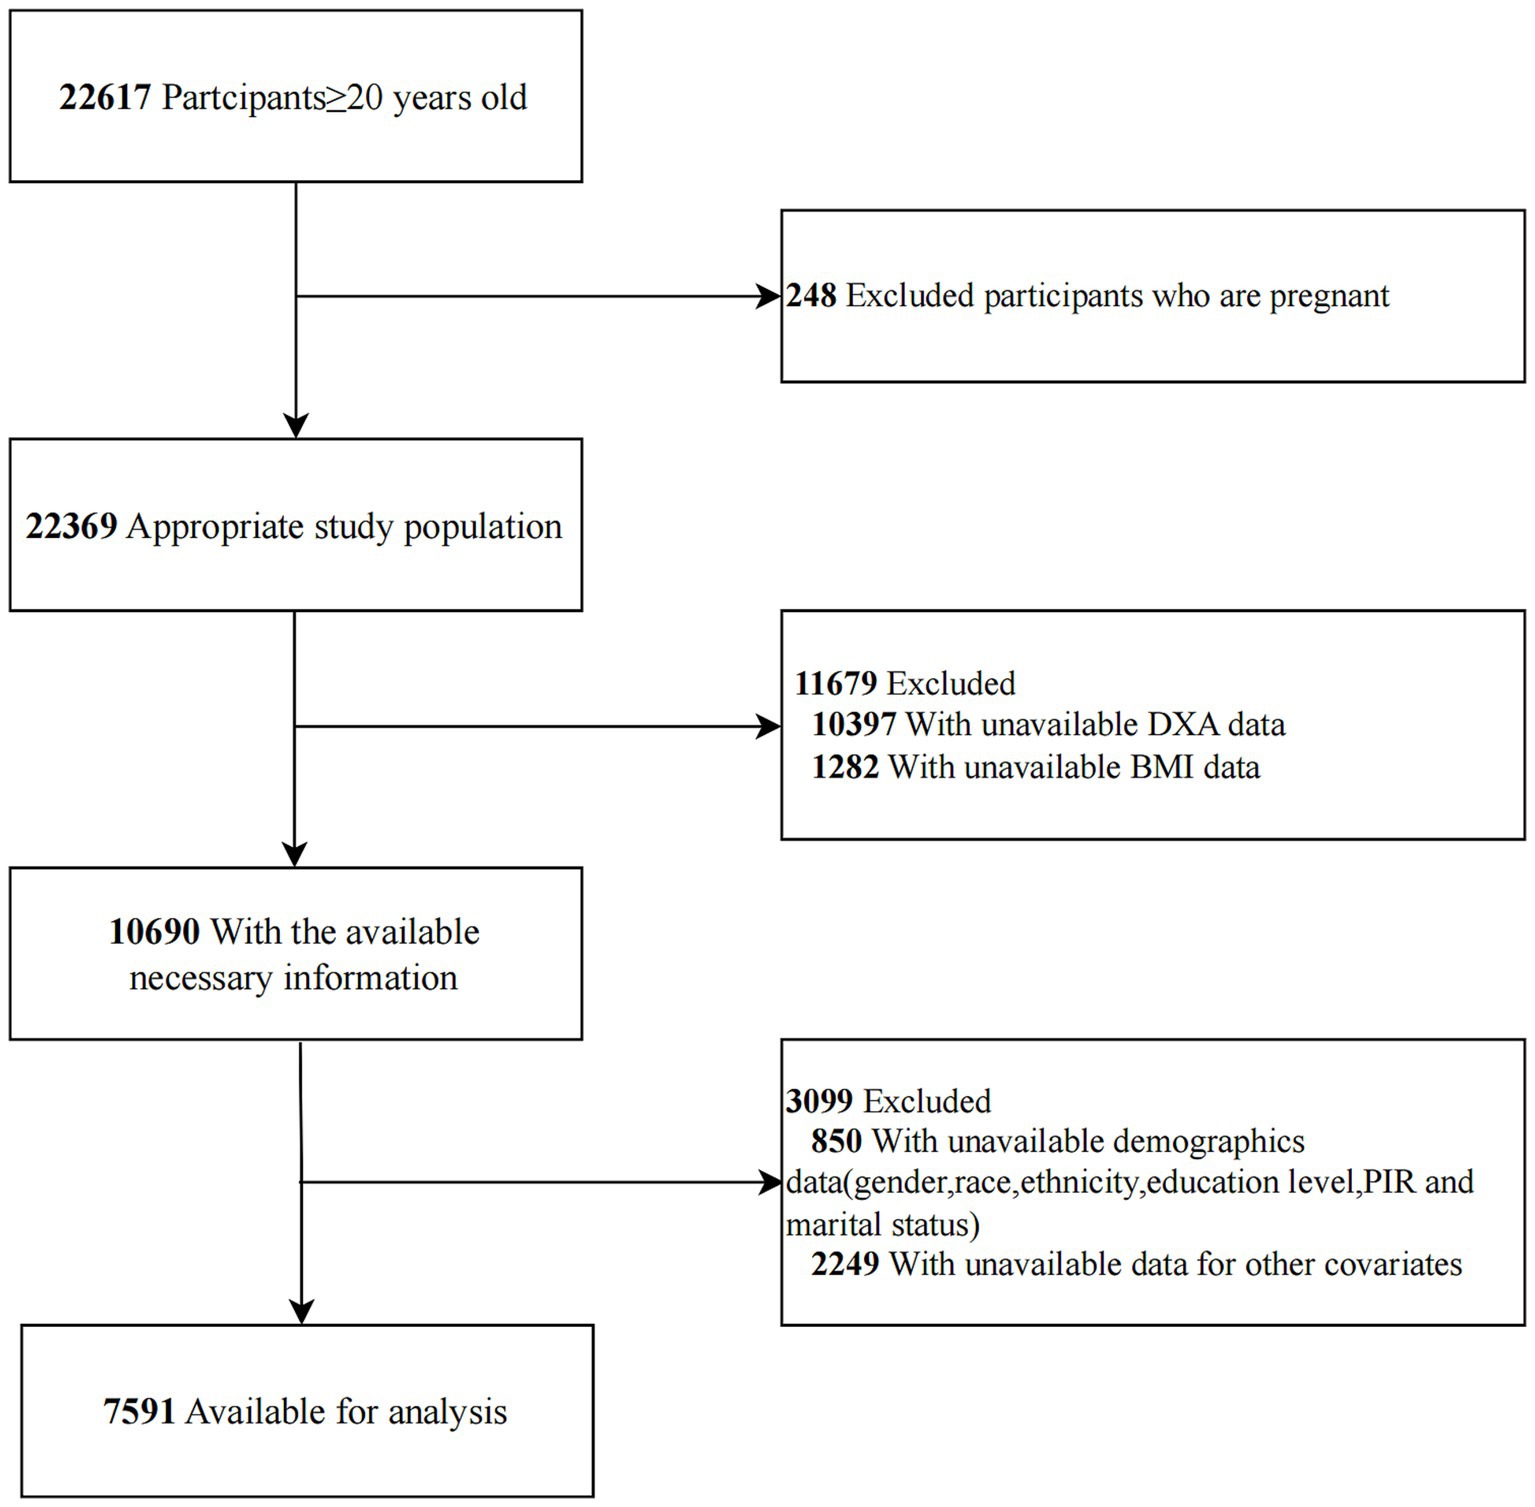
Figure 1. Flowchart of participant selection from NHANES 2011–2018.
Elevated RBC folate levels were observed among older adults, females, non-Hispanic White individuals, who were married or cohabiting, nonsmokers, and those with lower levels of physical activity. These higher RBC folate levels were also associated with increased BMI, higher waist - to - hip ratio, higher waist - to - height ratio, greater subcutaneous fat mass, and higher total lean mass. Additionally, elevated RBC folate levels were linked to higher educational attainment, as well as increased energy intake, greater total carbohydrate intake, higher starch intake, and elevated total folate and fat intake. Lower eGFR and higher serum folate levels were also found to be associated with elevated RBC folate levels.
Relationship between RBC folate and VAT
Univariate analysis revealed significant associations between VAT mass and several factors, including age, sex, race/ethnicity, marital status, education level, smoking status, alcohol consumption, physical activity, BMI, height, total fat intake, total carbohydrate intake, starch intake, and total folate intake. Additionally, VAT mass was found to be associated with albumin levels, eGFR, and RBC folate levels (Table 2).
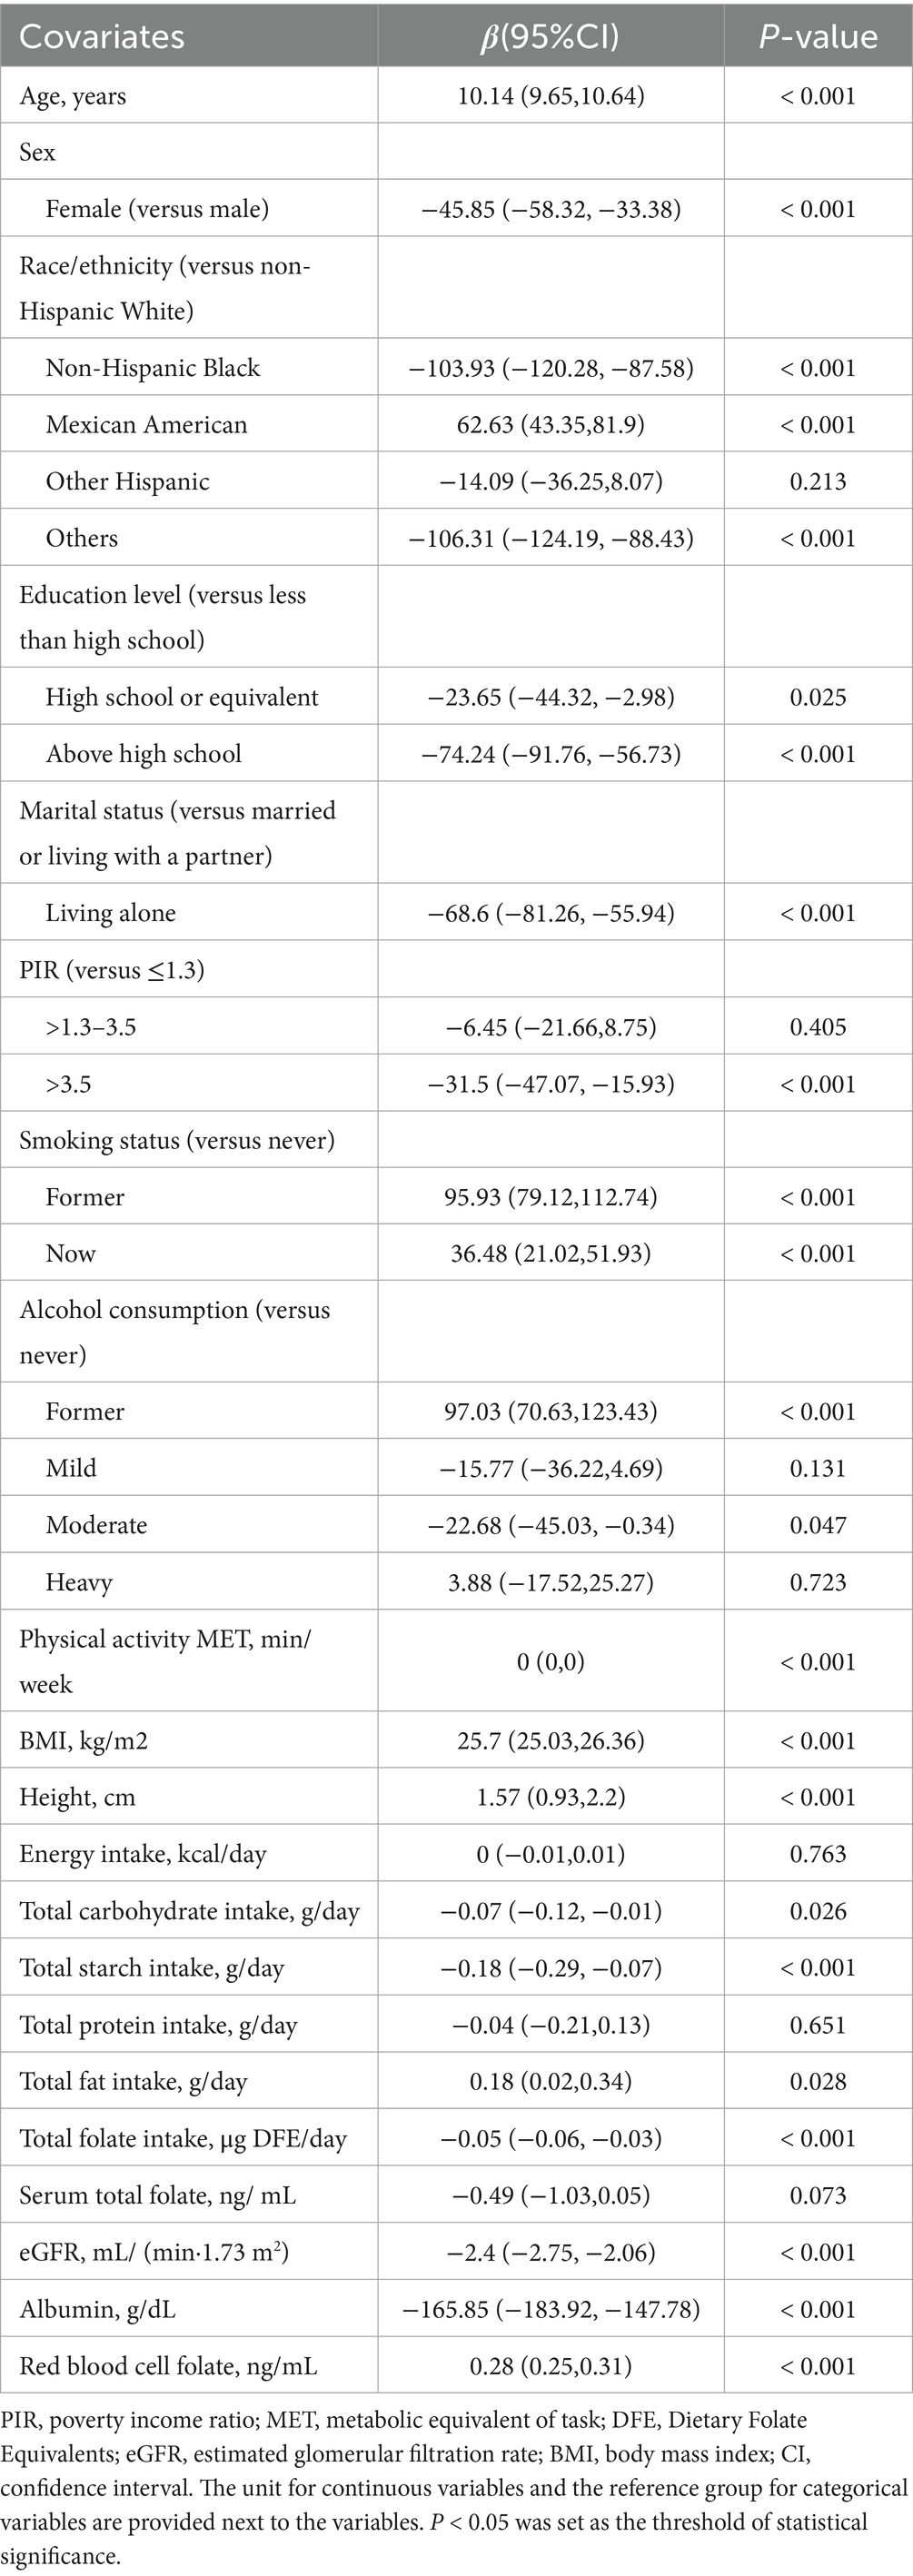
Table 2. Association of covariates and visceral adipose tissue mass.
The results of the multivariable linear regression analysis examining the association between RBC folate and VAT mass are summarized in Table 3. After adjusting for potential confounders in Model 3, RBC folate was positively associated with VAT mass [β (95% CI), 0.15 (0.13, 0.18)]. Participants in the second tertile (T2: 386–525 ng/mL) and third tertile (T3: >525 ng/mL) had an increase in VAT mass of 15.88 g (95% CI, 2.77–28.99) and 52.34 g (95% CI, 38.91–65.77), respectively, compared to those in the lowest tertile (T1: <386 ng/mL). After further adjustment for potential confounders in Model 4, RBC folate remained positively associated with VAT mass [β (95% CI), 0.05 (0.03, 0.07)]. Participants in the third tertile (T3: >525 ng/mL) exhibited an increase in VAT mass of 15.04 g (95% CI, 5.21–24.87) compared to those in the lowest tertile (T1: <386 ng/mL). The p for trend was 0.003.
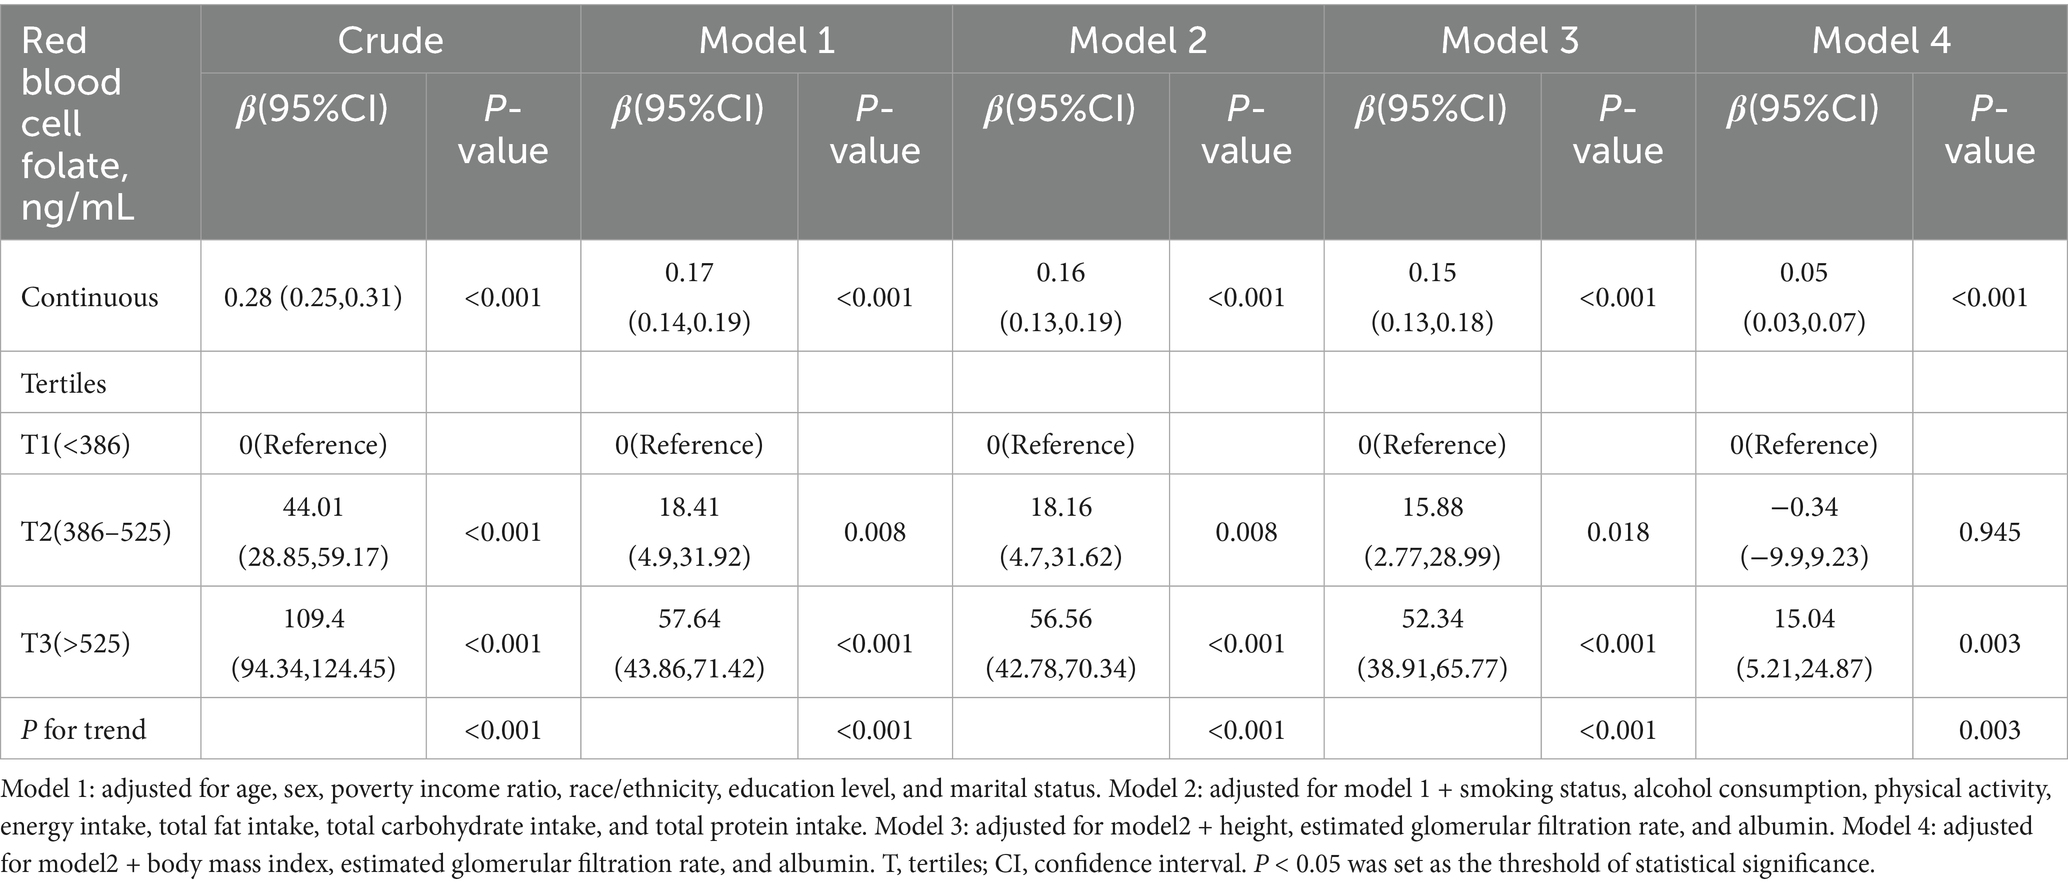
Table 3. Association between red blood cell folate and visceral adipose tissue mass.
The dose–response relationship between RBC folate and VAT mass followed a nonlinear J-shaped curve (Figure 2; p for non-linearity < 0.001). A threshold effect was identified at an RBC folate level of 397.18 ng/mL (Table 4). Below this threshold, the association was negative [β (95% CI): −0.10 (−0.20, −0.01)], while above the threshold, the association became positive [β (95% CI): 0.06 (0.03, 0.09)].
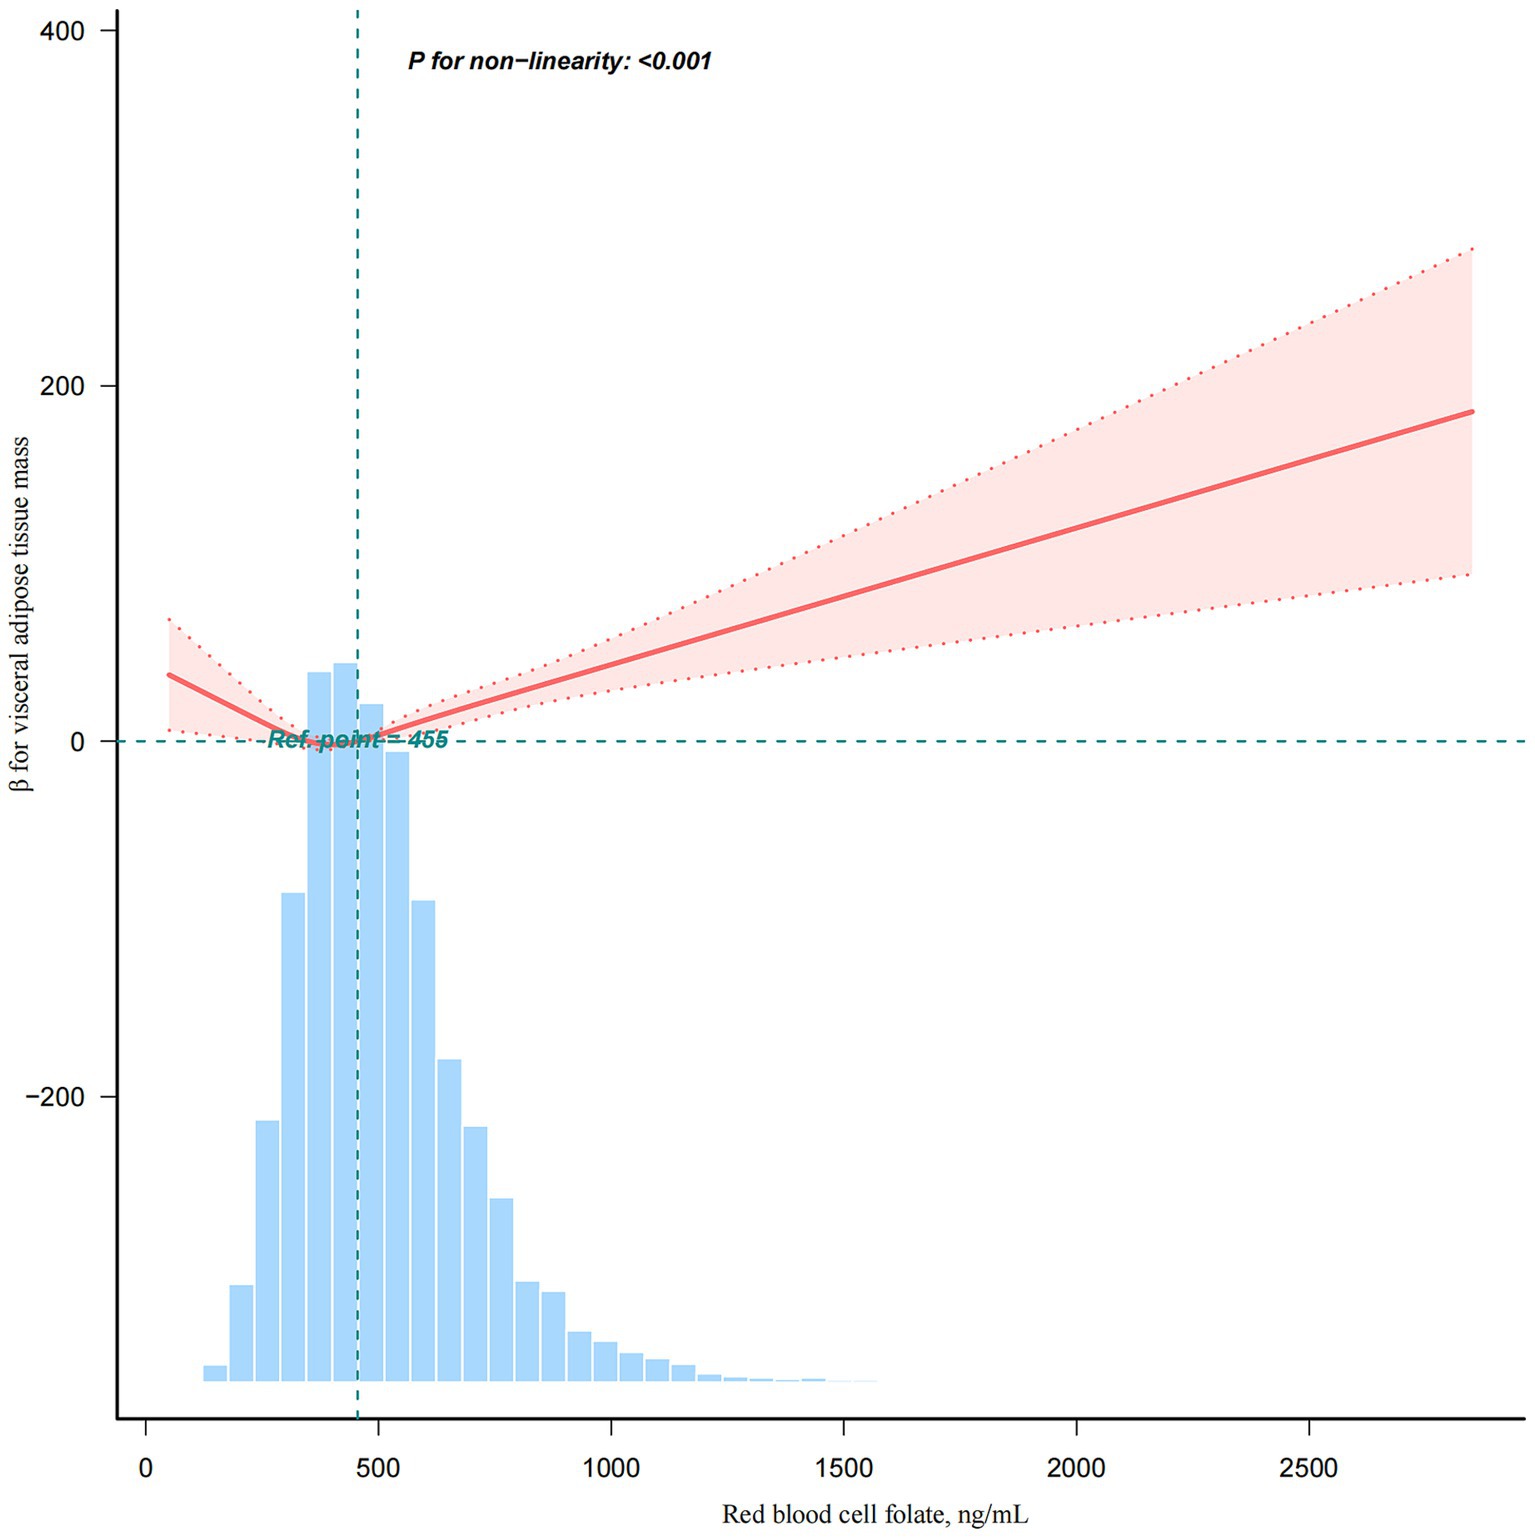
Figure 2. A non-linear association between red blood cell folate levels and visceral adipose tissue mass. This analysis was adjusted for age, sex, poverty income ratio, race/ethnicity, education level, marital status, smoking status, alcohol consumption, physical activity, energy intake, total fat intake, total carbohydrate intake, total protein intake, body mass index, estimated glomerular filtration rate, and albumin.
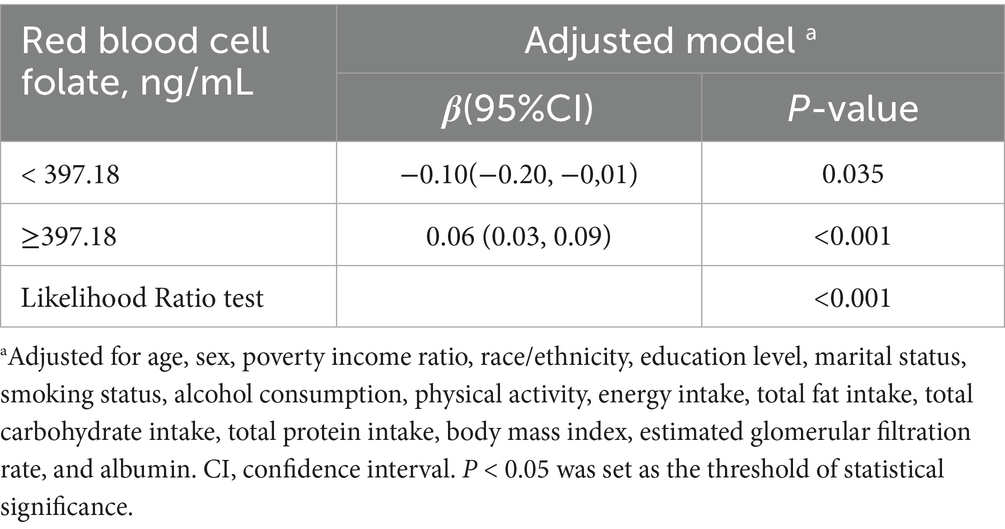
Table 4. Threshold effect analysis of the relationship of red blood cell folate with visceral adipose tissue mass.
Subgroup analyses
Subgroup analyses indicated that the association between RBC folate and VAT was generally consistent across various demographic and lifestyle factors, including age, sex, marital status, PIR, smoking status, alcohol consumption, physical activity, and BMI (Figure 3). However, significant interactions were observed for sex, race/ethnicity, alcohol consumption, and BMI. While RBC folate was positively correlated with VAT in most subgroups, a distinct finding emerged among non-Hispanic Black individuals, where RBC folate was negatively associated with VAT [β (95% CI), −0.04 (−0.08 to 0.01)]. Additionally, the positive correlation between RBC folate and VAT persisted across all BMI categories (<25, 25–29.9, and ≥30 kg/m2).
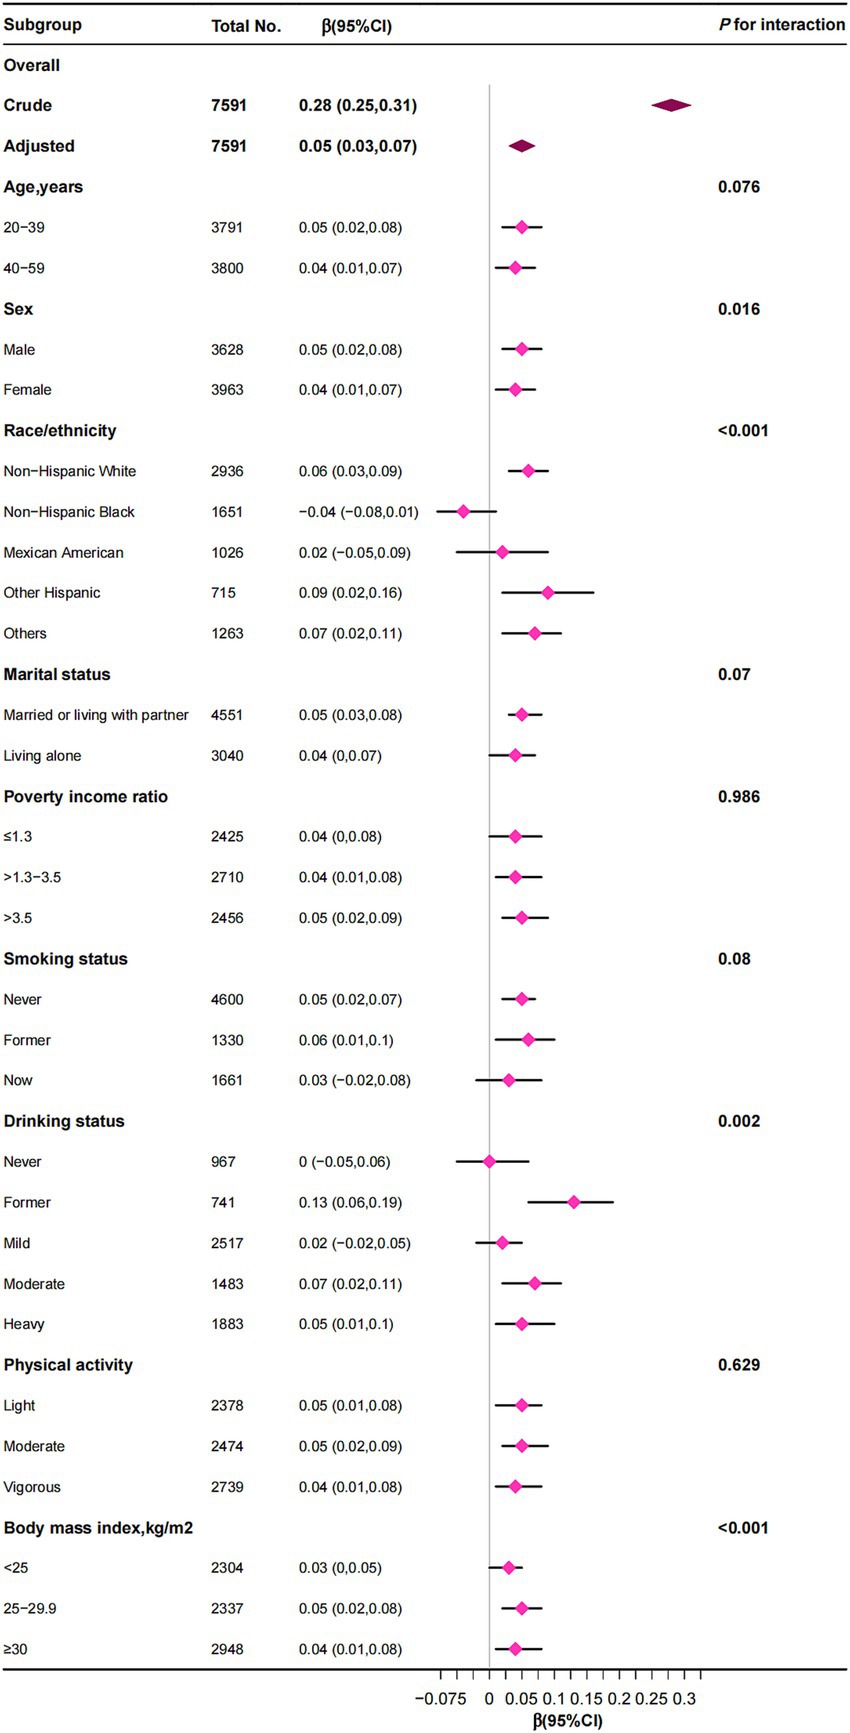
Figure 3. The correlation between red blood cell folate levels and visceral adipose tissue mass was examined, with stratification factors adjusted for a spectrum of covariates encompassing age, sex, poverty income ratio, race/ethnicity, education level, marital status, smoking status, alcohol consumption, physical activity, energy intake, total fat intake, total carbohydrate intake, total protein intake, body mass index, estimated glomerular filtration rate, and albumin.
Sensitivity analyses
To address missing covariate data for 10,690 participants, we conducted multiple imputations with five iterations. Five datasets were created and analyzed together to produce pooled results (Table 5). After adjusting for confounders in Model 4, RBC folate remained positively associated with VAT mass [β (95% CI), 0.05 (0.03, 0.07)]. Participants in the third tertile (T3: >525 ng/mL) exhibited an increase in VAT mass of 15.27 g (95% CI, 5.41–25.12) compared to those in the lowest tertile (T1: <386 ng/mL).
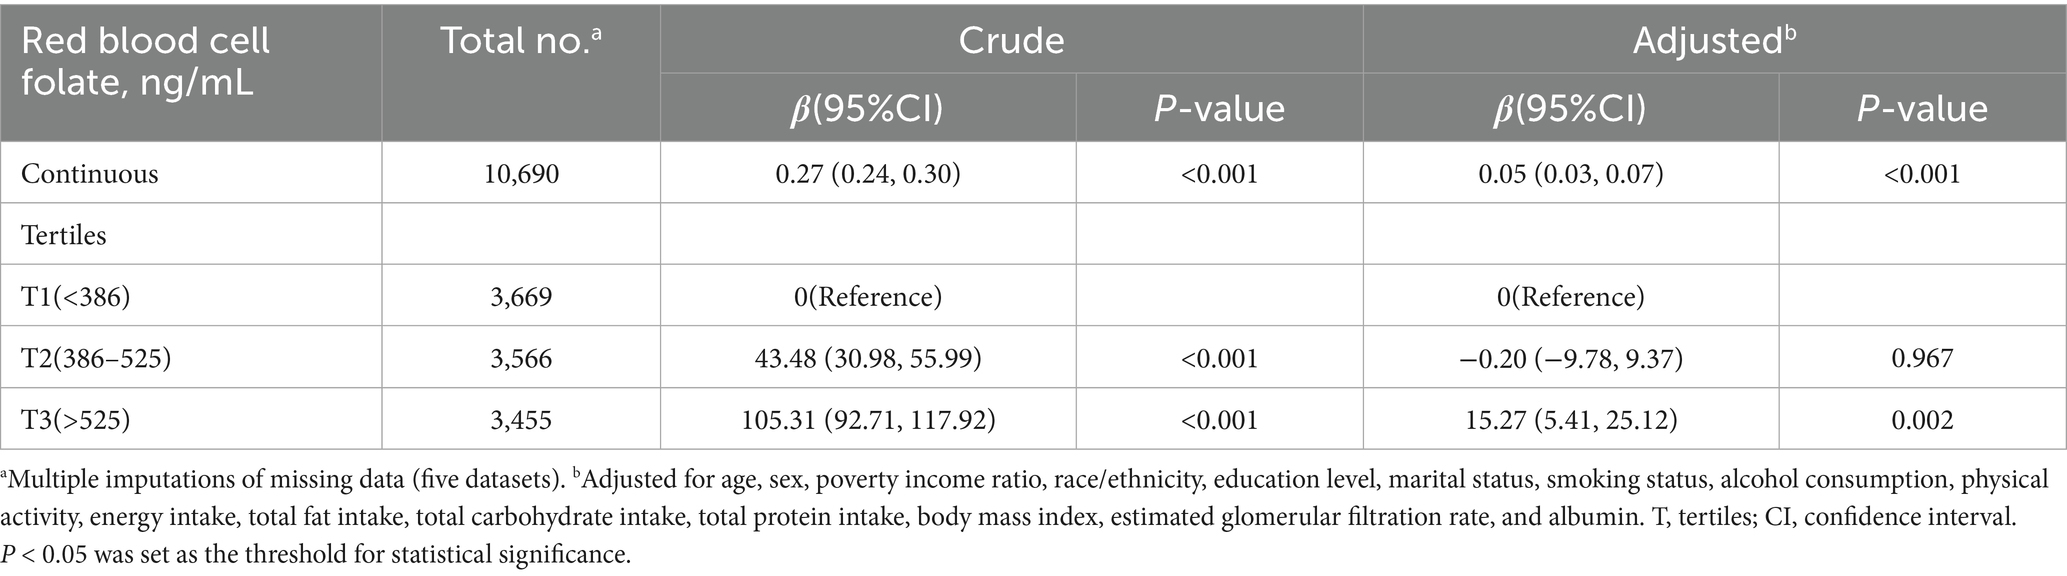
Table 5. Sensitivity analysis: association between red blood cell folate and visceral adipose tissue mass using pooled results from five imputed datasets.
Discussion
This cross-sectional study identified a threshold effect at an RBC folate level of 397.18 ng/mL, indicating a non-linear relationship between RBC folate levels and VAT mass. Below this threshold, the association was negative, while above it, the association became positive.
According to WHO guidelines (34), RBC folate levels above 400 ng/mL (906 nmol/L) are typically considered sufficient for preventing neural tube defect-affected pregnancies in women of reproductive age. However, this threshold is specific to that population and does not apply to the general population. Our study suggests that RBC folate may influence visceral fat distribution, particularly when levels exceed 397.18 ng/mL. However, there is no consensus on a general RBC folate threshold for the population, and further research is needed to establish a broader reference range. Previous studies show that both low and high RBC folate levels are linked to metabolic disturbances and obesity (18, 35, 36), which aligns with the threshold effect we observed. This highlights the complexity of folate’s role in metabolic health and suggests that the impact of folate on metabolic outcomes may vary across different ranges.
While the relationship between RBC folate and VAT has been underexplored, our findings support previous studies indicating a link between RBC folate and metabolic markers such as BMI and metabolic diseases (17, 18, 33, 36). For example, Bird et al. found that while obesity is associated with lower serum folate levels and dietary intake, RBC folate is positively correlated with obesity, suggesting that RBC folate may be a more reliable marker of folate status in obese individuals (18). Li et al. demonstrated that elevated RBC folate levels were associated with an increased risk of NAFLD, a condition linked to central obesity (33). Our study further supports RBC folate as a potential biomarker for metabolic dysfunction (33).
In our analysis, we adjusted for height in Model 3 and for BMI in Model 4 to examine these associations. Although the effect size decreased significantly with the inclusion of BMI, the association remained statistically significant. All subsequent analyses, including curve fitting, threshold analysis, and subgroup analysis, also accounted for BMI. Our findings align with previous research suggesting a link between RBC folate levels and obesity. Specifically, we found that when BMI was included as a covariate, the effect size decreased, indicating that RBC folate levels are associated with obesity in a broader sense, not limited to visceral fat alone. This suggests that both visceral and non-visceral fat mass may be linked to RBC folate levels.
However, after adjusting for BMI in Model 4 and in subsequent analyses, the association between RBC folate and VAT remained statistically significant. We also observed consistent positive correlations between RBC folate and VAT across all BMI subgroups (<25, 25–29.9, and ≥30 kg/m2). The results suggest that the relationship between RBC folate and VAT may exist independently of BMI. These findings underscore the importance of conducting further cohort studies to better understand the causal relationship between RBC folate and VAT, particularly in the context of obesity and metabolic dysfunction.
In subgroup analyses, interaction effects were also observed with sex, race, and alcohol consumption. First, in the sex subgroup, the effect size for women was β = 0.04, while for men it was β = 0.05. This difference is likely due to estrogen’s protective effect on visceral fat accumulation in women, particularly in young and middle-aged adults (37). Second, subgroup analyses indicated a potential negative association between RBC folate and VAT among non-Hispanic Black individuals. This finding may reflect genetic predispositions, dietary patterns, or variations in folate metabolism unique to this population. Racial and ethnic differences in obesity and fat distribution are well-documented and may partially explain these findings (38, 39). Furthermore, the methylenetetrahydrofolate reductase (MTHFR) 677C → T polymorphism, a genetic variant that reduces enzyme activity and alters folate metabolism, is more prevalent in Asian and Latin American populations but less common in African populations (40). Third, interaction effects were observed within the alcohol consumption subgroup, likely because alcohol intake is related to both folate metabolism and obesity (9, 41).
In the United States, folate is primarily added to cereals through a mandatory fortification program, which has led to increased folate intake, particularly from carbohydrate-rich fortified foods, such as breakfast cereals, commonly consumed by many individuals. As shown in Table 1, carbohydrate and starch intake are positively correlated with RBC folate levels. However, the univariate analysis in Table 2 reveals a negative correlation between carbohydrate and starch intake and VAT, which may seem counterintuitive. Carbohydrates typically come from both healthy sources (e.g., whole grains) and less healthy sources (e.g., refined grains and processed foods). Previous studies have shown that excessive carbohydrate intake, particularly from refined sources, is associated with obesity and metabolic disturbances. The “carbohydrate-insulin model” has been proposed to explain how excessive carbohydrate consumption can lead to obesity and its downstream cardiometabolic complications (42, 43). However, some studies suggest that the consumption of high-quality carbohydrates, such as whole grains (particularly oats and barley) and legumes, is associated with weight loss, as well as a reduction in the risk of diabetes, cardiovascular disease, and cardiovascular mortality (44). Additionally, resistant starch (RS), the indigestible portion of starch, has been studied for its potential effects on reducing obesity (45). One possible explanation for the negative correlation between carbohydrate intake and VAT in our study is that increased grain consumption, particularly through fortified foods, may be linked to reduced fat intake, which could result in less pronounced VAT accumulation. This relationship, however, remains complex, and further research is needed to fully understand how carbohydrate intake, especially from fortified foods, influences fat distribution and metabolic outcomes.
The relationship between RBC folate levels and visceral adipose tissue (VAT) accumulation is complex and not fully understood. One potential explanation is that obesity itself alters folate metabolism, potentially leading to higher RBC folate levels. In obese individuals, impaired nutrient absorption and altered fat storage dynamics can contribute to changes in folate status (46–49). Additionally, vitamin B12 plays a critical role in lipid metabolism, and its deficiency can disrupt lipid synthesis, insulin resistance, and mitochondrial function—all of which are associated with obesity-related metabolic disturbances (50, 51). Elevated methylmalonic acid (MMA), a biomarker of B12 deficiency, is often observed in these conditions. Studies suggest that high folate levels in the presence of B12 deficiency may exacerbate metabolic disturbances (52, 53), further complicating the relationship between folate status and VAT accumulation. However, whether elevated RBC folate levels directly contribute to VAT accumulation or merely reflect broader metabolic changes related to obesity remains unclear. Further research is needed to clarify these mechanisms and their implications for metabolic health.
Although the NHANES database employs weighted analysis to make the data representative of the U. S. population, our study did not apply weights. The primary focus of our analysis was the association between RBC folate and VTA mass, rather than estimating the prevalence of visceral obesity in the general U. S. population. As such, we used unweighted data to ensure the analysis accurately reflects the characteristics of our study sample, without adjustments intended to generalize to the broader population. This approach minimizes potential biases from weighting procedures and enhances the transparency of our data representation.
This study has several strengths, including its use of the NHANES database, which is a nationally representative and demographically diverse dataset of U. S. adults. It is the first to establish a dose–response relationship between RBC folate and VAT, and the comprehensive adjustment for multiple covariates enhances the validity of the findings. Additionally, the application of multiple imputations for sensitivity analysis helps mitigate potential bias from missing data. However, there are limitations. The study sample was restricted to U. S. adults aged 20–59 years, limiting the generalizability of the results to other age groups or populations. Moreover, the cross-sectional design precludes causal inferences. Longitudinal studies are needed to elucidate the causal mechanisms linking RBC folate to VAT accumulation.
Conclusion
In conclusion, this study identifies a non-linear relationship between RBC folate levels and VAT, with a threshold effect at an RBC folate level of 397.18 ng/mL. These findings underscore the need for further research to elucidate the mechanisms underlying this relationship, particularly in the context of obesity and metabolic disturbances. While RBC folate holds potential as a biomarker for metabolic risk, longitudinal studies are essential to establish causality and better understand how changes in folate status may influence VAT accumulation.
Data availability statement
Publicly available datasets were analyzed in this study. This data can be found here: The data supporting this study’s findings are available in NHANES at: https://www.cdc.gov/nchs/nhanes/index.htm.
Ethics statement
The studies involving humans were approved by National Center for Health Statistics Research Ethics Review Board. The studies were conducted in accordance with the local legislation and institutional requirements. Written informed consent for participation in this study was provided by the participants’ legal guardians/next of kin.
Author contributions
CJ: Conceptualization, Data curation, Formal analysis, Investigation, Methodology, Software, Visualization, Writing – original draft, Writing – review & editing. JL: Conceptualization, Data curation, Formal analysis, Investigation, Methodology, Software, Visualization, Writing – original draft, Writing – review & editing. HY: Data curation, Software, Visualization, Writing – original draft. XL: Data curation, Software, Visualization, Writing – review & editing. LW: Data curation, Software, Visualization, Writing – review & editing. QL: Data curation, Software, Visualization, Writing – review & editing. BZ: Conceptualization, Project administration, Supervision, Writing – review & editing.
Funding
The author(s) declare that financial support was received for the research and/or publication of this article. The study was supported by The Third Division Tumxuk City Science and Technology Innovation Talent Program under Grant Number KY2025RC03 and the China Postdoctoral Science Foundation under Grant Number 2024M761177.
Acknowledgments
We extend our gratitude to Huanxian Liu from the Neurology Department and Jie Liu from the Vascular and Endovascular Surgery Department at the Chinese PLA General Hospital for their invaluable assistance. Their expertise in statistical analysis and guidance on study design has been crucial in advancing our research, significantly enhancing its quality and rigor.
Conflict of interest
The authors declare that the research was conducted in the absence of any commercial or financial relationships that could be construed as a potential conflict of interest.
Generative AI statement
The authors declare that no Gen AI was used in the creation of this manuscript.
Publisher’s note
All claims expressed in this article are solely those of the authors and do not necessarily represent those of their affiliated organizations, or those of the publisher, the editors and the reviewers. Any product that may be evaluated in this article, or claim that may be made by its manufacturer, is not guaranteed or endorsed by the publisher.
Footnotes
References
1. GBD 2015 Obesity CollaboratorsAfshin, A, Forouzanfar, MH, Reitsma, MB, Sur, P, Estep, K, et al. Health effects of overweight and obesity in 195 countries over 25 years. N Engl J Med. (2017) 377:13–27. doi: 10.1056/NEJMoa1614362
2. Polyzos, SA, Kountouras, J, and Mantzoros, CS. Obesity and nonalcoholic fatty liver disease: from pathophysiology to therapeutics. Metabolism. (2019) 92:82–97. doi: 10.1016/j.metabol.2018.11.014
3. Brown, OI, Drozd, M, McGowan, H, Giannoudi, M, Conning-Rowland, M, Gierula, J, et al. Relationship among diabetes, obesity, and cardiovascular disease phenotypes: a UK biobank cohort study. Diabetes Care. (2023) 46:1531–40. doi: 10.2337/dc23-0294
4. Avgerinos, KI, Spyrou, N, Mantzoros, CS, and Dalamaga, M. Obesity and cancer risk: emerging biological mechanisms and perspectives. Metabolism. (2019) 92:121–35. doi: 10.1016/j.metabol.2018.11.001
5. Rubino, F, Cummings, DE, Eckel, RH, Cohen, RV, Wilding, JPH, Brown, WA, et al. Definition and diagnostic criteria of clinical obesity. Lancet Diabetes Endocrinol. (2025) 13:221–62. doi: 10.1016/S2213-8587(24)00316-4
6. Amato, MC, Giordano, C, Galia, M, Criscimanna, A, Vitabile, S, Midiri, M, et al. Visceral adiposity index: a reliable indicator of visceral fat function associated with cardiometabolic risk. Diabetes Care. (2010) 33:920–2. doi: 10.2337/dc09-1825
7. Neeland, IJ, Ross, R, Després, J-P, Matsuzawa, Y, Yamashita, S, Shai, I, et al. Visceral and ectopic fat, atherosclerosis, and cardiometabolic disease: a position statement. Lancet Diabetes Endocrinol. (2019) 7:715–25. doi: 10.1016/S2213-8587(19)30084-1
8. Wedell-Neergaard, A-S, Eriksen, L, Grønbæk, M, Pedersen, BK, Krogh-Madsen, R, and Tolstrup, J. Low fitness is associated with abdominal adiposity and low-grade inflammation independent of BMI. PLoS One. (2018) 13:e0190645. doi: 10.1371/journal.pone.0190645
9. Shulpekova, Y, Nechaev, V, Kardasheva, S, Sedova, A, Kurbatova, A, Bueverova, E, et al. The concept of folic acid in health and disease. Mol (Basel). (2021) 26:3731. doi: 10.3390/molecules26123731
10. Chen, X, Zhang, Y, Chen, H, Jiang, Y, Wang, Y, Wang, D, et al. Association of maternal folate and vitamin B12 in early pregnancy with gestational diabetes mellitus: a prospective cohort study. Diabetes Care. (2021) 44:217–23. doi: 10.2337/dc20-1607
11. Institute of Medicine (US) Standing Committee on the Scientific Evaluation of Dietary Reference Intakes and its Panel on Folate, Other B Vitamins, and Choline. Dietary reference intakes for thiamin, riboflavin, niacin, vitamin B6, folate, vitamin B12, pantothenic acid, biotin, and choline. Washington, DC: National Academies Press (US). (1998). Available online at: http://www.ncbi.nlm.nih.gov/books/NBK114310/ (Accessed November 16, 2024).
12. Crider, KS, Bailey, LB, and Berry, RJ. Folic acid food fortification-its history, effect, concerns, and future directions. Nutrients. (2011) 3:370–84. doi: 10.3390/nu3030370
13. Fardous, AM, and Heydari, AR. Uncovering the hidden dangers and molecular mechanisms of excess folate: a narrative review. Nutrients. (2023) 15:4699. doi: 10.3390/nu15214699
14. Bailey, LB, Stover, PJ, McNulty, H, Fenech, MF, Gregory, JF, Mills, JL, et al. Biomarkers of nutrition for development-folate review. J Nutr. (2015) 145:1636S–80S. doi: 10.3945/jn.114.206599
15. Zaric, BL, Obradovic, M, Bajic, V, Haidara, MA, Jovanovic, M, and Isenovic, ER. Homocysteine and hyperhomocysteinaemia. Curr Med Chem. (2019) 26:2948–61. doi: 10.2174/0929867325666180313105949
16. Yetley, EA, Pfeiffer, CM, Phinney, KW, Fazili, Z, Lacher, DA, Bailey, RL, et al. Biomarkers of folate status in NHANES: a roundtable summary. Am J Clin Nutr. (2011) 94:303S–12S. doi: 10.3945/ajcn.111.013011
17. Mason, JB. Biomarkers of nutrient exposure and status in one-carbon (methyl) metabolism. J Nutr. (2003) 133:941S–7S. doi: 10.1093/jn/133.3.941S
18. Shen, M, Chaudhry, SH, MacFarlane, AJ, Gaudet, L, Smith, GN, Rodger, M, et al. Serum and red-blood-cell folate demonstrate differential associations with BMI in pregnant women. Public Health Nutr. (2016) 19:2572–9. doi: 10.1017/S1368980016000756
19. Bird, JK, Ronnenberg, AG, Choi, S-W, Du, F, Mason, JB, and Liu, Z. Obesity is associated with increased red blood cell folate despite lower dietary intakes and serum concentrations. J Nutr. (2015) 145:79–86. doi: 10.3945/jn.114.199117
20. Strasser, B, Arvandi, M, Pasha, EP, Haley, AP, Stanforth, P, and Tanaka, H. Abdominal obesity is associated with arterial stiffness in middle-aged adults. Nutr Metab Cardiovasc Dis. (2015) 25:495–502. doi: 10.1016/j.numecd.2015.01.002
21. Hull, HR, Thornton, J, Wang, J, Pierson, RN, Kaleem, Z, Pi-Sunyer, X, et al. Fat-free mass index: changes and race/ethnic differences in adulthood. Int J Obes (2005) (2011) 35:121–127. doi: 10.1038/ijo.2010.111
22. National Center for Health Statistics (U.S.) ed. National health and nutrition examination survey: Analytic guidelines, 1999–2010, vol. 16. Hyattsville, MD: U.S. Department of Health and Human Services, Centers for Disease Control and Prevention, National Center for Health Statistics (2013).
23. Twum, F, Morte, N, Wei, Y, Nkemjika, S, Liu, F, and Zhang, J. Red blood cell folate and cardiovascular deaths among hypertensive adults, an 18-year follow-up of a national cohort. Hypertens Res Off J Jpn Soc Hypertens. (2020) 43:938–47. doi: 10.1038/s41440-020-0482-5
24. Chen, T, and Huang, Y. Red blood cell folate and benign prostatic hyperplasia: results from the NHANES 2001-2008. Aging Male. (2024) 27:2336625. doi: 10.1080/13685538.2024.2336625
25. Tao, C, Huang, Y, Huang, X, Li, Z, Fan, Y, Zhang, Y, et al. Association between blood manganese levels and visceral adipose tissue in the United States: a population-based study. Nutrients. (2022) 14:4770. doi: 10.3390/nu14224770
26. Liu, H, Wang, Q, Dong, Z, and Yu, S. Dietary zinc intake and migraine in adults: a cross-sectional analysis of the National Health and nutrition examination survey 1999–2004. Headache. (2023) 63:127–35. doi: 10.1111/head.14431
27. Liu, H, Wang, L, Chen, C, Dong, Z, and Yu, S. Association between dietary niacin intake and migraine among American adults: National Health and nutrition examination survey. Nutrients. (2022) 14:3052. doi: 10.3390/nu14153052
28. Chen, H, Tang, H, Huang, J, Luo, N, Zhang, X, and Wang, X. Life’s essential 8 and mortality in US adults with chronic kidney disease. Am J Nephrol. (2023) 54:516–27. doi: 10.1159/000533257
29. Liang, J, Huang, S, Jiang, N, Kakaer, A, Chen, Y, Liu, M, et al. Association between joint physical activity and dietary quality and lower risk of depression symptoms in US adults: cross-sectional NHANES study. JMIR Public Health Surveill. (2023) 9:e45776. doi: 10.2196/45776
30. Bailey, LB. Dietary reference intakes for folate: the debut of dietary folate equivalents. Nutr Rev. (1998) 56:294–9. doi: 10.1111/j.1753-4887.1998.tb01662.x
31. Shen, X, Wang, C, Zhou, X, Zhou, W, Hornburg, D, Wu, S, et al. Nonlinear dynamics of multi-omics profiles during human aging. Nat Aging. (2024) 4:1619–34. doi: 10.1038/s43587-024-00692-2
32. DeFina, LF, Radford, NB, Barlow, CE, Willis, BL, Leonard, D, Haskell, WL, et al. Association of all-cause and cardiovascular mortality with high levels of physical activity and concurrent coronary artery calcification. JAMA Cardiol. (2019) 4:174–81. doi: 10.1001/jamacardio.2018.4628
33. Li, L, Shao, Y, Zhong, H, Wang, Y, Zhang, R, Gong, B, et al. L-shaped association between lean body mass to visceral fat mass ratio with hyperuricemia: a cross-sectional study. Lipids Health Dis. (2024) 23:116. doi: 10.1186/s12944-024-02111-2
34. Serum and red blood cell folate concentrations for assessing folate status in populations. Available online at: https://www.who.int/publications/i/item/WHO-NMH-NHD-EPG-15.01 (Accessed January 20, 2025).
35. Li, L, Huang, Q, Yang, L, Zhang, R, Gao, L, Han, X, et al. The association between non-alcoholic fatty liver disease (NAFLD) and advanced fibrosis with serological vitamin B12 markers: results from the NHANES 1999-2004. Nutrients. (2022) 14:1224. doi: 10.3390/nu14061224
36. Köse, S, Sözlü, S, Bölükbaşi, H, Ünsal, N, and Gezmen-Karadağ, M. Obesity is associated with folate metabolism. Int J Vitam Nutr Res. (2020) 90:353–64. doi: 10.1024/0300-9831/a000602
37. Varghese, M, Song, J, and Singer, K. Age and sex: impact on adipose tissue metabolism and inflammation. Mech Ageing Dev. (2021) 199:111563. doi: 10.1016/j.mad.2021.111563
38. Freedman, DS, Wang, J, Thornton, JC, Mei, Z, Pierson, RN, Dietz, WH, et al. Racial/ethnic differences in body fatness among children and adolescents. Obesity (Silver Spring). (2008) 16:1105–11. doi: 10.1038/oby.2008.30
39. Tybor, DJ, Lichtenstein, AH, Dallal, GE, Daniels, SR, and Must, A. Racial differences in central adiposity in a longitudinal cohort of black and white adolescent females. BMC Pediatr. (2010) 10:2. doi: 10.1186/1471-2431-10-2
40. Botto, LD, and Yang, Q. 5,10-methylenetetrahydrofolate reductase gene variants and congenital anomalies: a HuGE review. Am J Epidemiol. (2000) 151:862–77. doi: 10.1093/oxfordjournals.aje.a010290
41. Traversy, G, and Chaput, J-P. Alcohol consumption and obesity: an update. Curr Obes Rep. (2015) 4:122–30. doi: 10.1007/s13679-014-0129-4
42. Hall, KD. A review of the carbohydrate-insulin model of obesity. Eur J Clin Nutr. (2017) 71:679. doi: 10.1038/ejcn.2017.21
43. Ludwig, DS, and Friedman, MI. Increasing adiposity: consequence or cause of overeating? JAMA. (2014) 311:2167–8. doi: 10.1001/jama.2014.4133
44. Sievenpiper, JL. Low-carbohydrate diets and cardiometabolic health: the importance of carbohydrate quality over quantity. Nutr Rev. (2020) 78:69–77. doi: 10.1093/nutrit/nuz082
45. Hopkins, SM, Gibney, MJ, Nugent, AP, McNulty, H, Molloy, AM, Scott, JM, et al. Impact of voluntary fortification and supplement use on dietary intakes and biomarker status of folate and vitamin B-12 in irish adults. Am J Clin Nutr. (2015) 101:1163–72. doi: 10.3945/ajcn.115.107151
46. Subramanian, VS, Chatterjee, N, and Said, HM. Folate uptake in the human intestine: promoter activity and effect of folate deficiency. J Cell Physiol. (2003) 196:403–8. doi: 10.1002/jcp.10324
47. Said, HM, Chatterjee, N, Haq, RU, Subramanian, VS, Ortiz, A, Matherly, LH, et al. Adaptive regulation of intestinal folate uptake: effect of dietary folate deficiency. Am J Physiol Cell Physiol. (2000) 279:C1889–95. doi: 10.1152/ajpcell.2000.279.6.C1889
48. Stern, SJ, Matok, I, Kapur, B, and Koren, G. A comparison of folic acid pharmacokinetics in obese and nonobese women of childbearing age. Ther Drug Monit. (2011) 33:336–40. doi: 10.1097/FTD.0b013e318219407a
49. da Silva, VR, Hausman, DB, Kauwell, GPA, Sokolow, A, Tackett, RL, Rathbun, SL, et al. Obesity affects short-term folate pharmacokinetics in women of childbearing age. Int J Obes. (2013) 37:1608–10. doi: 10.1038/ijo.2013.41
50. Li, Z, Gueant-Rodriguez, R-M, Quilliot, D, Sirveaux, M-A, Meyre, D, Gueant, J-L, et al. Folate and vitamin B12 status is associated with insulin resistance and metabolic syndrome in morbid obesity. Clin Nutr. (2018) 37:1700–6. doi: 10.1016/j.clnu.2017.07.008
51. Maher, A, and Sobczyńska-Malefora, A. The relationship between folate, vitamin B12 and gestational diabetes mellitus with proposed mechanisms and foetal implications. J Fam Reprod Health. (2021) 15:141–9.doi: 10.18502/jfrh.v15i3.7131
52. Miller, JW, Garrod, MG, Allen, LH, Haan, MN, and Green, R. Metabolic evidence of vitamin B-12 deficiency, including high homocysteine and methylmalonic acid and low holotranscobalamin, is more pronounced in older adults with elevated plasma folate. Am J Clin Nutr. (2009) 90:1586–92. doi: 10.3945/ajcn.2009.27514
Keywords: visceral adipose tissue, folate status, red blood cell folate, cross-sectional study, National Health and Nutrition Examination Survey
Citation: Jiang C, Li J, Yu H, Luo X, Wu L, Long Q and Zhang B (2025) Red blood cell folate and visceral adipose tissue among young and middle-aged American adults. Front. Nutr. 12:1512410. doi: 10.3389/fnut.2025.1512410
Edited by:
Bruna Bombassaro, State University of Campinas, BrazilReviewed by:
Cecilia Zanin Palchetti, University of São Paulo, BrazilXingchun Wang, Tongji University, China
Copyright © 2025 Jiang, Li, Yu, Luo, Wu, Long and Zhang. This is an open-access article distributed under the terms of the Creative Commons Attribution License (CC BY). The use, distribution or reproduction in other forums is permitted, provided the original author(s) and the copyright owner(s) are credited and that the original publication in this journal is cited, in accordance with accepted academic practice. No use, distribution or reproduction is permitted which does not comply with these terms.
*Correspondence: Bin Zhang, emhhbmdiODdAbWFpbDIuc3lzdS5lZHUuY24=
†These authors have contributed equally to this work