 Jiaoyue Qu
 Yang Liu†
 Yin Yuan
- Department of Oncology and Radiotherapy, The First Affiliated Hospital of Bengbu Medical University, Bengbu, China
Background: Sarcopenia is a common indicator of systemic nutritional status in patients with cancer progression. This study investigated the impacts of sarcopenia on adverse effects and prognosis of sarcopenia on patients with esophageal cancer receiving chemoradiotherapy.
Methods: The clinical data of 158 patients with initially diagnosed esophageal cancer who received chemoradiotherapy were collected, and nutritional indexes and inflammatory markers were calculated. The cross-sectional areas of the skeletal muscle, subcutaneous fat and visceral fat were calculated using computed tomography (CT) images of the midpoint of the third lumbar (L3) vertebra. The incidence of adverse events, response evaluation, 1-year and 3-year overall survival (OS) and progression-free survival (PFS) were compared between sarcopenia group and non-sarcopenia groups.
Results: This study included 158 patients, 103 (71.5%) in the sarcopenia group and 45 (28.5%) in the non-sarcopenia group. The last follow-up date was January 31, 2024. The median follow-up time was 36 months for all patients. The chi-square test revealed no significant difference in the incidence of serious adverse events between the two groups. The complete response rates (CR) of patients in the sarcopenia and non-sarcopenia groups 1 month after chemoradiotherapy were 2.7 and 13.3%, respectively, p = 0.017, and the difference was statistically significant. Moreover, the objective response rates (ORR) were 38.9 and 60.0%, respectively (χ2 = 5.770, p = 0.016). The median survival time for all patients was 36 months [95% Confidence Interval CI 24–48]. Univariate analysis (Cox proportional risk model) showed that sarcopenia, KPS score, albumin level, T stage, and N stage were correlated with patients’ OS. Multivariate analysis showed that sarcopenia (Hazard Ratio HR 2.84, 95%CI [1.45–5.57], p = 0.002), KPS score, albumin level and N stage were independent prognostic factors for OS.
Conclusion: Sarcopenia reduced OS in patients with EC treated with chemoradiotherapy. It can be used as an independent indicator to predict the OS of such patients, which may help in developing optimal treatment strategies.
Introduction
Esophageal cancer (EC) is characterized by insidious onset, rapid progression, and limited surgical opportunities, resulting in a 5-year survival rate of <20% (1). Concurrent chemoradiotherapy (CRT) is the standard treatment for patients who are unresectable or refuse surgery (2). China has one of the highest global rates of EC, accounting for over half of all cases (3). A retrospective study by Di Fiore et al. showed that baseline nutritional status predicted treatment response and survival after radical CRT in patients with locally advanced EC (4).
Sarcopenia was first proposed by Rosenberg in 1989 (5). Its occurrence is associated with aging (4), systemic inflammation (6), motor neuron changes (7), and decreased anabolism (8). The prevalence of sarcopenia in EC patients ranges from 26 to 57% (9–11), which may be related to advanced age, eating obstruction, tumor burden and CRT-related dysphagia, nausea and vomiting. Currently, the widely used diagnostic criterion is decreased skeletal muscle mass or decreased skeletal muscle strength (12). It has been previously reported that skeletal muscle mass at the third lumbar (L3) vertebral level is proportional to total body muscle mass (11), and the skeletal muscle index (SMI) at the L3 vertebral level based on computed tomography (CT) is currently the most commonly used diagnostic tool for sarcopenia. Prado et al. proposed that sarcopenia is a strong prognostic factor for respiratory and gastrointestinal solid tumors (11). In patients undergoing EC surgery, sarcopenia is associated with increased surgical complications and decreased overall survival (OS) (9), but few studies have been conducted in patients undergoing CRT.
Studies on patients with gastrointestinal cancer have shown that sarcopenia is significantly associated with the infiltration of neutrophils, monocytes, and lymphocytes (13). In addition, systemic inflammatory markers, monocyte-lymphocyte ratio (LMR), platelet-lymphocyte ratio (PLR) and neutrophil-lymphocyte ratio (NLR), also have prognostic significance in EC (14).
Patients with sarcopenia may be more likely to exhibit severe adverse events and shorter OS. This study aimed to investigate the prevalence of pretreatment sarcopenia in EC patients receiving CRT, and to elucidate the associations between sarcopenia, adverse events, and OS. This study provides a basis for prospective studies on the impact of sarcopenia on patients with esophageal cancer undergoing chemoradiotherapy, and may help in developing optimal treatment strategies.
Materials and methods
Patients
A total of 158 CRT patients with EC confirmed by pathology admitted to the First Affiliated Hospital of Bengbu Medical University between January 2019 and June 2023 were enrolled. Inclusion criteria: (1) both sexes, age ≥ 18 years old, life expectancy >3 months; (2) esophageal cancer confirmed by histopathology or cytology; (3) initial concurrent CRT; (4) KPS score ≥ 70. Exclusion criteria: (1) received other antitumor therapy; (2) presence of other malignant tumors; (3) distant metastasis (excluding partial supraclavicular and retroperitoneal lymph node metastasis); (4) presence of complications, like severe cardiopulmonary disease, diabetes or hyperthyroidism and other diseases. The clinical stage was determined by AJCC Version 8 EC staging. A consort flow diagram of patient selection is depicted in Figure 1. This retrospective study has been approved by the Ethics Committee of the First Affiliated Hospital of Bengbu Medical University (ethics approval number: 2023430).
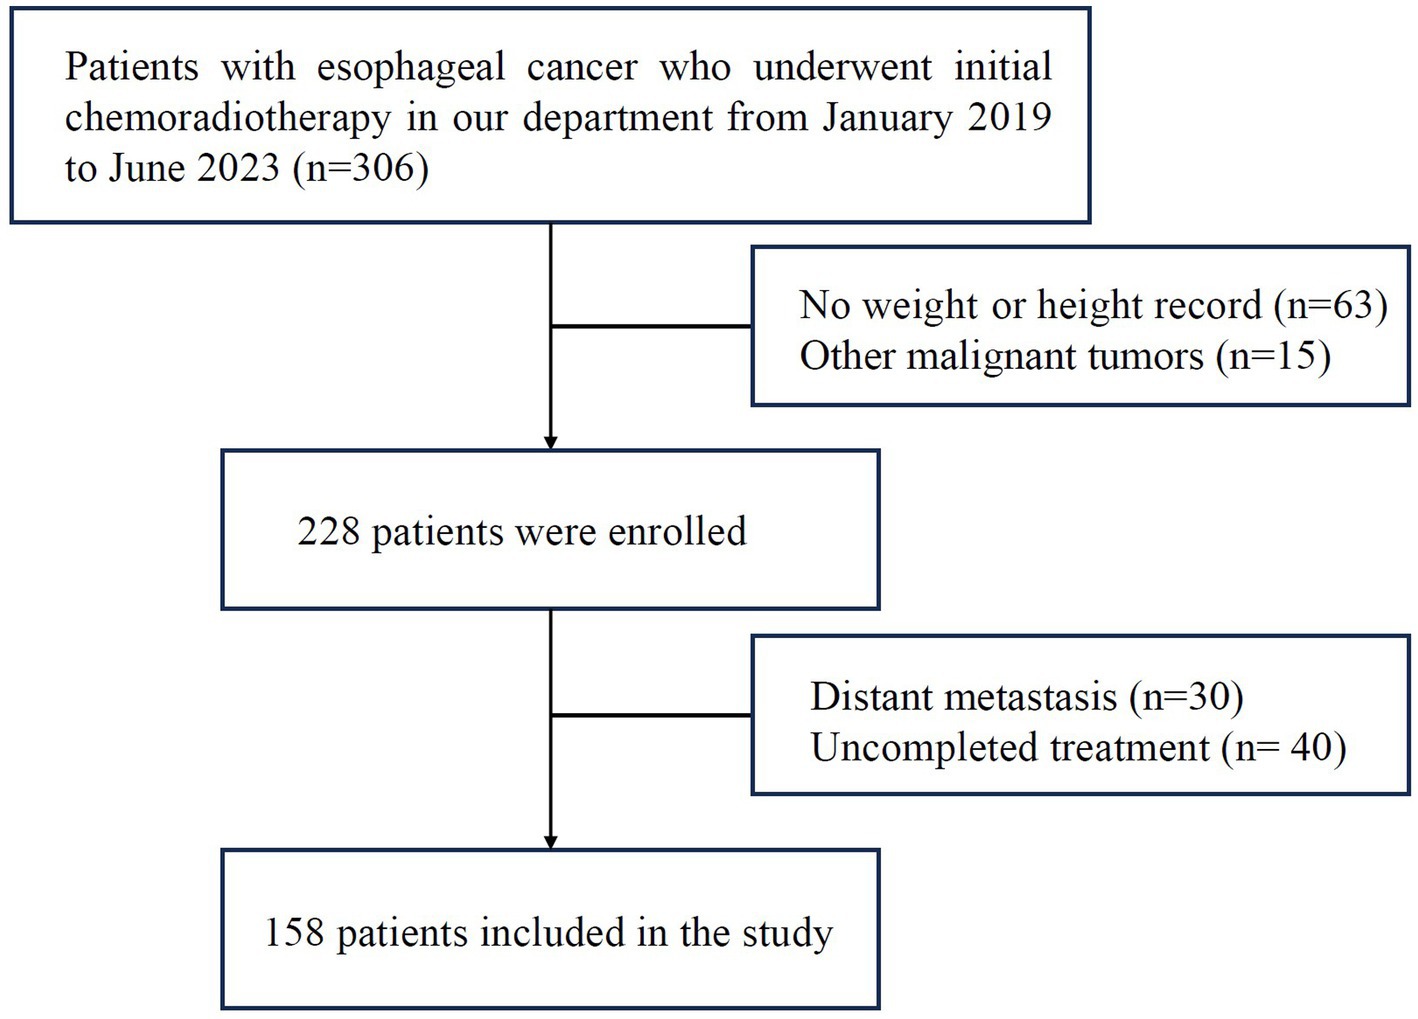
Figure 1. Consort diagram. N number of patients.
Data collection
The following baseline clinical data were collected: age, sex, smoking history, alcohol consumption history, KPS score, histological subtype, TNM stage, cancer location, and tumor length. Baseline nutritional parameters were: body weight, body mass index (BMI), history of weight loss before CRT, history of anemia before treatment, serum albumin level, nutritional risk index (NRI), and prognostic nutritional index (PNI). Inflammatory indicators: NLR, PLR, LMR. Treatment characteristics, including chemotherapy regimen and radiotherapy dose, were also collected.
Treatment
All patients received intensity modulated and conformal radiotherapy (IMRT)/tomo therapy (TOMO) using 6MV-X-rays. The total dose is 50–64 Gy (25–33 Fractions) using the Elekta linear accelerator/Accuray tomo therapy. Chemotherapy regiments mainly include platinum-containing and oral S-1.
Skeletal muscle, visceral and subcutaneous fat area were measured
Combined with simulated positioning CT before radiotherapy, the L3 vertebral midpoint image was derived in medical format. Slice-o-matic 5.0 (Tomovision, Montreal, Canada) was used to analyze the images, and the thresholds for skeletal muscles (including rectus abdominis, transversus abdominis, paddies, paraspinal muscles, internal oblique muscles, and external oblique muscles) were set from −29 to 150 (HUs), visceral fat from −190 to −30 (HUs), and subcutaneous fat from −150 to −50 (HUs), respectively (Figure 2). The cross-sectional area was calculated by semi-automatic delineation (15). The SMI was calculated by dividing the skeletal muscle area by the square height (cm2/m2). Sarcopenia has been defined as an SMI of ≤41 cm2/m2 for women and ≤ 53 cm2/m2 in case of a BMI of ≥ 25 kg/m2 or ≤ 43 cm2/m2 in case of a BMI of < 25 kg/m2 for men (16). At the same time, subcutaneous adipose tissue index (SATI, cm2/m2) and visceral adipose tissue index (VATI, cm2/m2) were calculated, and skeletal muscle density (SMD, HUs) was measured. Studies on pancreatic cancer suggest that SMD in the L3 vertebra may be more strongly associated with the outcome than SMI (17).
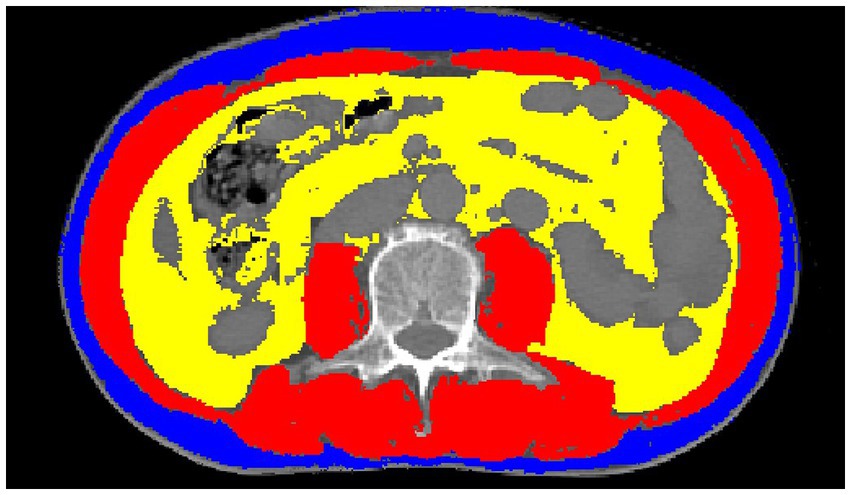
Figure 2. Example of skeletal muscles (red), subcutaneous fat (blue) and visceral fat (yellow), measured on a cross-sectional images of the L3 vertebra.
Clinical definition
According to Chinese criterion (18), anemia is defined as serum hemoglobin level ≤ 12 g/dL in women and ≤ 13 g/dL in men. Serum albumin was divided into normal group and low albumin group according to the critical value of 40.0 g/L determined by our laboratory. The patients were divided into two groups according to the median tumor length of 5 cm and the median age of 74 years. The PNI is calculated as follows: Serum albumin (g/L) + (5 × total lymphocyte count (10^9/L)) (19). NRI: (1.519 × albumin (g/dL)) + 41.7 × (current weight/ideal weight) (20).
Adverse events and response evaluation
Adverse events during treatment were noted and evaluated using the Common Terminology Standard for Adverse Events (CTCAE) version 5.0. The response evaluation was performed 1 month after the end of CRT according to Response Evaluation Criteria in Solid Tumors (RECIST) version 1.1.
Follow-up
Patients were first reviewed 1 month after CRT, followed up every 3 months for 2 years, and then every 6 months, with a median follow-up of 28 m as of January 31, 2024. The primary endpoint was OS, defined as the time from CRT initiation to patient death or last follow-up, and the secondary endpoint was progression-free survival (PFS), defined as the time from CRT initiation to disease recurrence or metastasis or last follow-up date.
Statistical analysis
SPSS 25.0 (IBM Corporation, Armonk, NY, USA) was used for statistical analysis, Fisher precision test and Pearson Chi-square test were used to compare the classified data, and independent sample t test or Mann–Whitney U test was used for quantitative data. OS and PFS were calculated by Kaplan–Meier curve, and differences between groups were tested by log-rank. Univariate and multivariate analyses were performed using Cox regression model. After univariate analysis, variables with p < 0.1 were included in multivariate analysis, p < 0.05 was considered statistically significant, and all tests were bilateral.
Results
Patient characteristics
A total of 158 patients were included, and the baseline characteristics were shown in Table 1. Comparison between sarcopenic and non-sarcopenic patients. Among them, 45 cases (28.5%) were sarcopenia, 113 cases (71.5%) were non-sarcopenia, male (74.1%), squamous cell carcinoma (94.3%) accounted for the majority. Age ranged from 52 to 86 years (median: 74). The median tumor length was 5 cm. There was no significant difference in baseline characteristics except for BMI and SMD, and BMI in the sarcopenia group was lower than that in the non-sarcopenia group (HR 20.8, 95%CI [19.1–23.1] vs. HR 22.2, 95%CI [20.9–23.5] kg/m2, p = 0.002). SMD was also lower (31.85 ± 7.41 vs. 35.95 ± 6.77 HUs, p = 0.002). There were no statistically significant differences in the inflammatory markers NLR, PLR, or LMR between the two groups, as shown in Table 2.
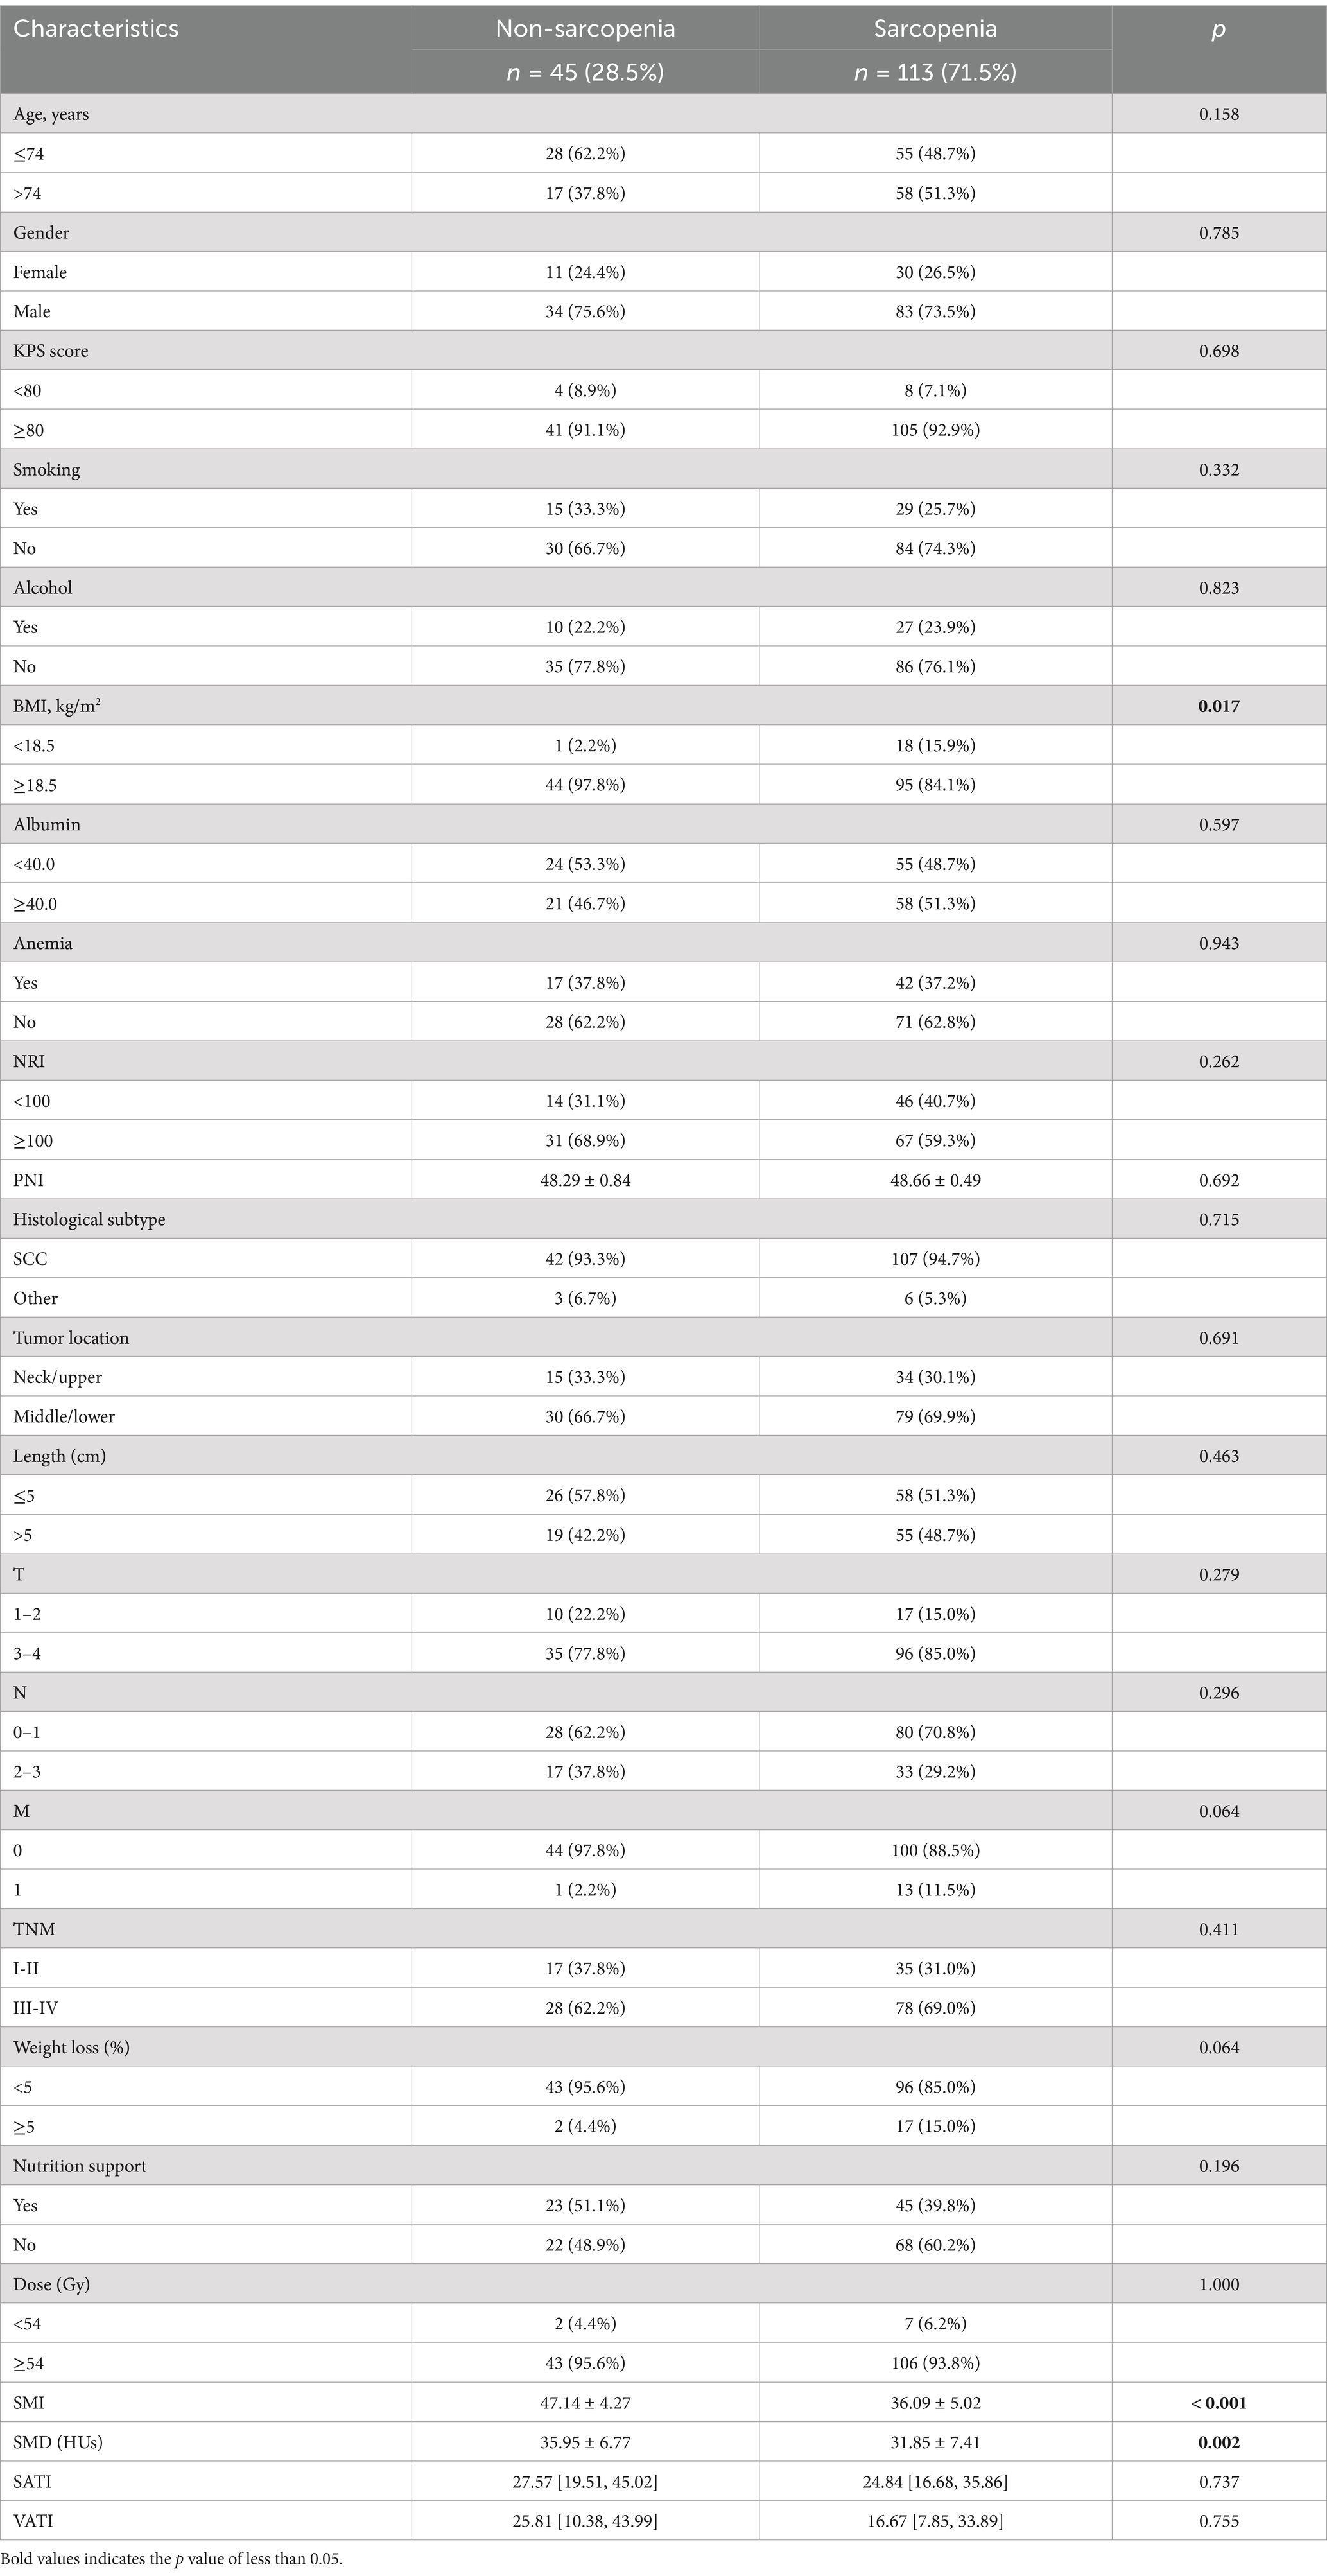
Table 1. Comparison between sarcopenic and non-sarcopenic patients.

Table 2. Comparison of inflammatory indicators.
Adverse events and response evaluation
Treatment-related adverse events during CRT were shown in Table 3. There was no statistically significant difference in the incidence of serious adverse events between the two groups. However, radiation esophagitis (85.8% vs. 64.4%, p = 0.003) and thrombocytopenia (43.4% vs. 24.4%, p = 0.030) were more common in sarcopenia patients than in non-sarcopenia patients. The objective response rate (ORR) in the sarcopenia group was significantly lower than that in the non-sarcopenia group (38.9% vs. 60.0%, p = 0.016). In addition, complete response rate (CR) tended to be lower in the sarcopenia group (2.7% vs. 13.3%, p = 0.017), as shown in Table 4.
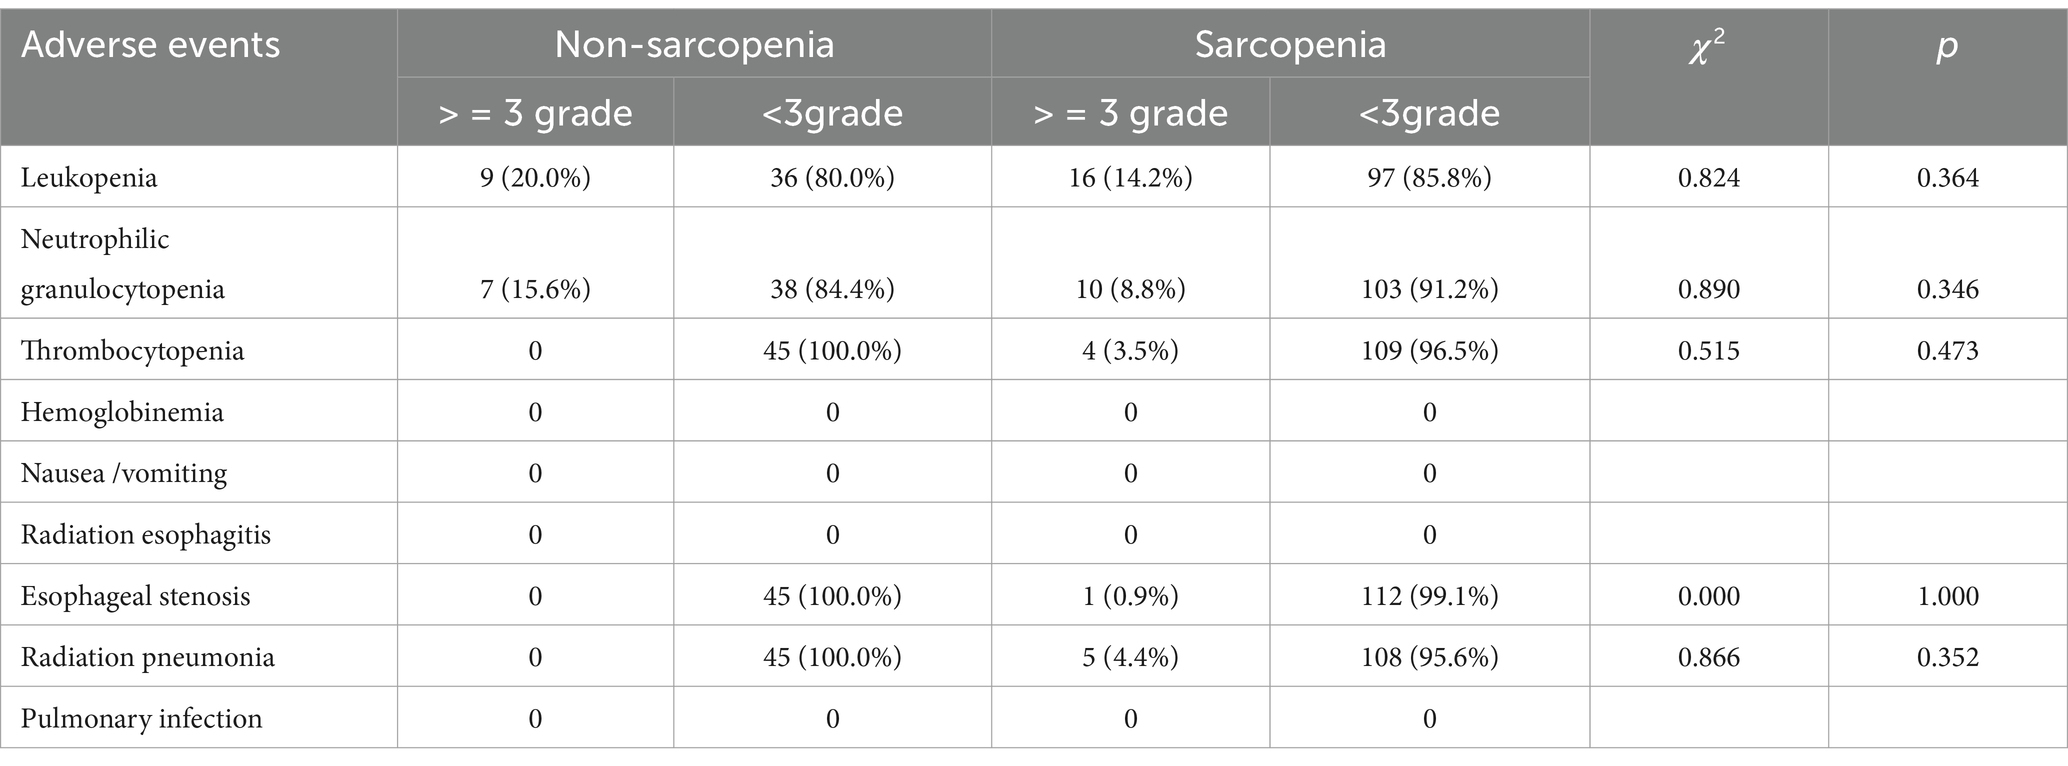
Table 3. Comparison of adverse events.

Table 4. Comparison of response evaluation.
Survival analysis
The total median OS was 36 m, as shown in Figure 3A. The median OS in the sarcopenia group and the non-sarcopenia group were 28 m and 48 m, respectively; the 1-year OS rates were 77.9% and 93.0%, and the 3-year OS rate was 43.1% and 61.8%, respectively. The median total PFS was 24 m (Figure 3B). The median PFS in the sarcopenia group and the non-sarcopenia group were 20 m and 46 m, respectively. The 1-year PFS rates were 66.9% and 81.5%, and the 3-year PFS rates were 39.3% and 54.7%, respectively.
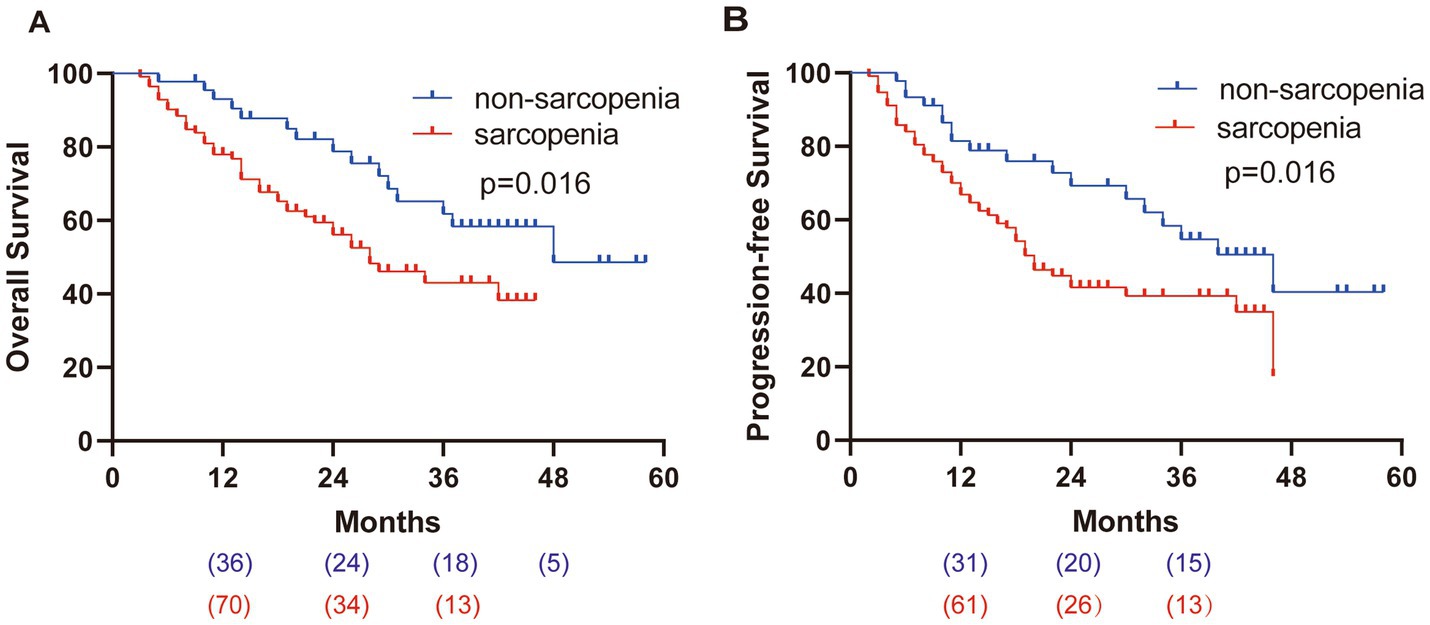
Figure 3. Kaplan–Meier survival curves. (A) OS of patients, HR = 2.047. (B) PFS of patients, HR = 1.896.
Univariate and multivariate analyses of OS
Univariate analysis showed that (Table 5), KPS score < 80 (HR 2.30, 95%CI [1.09–4.84], p = 0.028), albumin <40.0 g/L (HR 1.68, 95%CI [1.02–2.79], p = 0.044), T stage (3-4) (HR 2.73, 95%CI [1.09–6.82], p = 0.032), N stage (2-3) (HR 1.88, 95%CI [1.14–3.11], p = 0.014), TNM stage (III-IV) (HR 1.68, 95%CI [0.95–2.97], p = 0.075), tumor location (middle and lower chest) (HR 1.73, 95%CI [0.97–3.10], p = 0.063) and sarcopenia (HR 2.05, 95%CI [1.12–3.74], p = 0.020) were the adverse factors of OS. Multivariate analysis showed that (Table 6), KPS score < 80 (HR 2.38, 95%CI [1.10–5.18], p = 0.009), albumin <40.0 g/L (HR 1.87, 95%CI [1.10–3.16], p = 0.020), N stage (2-3) (HR 2.26, 95%CI [1.19–4.26], p = 0.012) and sarcopenia (HR 2.84, 95%CI [1.45–5.57], p = 0.002) increased the risk of death.
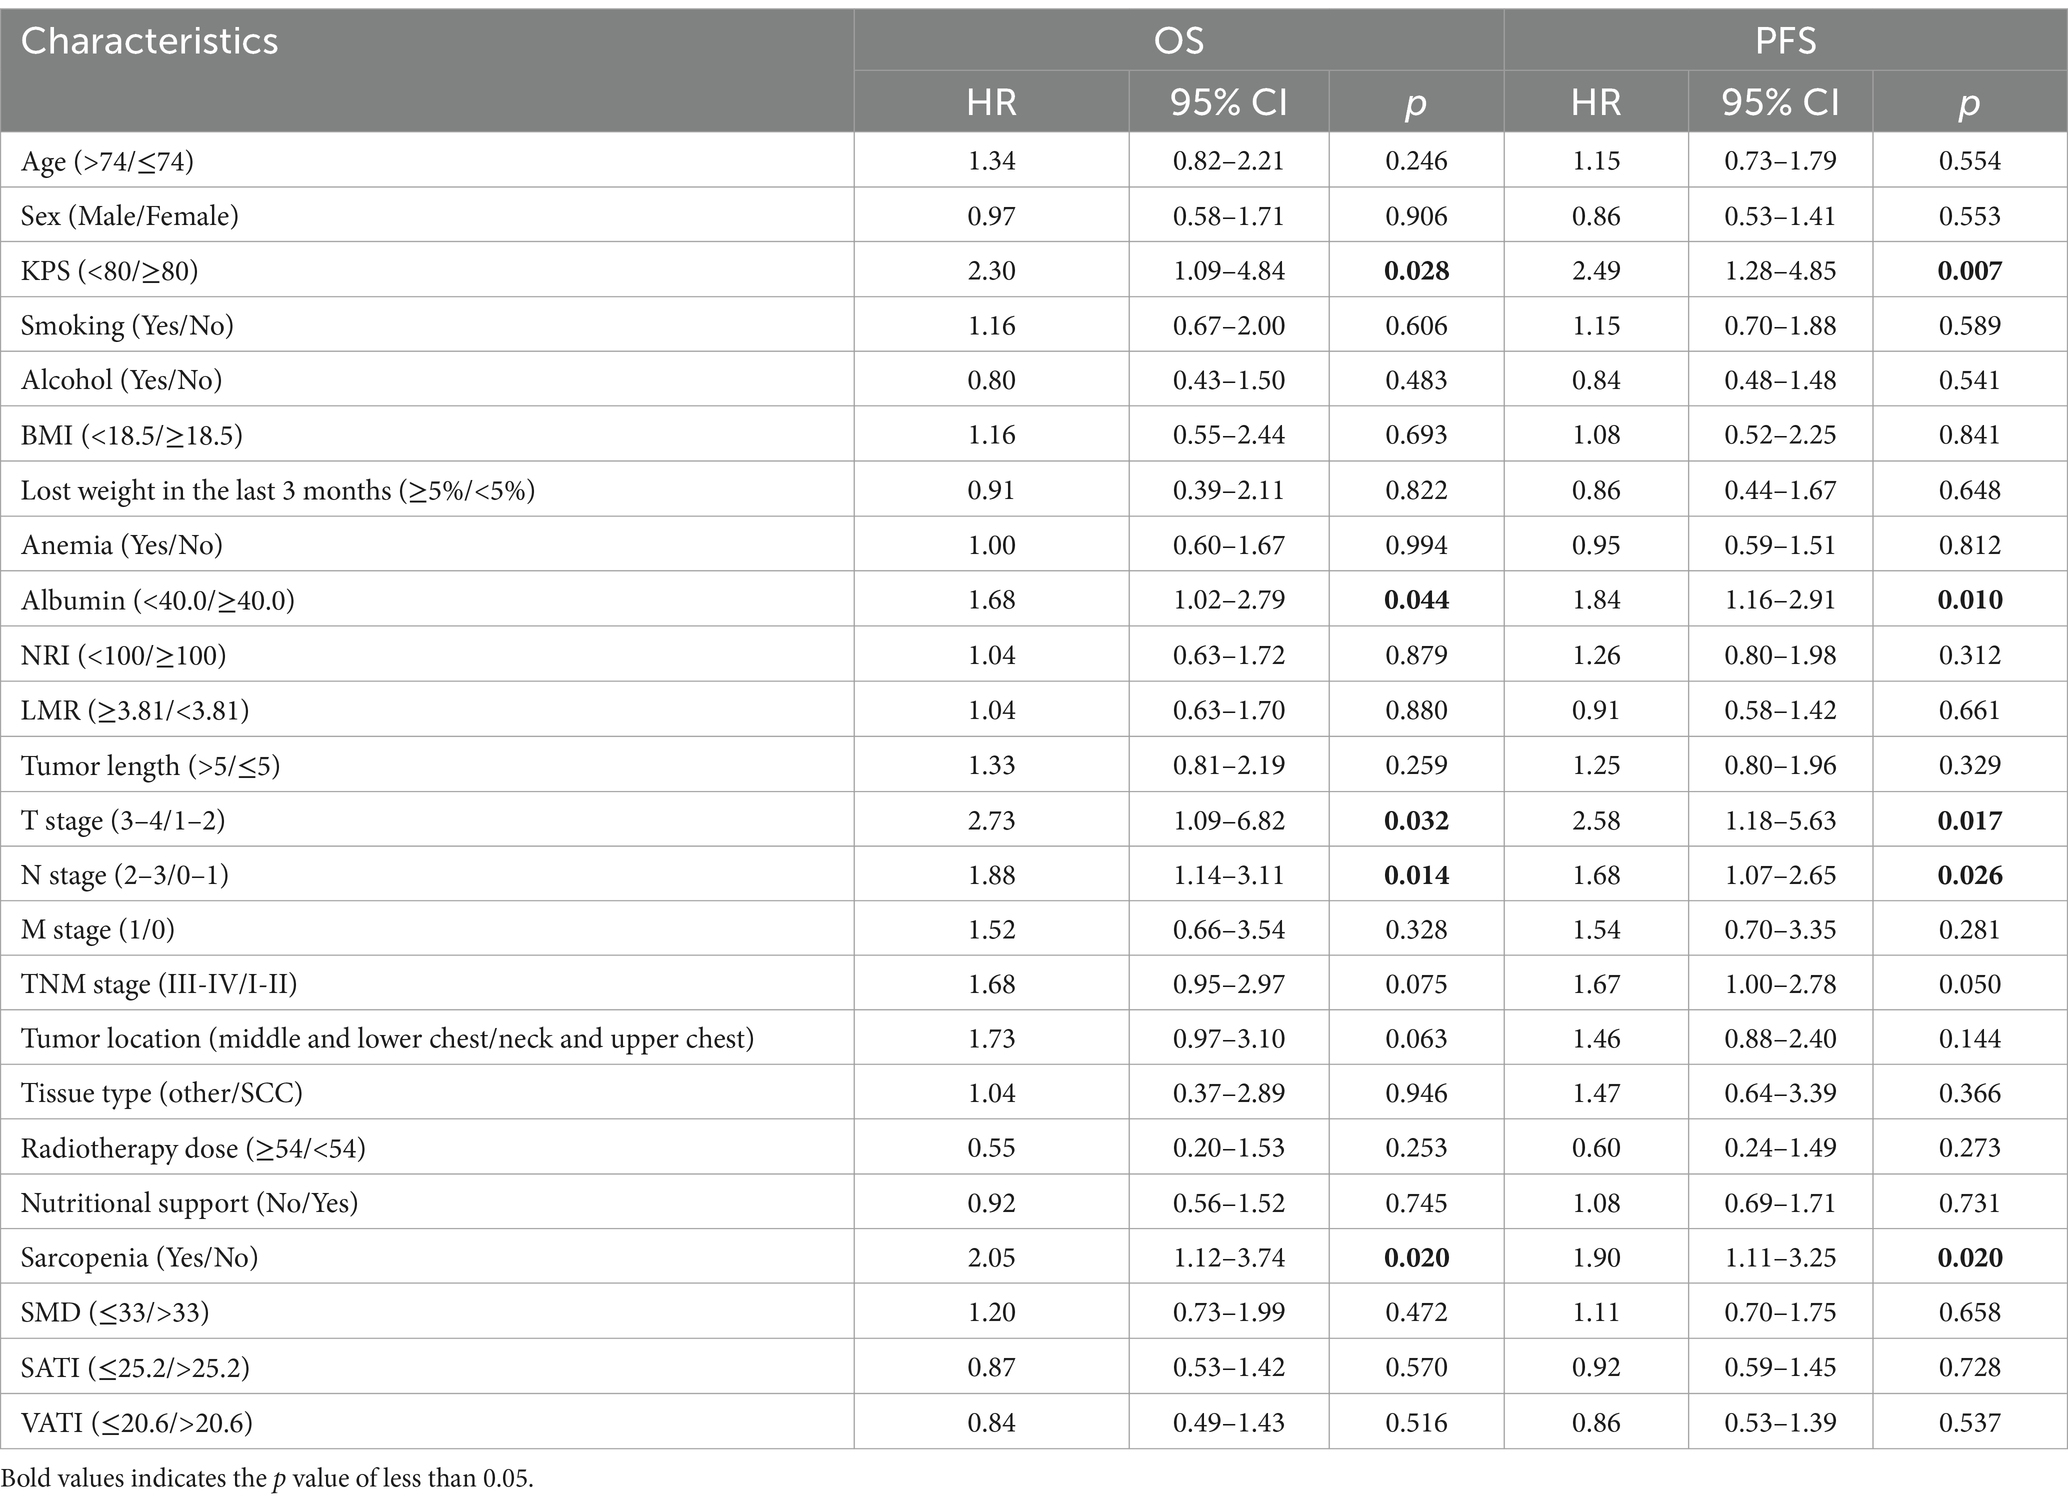
Table 5. Univariate analysis of OS and PFS was performed.

Table 6. Multivariate analysis of OS and PFS.
Univariate and multivariate analyses of FPS
Univariate analysis showed that (Table 5), KPS < 80 (HR 2.49, 95%CI [1.28–4.85], p = 0.007), albumin <40.0 g/L (HR 1.84, 95%CI [1.16–2.91], p = 0.010), T stage (3-4) (HR 2.58, 95%CI [1.18–5.63], p = 0.017), N stage (2-3) (HR 1.68, 95%CI [1.07–2.65], p = 0.026), TNM stage (III-IV) (HR 1.67, 95%CI [1.00–2.78], p = 0.050) and sarcopenia (HR 1.90, 95%CI [1.11–3.25], p = 0.020) were adverse factors for PFS. Multivariate analysis showed that (Table 6), KPS score < 80 (HR 2.56, 95%CI [1.27–5.16], p = 0.009), albumin <40.0 g/L (HR 1.98, 95%CI [1.23–3.18], p = 0.005), N stage (2-3) (HR 1.94, 95%CI [1.17–3.20], p = 0.010) and sarcopenia (HR 2.54, 95%CI [1.40–4.63], p = 0.002) lived for a shorter PFS time.
Discussion
Our research showed that among the 158 EC patients who received CRT, the incidence of radiation esophagitis and thrombocytopenia was higher in patients with sarcopenia, but the incidence of serious adverse events was not increased. Meanwhile, the ORR and CR rates in the sarcopenia group tend to be lower. In addition, sarcopenia, serum albumin <40 g/L, N 2–3 stage, and lower KPS score were independently associated with a poor OS.
According to the diagnostic cut-off value of Martin L et al. (16), the prevalence of sarcopenia in EC in this study was 71.5%, which was higher than previous data (26%–57%), but was generally consistent with local studies (77%–80%) (21, 22), which may be due to ethnic differences. Studies have shown that the muscle mass of the Chinese population is about 17% lower than that of the European population (23). Moreover, it has been suggested that African-Americans present more muscle mass than Caucasian, Asian or Hispanic subjects (24, 25).
In this study, some patients were treated with TOMO due to the too long or wide range of lesions and high treatment requirements, which is different from previous studies. One study has demonstrated that TOMO seems to be significantly better than IMRT in protecting normal tissues; however, there is no significant difference in survival outcomes between the two groups (26).
Sarcopenia has been reported to be associated with a high risk of adverse events during chemotherapy for metastatic breast and colorectal cancer (27, 28). Panje et al. (29) found in their study of locally advanced EC receiving neoadjuvant CRT that the incidence of grade ≥ 3 adverse events in patients with sarcopenia was significantly higher than that in patients without sarcopenia (83.3% vs. 52.4%). Olmez et al. showed that there was no significant difference between the two groups in terms of adverse events in rectal cancer patients receiving synchronous CRT (30). A single-center study of locally advanced EC receiving CRT by Sato et al. (31) showed no statistically significant incidence of serious adverse events in the two groups. There are few studies on the adverse events of sarcopenia on CRT in EC patients, and more studies are still needed. The lack of a significant difference between the two groups in our study could be due to the high prevalence of sarcopenia and the low prevalence of serious adverse effects.
Inflammation plays an important role in cancer progression and prognosis (32), and one study has shown that higher LMR leads to a better clinical response and prognosis in patients with locally advanced EC receiving definitive CRT (33). However, in this study, LMR was not associated with prognosis. It has been noted that the strength of the relationship between higher levels of circulating inflammatory markers and lower skeletal muscle strength and muscle mass varies by population and gender (34). The study was a retrospective study, which may be subject to selection bias and information bias. In addition, the inflammatory markers in this study may not fully reflect the inflammatory state, and future studies should comprehensively analyze with other inflammatory markers, such as IL-6 and TNF-α.
The incidence of malnutrition in EC patients before treatment due to mechanical obstruction is as high as 79% (35). In this study, there were no significant differences in nutritional status except for BMI and SMD (albumin, PNI, NRI, SATI, and VATI) between the two groups. Therefore, sarcopenia, as a common indicator reflecting the systemic nutritional status of patients with cancer progression, could be an independent indicator affecting the long-term prognosis of EC patients after CRT. Sato et al. (31) found in EC patients who received radical CRT that the 3-year survival rate of patients with sarcopenia was only 36.95%, which was significantly lower than 63.9% of the non-sarcopenia group. In our study, the 3-year survival rate was 43.1% in the sarcopenia group and 61.8% in the non-sarcopenia group, which was similar to the results. In univariate and multivariate analyses, albumin was a predictor of OS, which was consistent with the results of previous studies (36). Moreover, N stage was also an independent prognostic factor for OS, which fits well with previous studies of esophageal squamous cell carcinoma patients treated with definitive CRT (37).
The study was retrospective and therefore has some limitations. Some patients with tumor progression received molecular targeted therapy or PD-1 immune checkpoint inhibitor treatment during the follow-up period, which may affect the final survival outcome. Therefore, prospective studies with large samples are still needed to confirm it in the future. A systematic review assessing the relationship between protein intake and maintenance of muscle mass in patients undergoing radiotherapy for head and neck cancer, lung cancer, and EC showed that the intake needed to prevent loss of muscle mass during radiotherapy was higher than commonly recommended (>1.4 g/kg vs. 1.2 g/kg) (38). Ma et al. (39) showed that SMI was significantly reduced in EC patients after CRT, indicating significant skeletal muscle loss during CRT. However, due to the lack of post-treatment imaging data, we were unable to analyze changes in skeletal muscle mass in patients treated with CRT, and the usefulness of nutritional support in patients with sarcopenia remains unclear.
In conclusion, lower KPS, BMI < 18.5 kg/m2, and lower SMD are common risk factors for sarcopenia in EC patients. Sarcopenia, which reduces the response of treatment and OS rate, is a poor prognostic indicator of CRT in EC patients and may help to provide optimal intervention strategies during treatment.
Data availability statement
The raw data supporting the conclusions of this article will be made available by the authors, without undue reservation.
Ethics statement
The studies involving humans were approved by the Ethics Committee of the First Affiliated Hospital of Bengbu Medical University (approval number: 2023430). The studies were conducted in accordance with the local legislation and institutional requirements. The ethics committee/institutional review board waived the requirement of written informed consent for participation from the participants or the participants’ legal guardians/next of kin because The ethics committee waived formal written informed consent due to its retrospective research design, and all data were kept confidential.
Author contributions
JQ: Formal analysis, Funding acquisition, Investigation, Project administration, Writing – original draft, Writing – review & editing. YL: Formal analysis, Funding acquisition, Writing – original draft. YY: Data curation, Writing – review & editing. ZY: Data curation, Writing – review & editing. JD: Investigation, Software, Writing – review & editing. ZH: Funding acquisition, Writing – review & editing. GW: Project administration, Supervision, Writing – review & editing.
Funding
The author(s) declare that financial support was received for the research, authorship, and/or publication of this article. This work was supported by the Natural Science Research Project of Anhui Educational Committee (No. 2022AH051446).
Acknowledgments
The authors wish to thank patients and their families for supporting our work and thank editors as well as reviewers for reading the manuscript.
Conflict of interest
The authors declare that the research was conducted in the absence of any commercial or financial relationships that could be construed as a potential conflict of interest.
Generative AI statement
The author(s) declare that no Gen AI was used in the creation of this manuscript.
Publisher’s note
All claims expressed in this article are solely those of the authors and do not necessarily represent those of their affiliated organizations, or those of the publisher, the editors and the reviewers. Any product that may be evaluated in this article, or claim that may be made by its manufacturer, is not guaranteed or endorsed by the publisher.
Supplementary material
The Supplementary material for this article can be found online at: https://www.frontiersin.org/articles/10.3389/fnut.2025.1523674/full#supplementary-material
Abbreviations
KPS, Karnofsky Performance Status; BMI, Body Mass Index; NRI, Nutritional Risk Index; PNI, Prognostic Nutritional Index; SCC, Squamous Cell Carcinoma; TNM, Tumor, Node, Metastasis; SMI, Skeletal Muscle Index; SMD, Skeletal Muscle Density; SATI, Subcutaneous Adipose Tissue Index; VATI, Visceral Adipose Tissue Index.
References
1. Di Fiore, F, Lecleire, S, Rigal, O, Galais, MP, Ben, E, David, I, et al. Predictive factors of survival in patients treated with definitive chemoradiotherapy for squamous cell esophageal carcinoma. World J Gastroenterol. (2006) 12:4185–90. doi: 10.3748/wjg.v12.i26.4185
2. Obermannová, R, Alsina, M, Cervantes, A, Leong, T, Lordick, F, Nilsson, M, et al. Oesophageal cancer: ESMO clinical practice guideline for diagnosis, treatment and follow-up. Ann Oncol. (2022) 33:992–1004. doi: 10.1016/j.annonc.2022.07.003
3. Zopfs, D, Theurich, S, Große Hokamp, N, Knuever, J, Gerecht, L, Borggrefe, J, et al. Single-slice CT measurements allow for accurate assessment of sarcopenia and body composition. Eur Radiol. (2020) 30:1701–8. doi: 10.1007/s00330-019-06526-9
4. Di Fiore, F, Lecleire, S, Pop, D, Rigal, O, Hamidou, H, Paillot, B, et al. Baseline nutritional status is predictive of response to treatment and survival in patients treated by definitive chemoradiotherapy for a locally advanced esophageal cancer. Am J Gastroenterol. (2007) 102:2557–63. doi: 10.1111/j.1572-0241.2007.01437.x
5. Rosenberg, IH. Sarcopenia: origins and clinical relevance. J Nutr. (1997) 127:990s–1s. doi: 10.1093/jn/127.5.990S
6. Lin, JX, Lin, JP, Xie, JW, Wang, JB, Lu, J, Chen, QY, et al. Prognostic value and Association of Sarcopenia and Systemic Inflammation for patients with gastric Cancer following radical gastrectomy. Oncologist. (2019) 24:e1091–101. doi: 10.1634/theoncologist.2018-0651
7. Drey, M, Krieger, B, Sieber, CC, Bauer, JM, Hettwer, S, Bertsch, T, et al. Motoneuron loss is associated with sarcopenia. J Am Med Dir Assoc. (2014) 15:435–9. doi: 10.1016/j.jamda.2014.02.002
8. Baumgartner, RN, Waters, DL, Gallagher, D, Morley, JE, and Garry, PJ. Predictors of skeletal muscle mass in elderly men and women. Mech Ageing Dev. (1999) 107:123–36. doi: 10.1016/S0047-6374(98)00130-4
9. Elliott, JA, Doyle, SL, Murphy, CF, King, S, Guinan, EM, Beddy, P, et al. Sarcopenia: prevalence, and impact on operative and oncologic outcomes in the multimodal Management of Locally Advanced Esophageal Cancer. Ann Surg. (2017) 266:822–30. doi: 10.1097/sla.0000000000002398
10. Paireder, M, Asari, R, Kristo, I, Rieder, E, Tamandl, D, Ba-Ssalamah, A, et al. Impact of sarcopenia on outcome in patients with esophageal resection following neoadjuvant chemotherapy for esophageal cancer. Eur J Surg Oncol. (2017) 43:478–84. doi: 10.1016/j.ejso.2016.11.015
11. Prado, CM, Lieffers, JR, McCargar, LJ, Reiman, T, Sawyer, MB, Martin, L, et al. Prevalence and clinical implications of sarcopenic obesity in patients with solid tumours of the respiratory and gastrointestinal tracts: a population-based study. Lancet Oncol. (2008) 9:629–35. doi: 10.1016/s1470-2045(08)70153-0
12. Muscaritoli, M, Anker, SD, Argilés, J, Aversa, Z, Bauer, JM, Biolo, G, et al. Consensus definition of sarcopenia, cachexia and pre-cachexia: joint document elaborated by special interest groups (SIG) "cachexia-anorexia in chronic wasting diseases" and "nutrition in geriatrics". Clin Nutr. (2010) 29:154–9. doi: 10.1016/j.clnu.2009.12.004
13. Feliciano, EMC, Kroenke, CH, Meyerhardt, JA, Prado, CM, Bradshaw, PT, Kwan, ML, et al. Association of Systemic Inflammation and Sarcopenia with Survival in nonmetastatic colorectal Cancer: results from the C SCANS study. JAMA Oncol. (2017) 3:e172319. doi: 10.1001/jamaoncol.2017.2319
14. Sun, Y, and Zhang, L. The clinical use of pretreatment NLR, PLR, and LMR in patients with esophageal squamous cell carcinoma: evidence from a meta-analysis. Cancer Manag Res. (2018) 10:6167–79. doi: 10.2147/cmar.S171035
15. Tamandl, D, Paireder, M, Asari, R, Baltzer, PA, Schoppmann, SF, and Ba-Ssalamah, A. Markers of sarcopenia quantified by computed tomography predict adverse long-term outcome in patients with resected oesophageal or gastro-oesophageal junction cancer. Eur Radiol. (2016) 26:1359–67. doi: 10.1007/s00330-015-3963-1
16. Martin, L, Birdsell, L, Macdonald, N, Reiman, T, Clandinin, MT, McCargar, LJ, et al. Cancer cachexia in the age of obesity: skeletal muscle depletion is a powerful prognostic factor, independent of body mass index. J Clin Oncol. (2013) 31:1539–47. doi: 10.1200/jco.2012.45.2722
17. van Dijk, DPJ, Bakens, MJAM, Coolsen, MME, Rensen, SS, van Dam, RM, Bours, MJL, et al. Low skeletal muscle radiation attenuation and visceral adiposity are associated with overall survival and surgical site infections in patients with pancreatic cancer. J Cachexia Sarcopenia Muscle. (2017) 8:317–26. doi: 10.1002/jcsm.12155
18. Guo, J, Zheng, C, Xiao, Q, Gong, S, Zhao, Q, Wang, L, et al. Impact of anaemia on lung function and exercise capacity in patients with stable severe chronic obstructive pulmonary disease. BMJ Open. (2015) 5:e008295. doi: 10.1136/bmjopen-2015-008295
19. Buzby, GP, Mullen, JL, Matthews, DC, Hobbs, CL, and Rosato, EF. Prognostic nutritional index in gastrointestinal surgery. Am J Surg. (1980) 139:160–7. doi: 10.1016/0002-9610(80)90246-9
20. Fujiya, K, Kawamura, T, Omae, K, Makuuchi, R, Irino, T, Tokunaga, M, et al. Impact of malnutrition after gastrectomy for gastric Cancer on long-term survival. Ann Surg Oncol. (2018) 25:974–83. doi: 10.1245/s10434-018-6342-8
21. Liang, H, Peng, H, and Chen, L. Prognostic value of sarcopenia and systemic inflammation markers in patients undergoing definitive radiotherapy for esophageal Cancer. Cancer Manag Res. (2021) 13:181–92. doi: 10.2147/cmar.S288522
22. Qian, J, Si, Y, Zhou, K, Tian, Y, Guo, Q, Zhao, K, et al. Sarcopenia is associated with prognosis in patients with esophageal squamous cell cancer after radiotherapy or chemoradiotherapy. BMC Gastroenterol. (2022) 22:211. doi: 10.1186/s12876-022-02296-9
23. Dodson, S, Baracos, VE, Jatoi, A, Evans, WJ, Cella, D, Dalton, JT, et al. Muscle wasting in cancer cachexia: clinical implications, diagnosis, and emerging treatment strategies. Annu Rev Med. (2011) 62:265–79. doi: 10.1146/annurev-med-061509-131248
24. Castaneda, C, and Janssen, I. Ethnic comparisons of sarcopenia and obesity in diabetes. Ethn Dis. (2005) 15:664–70.
25. Wang, Z, Heo, M, Lee, RC, Kotler, DP, Withers, RT, and Heymsfield, SB. Muscularity in adult humans: proportion of adipose tissue-free body mass as skeletal muscle. Am J Hum Biol. (2001) 13:612–9. doi: 10.1002/ajhb.1099
26. Xu, YJ, Li, P, Hu, X, Wang, J, Ma, HL, and Chen, M. Dosimetric comparison of the helical tomotherapy, intensity-modulated radiotherapy and volumetric-modulated arc therapy in radical radiotherapy for esophageal cancer. Zhonghua Yi Xue Za Zhi. (2019) 99:3260–5. doi: 10.3760/cma.j.issn.0376-2491.2019.41.012
27. Barret, M, Antoun, S, Dalban, C, Malka, D, Mansourbakht, T, Zaanan, A, et al. Sarcopenia is linked to treatment toxicity in patients with metastatic colorectal cancer. Nutr Cancer. (2014) 66:583–9. doi: 10.1080/01635581.2014.894103
28. Prado, CM, Baracos, VE, McCargar, LJ, Reiman, T, Mourtzakis, M, Tonkin, K, et al. Sarcopenia as a determinant of chemotherapy toxicity and time to tumor progression in metastatic breast cancer patients receiving capecitabine treatment. Clin Cancer Res. (2009) 15:2920–6. doi: 10.1158/1078-0432.Ccr-08-2242
29. Panje, CM, Höng, L, Hayoz, S, Baracos, VE, Herrmann, E, Garcia Schüler, H, et al. Skeletal muscle mass correlates with increased toxicity during neoadjuvant radiochemotherapy in locally advanced esophageal cancer: a SAKK 75/08 substudy. Radiat Oncol. (2019) 14:166. doi: 10.1186/s13014-019-1372-3
30. Olmez, T, Ofluoglu, CB, Sert, OZ, Keser, SH, Gulmez, S, Senger, AS, et al. The impact of sarcopenia on pathologic complete response following neoadjuvant chemoradiation in rectal cancer. Langenbeck's Arch Surg. (2020) 405:1131–8. doi: 10.1007/s00423-020-01983-z
31. Sho, S, Chikara, K, Hideaki, S, Yusaku, T, Hiroshi, M, Takashi, K, et al. Impact of sarcopenia in patients with Unresectable locally advanced esophageal Cancer receiving Chemoradiotherapy. In Vivo. (2018) 32:603. doi: 10.21873/invivo.11282
32. Mantovani, A, Allavena, P, Sica, A, and Balkwill, F. Cancer-related inflammation. Nature. (2008) 454:436–44. doi: 10.1038/nature07205
33. Liu, JS, Huang, Y, Yang, X, and Feng, JF. A nomogram to predict prognostic values of various inflammatory biomarkers in patients with esophageal squamous cell carcinoma. Am J Cancer Res. (2015) 5:2180–9.
34. Tuttle, CSL, Thang, LAN, and Maier, AB. Markers of inflammation and their association with muscle strength and mass: a systematic review and meta-analysis. Ageing Res Rev. (2020) 64:101185. doi: 10.1016/j.arr.2020.101185
35. Riccardi, D, and Allen, K. Nutritional Management of Patients with Esophageal and Esophagogastric Junction Cancer. Cancer Control. (1999) 6:64–72. doi: 10.1177/107327489900600106
36. Gupta, D, and Lis, CG. Pretreatment serum albumin as a predictor of cancer survival: a systematic review of the epidemiological literature. Nutr J. (2010) 9:69. doi: 10.1186/1475-2891-9-69
37. Zhao, Z, Zhang, Y, Wang, P, Wang, X, and Li, M. The impact of the nodal status on the overall survival of non-surgical patients with esophageal squamous cell carcinoma. Radiat Oncol. (2019) 14:161. doi: 10.1186/s13014-019-1365-2
38. Capitão, C, Coutinho, D, Neves, PM, Capelas, ML, Pimenta, NM, Santos, T, et al. Protein intake and muscle mass maintenance in patients with cancer types with high prevalence of sarcopenia: a systematic review. Support Care Cancer. (2022) 30:3007–15. doi: 10.1007/s00520-021-06633-8
Keywords: sarcopenia, esophageal cancer, chemoradiotherapy, prognosis, adverse events
Citation: Qu J, Liu Y, Yuan Y, Yu Z, Ding J, He Z and Wang G (2025) Impacts of sarcopenia on adverse events and prognosis in Chinese patients with esophageal cancer undergoing chemoradiotherapy. Front. Nutr. 12:1523674. doi: 10.3389/fnut.2025.1523674
Edited by:
Jinluan Li, Fujian Medical University, ChinaReviewed by:
Yufeng Wu, Zhengzhou University, ChinaHui Li, Fujian Medical University, China
Yousi Fu, Michigan State University, United States
Copyright © 2025 Qu, Liu, Yuan, Yu, Ding, He and Wang. This is an open-access article distributed under the terms of the Creative Commons Attribution License (CC BY). The use, distribution or reproduction in other forums is permitted, provided the original author(s) and the copyright owner(s) are credited and that the original publication in this journal is cited, in accordance with accepted academic practice. No use, distribution or reproduction is permitted which does not comply with these terms.
*Correspondence: Zelai He, aGV6ZWxhaUBhbHVtbmkuc2p0dS5lZHUuY24=; Gengming Wang, bGFuc2VmZWlkaWFuNzc3QDE2My5jb20=
†These authors have contributed equally to this work