 Ce Zhou
 You Zhou
 TingYue Wang2†
- 1Department of Anesthesiology, People’s Hospital of Longhua, Shenzhen, China
- 2Shenzhen Longhua Clinical College of Medicine (People’s Hospital of Longhua), Guangdong Medical University, Shenzhen, China
- 3The Eighth Affiliated Hospital, Sun Yat-sen University, Shenzhen, China
Background: The prognostic nutritional index (PNI) has shown prognostic value in various diseases, but its association with mortality in the general population remains unclear.
Methods: We analyzed data from 30,741 adults in the National Health and Nutrition Examination Survey (NHANES) 2007–2018. Cox proportional hazard models examined the association between PNI and mortality outcomes. Restricted cubic spline analyses were performed to assess non-linear relationships. Subgroup analyses were conducted to evaluate effect modifications.
Results: During follow-up, higher PNI values were associated with lower all-cause mortality (HR: 0.95, 95% CI: 0.94–0.96) and cardiovascular mortality (HR: 0.94, 95% CI: 0.93–0.96). Non-linear relationships were identified with threshold effects at PNI = 50.24 for all-cause mortality and PNI = 51.50 for cardiovascular mortality. The protective associations were particularly strong among participants with liver disease (P for interaction < 0.001).
Conclusion: Prognostic nutritional index demonstrates significant predictive value for mortality outcomes in the general U.S. adult population, with identified threshold effects. These findings suggest PNI’s potential utility as a valuable risk stratification tool in clinical practice.
1 Introduction
Malnutrition and immune dysfunction are significant concerns in clinical practice, particularly among patients with chronic diseases and malignancies. The prognostic nutritional index (PNI), introduced by Onodera et al. (1), is crucial for assessing nutritional and immunological status using serum albumin levels and total lymphocyte counts (2, 3). PNI has demonstrated significant prognostic value across conditions like cardiovascular diseases (CVDs) and cancer (4, 5). In cardiovascular medicine, PNI is linked with adverse outcomes in heart failure patients and predicts mortality in acute cases (6). Lower PNI suggests worse outcomes, often due to malnutrition and inflammation (7, 8). Additionally, PNI predicts major adverse cardiovascular events in patients undergoing interventions (9, 10). In oncology, especially for gastrointestinal malignancies, a lower PNI correlates with poorer survival (11). It is also used to assess risk in infectious diseases, including COVID-19, as a marker for disease severity (12, 13).
Despite its widespread use, critical gaps remain in understanding the PNI and its link to mortality in the general adult population. While studies, including a recent National Health and Nutrition Examination Survey (NHANES)-based study, show lower PNI correlates with increased all-cause and cardiovascular mortality in cancer survivors (14), large-scale, population-based research is scarce. Most studies focus on specific groups, raising concerns about PNI’s applicability in the U.S. population. Research indicates lower PNI is associated with adverse outcomes in CVDs (15) and heart failure (16). Although PNI has been associated with cardiovascular outcomes in clinical settings, its relationship with all-cause and cardiovascular mortality in the general population remains, to some extent, unexplored.
The NHANES database, with its comprehensive demographic representation and long-term follow-up data, provides an ideal opportunity to address these knowledge gaps. This study aims to analyze the association of PNI with all-cause and cardiovascular mortality in a nationally representative sample of U.S. adults. Additionally, we will identify optimal PNI cut-off values for assessing mortality risk in the U.S. population while examining whether these associations vary by demographic characteristics and comorbid conditions. Our findings could provide valuable insights for public health strategies and enhance risk stratification in clinical practice.
2 Materials and methods
2.1 Study design and participants
This prospective open cohort study analyzed data from the NHANES 2007–2018, a nationally representative survey program among U.S. adults. The study design allowed participants to enter the cohort at various time points across different survey cycles (2007–2018), with baseline data collected during NHANES examinations and mortality outcomes ascertained through linkage to the National Death Index (NDI) through 31 December 2019. This temporal framework enables the assessment of exposure-outcome relationships, with PNI measured at baseline and subsequent mortality events tracked prospectively over a median follow-up period of 7.25 years. The participant selection process is illustrated in Figure 1. From an initial sample of 59,842 NHANES participants, we established our study population through a systematic screening process. We excluded participants aged < 20 years (n = 25,072), those with incomplete PNI data (n = 3,606), those with missing follow-up information (n = 70), pregnant individuals (n = 329), and PNI outliers (mean ± 3 SD; n = 24), resulting in a final analytical sample of 30,741 participants. All data used in this study are publicly accessible through the NHANES database1.
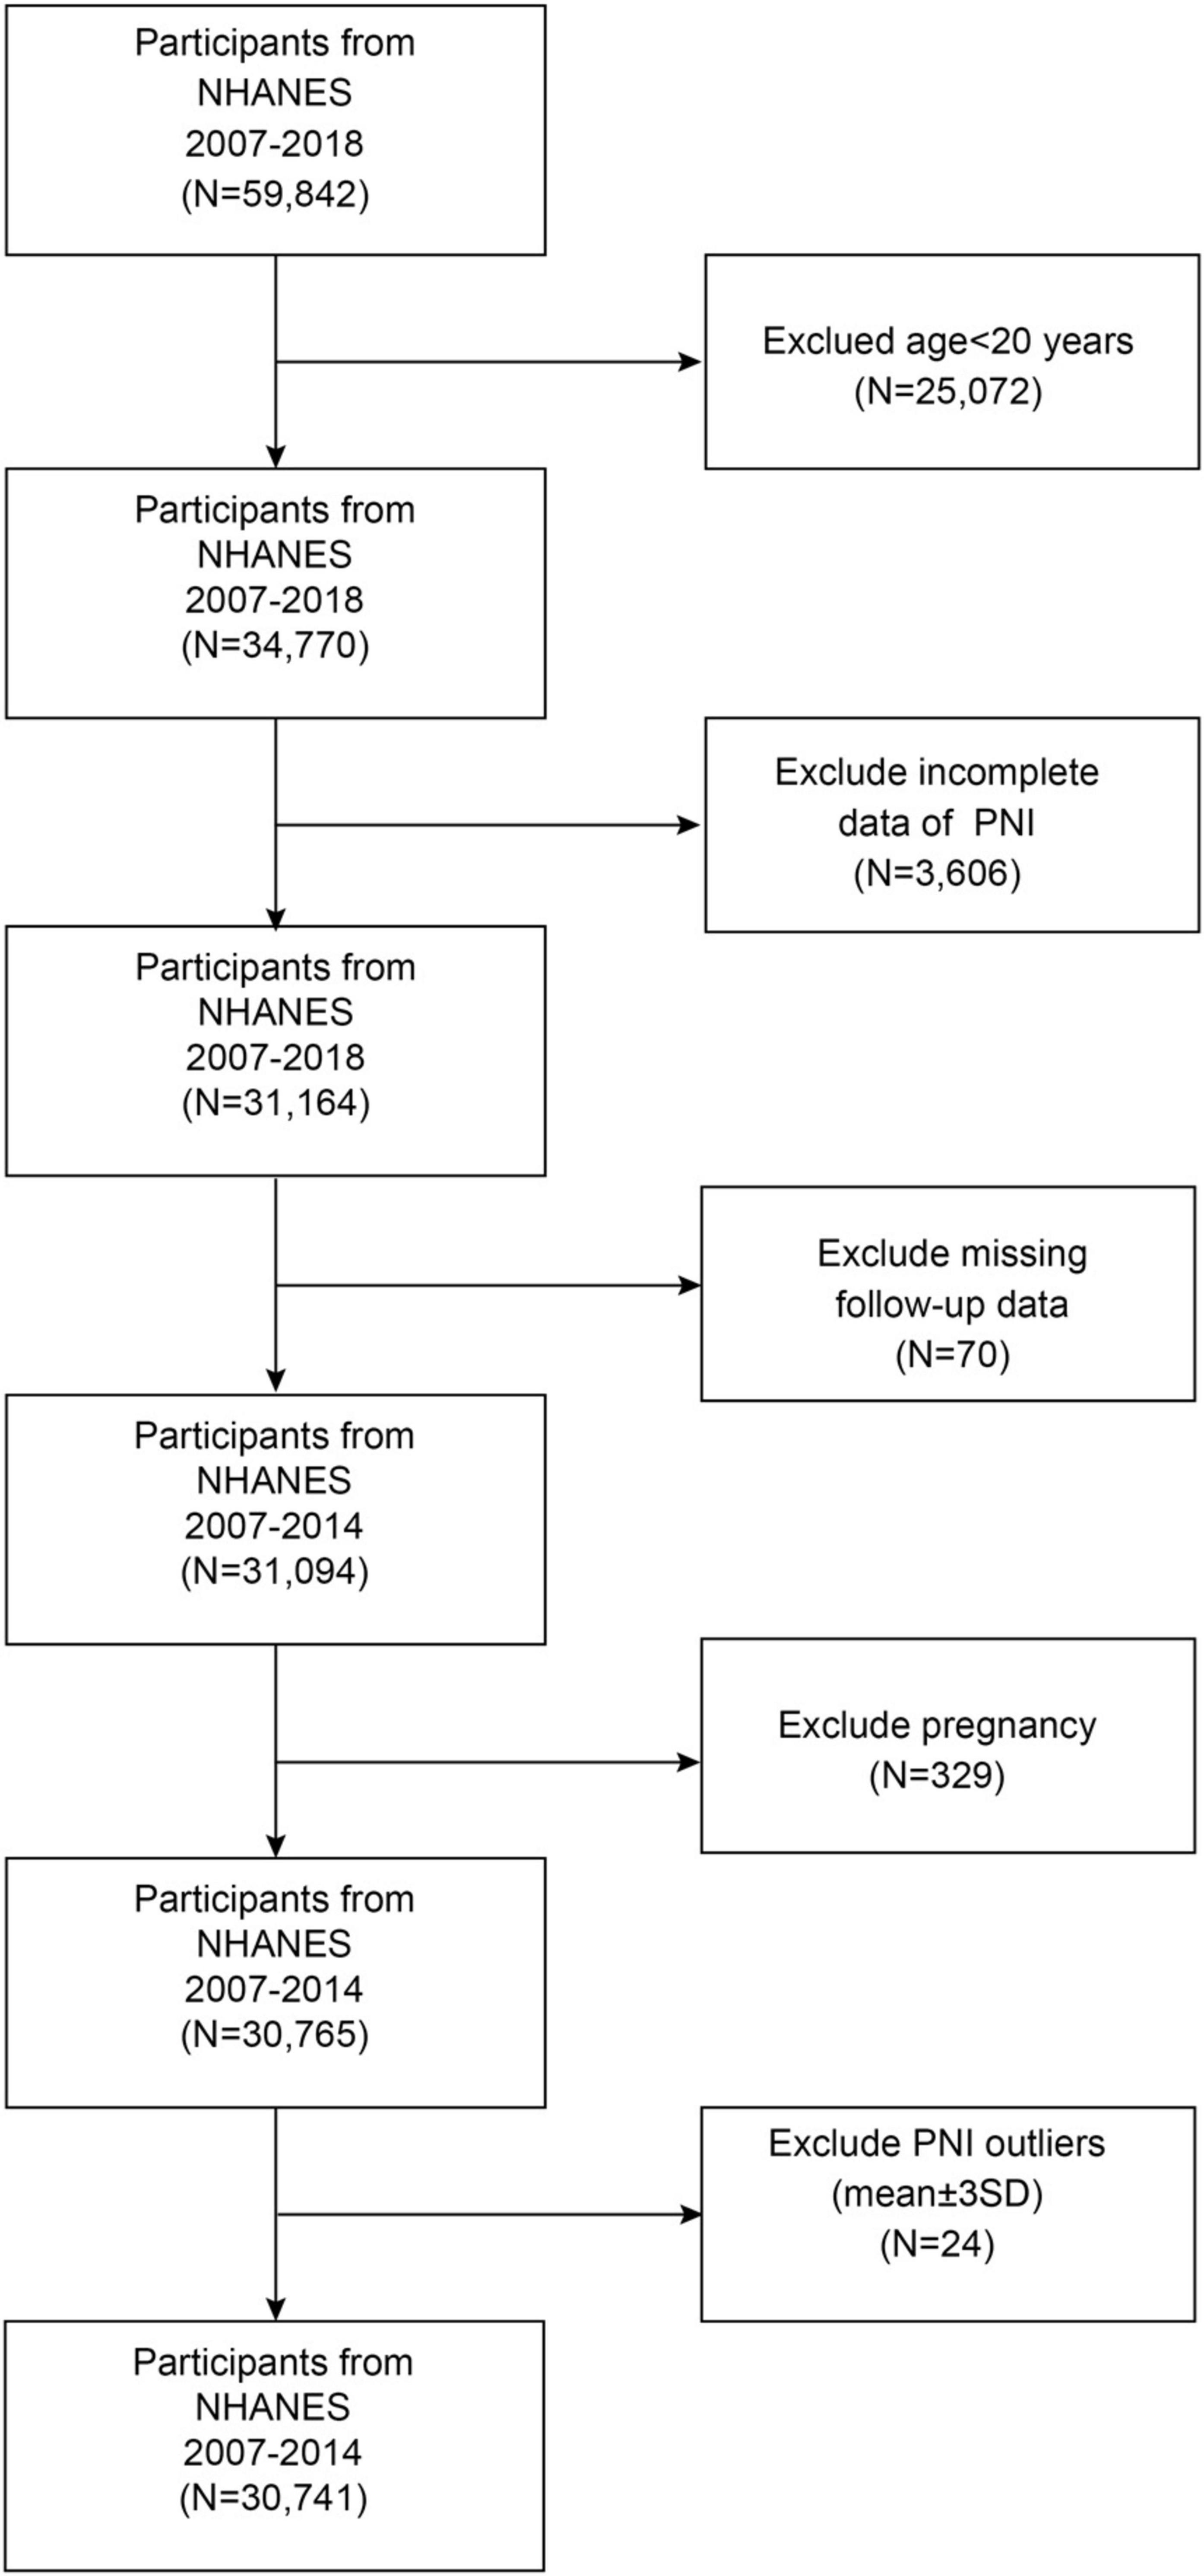
Figure 1. Flow chart of study participant selection.
2.2 Assessment of PNI
The PNI (17) was calculated using the following formula:
The serum albumin levels were measured using the bromocresol violet (BCP) method. At the same time, lymphocyte counts were obtained through complete blood count (CBC) analysis using a Beckman Coulter Automated Hematology Analyzer DxH 900 (Beckman-Coulter, Brea, CA, USA). The CBC analysis was performed following standardized NHANES protocols. Higher PNI values indicate better nutritional status.
2.3 All-cause and cardiovascular mortality
Assessment of mortality outcomes was conducted through comprehensive data linkage with the NDI records, with follow-up extending through 31 December 2019. The follow-up duration for each study participant was calculated from their initial NHANES Mobile Examination Center (MEC) examination date until either the date of death or the end of the follow-up period (31 December 2019), whichever occurred first. All-cause mortality encompassed deaths from any cause during the follow-up period, while cardiovascular mortality was specifically identified using the International Classification of Diseases, 10th Revision (ICD-10) coding system. Cardiovascular-related deaths were defined by ICD-10 codes, including acute rheumatic fever and chronic rheumatic heart diseases (I00–I09), hypertensive heart disease (I11), hypertensive heart and renal disease (I13), ischemic heart diseases and other forms of heart disease (I20–I51), and cerebrovascular diseases (I60–I69).
2.4 Definition of covariates
Sociodemographic and lifestyle factors were systematically collected during the baseline examination. Demographic variables included age, gender, race/ethnicity (categorized as Mexican American people, other Hispanic people, non-Hispanic White people, non-Hispanic Black people, and others), educational attainment (less than high school, high school or equivalent, and college or higher), marital status (married/cohabiting, widowed/divorced/separated, and never married), and family income-to-poverty ratio. Lifestyle factors encompassed sedentary behavior (<3, 3–6, and >6 h/day), smoking status (current, former, and never), and alcohol consumption patterns (non-drinker, <5, 5–10, and ≥10 drinks/month). Medical conditions were assessed through self-reported diagnoses, medication use, and clinical measurements. CVD was identified through self-reported physician-confirmed diagnoses of congestive heart failure, coronary heart disease, angina pectoris, myocardial infarction, or stroke. Hypertension was defined by meeting any of the following criteria: self-reported physician diagnosis, current use of antihypertensive medications, or measured blood pressure ≥ 130/80 mmHg. Diabetes was identified through self-reported diagnosis, use of insulin or antidiabetic medications, or laboratory values meeting established diagnostic criteria (fasting plasma glucose ≥ 7.0 mmol/L, 2-h postprandial glucose ≥ 200 mg/dl, or HbA1c ≥ 6.5%). Chronic obstructive pulmonary disease (COPD) status was determined based on self-reported physician diagnosis of chronic bronchitis, emphysema, or COPD. Depressive symptoms were evaluated using the Patient Health Questionnaire-9 (PHQ-9); clinically significant depression was defined as a PHQ-9 score ≥ 10. Additional covariates included body mass index (calculated from measured height and weight), presence of liver conditions and cancer (self-reported), high cholesterol (based on diagnosis and medication use), and use of medications affecting lipid or glucose profiles. The estimated glomerular filtration rate (eGFR) was estimated using the Chronic Kidney Disease Epidemiology Collaboration (CKD-EPI) equation.
2.5 Statistical analyses
Statistical analyses were conducted according to the National Center for Health Statistics guidelines, considering the survey weights required for the complex sampling design used in NHANES. The data were presented as survey-weighted mean [95% confidence intervals (CIs)] for continuous variables and survey-weighted percentage (95% CIs) for categorical variables. P values were calculated using survey-weighted linear regression for continuous variables and survey-weighted Chi-square tests for categorical variables. Missing data were addressed through random forest imputation to minimize potential bias. The PNI was divided into quartiles for the primary analyses. Survival curves were generated using the Kaplan–Meier method to estimate cumulative event-free survival probabilities across PNI quartile groups. The between-group differences were then assessed using the log-rank test. To examine the association between PNI and mortality outcomes, three Cox proportional hazards regression models were constructed: an unadjusted model (model 1), a demographic-adjusted model controlling for age, sex, and race/ethnicity (model 2), and a fully adjusted model (model 3). Model 3 incorporated a comprehensive range of demographic factors, including age, sex, race/ethnicity, education level, marital status, and income-to-poverty ratio. Additionally, lifestyle factors such as sedentary behavior, smoking status, and alcohol consumption were considered. Clinical measurements were also included, such as body mass index (BMI), hemoglobin, alanine aminotransferase (ALT), eGFR, and urine albumin-to-creatinine ratio (UACR). Furthermore, comorbidities, including cancer, depression, hypertension, COPD, dyslipidemia, diabetes, liver disease, CVD, and hyperuricemia were taken into account. Potential non-linear relationships were evaluated using restricted cubic spline analyses. Following confirmation of the existence of non-linear associations, two-piecewise Cox proportional hazards regression models were employed to identify threshold effects, with optimal threshold points determined through likelihood ratio tests. To assess the generalizability of our findings across diverse population subgroups, we conducted stratified analyses using the fully adjusted model (model 3). The prespecified subgroups included demographic characteristics [sex, age, race/ethnicity, education level, marital status, and ratio of family income to poverty (RIP)], and lifestyle factors (BMI, smoking status, and alcohol consumption). Additionally, the following clinical parameters were considered: UACR and eGFR. The presence or absence of comorbidities was also taken into account, including hypertension, COPD, dyslipidemia, diabetes, liver disease, cancer and malignancy, CVD, hyperuricemia, and depression. Interaction tests were conducted to ascertain the extent of heterogeneity in the associations between these subgroups. All analyses were conducted using R software, version 4.3.1 (The R Foundation),2 and Empower (R) (X&Y Solutions, Inc., Boston, MA, USA). The threshold for statistical significance was set at a two-sided P-value of less than 0.05.
3 Results
3.1 Baseline characteristics of the participants
The median follow-up time was 7.25 years (interquartile range: 4.17–10.17 years) for the entire cohort of 30,741 participants. Table 1 presents the study population’s baseline characteristics, categorized by PNI quartiles. The study’s average participant age was represented across the quartiles, with non-Hispanic White people making up most of the cohort. Participants in the lowest PNI quartile (Q1) were generally older, more likely to be female, and non-Hispanic Black people than those in the highest PNI quartile (Q4). They were also associated with lower income-to-expense ratios and higher BMI. Additionally, Q1 participants exhibited a higher prevalence of chronic conditions like hypertension, diabetes, and CVD. While lower quartile participants were less likely to consume alcohol, the frequency of current smoking increased in higher quartiles, demonstrating a statistically significant variation across groups.
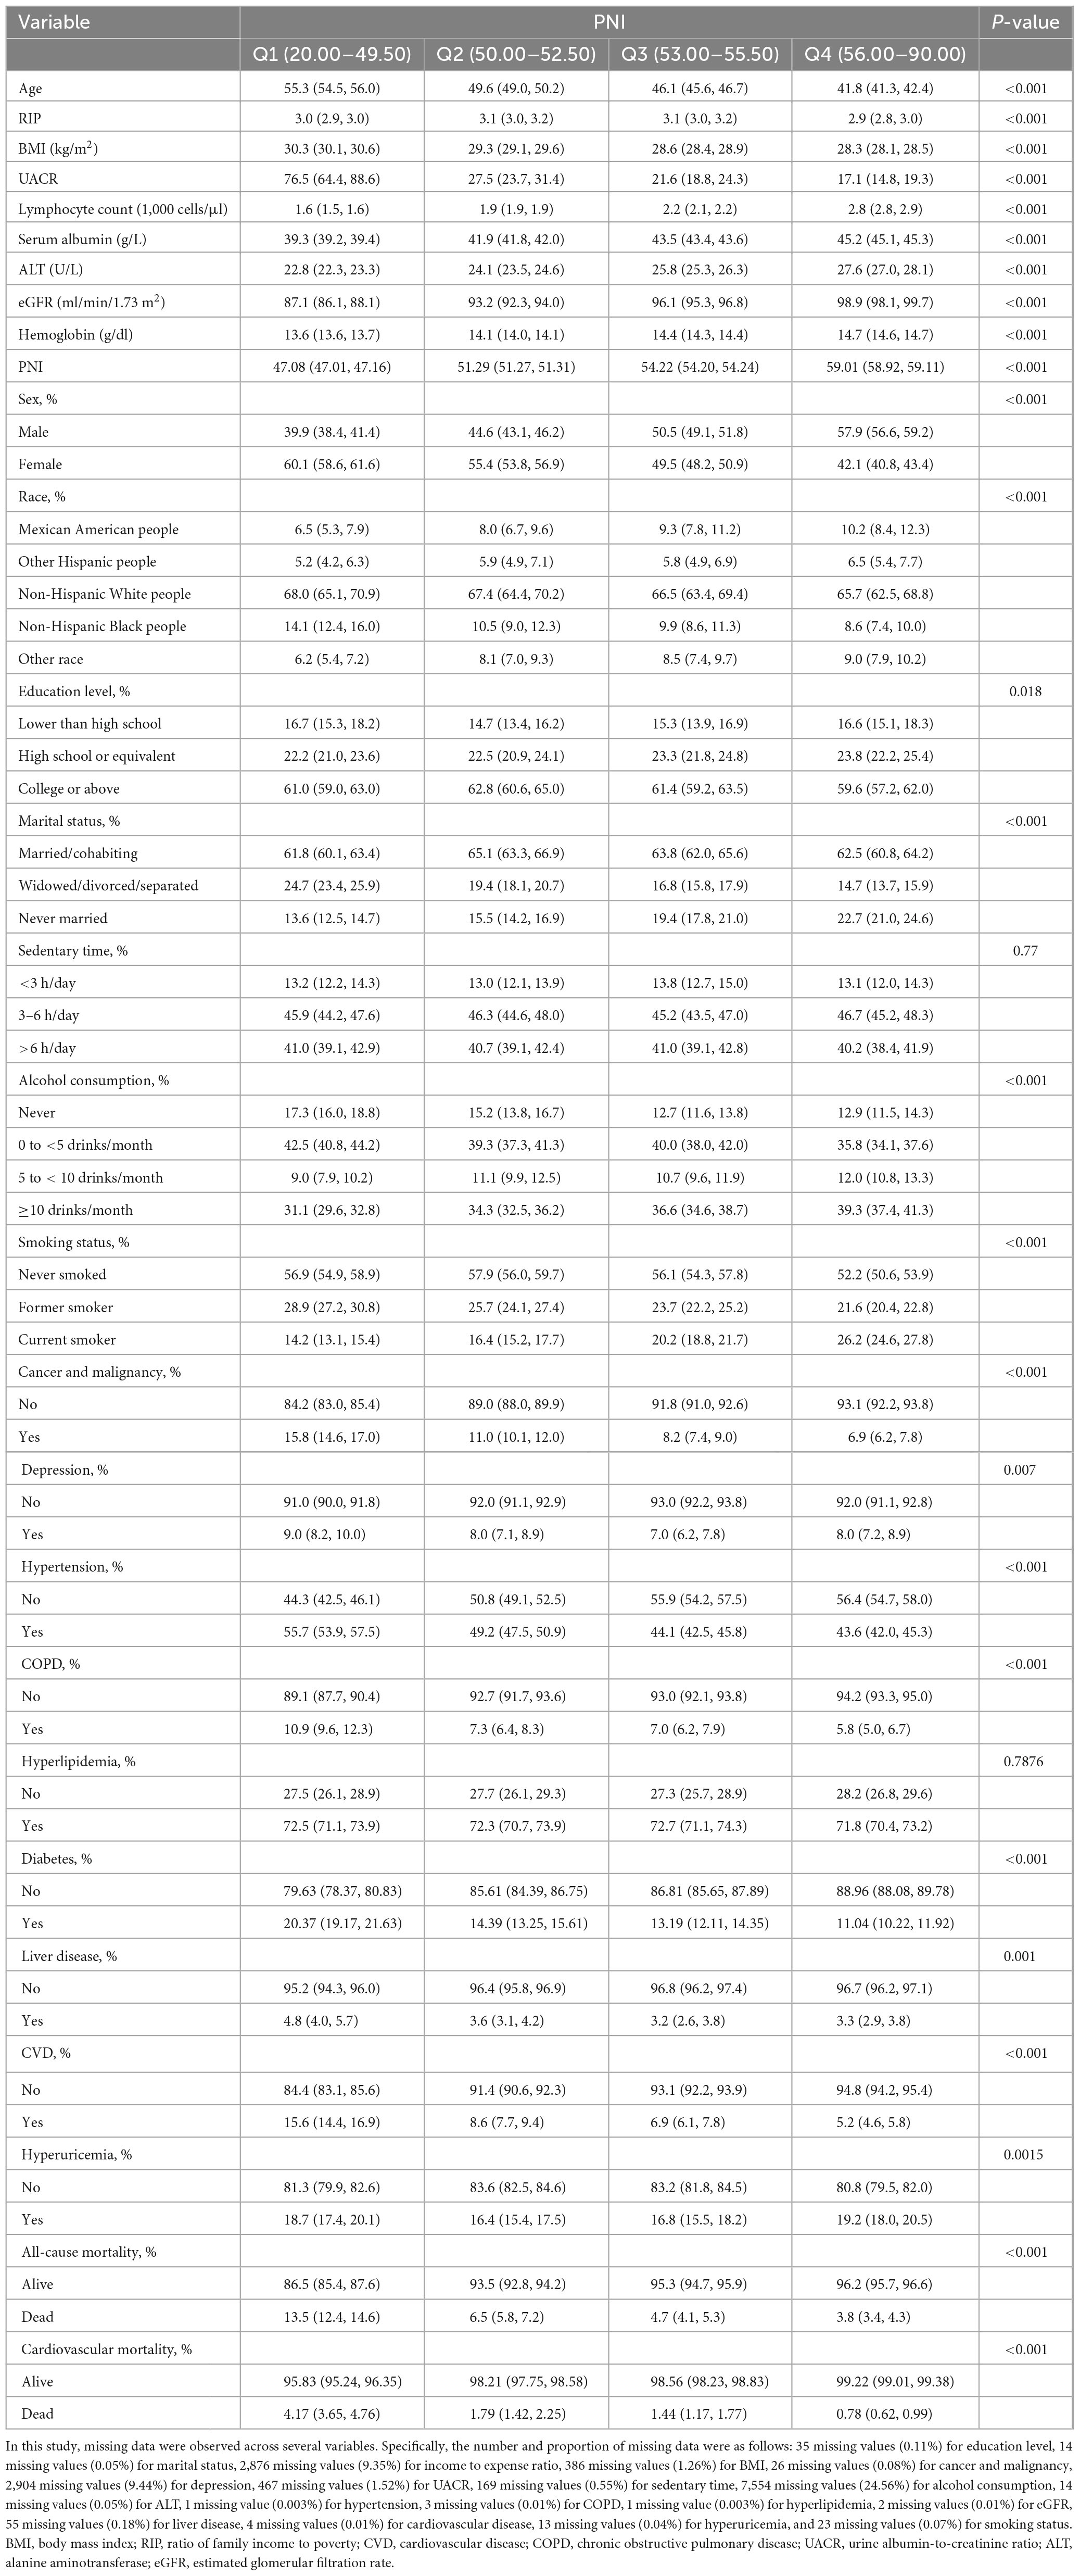
Table 1. Basic characteristics of study participants stratified by PNI, weighted.
3.2 Association between PNI and mortality
Survival curve analysis demonstrated a significant increase in survival rates with higher PNI values in both all-cause and cardiovascular mortality (P < 0.0001) (Figure 2). This pattern was consistently observed in our chronic kidney disease (CKD) subgroup analysis, where higher PNI quartiles showed superior survival outcomes over 13 years of follow-up (Supplementary Figure 1).
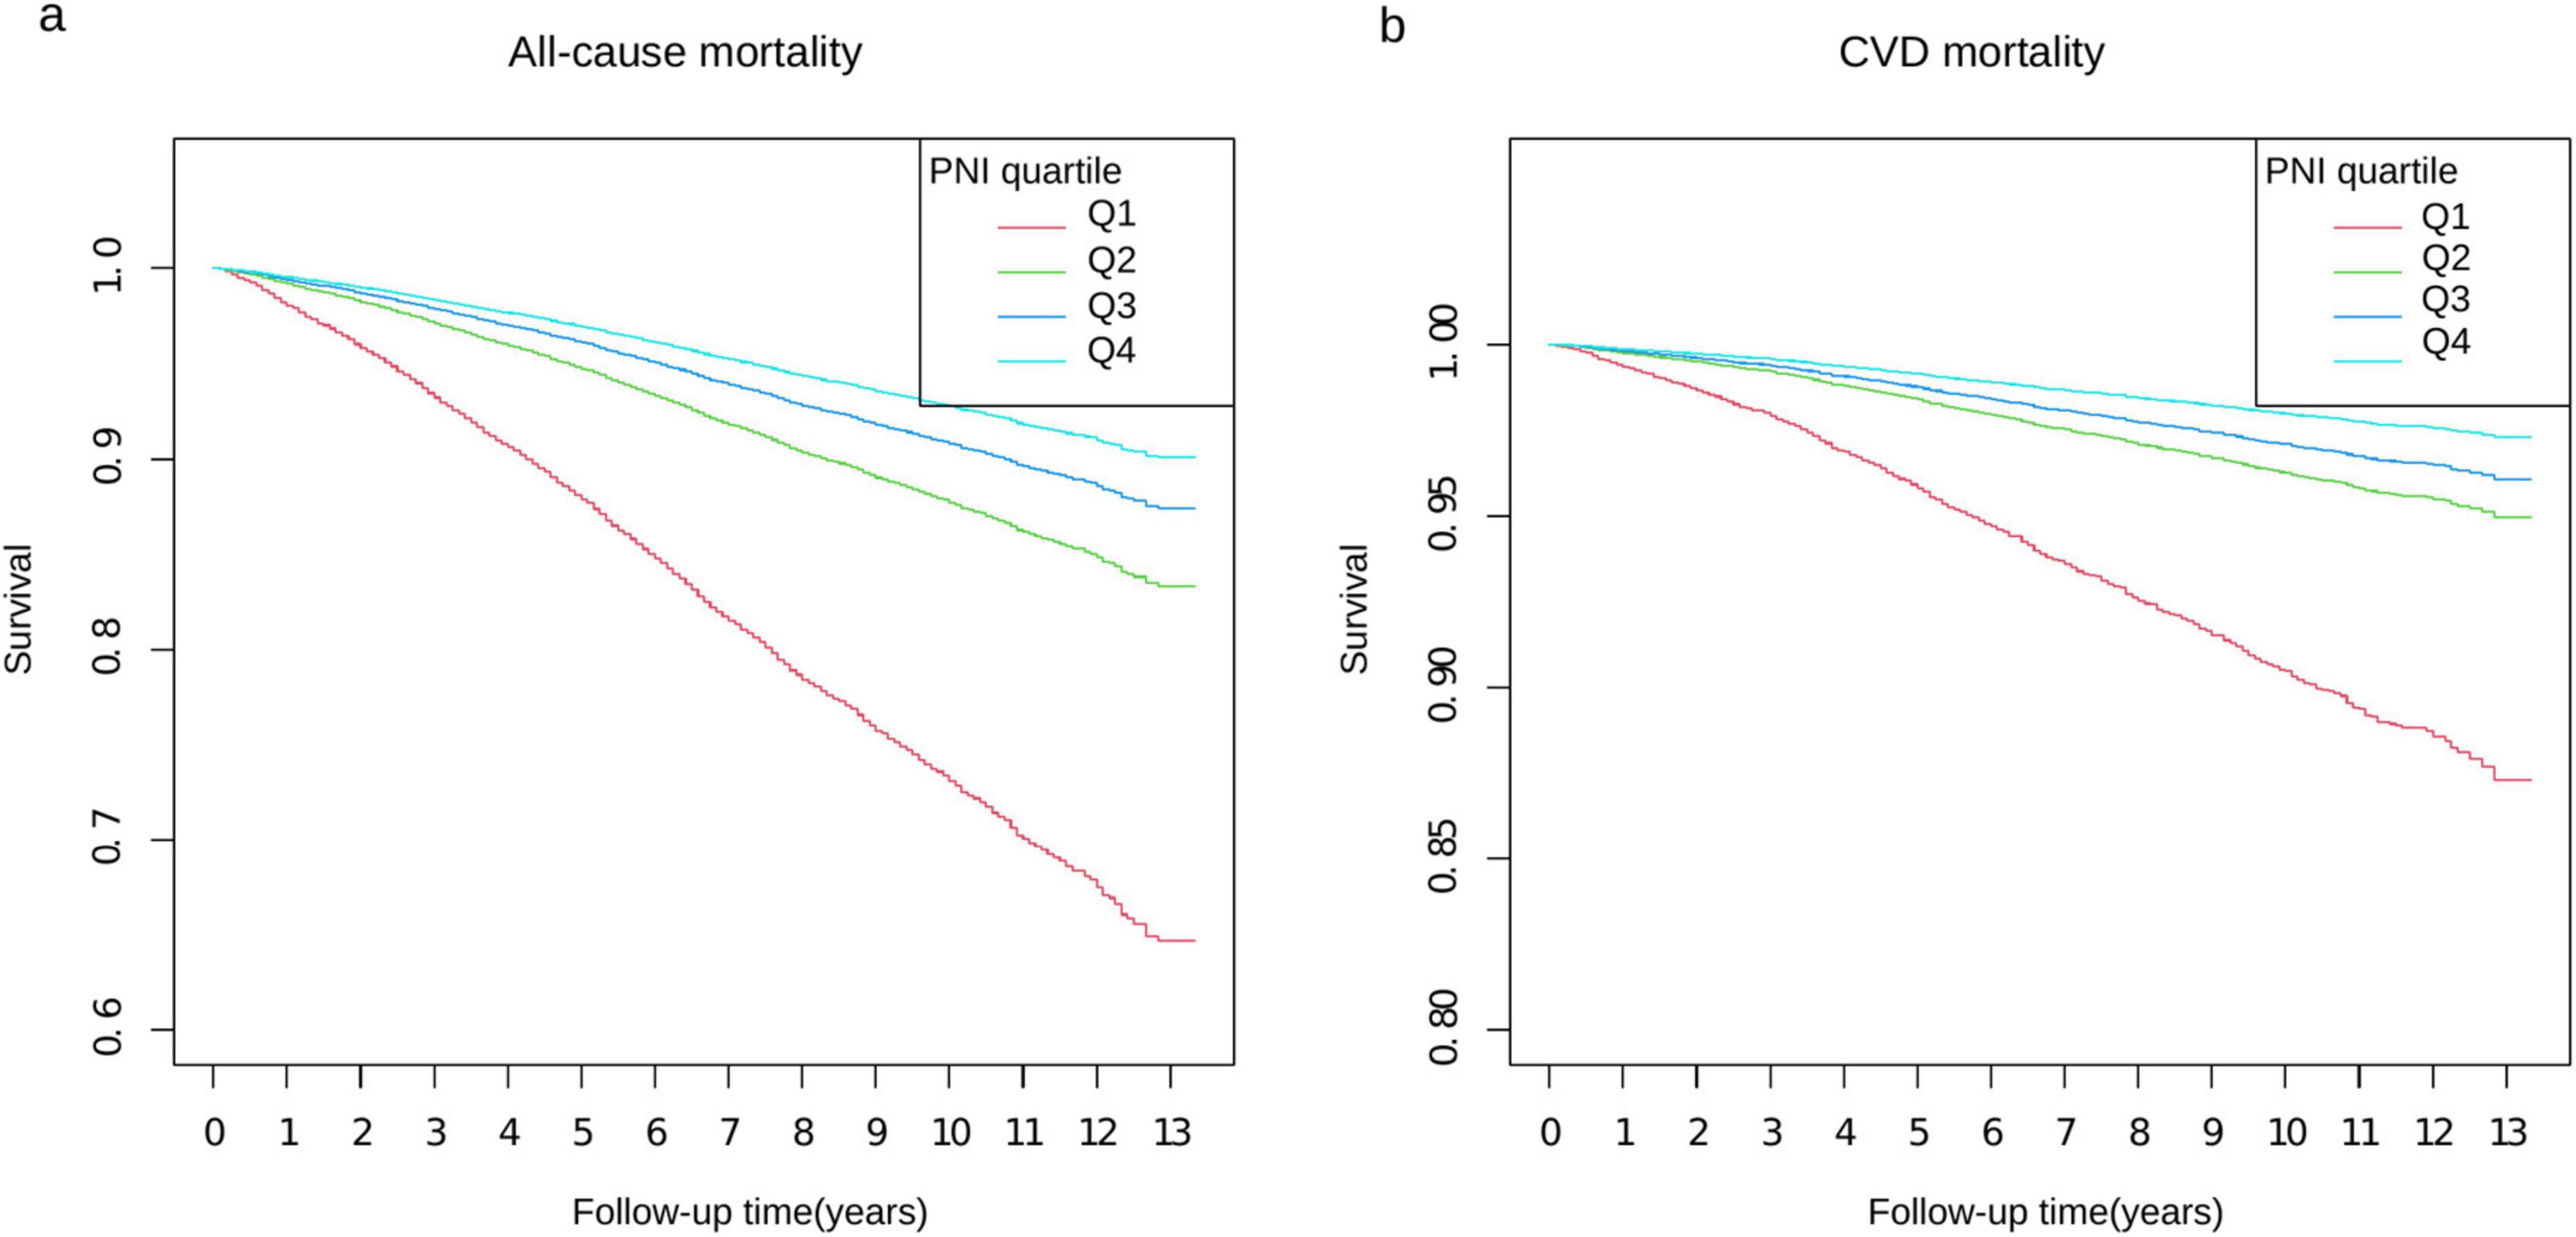
Figure 2. Kaplan–Meier survival curves stratified by PNI quartiles. Panel (a) shows all-cause mortality and panel (b) shows CVD mortality over 13 years of follow-up. The y-axis represents survival probability, with panel (a) ranging from 0.6 to 1.0 and panel (b) from 0.80 to 1.0. Four PNI quartiles (Q1–Q4) are represented by different colored lines: Q1 (red), Q2 (green), Q3 (blue), and Q4 (light blue). The x-axis shows the follow-up time in years from 0 to 13.
Table 2 presents the associations between PNI and mortality outcomes across three increasingly adjusted models. Our findings demonstrate robust and consistent relationships between PNI and both all-cause and cardiovascular mortality, with evidence of dose-dependent protective effects.
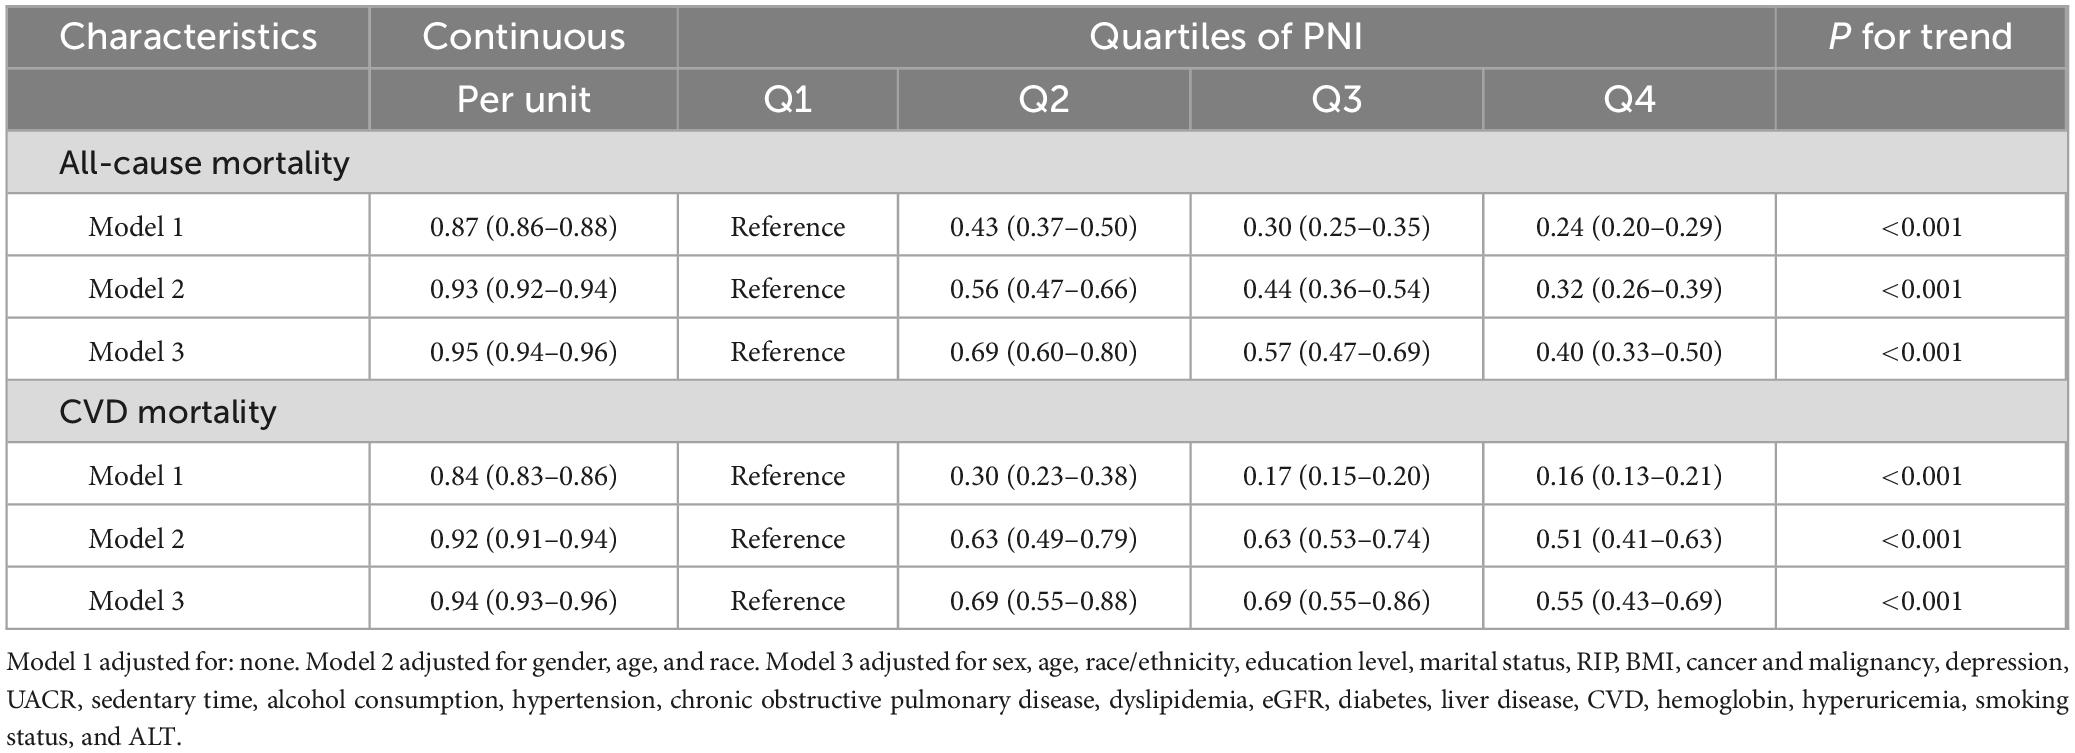
Table 2. Association of PNI with all-cause and CVD mortality using weighted Cox proportional hazards models, weighted.
In the analysis of all-cause mortality, the fully adjusted model (model 3) demonstrated that each unit increase in PNI was associated with a 5% reduction in mortality risk (HR: 0.95, 95% CI: 0.94–0.96, P < 0.001). To further characterize this relationship, we performed quartile analysis, which revealed a significant dose-response relationship (P for trend < 0.001): with Q1 as a reference, the HRs were 0.69 (95% CI: 0.60–0.80) for Q2, 0.57 (95% CI: 0.47–0.69) for Q3, and 0.40 (95% CI: 0.33–0.50) for Q4.
For cardiovascular mortality, the fully adjusted model showed that each unit increase in PNI was associated with a 6% reduction in mortality risk (HR: 0.94, 95% CI: 0.93–0.96, P < 0.001). Quartile analysis also demonstrated a significant dose-response relationship (P for trend < 0.001): with Q1 as a reference, the HRs were 0.69 (95% CI: 0.55–0.88) for Q2, 0.69 (95% CI: 0.55–0.86) for Q3, and 0.55 (95% CI: 0.43–0.69) for Q4.
The effect estimates attenuated from the crude model to the fully adjusted model: for all-cause mortality, the HR weakened from 0.87 (95% CI: 0.86–0.88) to 0.95 (95% CI: 0.94–0.96), and for cardiovascular mortality, from 0.84 (95% CI: 0.83–0.86) to 0.94 (95% CI: 0.93–0.96). However, all associations remained statistically significant across all models (all P < 0.001).
3.3 Dose-response relationship between PNI and mortality
As illustrated in Figure 3, restricted cubic spline analyses revealed significant non-linear associations between PNI and mortality outcomes (P for non-linearity < 0.001 for both all-cause and cardiovascular mortality) after adjusting for potential confounders.
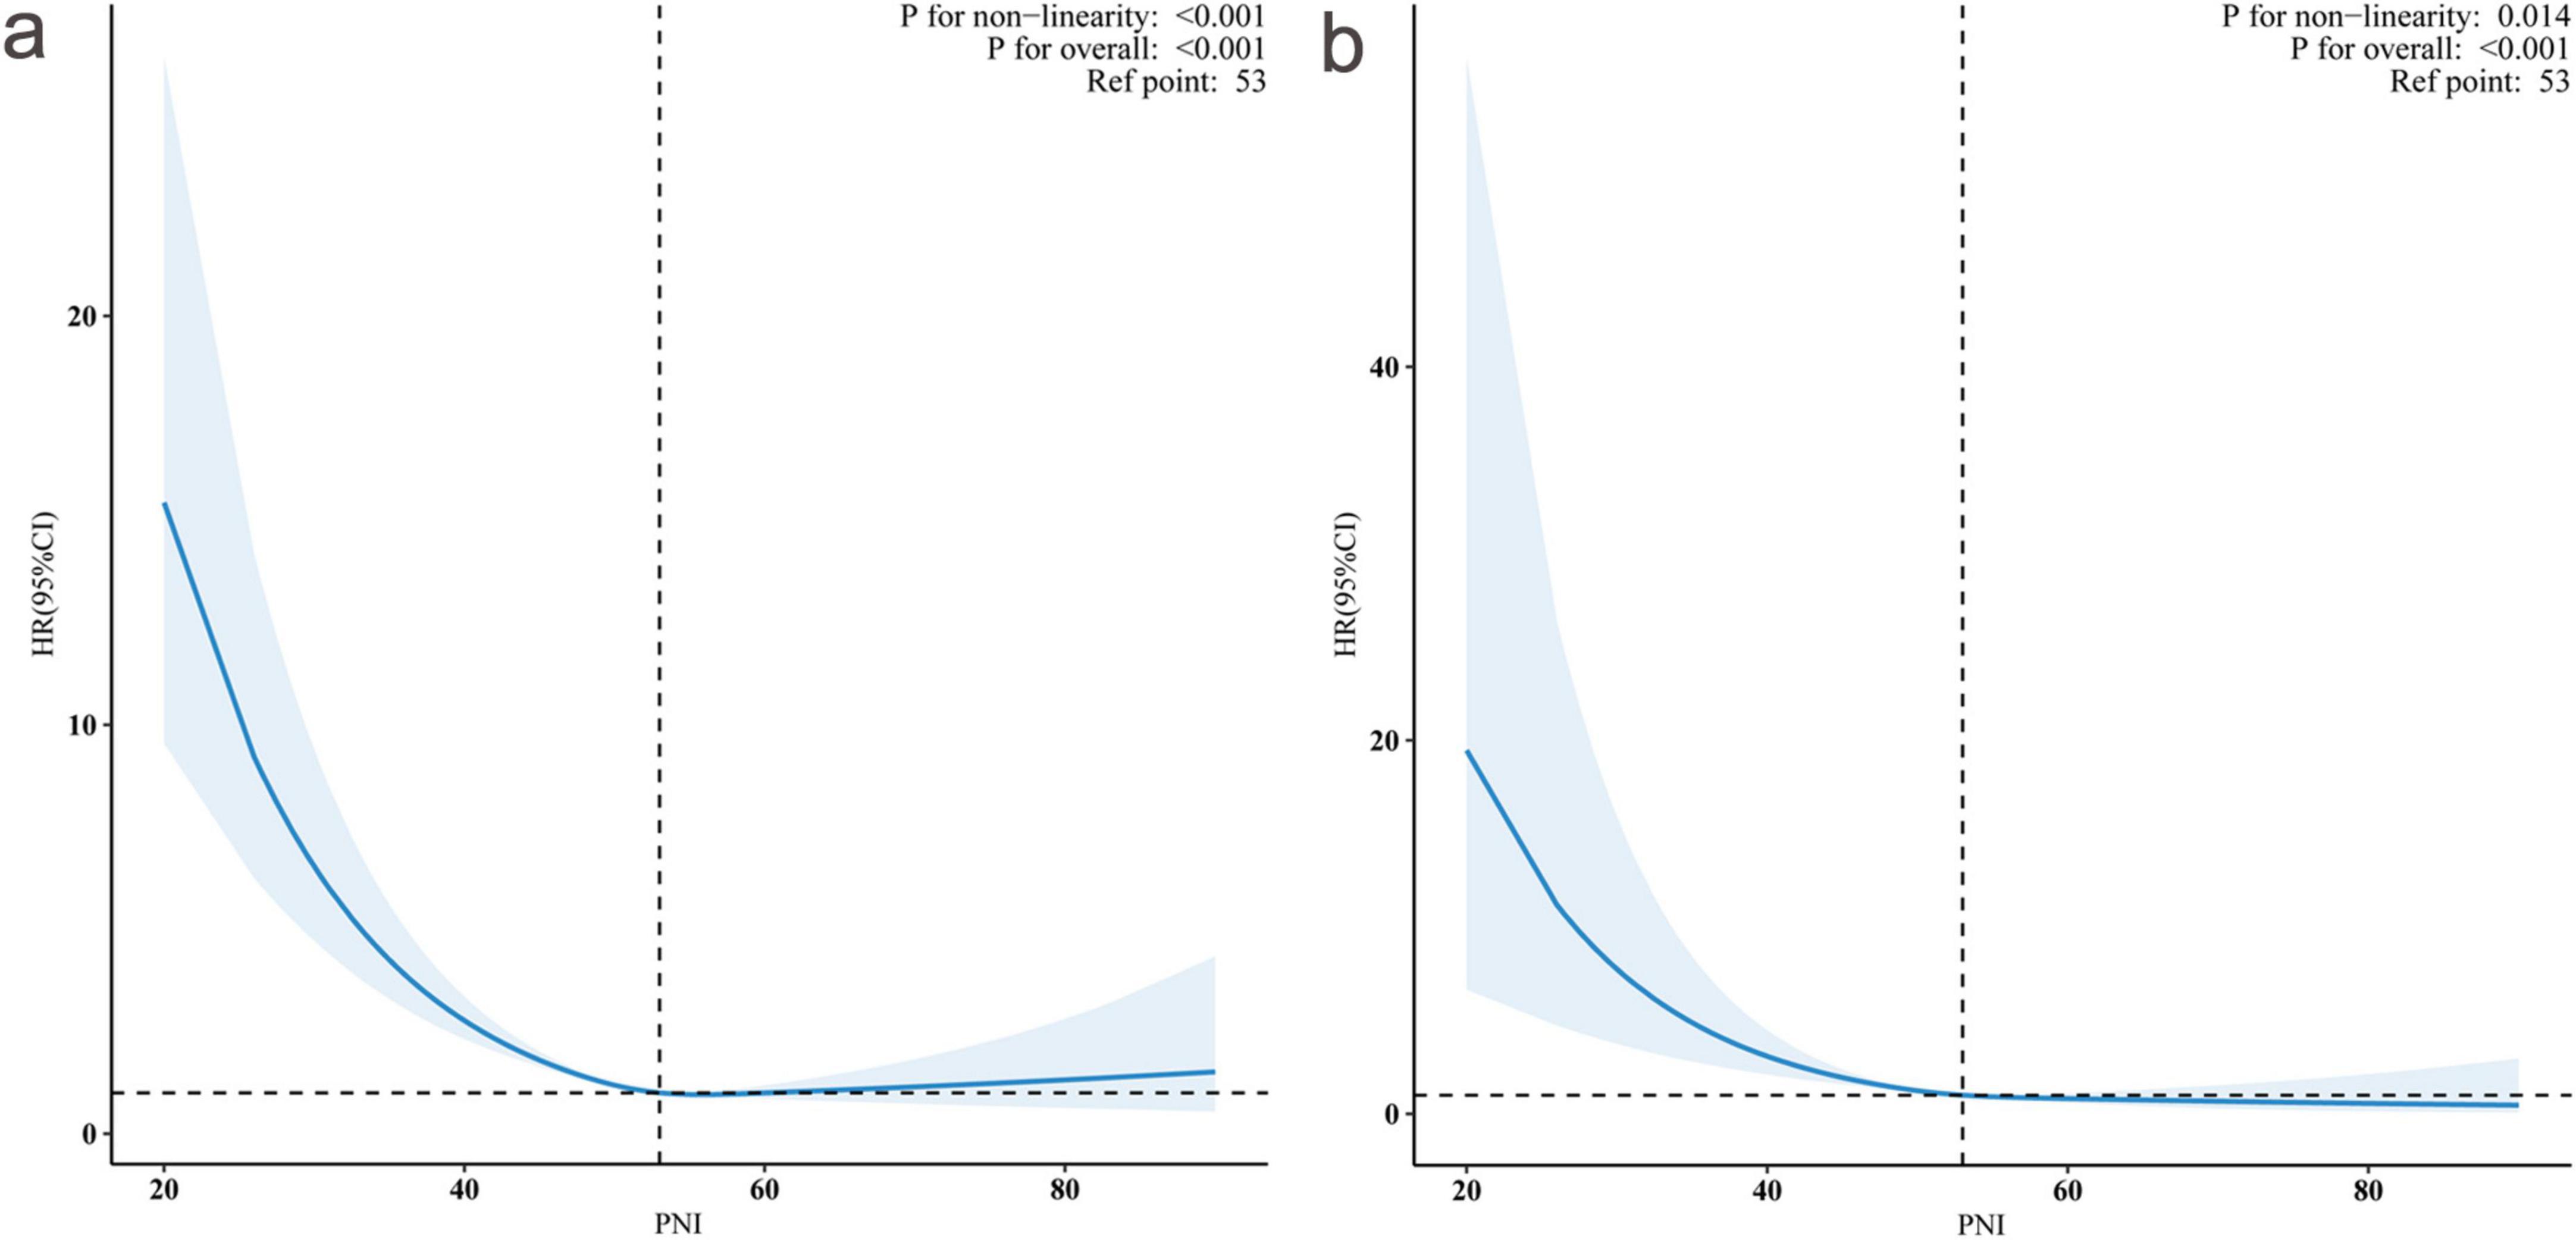
Figure 3. Non-linear association between prognostic nutritional index (PNI) and hazard ratios (HRs) for all-cause and cardiovascular mortality. Restricted cubic spline curves showing the relationship between PNI and adjusted HRs with 95% confidence intervals (shaded areas). Panel (a) demonstrates the association with all-cause mortality (P for non-linearity < 0.001), and panel (b) shows cardiovascular mortality (P for non-linearity = 0.014). The reference point was PNI = 53 (vertical dashed lines, HR = 1.0). Both outcomes showed significant overall associations (P < 0.001 for both).
We conducted threshold effect analyses using two-piecewise Cox proportional hazards regression models to explore potential non-linear relationships between PNI and mortality outcomes (Table 3). Our results revealed distinct inflection points in the association between PNI and both mortality outcomes, with significant threshold effects confirmed by log-likelihood ratio tests (both P < 0.001).
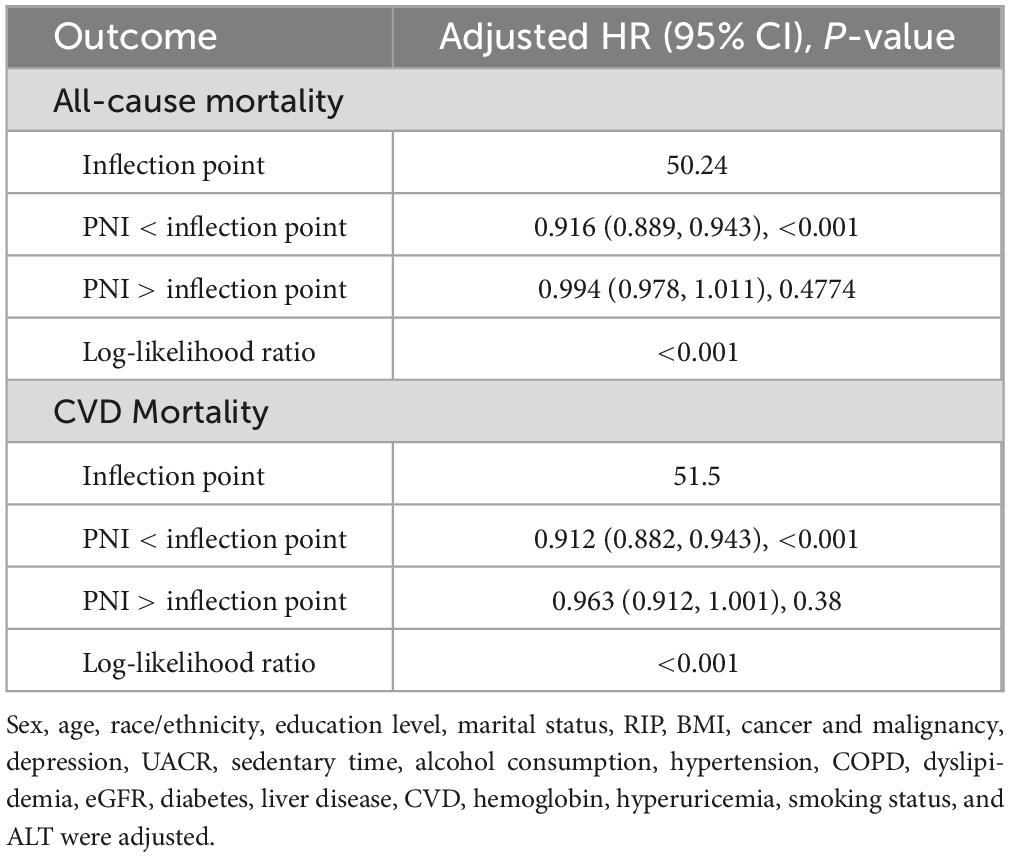
Table 3. Threshold effect analysis of PNI and all-cause mortality and CVD mortality.
For all-cause mortality, we identified an inflection point at PNI = 50.24. Below this threshold, each unit increase in PNI was associated with an 8.4% reduction in mortality risk (HR: 0.916, 95% CI: 0.889–0.943, P < 0.001), indicating a strong protective effect. However, above this threshold, the association became statistically non-significant (HR: 0.994, 95% CI: 0.978–1.011, P = 0.4774). This pattern implies that the protective effect of PNI against all-cause mortality may reach its maximum benefit at approximately 50.24 units.
Similarly, the analysis identified an inflection point at PNI = 51.50 for cardiovascular mortality. In the lower PNI range (<51.50), each unit increase was associated with an 8.8% reduction in cardiovascular mortality risk (HR: 0.912, 95% CI: 0.882–0.943, P < 0.001). Beyond this threshold, the association weakened and became non-significant (HR: 0.963, 95% CI: 0.912–1.001, P = 0.38).
These findings were further validated in our supplementary analysis of CKD patients. The Supplementary material demonstrates consistent non-linear associations between PNI and mortality outcomes in this high-risk subpopulation, with similar threshold patterns observed (Supplementary Figure 2).
3.4 Subgroup analyses
Figure 4 shows the subgroup analyses conducted to evaluate the consistency of the association between the PNI and mortality outcomes across various population characteristics. For all-cause mortality, the protective association of PNI was largely consistent across most subgroups. Significant effect modifications were observed for liver disease (P for interaction = 0.002) and hyperuricemia (P for interaction = 0.015). Notably, the association was more pronounced among participants with liver disease (HR: 0.88, 95% CI: 0.84–0.92) than those without liver disease (HR: 0.96, 95% CI: 0.95–0.97). Similarly, the protective association differed by hyperuricemia status, with slightly stronger effects observed in participants with hyperuricemia (HR: 0.94, 95% CI: 0.92–0.96) compared to those without (HR: 0.96, 95% CI: 0.94–0.97). This suggests that patients with hyperuricemia might benefit more from improved nutritional status, possibly due to the complex interactions between uric acid metabolism, inflammation, and nutritional status. This also suggests a potentially heightened protective effect of PNI in individuals with compromised liver function, possibly due to the nutritional and metabolic challenges associated with liver disease.
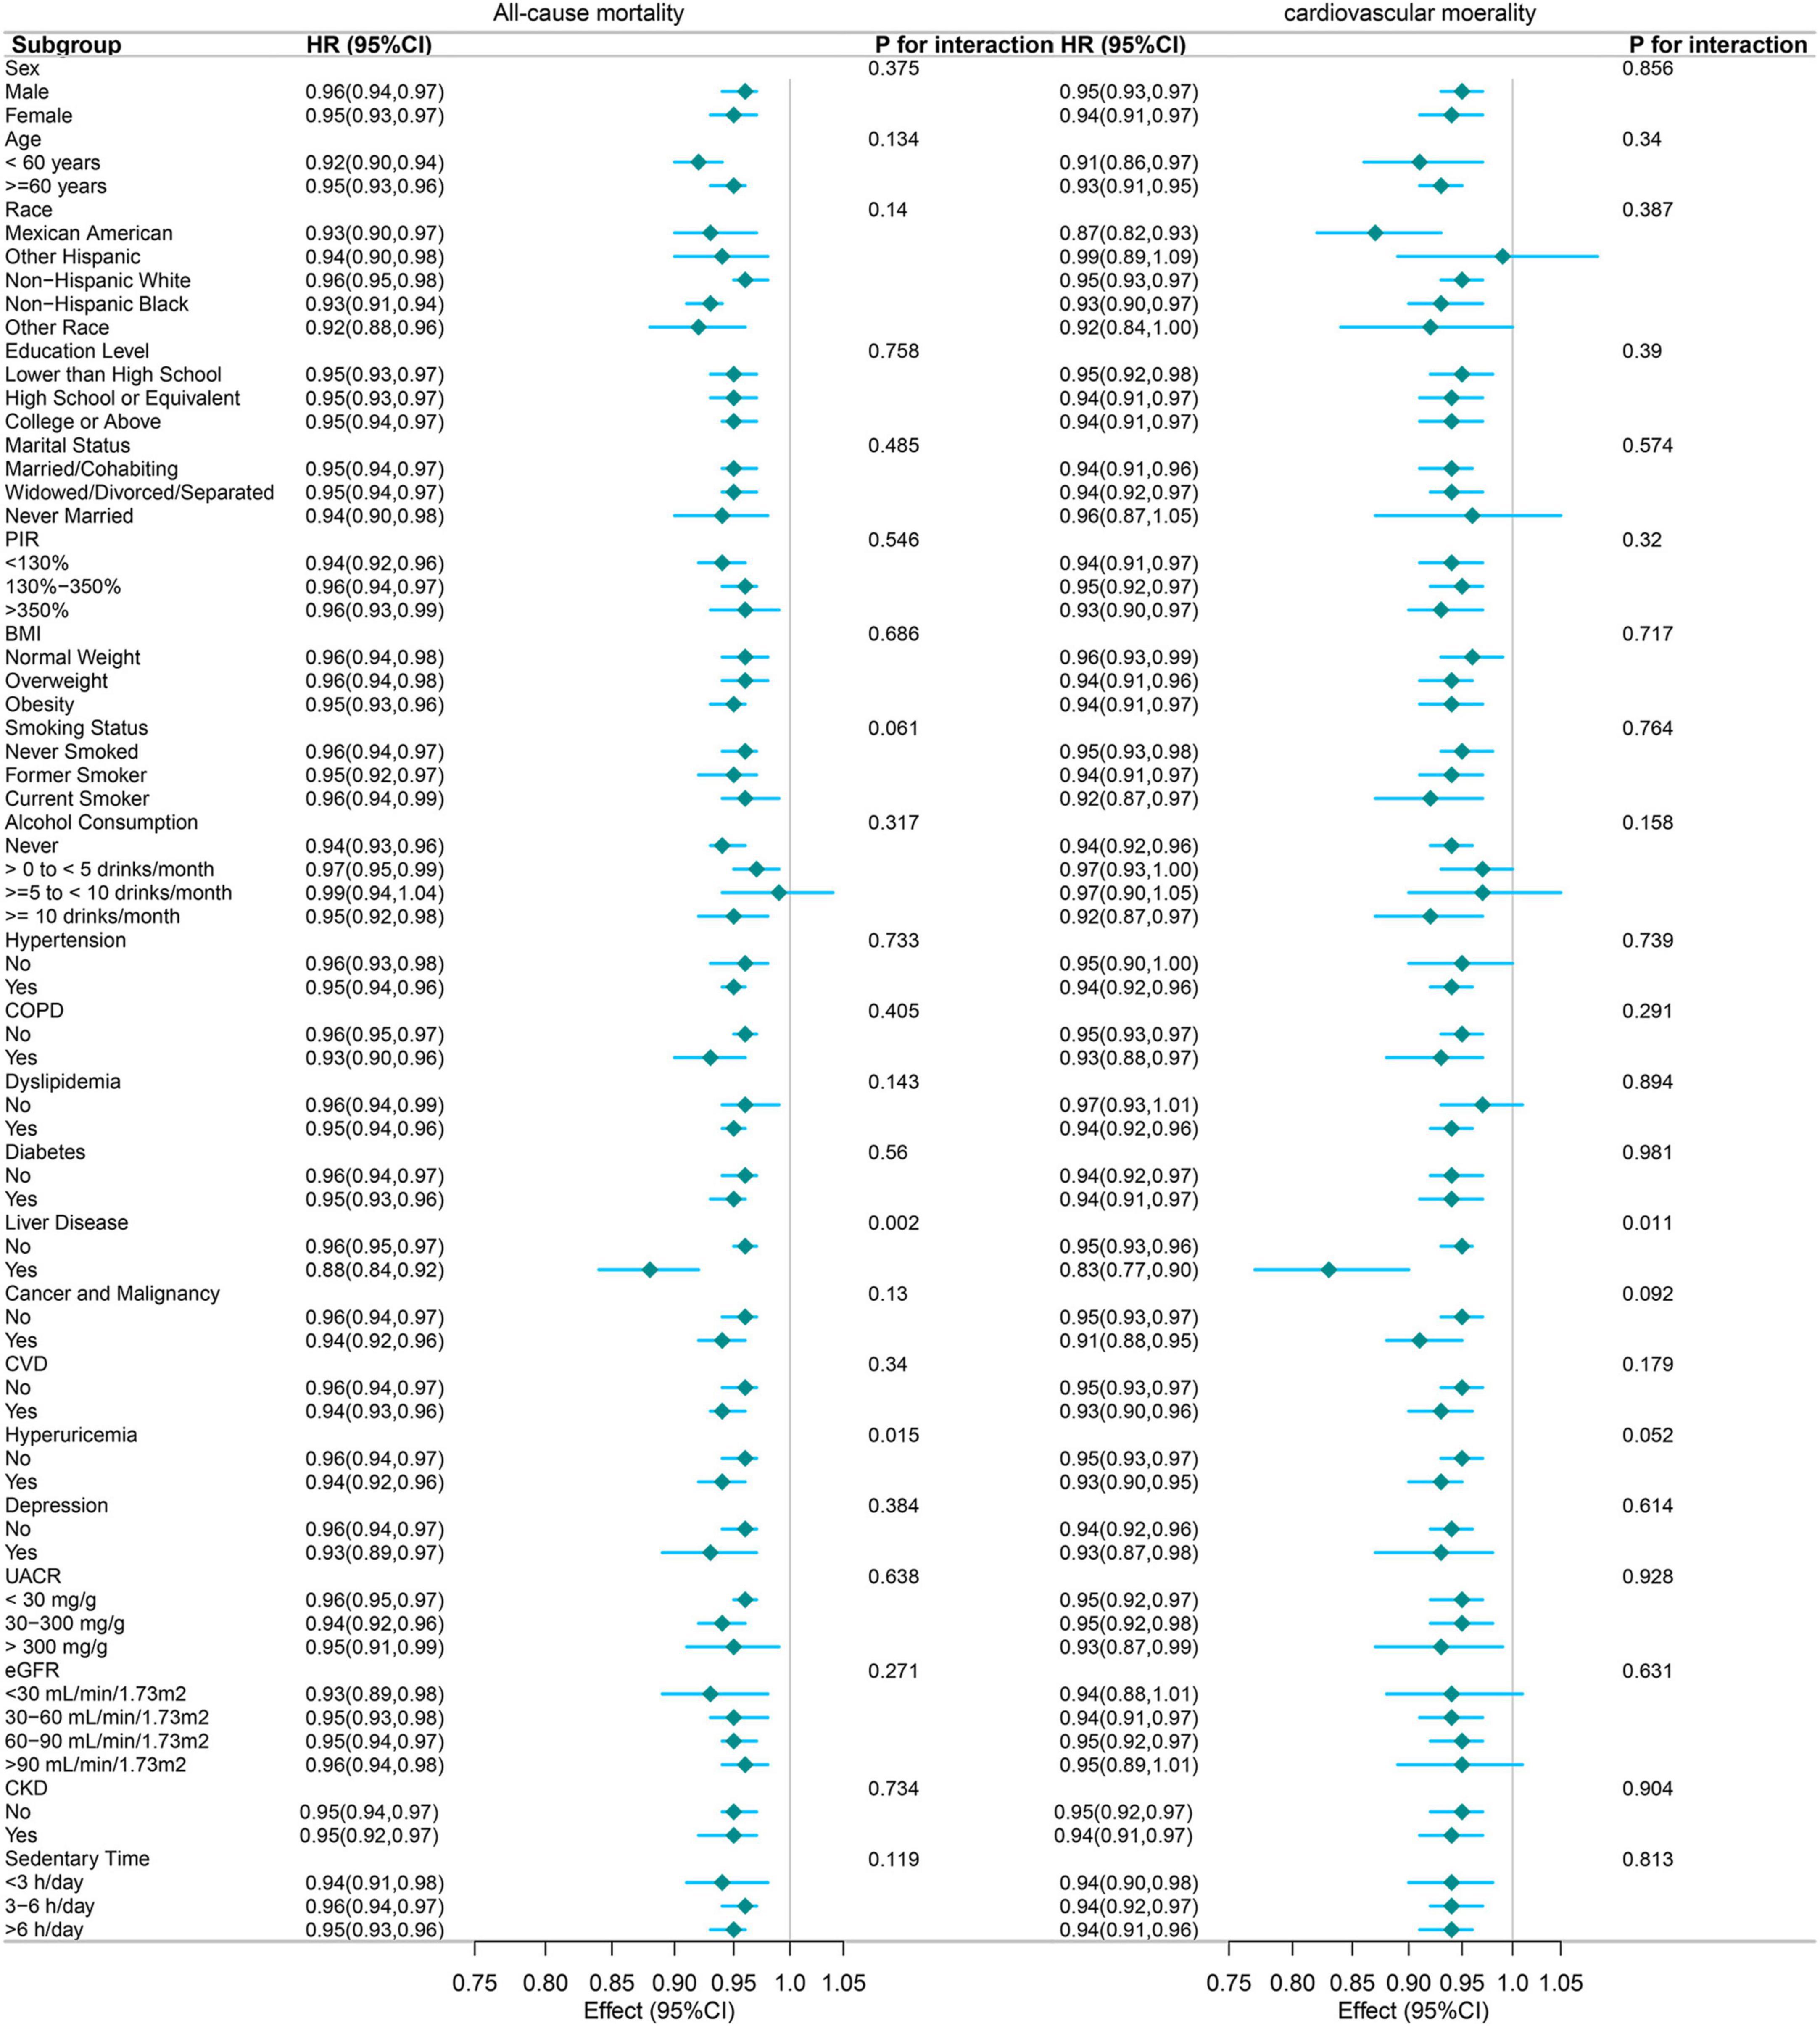
Figure 4. Forest plot of subgroup analyses examining the association between PNI (per 1-unit increase) and mortality outcomes. The following variables were adjusted in the study, except for the specific variable being analyzed in each subgroup: Sex, age, race/ethnicity, education level, marital status, RIP, BMI, cancer and malignancy, depression, UACR, sedentary time, alcohol consumption, hypertension, COPD, dyslipidemia, eGFR, diabetes, liver disease, cardiovascular disease, hemoglobin, hyperuricemia, smoking status, and ALT.
For cardiovascular mortality, the protective association was similarly consistent across subgroups, with liver disease again emerging as the sole significant effect modifier (P for interaction = 0.011). Participants with liver disease exhibited a stronger protective association (HR: 0.83, 95% CI: 0.77–0.90) compared to those without (HR: 0.96, 95% CI: 0.93–0.96). This finding underscores the potential importance of nutritional status in mitigating cardiovascular risk among patients with liver disease.
The robustness of these associations was evident across various demographic characteristics, including age, sex, race, education level, and marital status. Furthermore, the associations remained consistent across vital clinical parameters, such as hypertension, diabetes, CVD, COPD, and different categories of eGFR, and CKD.
While the magnitude of association varied slightly across different subgroups, the protective effect of higher PNI values remained statistically significant in most stratified analyses, with hazard ratios consistently below 1.00. This consistent pattern suggests that the protective association between PNI and mortality outcomes is largely independent of demographic and clinical characteristics, supporting its potential utility as a robust prognostic indicator across diverse patient populations. Future research should explore the underlying mechanisms driving these associations, particularly in subgroups with significant effect modifications.
4 Discussion
This large-scale, population-based study of 30,741 U.S. adults revealed several important findings regarding the association between PNI and mortality outcomes. First, we demonstrated a robust inverse association of PNI with all-cause and cardiovascular mortality, with each unit increase in PNI associated with a 5% and 6% reduction in risk, respectively. Second, we identified significant non-linear relationships and critical threshold points in these associations: PNI of 50.24 for all-cause mortality and 51.50 for cardiovascular mortality, beyond which the protective effects plateaued. Third, the protective association was particularly pronounced among participants with liver disease, suggesting a potentially heightened importance of nutritional status in this subgroup. Fourth, quartile analyses revealed a clear dose-response relationship, with individuals in the highest PNI quartile showing 60% lower all-cause mortality risk and 45% lower cardiovascular mortality risk compared to those in the lowest quartile. These associations remained robust after comprehensive adjustment for potential confounders and were largely consistent across various demographic and clinical subgroups, supporting PNI’s potential utility as a valuable prognostic indicator in the general U.S. adult population.
Our findings align with several recent studies examining the prognostic value of PNI while offering unique insights through our larger general population focus. Yu et al. (18) demonstrated that PNI was inversely associated with all-cause mortality in CKD patients, identifying a critical threshold of 50.5, similar to our threshold of 50.24 for all-cause mortality. This result is generally consistent with the findings based on our CKD population (Supplementary Figures 1, 2). Interestingly, in our study, the effect of PNI on all-cause mortality was consistent between CKD and non-CKD populations. Our supplementary analyses in CKD patients (Supplementary Figures 1, 2) provide robust validation of our main findings in a high-risk subpopulation particularly vulnerable to nutritional and immune dysfunction. The consistency of protective associations between CKD and non-CKD populations underscores PNI’s broad clinical applicability as a prognostic tool across diverse patient populations. The similar threshold values observed in both the general population and CKD subgroup further support the clinical utility of our identified PNI cut-off points for risk stratification. Through analyzing data from 14,349 NHANES and NDI subjects (2013–2018), Zhang et al. (17) found that PNI was significantly negatively correlated with the risk of diabetic kidney disease and all-cause mortality in type 2 diabetes mellitus patients. A critical PNI threshold of 50.5 was identified, below which patients faced increased risks of both outcomes (17). Xu et al.’s (19) study in elderly populations with COPD found that lower PNI was associated with increased all-cause mortality. A study analyzed data from the NHANES between 2007 and 2018 to investigate the relationship between PNI and mortality risk in patients with gestational diabetes mellitus (GDM). The findings indicate that each unit increase in PNI is associated with a 9% reduction in all-cause mortality risk among GDM patients. Furthermore, the study identified a critical PNI threshold of 50.75, below which the mortality risk is higher, while above this threshold, the risk is significantly reduced (20). Notably, our study’s larger sample size and broader population base provide more robust evidence for PNI’s utility as a prognostic indicator. While previous studies focused on specific disease populations (CKD, diabetes, and COPD), our investigation of the general U.S. adult population reveals the broader applicability of PNI as a mortality risk predictor. The non-linear relationship we identified, with plateauing effects above certain thresholds, aligns with findings from previous studies, though our identified thresholds differ slightly. Our observation of powerful protective associations in liver disease patients adds a novel dimension to the existing literature, as this specific subgroup analysis was absent in previous studies. The consistency of our findings across various demographic and clinical subgroups, coupled with the larger scale and comprehensive adjustment for confounders, strengthens the evidence base for PNI’s role in mortality risk assessment.
The underlying mechanisms for the negative correlation between PNI and mortality can be attributed to several factors. Firstly, malnutrition often leads to a compromised immune response, increasing susceptibility to infections and other complications that can exacerbate cardiovascular conditions (21). Additionally, malnutrition is associated with systemic inflammation, contributing to CVD progression (22). The inflammatory response can lead to endothelial dysfunction, a precursor to atherosclerosis and other cardiovascular events, thereby increasing mortality risk (23). Moreover, the relationship between PNI and mortality is particularly pronounced in elderly populations and those with chronic conditions. For example, studies have shown that elderly patients with low PNI value scores face significantly higher mortality risks due to the interplay of malnutrition, frailty, and comorbidities (24). This demographic often experiences a higher prevalence of malnutrition, which can exacerbate existing health issues and lead to poorer clinical outcomes (25).
The more prominent PNI associations observed in patients with liver disease and hyperuricemia can be explained through several evidence-based mechanisms. In liver disease patients, hepatic dysfunction directly compromises albumin synthesis, which is a core component of PNI calculation. Research demonstrates that PNI correlates closely with liver function, with PNI having important prognostic value in patients with chronic liver disease (26). Furthermore, PNI combines serum albumin levels and lymphocyte counts, serving as a validated tool for assessing immune-nutritional status (27). In liver disease patients, both immune function and nutritional status are simultaneously compromised, making PNI a particularly important predictor of disease severity and mortality. Regarding hyperuricemia patients, hyperuricemia is strongly linked to CVD risk, including hypertension, coronary artery disease, arrhythmia, and heart failure (28). Studies demonstrate that even slight increases in serum uric acid levels are independent risk factors for all-cause and cardiovascular mortality (29). Under metabolic stress conditions such as liver disease and hyperuricemia, the integration of nutritional and immune parameters reflected by PNI may better capture overall physiological reserve and mortality risk. Research indicates that PNI reflects immune nutrition and inflammation status, with low PNI values consistently associated with poor outcomes (30). Therefore, in these specific disease states, the prognostic value of PNI is amplified, demonstrating stronger associations with mortality outcomes.
Our study has several notable strengths. First, we utilized data from NHANES, a well-established nationwide database with standardized collection protocols and rigorous quality control measures. Notably, using survey weights in our analyses allows our findings to be representative of the broader U.S. adult population, enhancing the generalizability of our results. Second, our study included a large sample size with diverse demographic characteristics, providing sufficient statistical power to detect meaningful associations and conduct robust subgroup analyses. Third, we implemented comprehensive adjustment strategies for multiple potential confounders, including socioeconomic factors, demographic characteristics, comorbidities, and laboratory parameters, strengthening our findings’ validity. Fourth, the extended follow-up period allowed for a thorough assessment of long-term outcomes and mortality risks. Finally, our findings remained consistent across various sensitivity analyses and subgroup examinations, supporting the robustness of the observed associations between PNI and mortality outcomes.
Nevertheless, several limitations should be acknowledged. First, although NHANES provides comprehensive nationally representative data with standardized collection protocols, the cross-sectional nature of the baseline measurements means that changes in PNI over time could not be assessed. Second, while we conducted extensive adjustments for multiple potential confounders and performed various sensitivity analyses, as with all observational studies, the possibility of residual confounding cannot be eliminated. Third, although our study included a large sample size with diverse demographic characteristics, the findings may not be fully generalizable to populations outside the United States or specific clinical settings. Finally, while the follow-up period provided robust mortality data, future studies with even longer follow-up durations might reveal additional insights into the long-term prognostic value of PNI.
Our findings have several important clinical implications. First, PNI represents a readily available and practical tool for risk stratification in clinical practice, as it can be easily calculated from routine laboratory parameters (serum albumin and lymphocyte count). Second, our results suggest that healthcare providers should pay particular attention to patients with low PNI values, as they may be at increased risk for adverse outcomes. Regular monitoring of PNI could help identify high-risk patients who might benefit from more intensive surveillance and early intervention. Third, given the strong association between PNI and mortality outcomes, nutritional intervention strategies should be considered for patients with low PNI value scores. These interventions might include dietary modifications, nutritional supplementation, and lifestyle changes. Finally, the observed differences in PNI associations across various subgroups suggest the need for personalized approaches to nutritional assessment and intervention strategies, taking into account individual patient characteristics and comorbidities.
5 Conclusion
In conclusion, this large-scale, population-based study demonstrates a significant association between PNI and mortality outcomes in the U.S. adult population. Our findings indicate that an increase of one unit in PNI is associated with a 5% reduction in all-cause mortality and a 6% reduction in cardiovascular mortality risk. The critical threshold values were identified at 50.24 and 51.50, respectively. The protective associations were particularly pronounced among individuals with liver disease, and a clear dose-response relationship was observed across PNI quartiles. These associations remained consistent after comprehensive adjustment for potential confounding variables across various demographic and clinical subgroups. Our findings indicate that PNI may serve as a valuable indicator for risk stratification in clinical practice. Further prospective studies are required to validate these findings and assess whether interventions to improve PNI can effectively modify mortality risk in high-risk populations.
Data availability statement
The raw data supporting the conclusions of this article will be made available by the authors, without undue reservation.
Ethics statement
The studies involving humans were approved by the institutional review board of the National Center for Health Statistics, CDC (https://www.cdc.gov/nchs/nhanes/irba98.htm). The studies were conducted in accordance with the local legislation and institutional requirements. The participants provided their written informed consent to participate in this study.
Author contributions
CZ: Conceptualization, Methodology, Validation, Writing – original draft, Writing – review & editing. YZ: Writing – original draft, Writing – review & editing. TW: Writing – original draft, Writing – review & editing. YW: Validation, Writing – review & editing. XL: Validation, Writing – review & editing. XK: Supervision, Writing – review & editing.
Funding
The author(s) declare that no financial support was received for the research and/or publication of this article.
Acknowledgments
We express our appreciation to the National Center for Health Statistics at the CDC for their role in designing, collecting, and administering the NHANES data and making them accessible for public use.
Conflict of interest
The authors declare that the research was conducted in the absence of any commercial or financial relationships that could be construed as a potential conflict of interest.
Generative AI statement
The author(s) declare that no Generative AI was used in the creation of this manuscript.
Publisher’s note
All claims expressed in this article are solely those of the authors and do not necessarily represent those of their affiliated organizations, or those of the publisher, the editors and the reviewers. Any product that may be evaluated in this article, or claim that may be made by its manufacturer, is not guaranteed or endorsed by the publisher.
Supplementary material
The Supplementary Material for this article can be found online at: https://www.frontiersin.org/articles/10.3389/fnut.2025.1530452/full#supplementary-material
Footnotes
References
1. Onodera T, Goseki N, Kosaki G. Prognostic nutritional index in gastrointestinal surgery of malnourished cancer patients. Nihon Geka Gakkai Zasshi. (1984) 85:1001–5.
2. Zhang X, Zhang J, Liu F, Li W, Zhang T, Fang B, et al. Prognostic nutritional index (PNI) as a predictor in patients with metabolic syndrome and heart failure. Diabetes Metab Syndr Obes. (2023) 16:2503–14. doi: 10.2147/DMSO.S420924
3. Tanemura A, Mizuno S, Hayasaki A, Gyoten K, Fujii T, Iizawa Y, et al. Onodera’s prognostic nutritional index is a strong prognostic indicator for patients with hepatocellular carcinoma after initial hepatectomy, especially patients with preserved liver function. BMC Surg. (2020) 20:261. doi: 10.1186/s12893-020-00917-2
4. Lee Y, Lin P, Wu S, Hsu H, Yang S, Kor C. Impact of the prognostic nutritional index on renal replacement therapy–free survival and mortality in patients on continuous renal replacement therapy. Ren Fail. (2024) 46:2365394. doi: 10.1080/0886022X.2024.2365394
5. Wada H, Dohi T, Miyauchi K, Jun S, Endo H, Doi S, et al. Relationship between the prognostic nutritional index and long-term clinical outcomes in patients with stable coronary artery disease. J Cardiol. (2018) 72:155–61. doi: 10.1016/j.jjcc.2018.01.012
6. Cheng Y, Sung S, Cheng H, Hsu P, Guo C, Yu W. Prognostic nutritional index and the risk of mortality in patients with acute heart failure. J Am Heart Assoc. (2017) 6:e004876. doi: 10.1161/jaha.116.004876
7. Otaki Y, Watanabe T, Shimizu M, Tachibana S, Sato J, Kobayashi Y, et al. Association of malnutrition with renal dysfunction and clinical outcome in patients with heart failure. Sci Rep. (2022) 12:16673. doi: 10.1038/s41598-022-20985-z
8. Tekin Tak B, Ekizler F, Kafes H, Çay S, Ozcan Cetin E, Özeke Ö, et al. Low prognostic nutritional index is associated with adverse outcomes in patients with hypertrophic cardiomyopathy. Turkish J Clin Lab. (2020) 11:136–45. doi: 10.18663/tjcl.731609
9. Liu T, Zheng Y, Tang J, Wang W, Dai X, Zhang J, et al. Prognostic nutritional index as a novel predictor of long-term prognosis in patients with coronary artery disease after percutaneous coronary intervention. Clin Appl Thrombosis. (2022) 28:10760296221103271. doi: 10.1177/10760296221103271
10. Demirtas Inci S, Sunman H, Nur Ozkaya Ibis A, Erzurum M, Özbeyaz NB, Algül E, et al. The role of prognostic nutritional index in patients with non-ST segment elevation acute coronary syndrome. Kardiologiia. (2021) 61:59–65. doi: 10.18087/cardio.2021.1.n1254
11. Peng P, Chen L, Shen Q, Xu Z, Ding X. Prognostic nutritional index (PNI) and Controlling Nutritional Status (CONUT) score for predicting outcomes of breast cancer: A systematic review and meta-analysis. Pak J Med Sci. (2023) 39:1535–41. doi: 10.12669/pjms.39.5.7781
12. Aktas G. Association between the prognostic nutritional index and chronic microvascular complications in patients with type 2 diabetes mellitus. J Clin Med. (2023) 12:5952. doi: 10.3390/jcm12185952
13. Mohsin N, Shaker E, Salih K, Jabbar K, Ibrahim A. The predictive value of prognostic nutritional index in patients with COVID-19. Biomedicine. (2022) 42:992–8. doi: 10.51248/.v42i5.1932
14. Zhao L, Shen X, Yang L, Wang P, Zhang J, Liu N, et al. Association of prognostic nutritional index with mortalities in American adult cancer survivors: A cohort study based on NHANES, 1999–2018. Food Sci Nutr. (2024) 12:1834–46. doi: 10.1002/fsn3.3877
15. Tsuda S, Nakayama M, Tanaka S, Haruyama N, Yoshitomi R, Fukui A, et al. The association of controlling nutritional status score and prognostic nutritional index with cardiovascular diseases: The fukuoka kidney disease registry study. J Atheroscler Thromb. (2023) 30:390–407. doi: 10.5551/jat.63501
16. Almohammadi A, Alqarni M, Alqaidy M, Ismail S, Almabadi R. Impact of the prognostic nutritional index on postoperative outcomes in patients undergoing heart surgery. Cureus. (2023) 15:e43745. doi: 10.7759/cureus.43745
17. Zhang J, Chen Y, Zou L, Gong R. Prognostic nutritional index as a risk factor for diabetic kidney disease and mortality in patients with type 2 diabetes mellitus. Acta Diabetol. (2023) 60:235–45. doi: 10.1007/s00592-022-01985-x
18. Yu J, Chen Y, Yin M. Association between the prognostic nutritional index (PNI) and all-cause mortality in patients with chronic kidney disease. Ren Fail. (2023) 45:2264393. doi: 10.1080/0886022X.2023.2264393
19. Xu Y, Yan Z, Li K, Liu L, Xu L. Association between nutrition-related indicators with the risk of chronic obstructive pulmonary disease and all-cause mortality in the elderly population: Evidence from NHANES. Front Nutr. (2024) 11:1380791. doi: 10.3389/fnut.2024.1380791
20. Cao J, Bu X, Chen J, Zhang X. Associations of prognostic nutritional index with risk of all-cause and cardiovascular disease mortalities in persons with gestational diabetes mellitus: A NHANES-based analysis. Diabetes Vasc Dis Res. (2024) 21:1479164124128440. doi: 10.1177/14791641241284409
21. Hu X, Sang K, Chen C, Lian L, Wang K, Zhang Y, et al. Prognostic nutritional index and major cardiovascular events in patients undergoing invasive coronary angiography: A clinical retrospective study. J Pers Med. (2022) 12:1679. doi: 10.3390/jpm12101679
22. Fan H, Huang Y, Zhang H, Feng X, Yuan Z, Zhou J. Association of four nutritional scores with all-cause and cardiovascular mortality in the general population. Front Nutr. (2022) 9:846659. doi: 10.3389/fnut.2022.846659
23. Kurmus Ferik O, Akbuga K, Tolunay H, Aslan T, Eren M, Erkan A, et al. Poor nutritional status is associated with arrhythmic events on 24-hour holter recording. Med Princ Pract. (2022) 31:368–75. doi: 10.1159/000524396
24. Candeloro M, Di Nisio M, Balducci M, Genova S, Valeriani E, Pierdomenico S, et al. Prognostic nutritional index in elderly patients hospitalized for acute heart failure. ESC Heart Fail. (2020) 7:2479–84. doi: 10.1002/ehf2.12812
25. Pezzola E, Tomasoni D, Caneiro Queija B, Raposeiras Roubin S, Freixa X, Arzamendi D, et al. Prevalence and prognostic significance of malnutrition in patients with secondary mitral regurgitation undergoing transcatheter edge-to-edge repair. Catheter Cardiovasc Interv. (2024) 104:390–400. doi: 10.1002/ccd.31079
26. Matsui M, Asai A, Ushiro K, Onishi S, Nishikawa T, Ohama H, et al. Prognostic nutritional index correlates with liver function and prognosis in chronic liver disease patients. Diagnostics (Basel, Switzerland). (2023) 14:49. doi: 10.3390/diagnostics14010049
27. Nalbant A, Demirci T, Kaya T, Aydın A, Altındiş M, Güçlü E. Can prognostic nutritional index and systemic immune-inflammatory index predict disease severity in COVID-19? Int J Clin Pract. (2021) 75:e14544. doi: 10.1111/ijcp.14544
28. Kuwabara M, Hisatome I, Ae R, Kosami K, Aoki Y, Andres-Hernando A, et al. Hyperuricemia, A new cardiovascular risk. Nutr Metab Cardiovasc Dis. (2025) 35:103796. doi: 10.1016/j.numecd.2024.103796
29. Konta T, Ichikawa K, Kawasaki R, Fujimoto S, Iseki K, Moriyama T, et al. Association between serum uric acid levels and mortality: A nationwide community-based cohort study. Sci Rep. (2020) 10:6066. doi: 10.1038/s41598-020-63134-0
Keywords: prognostic nutritional index (PNI), mortality, NHANES, threshold effect, population-based study
Citation: Zhou C, Zhou Y, Wang T, Wang Y, Liang X and Kuang X (2025) Association of prognostic nutritional index with all-cause mortality and cardiovascular mortality: a nationwide population-based cohort study. Front. Nutr. 12:1530452. doi: 10.3389/fnut.2025.1530452
Received: 18 November 2024; Accepted: 12 June 2025;
Published: 14 July 2025.
Edited by:
Akio Shimizu, Mie University, JapanReviewed by:
Luz-Ma.-Adriana Balderas-Peña, Instituto Mexicano del Seguro Social, MexicoMaulidia Ekaputri, Sanofi, France
Xiaohui Xu, First Affiliated Hospital of Xinjiang Medical University, China
Copyright © 2025 Zhou, Zhou, Wang, Wang, Liang and Kuang. This is an open-access article distributed under the terms of the Creative Commons Attribution License (CC BY). The use, distribution or reproduction in other forums is permitted, provided the original author(s) and the copyright owner(s) are credited and that the original publication in this journal is cited, in accordance with accepted academic practice. No use, distribution or reproduction is permitted which does not comply with these terms.
*Correspondence: Xin Kuang, a3g2OTI0QDEyNi5jb20=
†These authors have contributed equally to this work