 Zitian Wang
 Guang Peng
 Yuquan Jiang
 Fengfu Wu
- Department of Orthopedics, Burn and Plastic Surgery, The 925th Hospital, Guiyang, China
Background: Existing evidence linking visceral adiposity index (VAI) to osteoarthritis (OA) remains limited and requires further investigation. This study aimed to evaluate the potential relationship between higher VAI scores and an increased risk of OA.
Methods: A retrospective cross-sectional analysis was conducted using data from 9,464 participants aged 50 and older, sourced from the 2011 to 2018 National Health and Nutrition Examination Survey (NHANES). The VAI was categorized into three tertiles, with the first tertile (T1) representing the lowest VAI and third tertile (T3) the highest. Weighted logistic regression was employed to examine the association between VAI and OA. To explore potential non-linear relationships, smoothed curve fitting and threshold effect analyses were performed. Subgroup analyses were performed to validate these findings.
Results: The average age of the study population was 63.16 ± 9.05 years, and 47.22% were male. After adjusting for confounding factors, a statistically significant positive correlation was observed between VAI and OA risk (OR = 1.03, 95% CI: 1.01–1.06, P < 0.01). Participants in the highest VAI tertile exhibited a 35% greater likelihood of developing OA compared to those in the lowest tertile (OR = 1.35, 95% CI: 1.06–1.70, P = 0.015). Furthermore, multivariate restricted cubic spline (RCS) regression analysis revealed a non-linear relationship (non-linear P < 0.05) with a threshold effect at a VAI value of 3.9. Subgroup analyses showed no significant interaction effects (all P-values for interaction > 0.05).
Conclusion: This study highlights a significant association between elevated VAI and an increased risk of developing OA in individuals aged 50 and older. These results emphasize the potential of the VAI as a risk factor for OA and warrant further research to explore its role in prevention and management strategies in older populations.
1 Introduction
Osteoarthritis (OA) is a widespread chronic joint condition that primarily affects middle-and older adults worldwide (1, 2). Approximately 250 million people worldwide are affected by OA, with 18% of women and 9.6% of men over 60 years of age experiencing symptomatic OA (3). Data from a recent National Health Interview Survey in the United States suggest that approximately 14 million people suffer from symptomatic knee OA, of which approximately 3 million are from minority populations (4), posing a considerable challenge to public health (5). OA is characterized by several pathological changes, including gradual cartilage degeneration, synovial inflammation, osteophyte formation, and alterations in subchondral bone structure (6, 7) Moreover, OA also involves tissue changes in the menisci, tendons, and ligaments, as well as infrapatellar fat pad, which contribute to local inflammation associated with increased pain, functional impairment, and inflammatory markers release (8). While the precise origins of OA remain unclear, it is understood that several factors are linked to its onset and progression. These factors include age, female sex, genetic predisposition, mechanical stress, metabolic imbalances, prior joint injury (9). Furthermore, growing evidence suggests that obesity plays a significant role in the pathogenesis of OA. Specifically, obesity triggers a low-grade systemic inflammatory response, characterized by the production and release of various adipocytokines, which may further contribute to the development of OA (10). Consequently, early detection and management of OA are crucial to reduce its prevalence and improve patient outcomes.
Visceral Adiposity Index (VAI) is a comprehensive metric that combines body mass index (BMI), waist circumference (WC), triglyceride (TG), and HDL cholesterol (HDL-C) to assess visceral fat (11). Compared to traditional measures such as BMI, waist circumference, and waist-to-height ratio, the VAI has demonstrated superior ability in evaluating visceral fat distribution and dysfunction in adults (12, 13). Clinical studies have shown that the VAI is effective in identifying individuals at increased risk for metabolic disorders associated with visceral obesity, such as insulin resistance, dyslipidemia, and cardiovascular risk factors (14–16). Visceral fat accumulation increases with age, particularly in older adults (17). Thus, VAI is a promising tool for predicting the development of OA.
However, the relationship between VAI and OA in middle-aged and older adults remains unclear. To address this gap, we conducted an investigation into the association between VAI and OA among U.S. adults aged 50 and older. Specifically, we aimed to (1) assess the correlation between the VAI and OA, (2) examine non-linear associations, and (3) explore subgroup differences.
2 Materials and methods
2.1 Study population
The NHANES, which is overseen by the Centers for Disease Control and Prevention, is a large-scale study designed to evaluate the health and nutritional status of the U.S. population. The assessment was conducted using a combination of interviews, physical examinations, and laboratory tests. The details of the study methodology, including data collection and sample weighting, can be found at http://www.cdc.gov/nchs/nhanes.html. The NHANES protocol has been approved by the Research Ethics Review Committee of the National Center for Health Statistics, and written informed consent was obtained from all participants. Our analysis, based on secondary NHANES data, was exempt from institutional review (18).
In this investigation, 39,156 individuals participated in four NHANES cycles from 2011 to 2018. Individuals under the age of 50 years (n = 27,778) and those with missing VAI and OA data (total, n = 1, 914; BMI = 719; WC = 655; TG = 536; HDL-C = 4; OA = 0) were excluded. In total, 9,464 participants aged 50 and older were included in the final analysis (Figure 1).
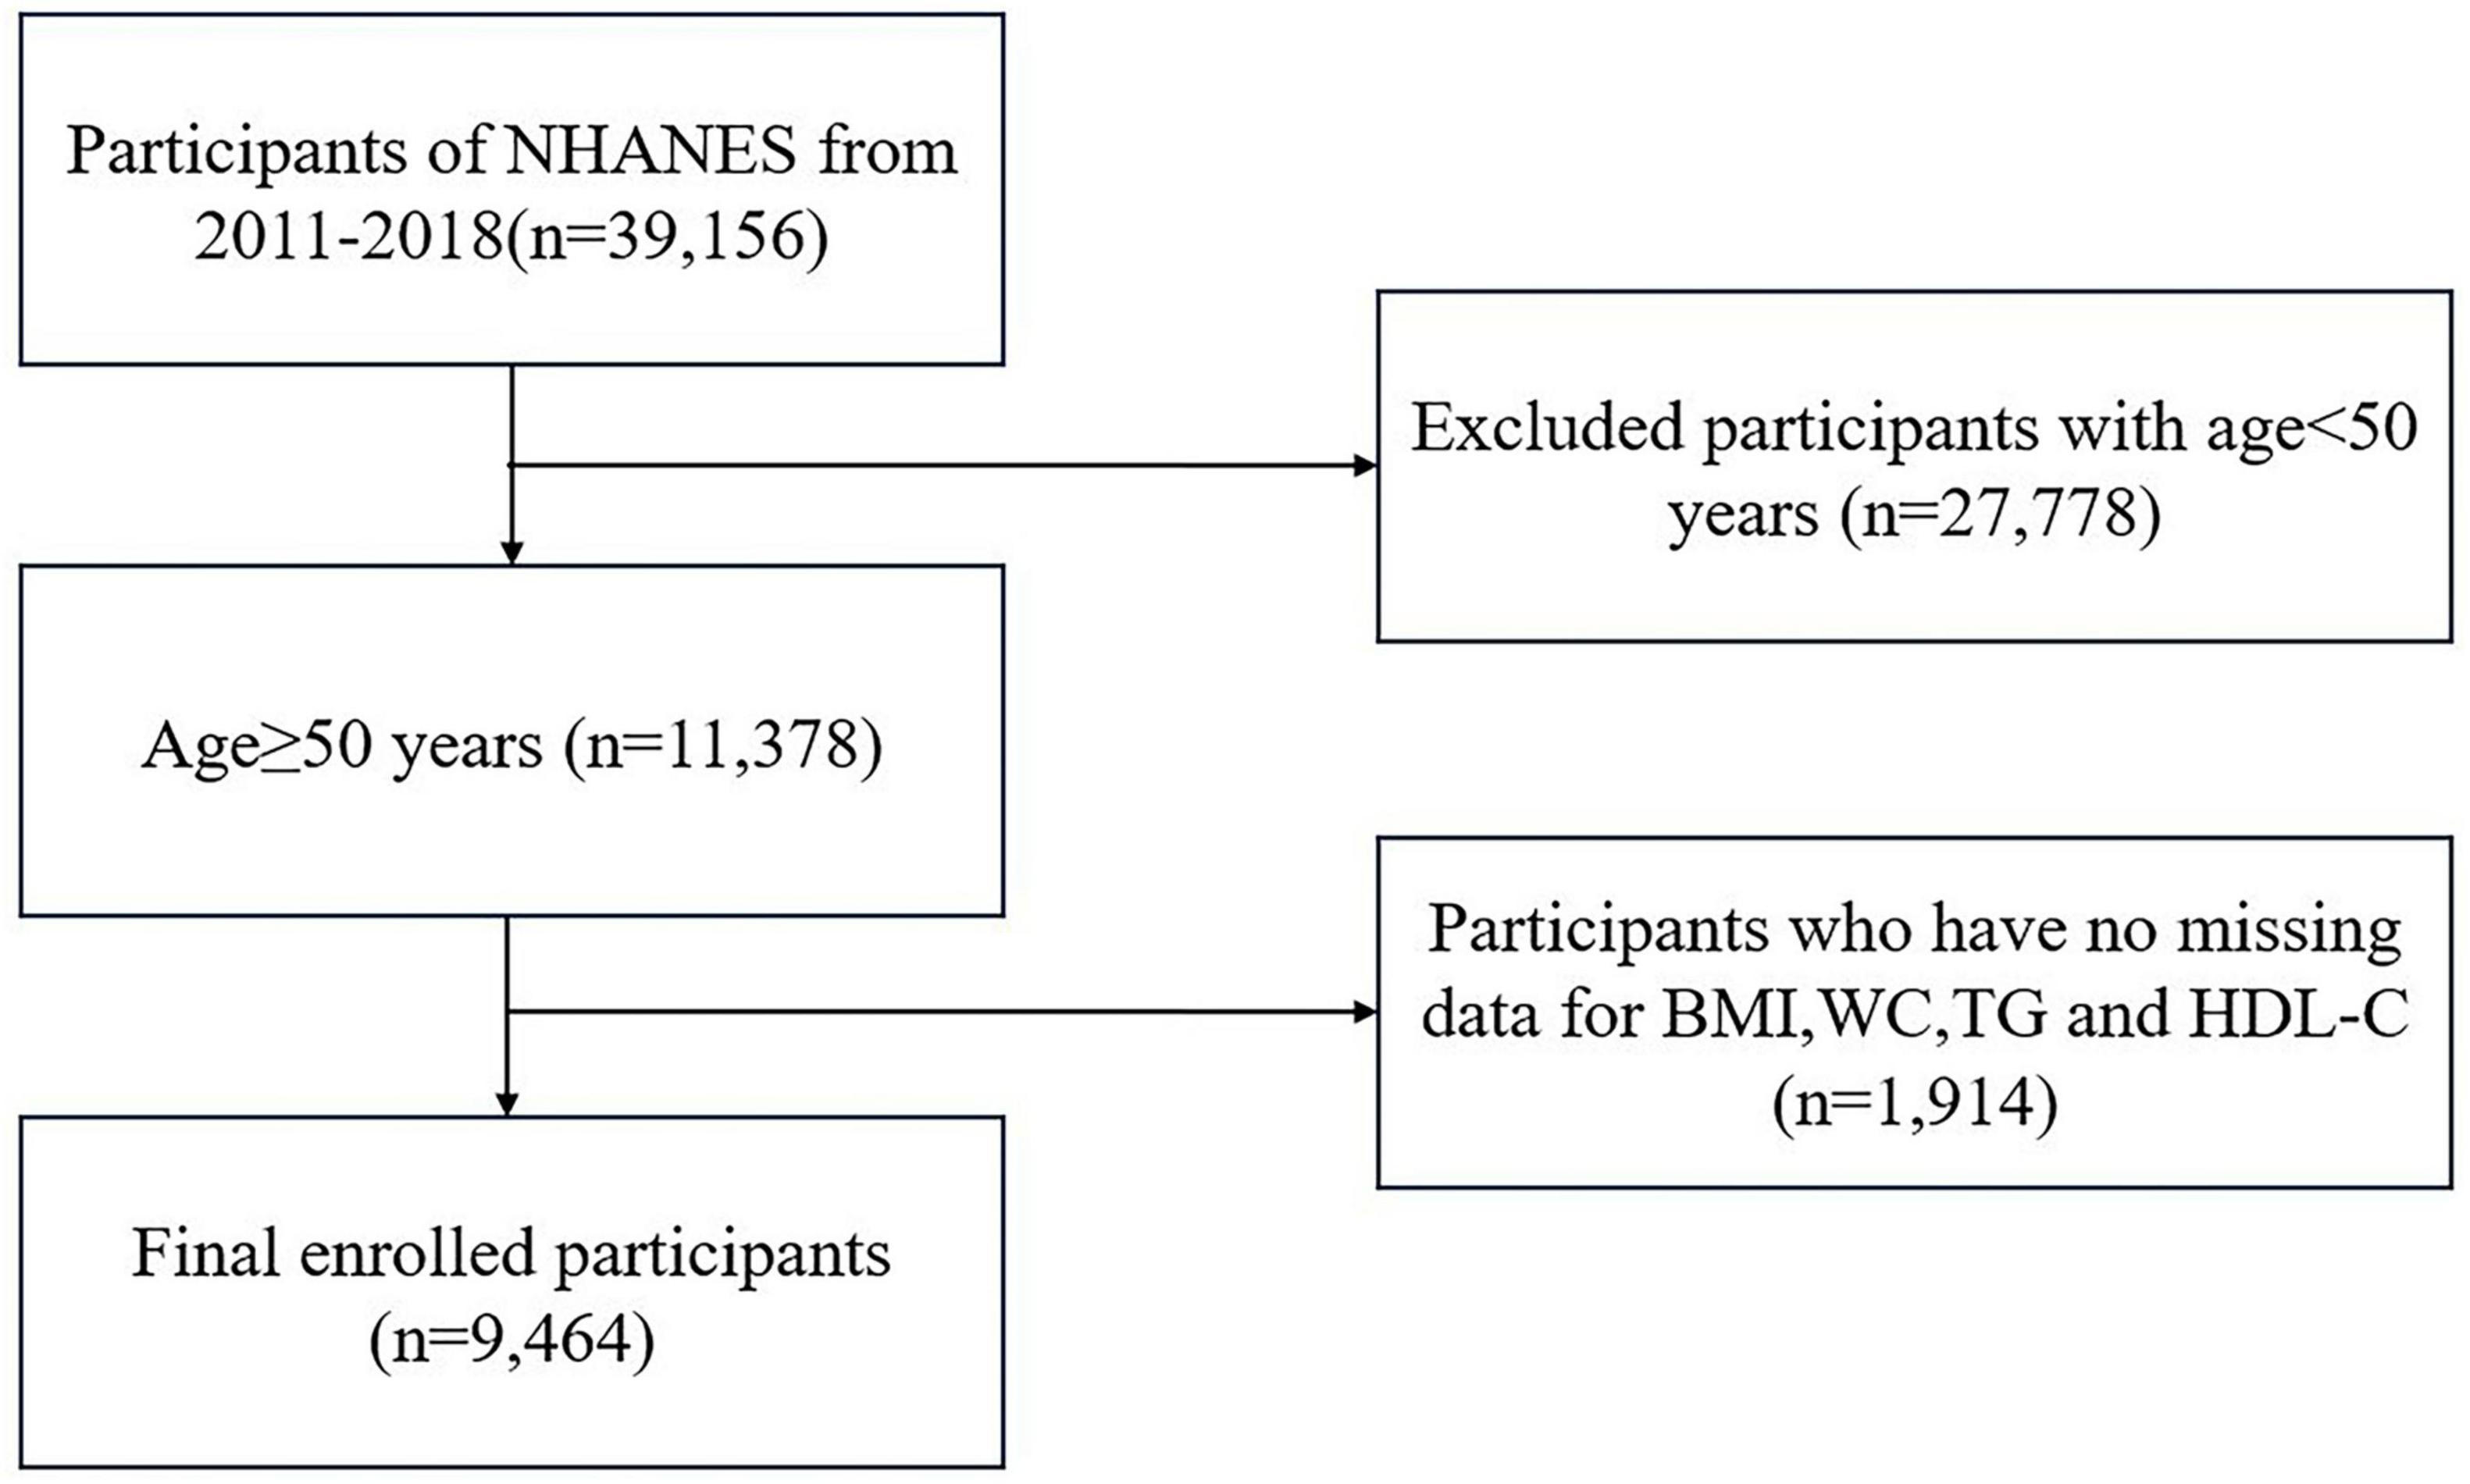
Figure 1. Flowchart for inclusion and exclusion criteria.
2.2 Outcome and exposure factor
The primary outcome of this study was OA diagnosis. To assess OA, individuals aged 20 years and older were asked two specific questions about their arthritis status (19). The first question was, “Has a doctor or other healthcare professional ever told you that you have arthritis?” Those who answered “yes” were then asked, “What type of arthritis was it?” Participants identifying their condition as “Osteoarthritis or degenerative arthritis” were categorized as having OA. The self-reported “definite” OA aligns with clinical diagnoses in up to 81% of cases, indicating a high level of accuracy in self-reported diagnoses (20).
In this analysis, the VAI served as the main exposure variable. VAI was calculated using sex-specific formulas according to previously reported equations (21): for men, the equation was waist circumference/[39.68 + (1.88 × BMI)] × (triglycerides/1.03) × (1.31/HDL-C); for women, the formula was waist circumference/[36.58 + (1.89 × BMI)] × (triglycerides/0.81) × (1.52/HDL-C), where both TG and HDL levels are expressed in mmol/L (22). The participants were divided into tertiles based on their VAI values for further statistical analyses.
2.3 Selection of covariates
During the home interviews, the NHANES staff gathered data through questionnaires that covered various participant characteristics, including age, sex, race/ethnicity, education, marital status, family income, smoking habits, alcohol consumption, sleep disorders, and the presence of diabetes. Race/ethnicity was categorized as non-Hispanic White, non-Hispanic Black, Mexican American, and other ethnic groups. Education levels were grouped as less than high school, high school or equivalent, and greater than high school. Family income was classified based on the poverty income ratio (PIR) into low (< 1.30), middle (1.30y income was clas (≥ 3.50) income brackets. Alcohol intake was categorized by whether participants consumed ≥ 4 drinks per day, whereas smoking status was categorized as former, current, or never.
As part of the laboratory examinations during the 2011–2018 NHANES cycles, blood samples were collected following stringent protocols for analysis. At baseline, the following biomarkers were measured: alanine aminotransferase (ALT), aspartate aminotransferase (AST), alkaline phosphatase (ALP), blood urea nitrogen (BUN), total calcium, total cholesterol (TC), serum glucose, and serum uric acid (SUA).
2.4 Statistical analyses
To analyze the NHANES dataset, incorporation of sampling weights and design variables is essential because failure to do so may result in biased estimates and inflated significance levels. Therefore, our analysis followed NHANES guidelines by employing a complex sampling design and applying the appropriate sampling weights. The data used in this study were obtained from home interviews and a Mobile Examination Center (MEC) during the NHANES survey. In accordance with the NHANES guidelines on survey sample weights, the MEC weights were used in this analysis, with 2011–2018 weights calculated as 1/4 of the 2-year MEC weight (23).
Continuous variables with a normal distribution were expressed as the mean ± standard deviation (SD), whereas categorical variables were presented as frequencies and percentages. Categorical variables were analyzed using the chi-square test and normally distributed continuous variables were analyzed using one-way ANOVA of variance to compare the differences between the different VAI groups.
To assess the effect of VAI on OA, binary logistic regression models were applied to calculate odds ratios (OR) and 95% confidence intervals (CI), while adjusting for relevant covariates. The VAI was treated as both a continuous and a categorical variable with three levels. Covariate selection has been described in the existing literature (24). Three regression models were used: Model 1 was unadjusted; Model 2 was adjusted for age, sex, race, education, marital status, PIR, smoking status, alcohol intake, moderate recreational activity, sleep disturbances, and diabetes; and Model 3 was additionally adjusted for ALT, AST, ALP, BUN, total calcium, TC, glucose, and SUA levels.
We employed a restricted cubic spline model to explore the potential non-linear dose-response relationships between VAI and OA, assessing non-linearity by including a quadratic term in the regression. Based on the results of the smoothing curve, a two-piecewise linear regression model was used to investigate the threshold effects after adjusting for confounding variables. Predefined subgroup analyses were performed based on the clinical interest and previous scientific literature.
We employed statistical imputation methods to address missing data for covariates. For continuous variables, missing values were imputed using either the mean or the median, enabling us to retain incomplete data in our analysis. Additionally, multiple imputation (MI) with five replications and the chained equations method, implemented through the R “mice” package, was applied as part of sensitivity analyses to further account for missing data.
All statistical analyses were conducted using R Statistical Software (Version 4.2.2; The R Foundation)1 and the Free Statistics Analysis Platform (Version 2.0; Beijing, China).2 The free statistical analysis platform provides an intuitive interface for common statistical analyses and data visualization using R as the core statistical engine and Python as the graphical user interface. This platform facilitates reproducible analyses and interactive data exploration. Differences were considered statistically significant at a two-sided p-value < 0.05.
Results
A total of 9,464 participants were enrolled in this study following a thorough screening process based on predefined inclusion and exclusion criteria. Participants were divided into tertiles based on their VAI scores. The average age of the cohort was 63.16 ± 9.05 years, with 47.22% identifying as male. As the VAI values increased, a concurrent increase was observed in the prevalence of diabetes; incidence of sleep disturbances; and levels of ALT, ALP, TC, blood glucose, and SUA. In contrast, the proportion of individuals with an education beyond high school declined with increasing VAI. Furthermore, participants in the highest VAI tertile (T3) were more likely to report smoking and alcohol misuse and had lower rates of engagement in moderate recreational activities than those in the lower tertiles (T1 and T2). A detailed summary of the baseline characteristics of the VAI tertiles is presented in Table 1.
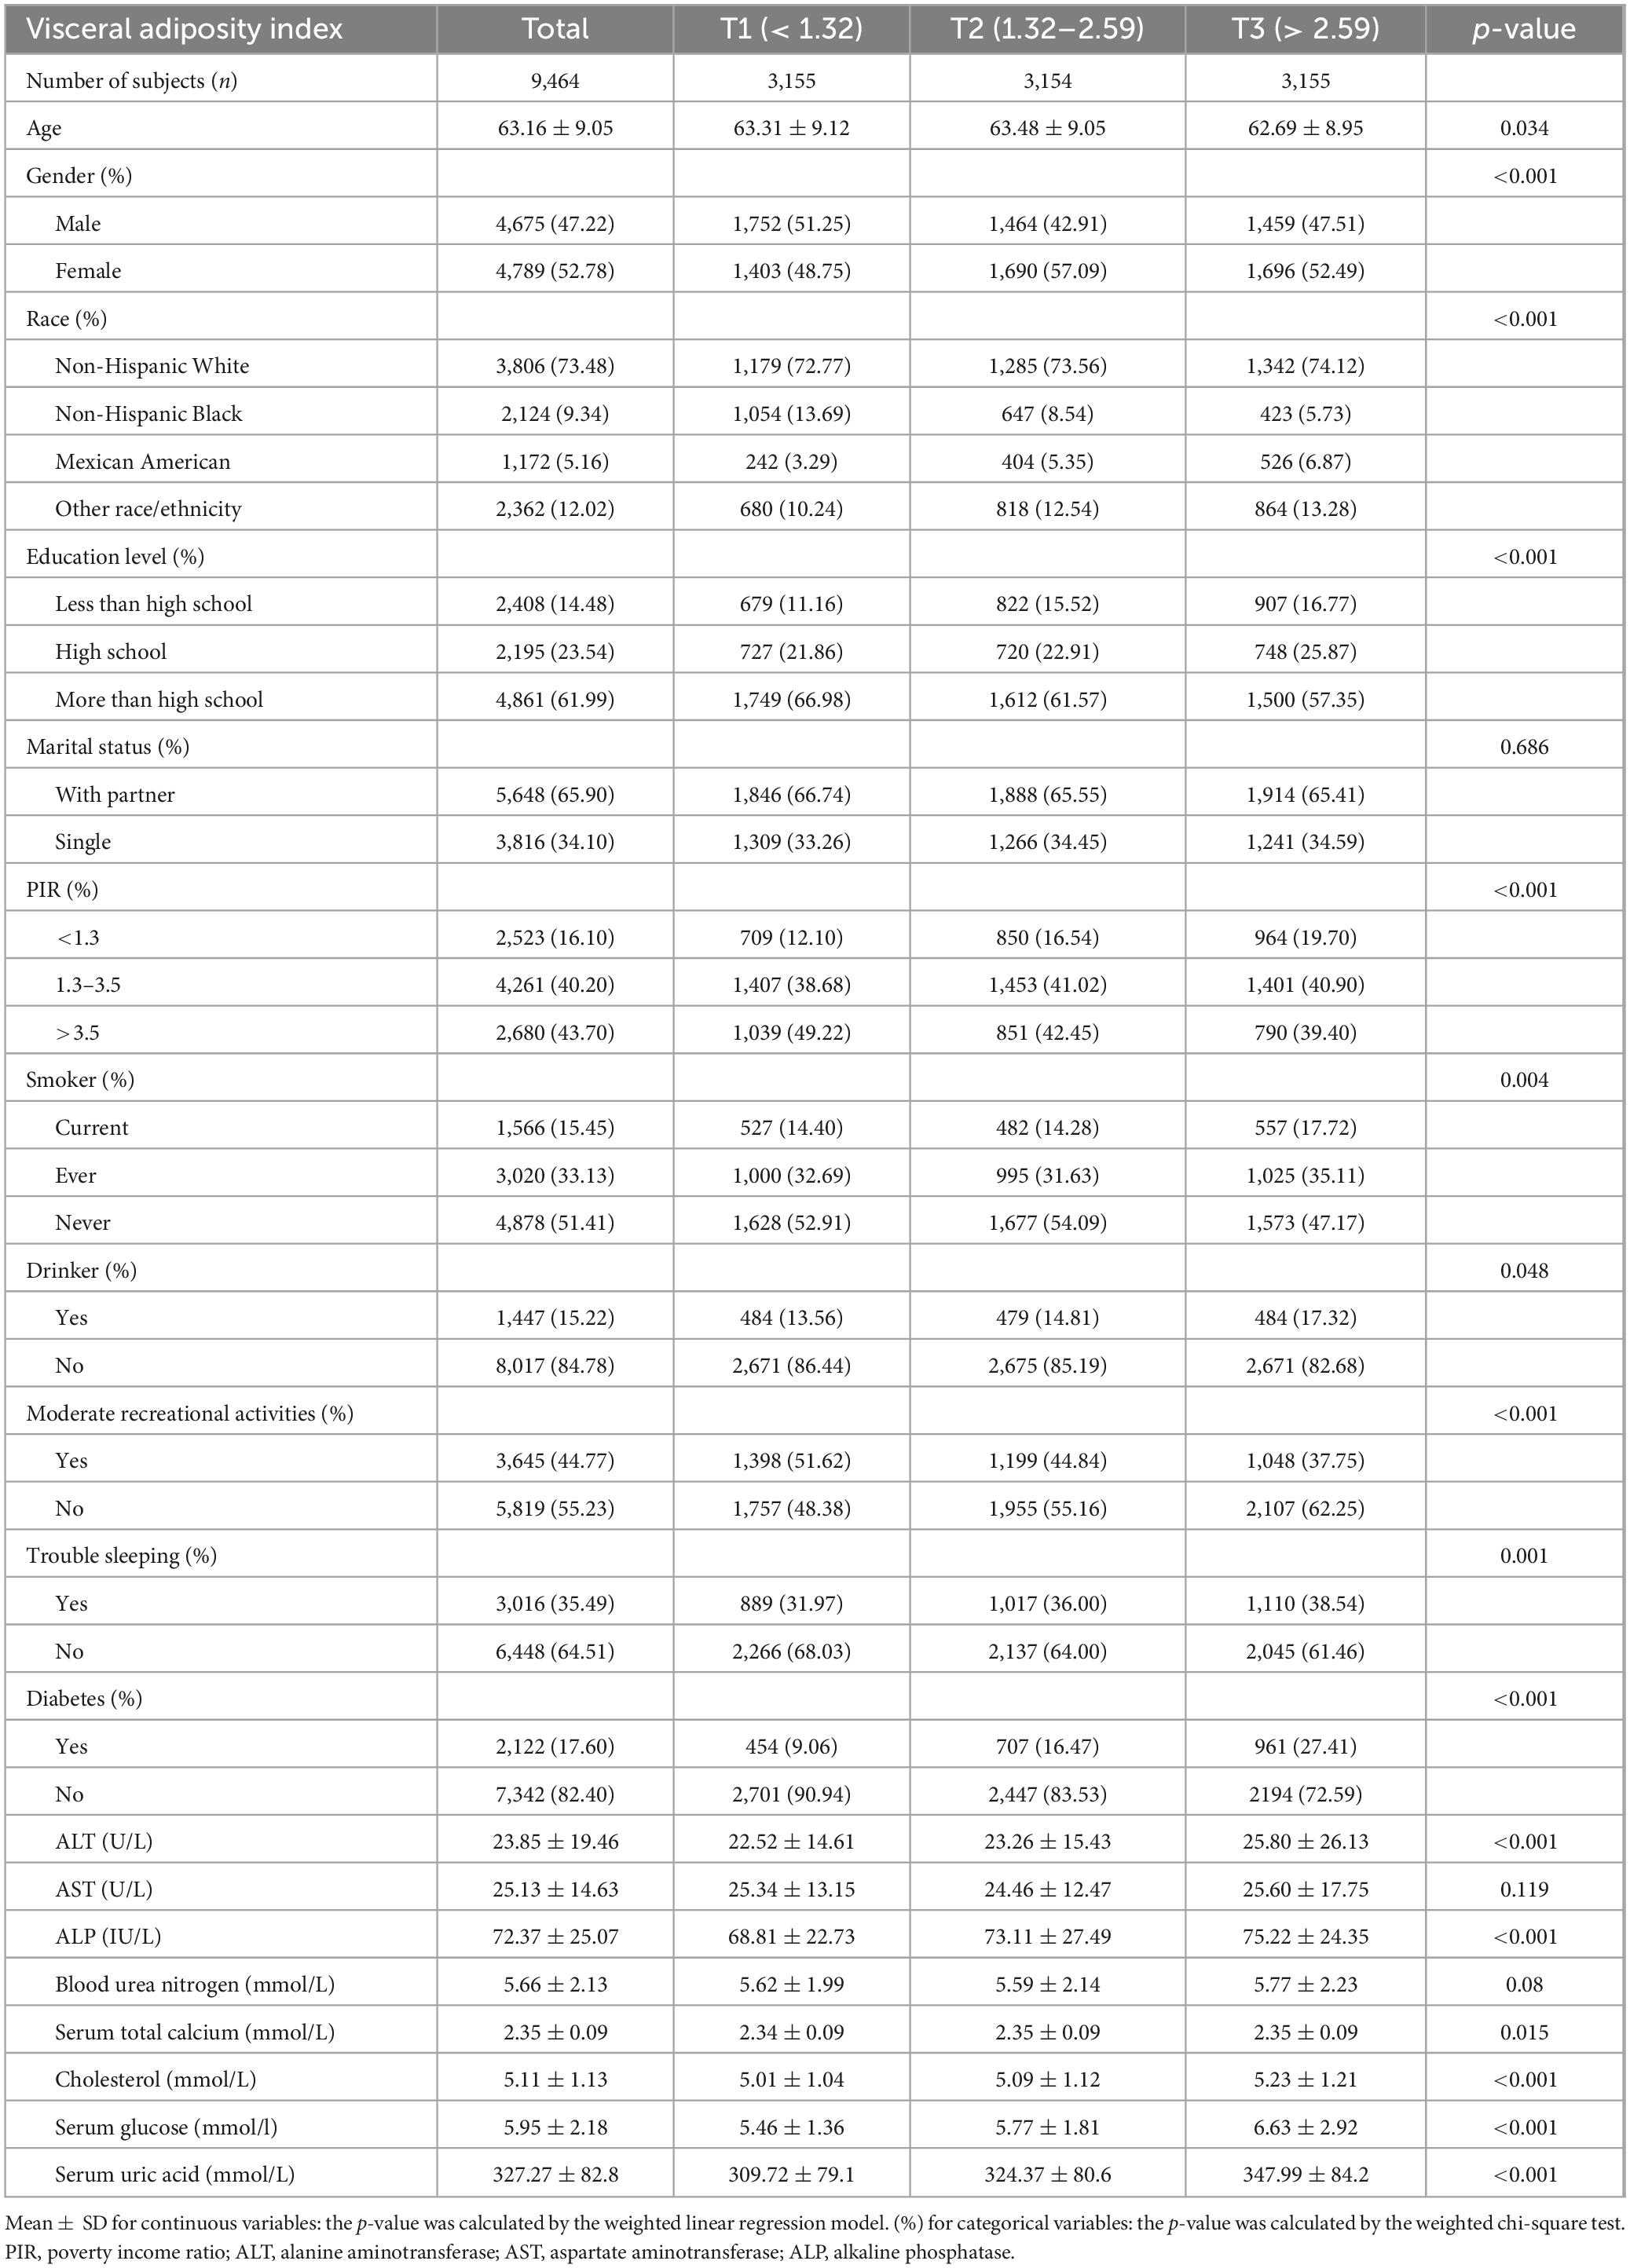
Table 1. Weighted characteristics of the study population based on visceral adiposity index tertiles.
In multivariable logistic regression analysis (Model 3 in Table 2), VAI, treated as a continuous variable, was positively associated with the likelihood of developing OA (OR = 1.03, 95% CI: 1.01–1.06, P = 0.007). Additionally, univariate logistic regression analysis revealed a significant positive association between VAI (categorized into tertiles) and OA risk. Specifically, comparing the highest tertile (T3) to the lowest (T1) yielded an odds ratio of 1.34 (95% CI: 1.09–1.64, P = 0.006). This relationship remained statistically significant after adjusting for confounders, with the adjusted odds ratio being 1.35 (95% CI: 1.06–1.70, P = 0.015), as shown in Model 3 of Table 2.
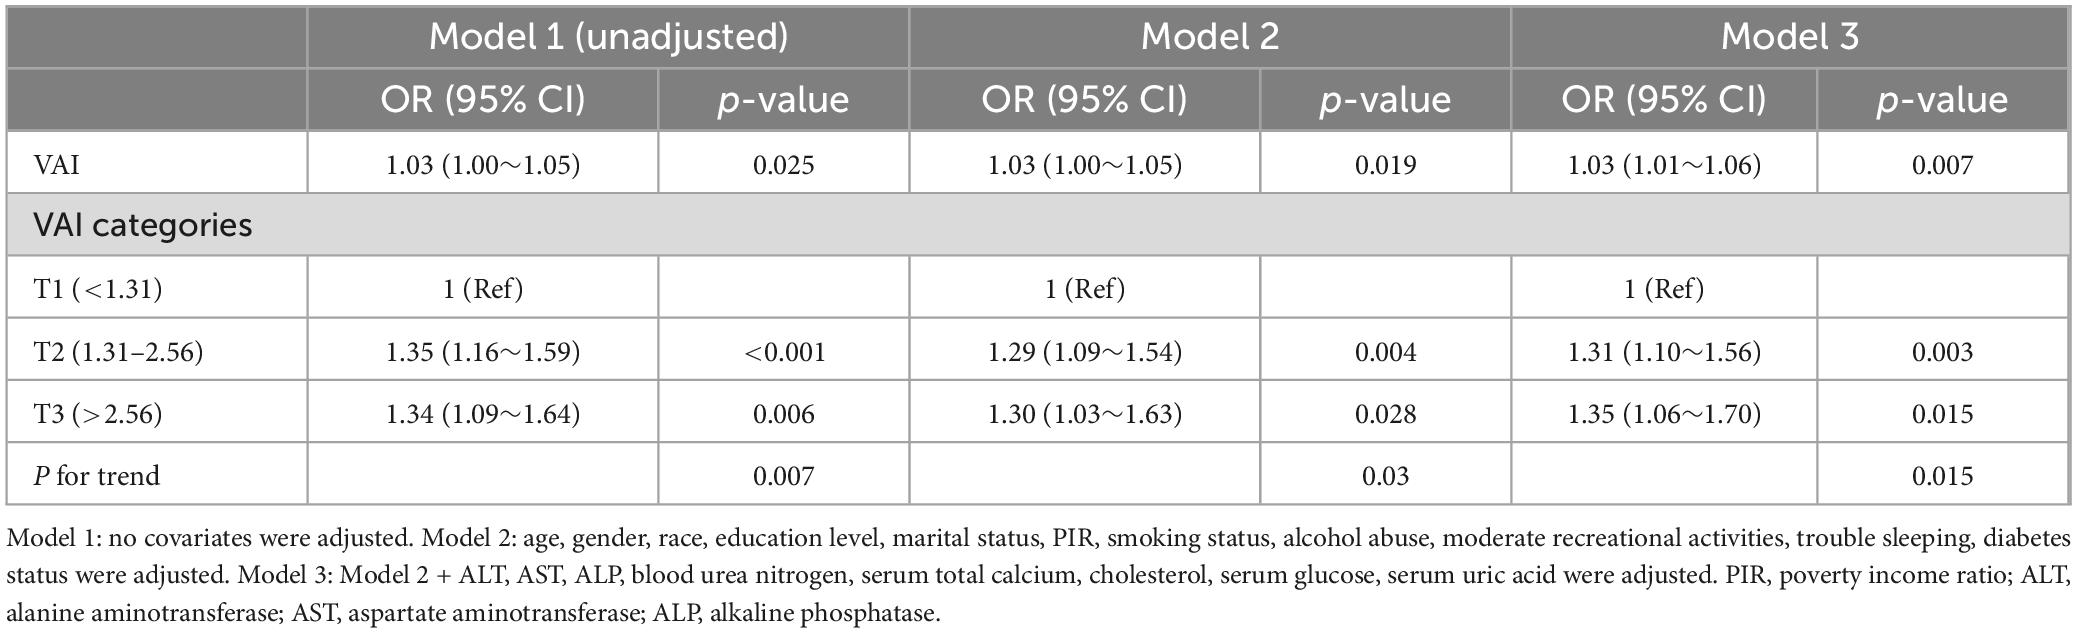
Table 2. Association between visceral adiposity index and prevalence of osteoarthritis.
Multivariate spline analysis revealed a non-linear relationship between VAI and OA (P for non-linearity = 0.022; Figure 2). Specifically, a significant positive association was observed up to a VAI of 3.9, beyond which the dose-response curve plateaued, indicating a lack of further significant correlation between VAI and OA (P = 0.162) (Table 3).
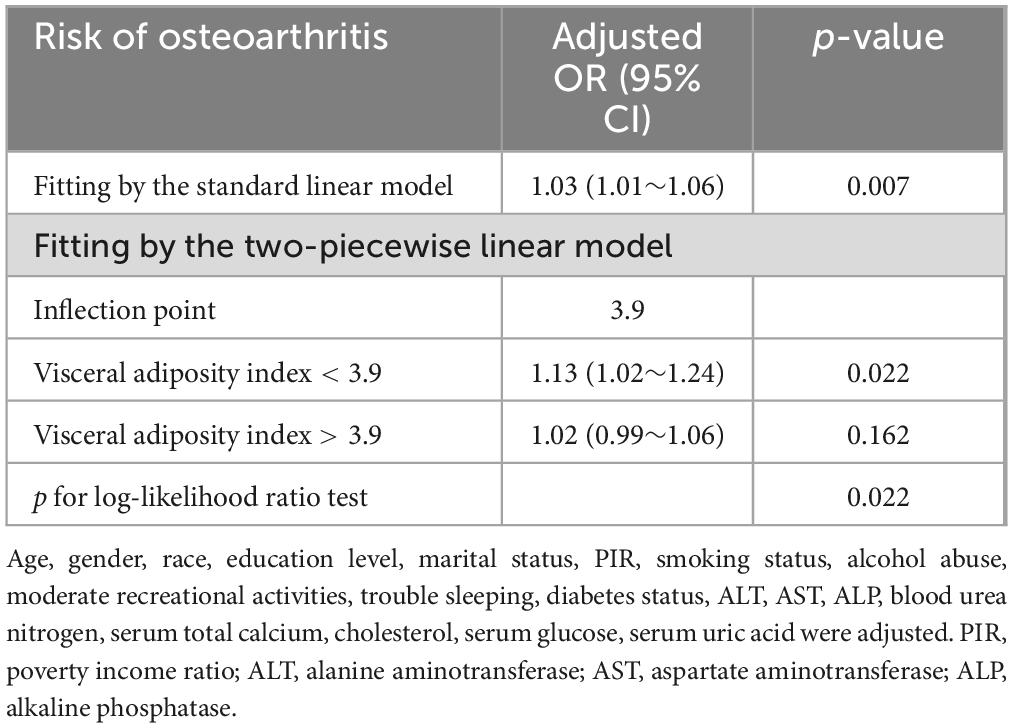
Table 3. Threshold effect analysis of visceral adiposity index and prevalence of osteoarthritis.
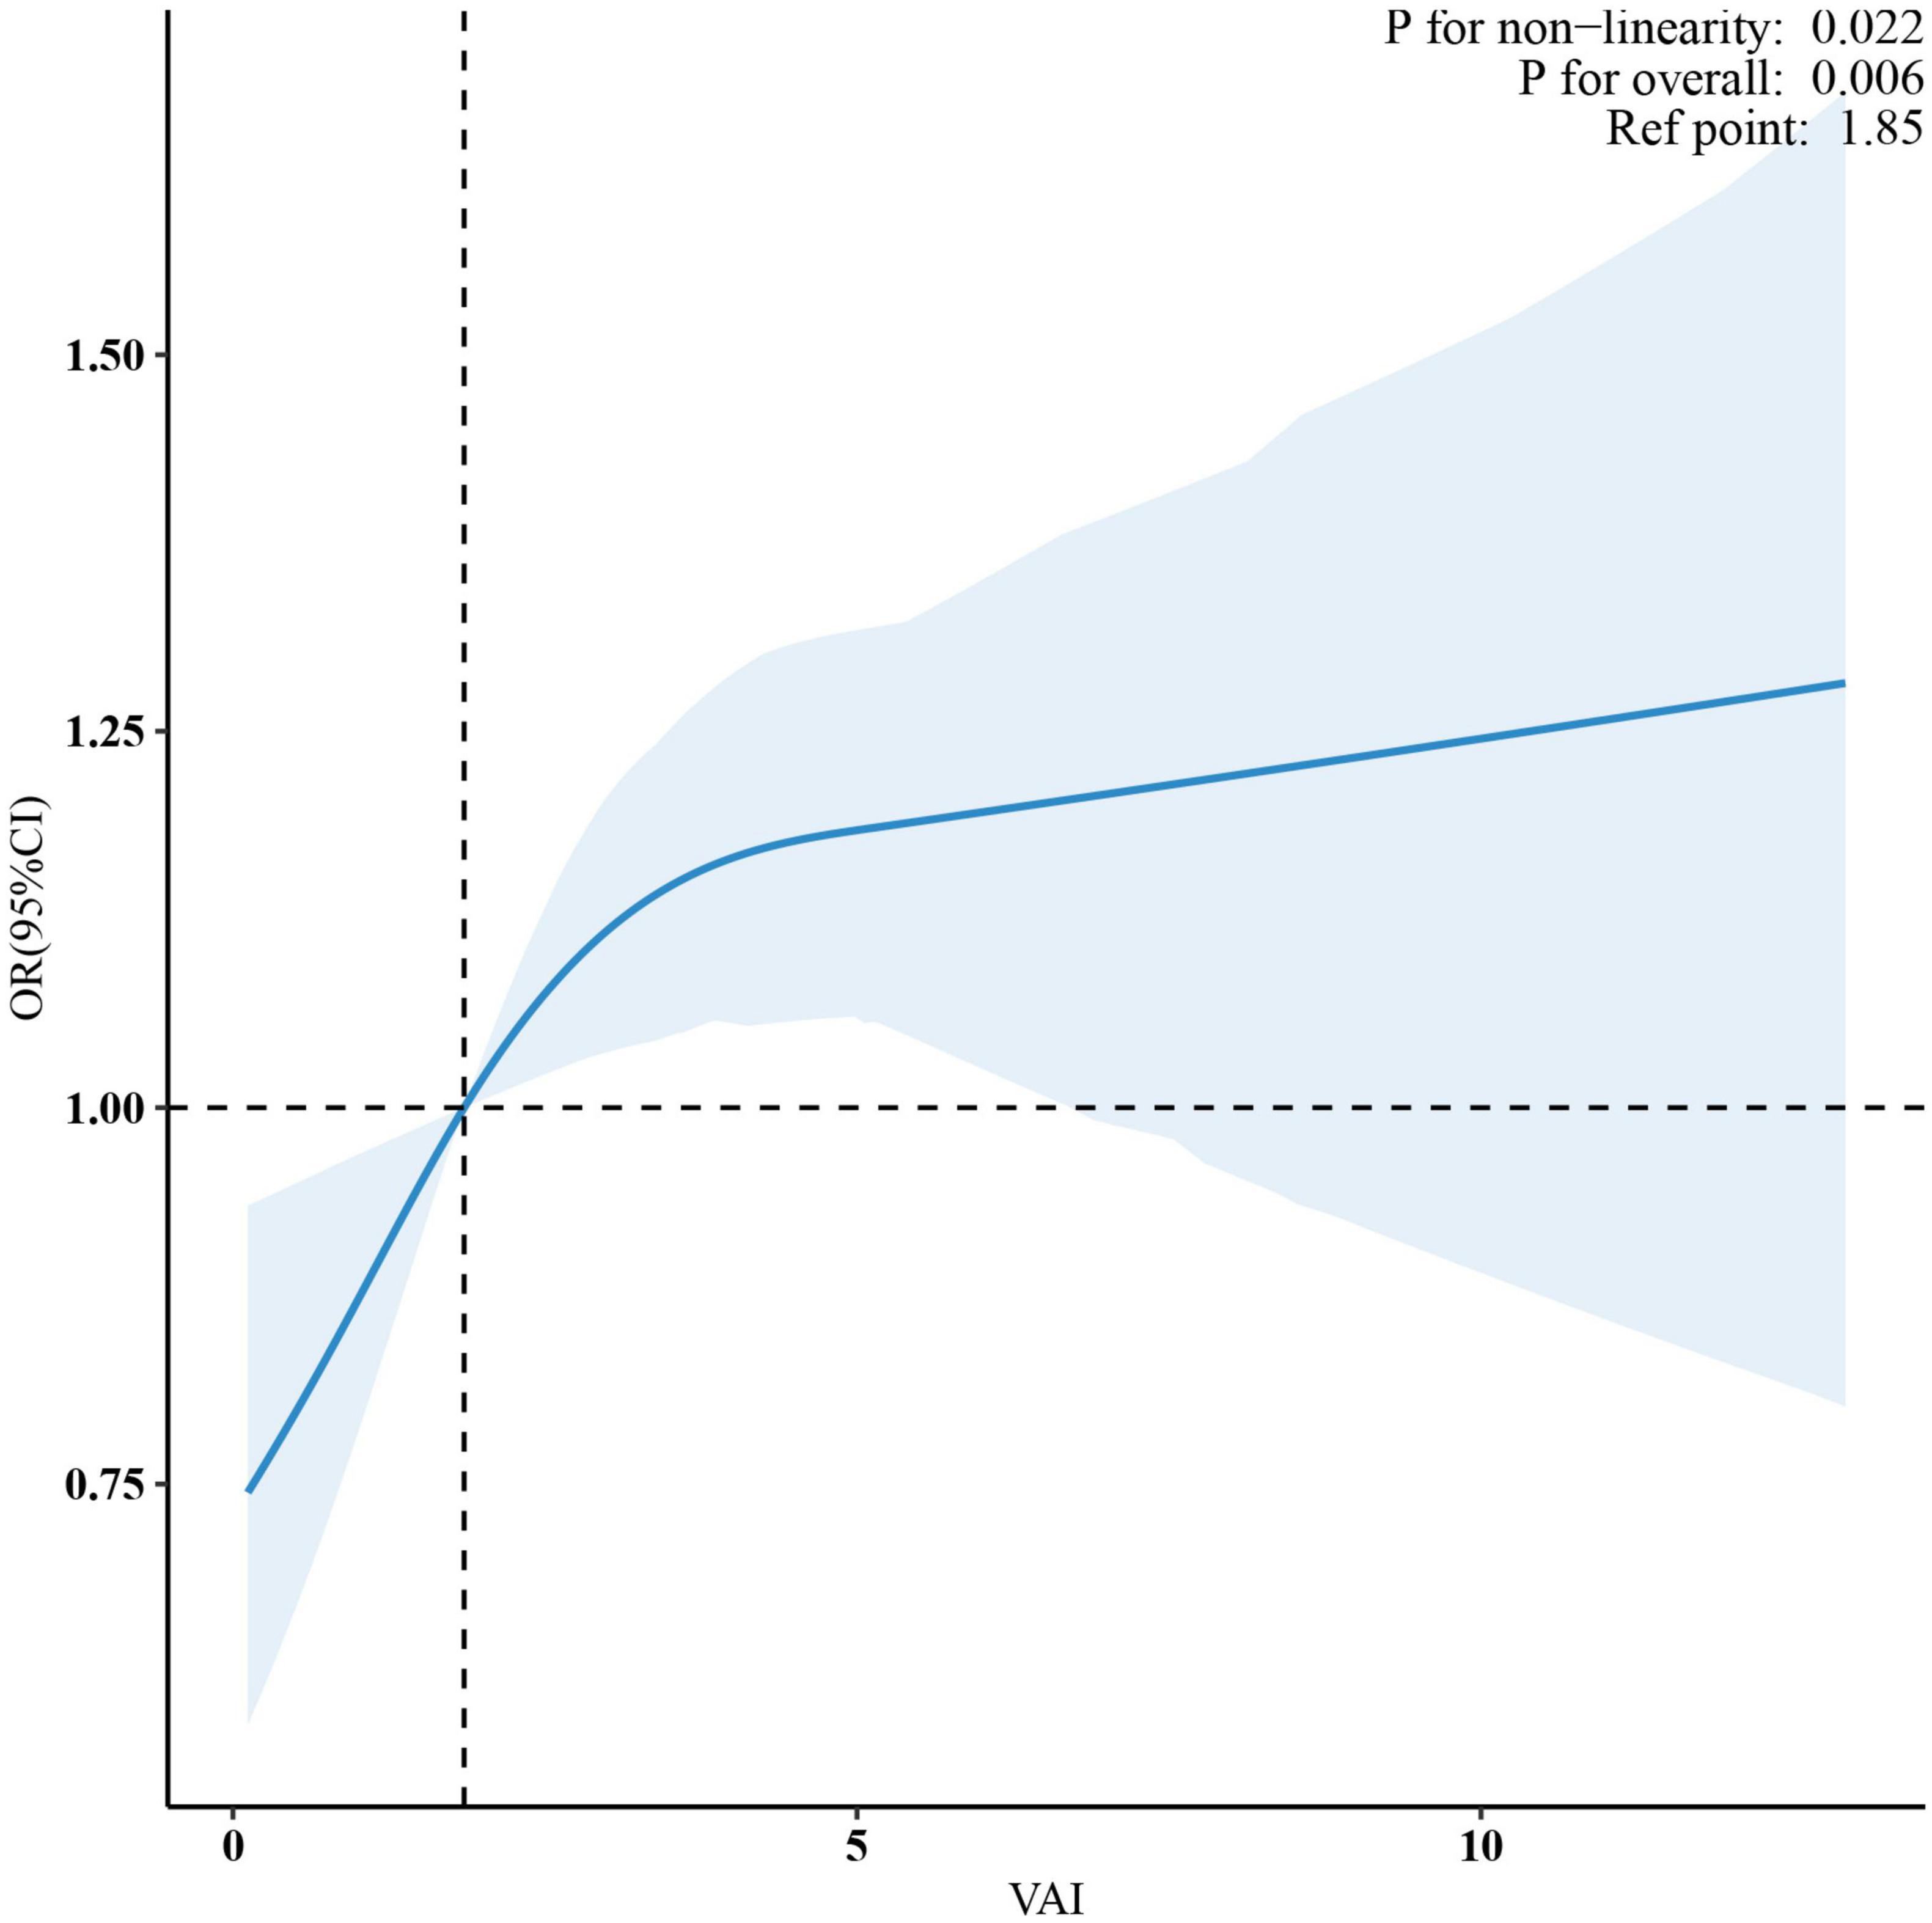
Figure 2. A non-linear pattern of the association between VAI and osteoarthritis (p-value for log-likelihood ratio test = 0.022) in a generalized additive model. The vertical dashed line marks the median point for VAI = 1.85, and non-linear relationships were detected with a breakpoint of 3.9. The model was adjusted for age, gender, race, education level, marital status, PIR, smoking status, alcohol abuse, moderate recreational activities, trouble sleeping, diabetes status, ALT, AST, ALP, blood urea nitrogen, serum total calcium, cholesterol, serum glucose and serum uric acid. VAI, visceral adiposity index; PIR, poverty income ratio; ALT, alanine aminotransferase; AST, aspartate aminotransferase; ALP, alkaline phosphatase.
To examine potential effect modifiers on the relationship between VAI and OA, we conducted stratified analyses based on age, sex, race, smoking status, alcohol consumption, and diabetes status. However, no significant interactions were found in any of these subgroups, as all interaction P-values exceeded 0.05 in Figure 3.
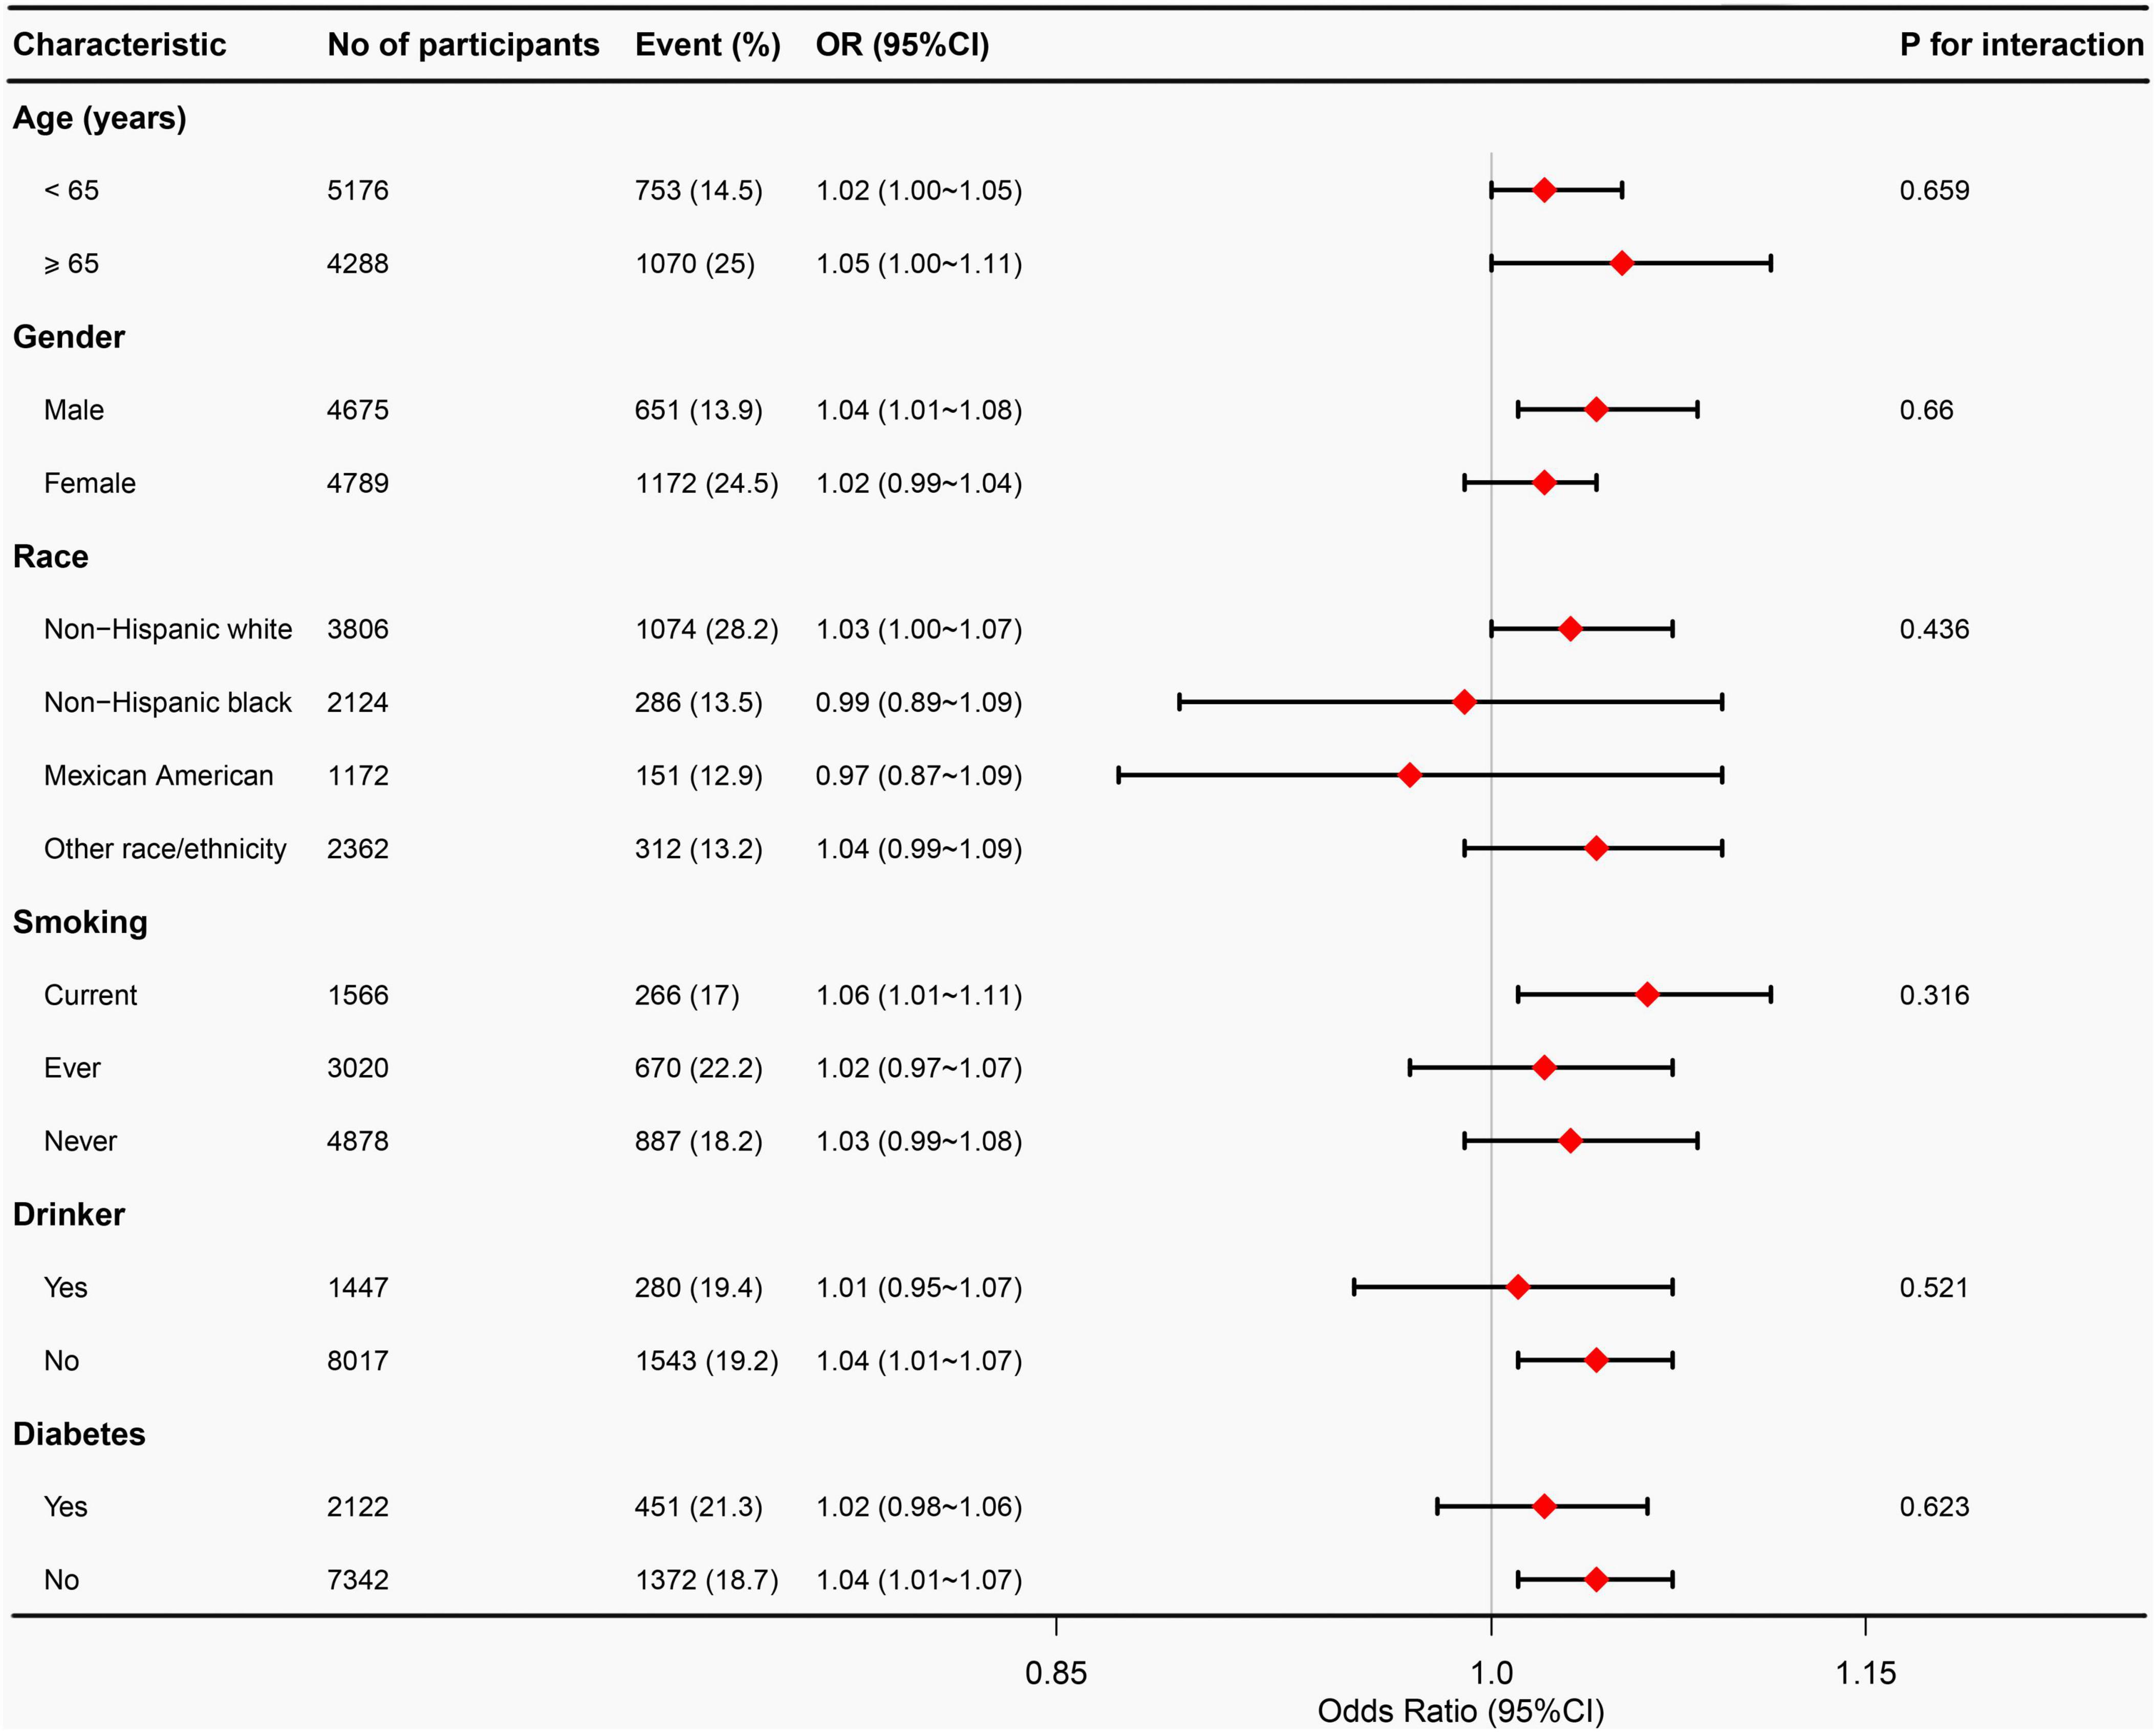
Figure 3. Subgroup analyses between VAI and osteoarthritis. Adjust for age, gender, race, education level, marital status, PIR, smoking status, alcohol abuse, moderate recreational activities, trouble sleeping, diabetes status, ALT, AST, ALP, blood urea nitrogen, serum total calcium, cholesterol, serum glucose, and serum uric acid. VAI, visceral adiposity index; PIR, poverty income ratio; ALT, alanine aminotransferase; AST, aspartate aminotransferase; ALP, alkaline phosphatase.
Post-hoc sensitivity analyses using multiple imputations to address missing values for PIR (10.31%), total calcium (0.12%), AST (0.10%), ALT (0.10%), and ALP (0.10%) produced results that were consistent with those from the fully adjusted model (Table 4).
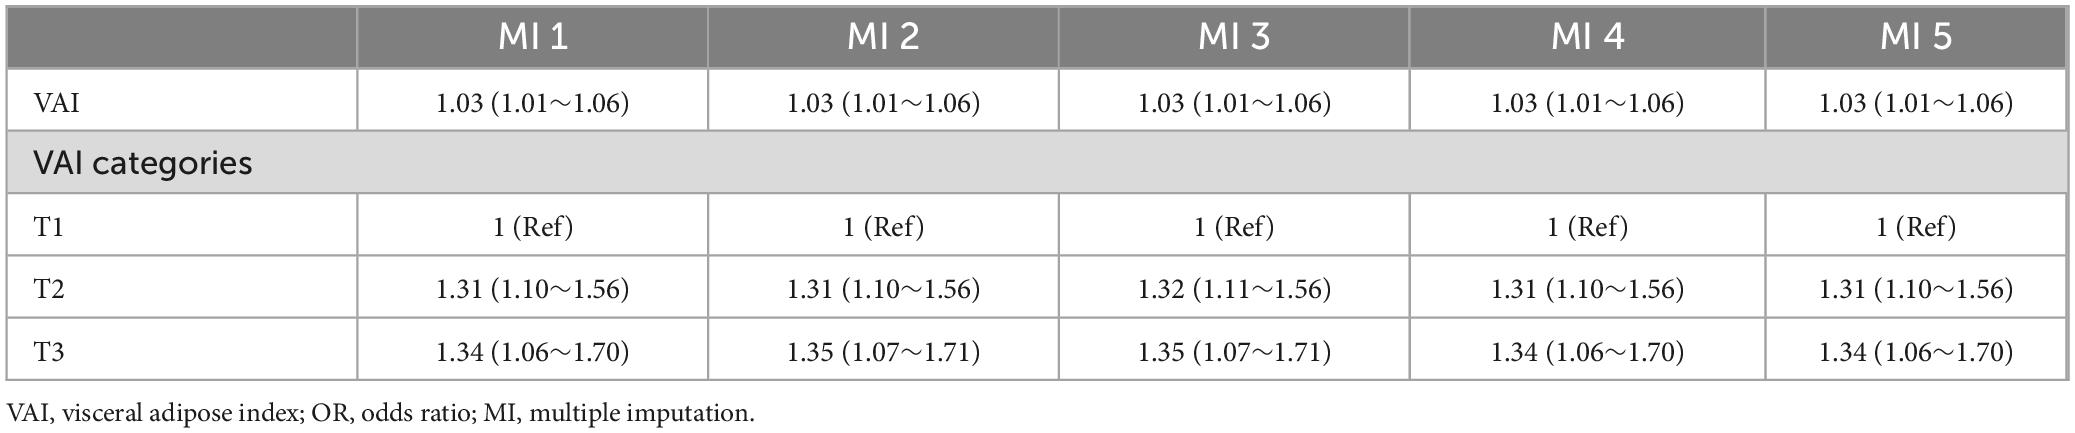
Table 4. ORs of five multiple imputation data.
Discussion
In this comprehensive cross-sectional analysis of U.S. adults aged 50 years and older, utilizing the NHANES 2011–2018 dataset, we identified a significant independent association between VAI and the risk of developing OA. Our findings revealed a dose-response relationship, indicating a non-linear connection between the VAI and OA risk (P for non-linearity < 0.05), with the association diminishing once the VAI values surpassed 3.9. Subgroup analyses further supported this association, reinforcing the relationship between higher VAI and increased OA risk across various demographic groups. This study is novel in that it uses the VAI as a predictor of OA, offering a new hypothesis for early OA screening and potential therapeutic interventions.
Although research on the relationship between the VAI and OA remains limited, BMI is frequently used to assess the risks of obesity and OA (25). A 22-year longitudinal study by Toivanen et al. demonstrated a significant association between a higher BMI and an increased risk of knee OA. Individuals with a BMI between 25.0 and 29.9 kg/m2 had a 70% higher risk of knee OA, and those with a BMI ≥ 30.0 kg/m2 had a 600% higher risk compared to those with a BMI < 25 kg/m2 (26). Similarly, Grotle et al. observed in a 10-year cohort study of 1,675 Norwegian adults that obese individuals (BMI ≥ 30) were 2.77 times more likely to develop knee OA than those with normal weight (27). Jiang et al. performed a systematic review and meta-analysis of 21 studies and concluded that a higher BMI was significantly associated with knee OA risk, with a 5-unit increase in BMI linked to a 35% greater risk (28). However, considerable heterogeneity was observed among the included studies.
As research has evolved, many scholars have questioned the adequacy of BMI for assessing OA risk, as BMI measures only total weight relative to height, without distinguishing between fat mass and lean body mass. It also does not account for the fat distribution, particularly abdominal fat (29). Alternative metrics should be considered to assess abdominal obesity more accurately. The VAI, which is derived from waist circumference, weight, height, and blood triglyceride and HDL cholesterol levels, offers significant advantages over BMI by reflecting the visceral fat content and its potential impact on bone metabolism-related diseases (30). Previous studies have linked VAI to several health conditions including diabetes, hyperuricemia, metabolic syndrome, hypertension, atherosclerosis, and heart failure (31, 32). While the relationship between VAI and OA is not well established, our study identified a significant association between elevated VAI and an increased risk of OA.
Furthermore, our study found a non-linear relationship and a threshold effect between VAI and OA, which aligns with the findings of other observational studies. For instance, Huang et al. identified a non-linear association between lipid accumulation products and OA risk, with a notable threshold effect of 120.00 cm × mmol/L (33). Similarly, a recent study analyzing the triglyceride-glucose index found significant associations and threshold effects in arthritis (34). In contrast, Wang et al. reported a linear positive relationship between the weight-adjusted waist index (WWI) and OA prevalence, but a non-linear relationship between WWI and rheumatoid arthritis (RA) prevalence (24). These contrasting findings highlight the need for further studies to confirm our results and to explore the underlying mechanisms that may explain these relationships.
The associations observed between the VAI and the risk of OA were notable, albeit modest, and remained consistent across the various subtypes of the condition. Additionally, these associations were stable across different demographic categories, including age, race, smoking status, and presence of diabetes. Although the exact mechanisms linking VAI to OA are not fully understood, several plausible explanations offer insights into this relationship.
First, the accumulation of visceral fat increases the mechanical load on the weight-bearing joints, particularly the knees and hips. This additional pressure contributes to the deterioration of articular cartilage by accelerating wear and tear while also stimulating subchondral bone remodeling and hardening (35). Secondly, visceral adipose tissue secretes a range of bioactive molecules, including adipokines such as leptin and lipocalin, and inflammatory mediators such as IL-1β, TNF-α, CRP, and IL-6 (36). These substances trigger synovial inflammation and exacerbate cartilage breakdown by promoting the production of matrix metalloproteinases, which accelerate the degenerative processes associated with OA. Furthermore, obesity activates NLRP3 inflammasomes, leading to the release of proinflammatory cytokines that further worsen OA symptoms (37).
Third, visceral fat plays a crucial role in the development of metabolic disorders such as type 2 diabetes, which can influence OA progression. Elevated blood glucose levels increase oxidative stress and formation of advanced glycation end products (AGEs) in chondrocytes, potentially contributing to joint damage (38). In addition, obesity has been linked to changes in the gut microbiome, leading to intestinal permeability. This allows bacterial lipopolysaccharides to enter the bloodstream and trigger systemic inflammation, which may also affect OA pathogenesis (39).
Obesity is a multifaceted condition that impacts various fat depots, including visceral adiposity, subcutaneous adiposity, bone marrow adiposity, and ectopic fat accumulation in organs such as the liver, pancreas, and skeletal muscle. While our study focused on the VAI as a measure of visceral adiposity and found a significant association between higher VAI and increased OA risk, it is crucial to recognize that other fat depots may also contribute to OA risk. For instance, bone marrow adiposity has been linked to lower bone density and higher fracture risk, and may secrete inflammatory cytokines that contribute to joint inflammation and OA progression (40). Ectopic fat accumulation, such as hepatic steatosis and intramyocellular lipid accumulation, can lead to metabolic dysfunction and inflammation, which are also risk factors for OA (41, 42). Although our study did not directly measure these fat depots, future research should explore their potential roles in OA pathogenesis.
Overall, our findings highlight the need for further research to confirm these associations, deepen our understanding of the complex relationship between VAI and OA, and explore the mechanisms driving this connection.
The strengths of our study stem from the thorough analysis of the NHANES data, incorporating appropriate sample weights, which improved the statistical power to examine the link between VAI and OA. Additionally, we adjusted for relevant covariates to control confounding factors, thereby enhancing the robustness and generalizability of our findings to a wider population. However, this study had several limitations. First, the cross-sectional design of the study limits the ability to infer causality between VAI and OA and does not consider the possibility of reverse causality, where OA may lead to increased VAI associated with reduced physical activity and metabolic changes. This highlights the need for future prospective studies and intervention trials to establish a causal relationship. Therefore, the inherent constraints of observational research must be considered when interpreting results. Second, although we controlled for all known confounders in our multivariate analysis, the possibility of residual or unmeasured confounders remained, which could lead to an overestimation of the observed associations.
Conclusion
This study indicated that higher VAI values are linked to an increased risk of OA in individuals aged 50 years. Our results introduce new potential predictors that could inform strategies for the prevention and treatment of OA. However, additional large-scale prospective studies are necessary to clarify the mechanisms underlying this association.
Data availability statement
Publicly available datasets were analyzed in this study. This data can be found at: https://www.cdc.gov/nchs/nhanes/index.html.
Ethics statement
The studies involving humans were approved by Research Ethics Review Committee of the National Center for Health Statistics. The studies were conducted in accordance with the local legislation and institutional requirements. Written informed consent for participation was not required from the participants or the participants’ legal guardians/next of kin in accordance with the national legislation and institutional requirements.
Author contributions
ZW: Conceptualization, Data curation, Methodology, Software, Visualization, Writing – original draft. GP: Conceptualization, Data curation, Writing – original draft. YJ: Methodology, Writing – original draft. JQ: Software, Visualization, Writing – original draft. FW: Supervision, Visualization, Writing – review & editing.
Funding
The author(s) declare that no financial support was received for the research and/or publication of this article.
Acknowledgments
We would like to acknowledge all those who have contributed to this research. In particular, we express our deep gratitude to Jie Liu of the Department of Vascular and Endovascular Surgery at the Chinese PLA General Hospital for his essential contributions to the study design, manuscript language refinement, proofreading, statistical analysis, and valuable feedback. We also thank Lan Jiang, Master of Orthopedics at Huangshan City People’s Hospital, for her significant support with statistical analysis and manuscript review.
Conflict of interest
The authors confirm that the research was conducted without any commercial or financial ties that might be viewed as potential conflicts of interest.
Generative AI statement
The authors declare that no Generative AI was used in the creation of this manuscript.
Publisher’s note
All claims expressed in this article are solely those of the authors and do not necessarily represent those of their affiliated organizations, or those of the publisher, the editors and the reviewers. Any product that may be evaluated in this article, or claim that may be made by its manufacturer, is not guaranteed or endorsed by the publisher.
Footnotes
References
1. Allen K, Thoma L, Golightly Y. Epidemiology of osteoarthritis. Osteoarthritis Cartilage. (2021) 30:184–95. doi: 10.1016/j.joca.2021.04.020
2. Safiri S, Kolahi A, Smith E, Hill C, Bettampadi D, Mansournia M, et al. Global, regional and national burden of osteoarthritis 1990-2017: A systematic analysis of the Global burden of disease study 2017. Ann Rheum Dis. (2020) 79:819–28. doi: 10.1136/annrheumdis-2019-216515
3. Hunter D, March L, Chew M. Osteoarthritis in 2020 and beyond: A lancet commission. Lancet. (2020) 396:1711–2. doi: 10.1016/S0140-6736(20)32230-3
4. Vina E, Kwoh C. Epidemiology of osteoarthritis: Literature update. Curr Opin Rheumatol. (2018) 30:160–7. doi: 10.1097/BOR.0000000000000479
5. Katz J, Arant K, Loeser R. Diagnosis and treatment of hip and knee osteoarthritis: A review. JAMA. (2021) 325:568–78. doi: 10.1001/jama.2020.22171
6. Hunter D, Bierma-Zeinstra S. Osteoarthritis. Lancet. (2019) 393:1745–59. doi: 10.1016/S0140-6736(19)30417-9
7. Abramoff B, Caldera F. Osteoarthritis: Pathology. diagnosis, and treatment options. Med Clin North Am. (2020) 104:293–311. doi: 10.1016/j.mcna.2019.10.007
8. Fontanella C, Belluzzi E, Pozzuoli A, Scioni M, Olivotto E, Reale D, et al. Exploring anatomo-morphometric characteristics of infrapatellar, suprapatellar fat pad, and knee ligaments in osteoarthritis compared to post-traumatic lesions. Biomedicines. (2022) 10:1369. doi: 10.3390/biomedicines10061369
9. Olivotto E, Trisolino G, Belluzzi E, Lazzaro A, Strazzari A, Pozzuoli A, et al. Macroscopic synovial inflammation correlates with symptoms and cartilage lesions in patients undergoing arthroscopic partial meniscectomy: A clinical study. J Clin Med. (2022) 11:4330. doi: 10.3390/jcm11154330
10. Belluzzi E, El Hadi H, Granzotto M, Rossato M, Ramonda R, Macchi V, et al. Systemic and local adipose tissue in knee osteoarthritis. J Cell Physiol. (2017) 232:1971–8. doi: 10.1002/jcp.25716
11. Amato M, Giordano C, Galia M, Criscimanna A, Vitabile S, Midiri M, et al. Visceral adiposity index: A reliable indicator of visceral fat function associated with cardiometabolic risk. Diabetes Care. (2010) 33:920–2. doi: 10.2337/dc09-1825
12. Kouli G, Panagiotakos D, Kyrou I, Georgousopoulou E, Chrysohoou C, Tsigos C, et al. Visceral adiposity index and 10-year cardiovascular disease incidence: The ATTICA study. Nutr Metab Cardiovasc Dis. (2017) 27:881–9. doi: 10.1016/j.numecd.2017.06.015
13. Zhuang J, Wang Y, Wang S, Hu R, Wu Y. Association between visceral adiposity index and infertility in reproductive-aged women in the United States. Sci Rep. (2024) 14:14230. doi: 10.1038/s41598-024-64849-0
14. Deng R, Chen W, Zhang Z, Zhang J, Wang Y, Sun B, et al. Association between visceral obesity index and diabetes: A systematic review and meta-analysis. J Clin Endocrinol Metab. (2024) 109:2692–707. doi: 10.1210/clinem/dgae303
15. Lazzer S, D’Alleva M, Isola M, De Martino M, Caroli D, Bondesan A, et al. Cardiometabolic index (CMI) and Visceral adiposity index (VAI) highlight a higher risk of metabolic syndrome in women with severe obesity. J Clin Med. (2023) 12:3055. doi: 10.3390/jcm12093055
16. Qiao T, Luo T, Pei H, Yimingniyazi B, Aili D, Aimudula A, et al. Association between abdominal obesity indices and risk of cardiovascular events in Chinese populations with type 2 diabetes: A prospective cohort study. Cardiovasc Diabetol. (2022) 21:225. doi: 10.1186/s12933-022-01670-x
17. Tchernof A, Després J. Pathophysiology of human visceral obesity: An update. Physiol Rev. (2013) 93:359–404. doi: 10.1152/physrev.00033.2011
18. Liu H, Wang L, Chen C, Dong Z, Yu S. Association between dietary niacin intake and migraine among american adults: National health and nutrition examination survey. Nutrients. (2022) 14:3052. doi: 10.3390/nu14153052
19. Peng P, Wu J, Fang W, Tian J, He M, Xiao F, et al. Association between sarcopenia and osteoarthritis among the US adults: A cross-sectional study. Sci Rep. (2024) 14:296. doi: 10.1038/s41598-023-50528-z
20. March L, Schwarz J, Carfrae B, Bagge E. Clinical validation of self-reported osteoarthritis. Osteoarthritis Cartilage. (1998) 6:87–93. doi: 10.1053/joca.1997.0098
21. Zhou H, Li T, Li J, Zhuang X, Yang J. The association between visceral adiposity index and risk of type 2 diabetes mellitus. Sci Rep. (2024) 14:16634. doi: 10.1038/s41598-024-67430-x
22. Liu W, Weng S, Chen Y, Cao C, Peng D. Age-adjusted visceral adiposity index (VAI) is superior to VAI for predicting mortality among US adults: An analysis of the NHANES 2011-2014. Aging Clin Exp Res. (2024) 36:24. doi: 10.1007/s40520-023-02660-z
23. Liu H, Zhang S, Gong Z, Zhao W, Lin X, Liu Y, et al. Association between migraine and cardiovascular disease mortality: A prospective population-based cohort study. Headache. (2023) 63:1109–18. doi: 10.1111/head.14616
24. Wang X, Xie L, Yang S. Association between weight-adjusted-waist index and the prevalence of rheumatoid arthritis and osteoarthritis: A population-based study. BMC Musculoskelet Disord. (2023) 24:595. doi: 10.1186/s12891-023-06717-y
25. Funck-Brentano T, Nethander M, Movérare-Skrtic S, Richette P, Ohlsson C. Causal factors for knee, hip, and hand osteoarthritis: A mendelian randomization study in the UK biobank. Arthritis Rheumatol. (2019) 71:1634–41. doi: 10.1002/art.40928
26. Toivanen A, Heliövaara M, Impivaara O, Arokoski J, Knekt P, Lauren H, et al. Obesity, physically demanding work and traumatic knee injury are major risk factors for knee osteoarthritis–A population-based study with a follow-up of 22 years. Rheumatology (Oxford). (2010) 49:308–14. doi: 10.1093/rheumatology/kep388
27. Grotle M, Hagen K, Natvig B, Dahl F, Kvien T. Obesity and osteoarthritis in knee, hip and/or hand: An epidemiological study in the general population with 10 years follow-up. BMC Musculoskelet Disord. (2008) 9:132. doi: 10.1186/1471-2474-9-132
28. Jiang L, Tian W, Wang Y, Rong J, Bao C, Liu Y, et al. Body mass index and susceptibility to knee osteoarthritis: A systematic review and meta-analysis. Joint Bone Spine. (2012) 79:291–7. doi: 10.1016/j.jbspin.2011.05.015
29. Neeland I, Poirier P, Després J. Cardiovascular and metabolic heterogeneity of obesity: Clinical challenges and implications for management. Circulation. (2018) 137:1391–406. doi: 10.1161/CIRCULATIONAHA.117.029617
30. Chen Z, Zhou T, Bu Y, Yang L. Bone mineral density saturation as influenced by the visceral adiposity index in adults older than 20 years: A population-based study. Lipids Health Dis. (2023) 22:170. doi: 10.1186/s12944-023-01931-y
31. Huang X, Zhong Z, He J, Them S, Chen M, Liu A, et al. Association between visceral adiposity index and hyperuricemia among steelworkers: The moderating effects of drinking tea. Nutrients. (2024) 16:3221. doi: 10.3390/nu16183221
32. Yu Y, Zhang F, Yan X, Zhang P, Guo Z, Yang Y. Visceral adiposity index and cervical arterial atherosclerosis in northeast China: A population based cross-sectional survey. Eur J Neurol. (2021) 28:161–71. doi: 10.1111/ene.14513
33. Huang J, Han J, Rozi R, Fu B, Lu Z, Liu J, et al. Association between lipid accumulation products and osteoarthritis among adults in the United States: A cross-sectional study, NHANES 2017-2020. Prev Med. (2024) 180:107861. doi: 10.1016/j.ypmed.2024.107861
34. Huang J, Rozi R, Ma J, Fu B, Lu Z, Liu J, et al. Association between higher triglyceride glucose index and increased risk of osteoarthritis: Data from NHANES 2015-2020. BMC Public Health. (2024) 24:758. doi: 10.1186/s12889-024-18272-9
35. Robling A, Castillo A, Turner C. Biomechanical and molecular regulation of bone remodeling. Annu Rev Biomed Eng. (2006) 8:455–98. doi: 10.1146/annurev.bioeng.8.061505.095721
36. Versini M, Jeandel P, Rosenthal E, Shoenfeld Y. Obesity in autoimmune diseases: Not a passive bystander. Autoimmun Rev. (2014) 13:981–1000. doi: 10.1016/j.autrev.2014.07.001
37. Zhang R, Han L, Lin W, Ba X, Yan J, Li T, et al. Mechanisms of NLRP3 inflammasome in rheumatoid arthritis and osteoarthritis and the effects of traditional Chinese medicine. J Ethnopharmacol. (2024) 321:117432. doi: 10.1016/j.jep.2023.117432
38. Courties A, Sellam J. Osteoarthritis and type 2 diabetes mellitus: What are the links? Diabetes Res Clin Pract. (2016) 122:198–206. doi: 10.1016/j.diabres.2016.10.021
39. Favazzo L, Hendesi H, Villani D, Soniwala S, Dar Q, Schott E, et al. The gut microbiome-joint connection: Implications in osteoarthritis. Curr Opin Rheumatol. (2020) 32:92–101. doi: 10.1097/BOR.0000000000000681
40. Beekman K, Duque G, Corsi A, Tencerova M, Bisschop P, Paccou J. Osteoporosis and bone marrow adipose tissue. Curr Osteoporos Rep. (2023) 21:45–55. doi: 10.1007/s11914-022-00768-1
41. Lu Y, Zhang J, Li H, Li T. Association of non-alcoholic fatty liver disease with self-reported osteoarthritis among the US adults. Arthritis Res Ther. (2024) 26:40. doi: 10.1186/s13075-024-03272-2
Keywords: visceral adiposity index, osteoarthritis, NHANES, association, cross-sectional analysis
Citation: Wang Z, Peng G, Jiang Y, Qu J and Wu F (2025) Association between visceral adiposity index and osteoarthritis in U.S. adults aged 50 and older: a cross-sectional study. Front. Nutr. 12:1542937. doi: 10.3389/fnut.2025.1542937
Received: 16 December 2024; Accepted: 23 April 2025;
Published: 13 May 2025.
Edited by:
Jiawen Xu, Johns Hopkins University, United StatesReviewed by:
Assunta Pozzuoli, University of Padua, ItalyJiekang Wang, Johns Hopkins University, United States
Copyright © 2025 Wang, Peng, Jiang, Qu and Wu. This is an open-access article distributed under the terms of the Creative Commons Attribution License (CC BY). The use, distribution or reproduction in other forums is permitted, provided the original author(s) and the copyright owner(s) are credited and that the original publication in this journal is cited, in accordance with accepted academic practice. No use, distribution or reproduction is permitted which does not comply with these terms.
*Correspondence: Fengfu Wu, d3VmZjIwMjVAMTI2LmNvbQ==