 Xiaojing Huang1,2
 Huan Zhang1,2
 Yaoyu Luo3Chenhui Yang4Jue Huang1,2
 Ting Zhou1,2Junfeng Qi5Junlin Li5Shuzhen Zhu5Yaqin Zhang6
 Ling Zhang1,2*
 Xiaojie Sun1,2*
- 1Department of Environmental Hygiene and Occupational Medicine, School of Public Health, Wuhan University of Science and Technology, Wuhan, China
- 2Hubei Province Key Laboratory of Occupational Hazard Identification and Control, Wuhan University of Science and Technology, Wuhan, China
- 3State Key Laboratory of Environment Health (Incubation), Key Laboratory of Environment and Health, Ministry of Education, Key Laboratory of Environment and Health (Wuhan); Ministry of Environmental Protection, School of Public Health, Tongji Medical College, Huazhong University of Science and Technology, Wuhan, China
- 4Institute of Maternal and Child Health, Wuhan Children's Hospital, Tongji Medical College, Huazhong University of Science and Technology, Wuhan, China
- 5Hubei Center for Disease Control and Prevention, Wuhan, China
- 6Geriatric Hospital Affiliated with Wuhan University of Science and Technology, Wuhan, China
Background: Studies have suggested that folate may mitigate the impact of exposure to environmental chemicals. We aimed to explore the relationship between blood folate biomarker concentrations and urine phthalate metabolites.
Methods: Based on data from the National Health and Nutrition Examination Survey spanning 2005 to 2016, 8,218 participants with measurements of folate biomarkers in blood and phthalates exposure in urine were included. Survey generalized linear regression models and restricted cubic spline and generalized additive models were used to assess the associations between blood folate biomarker and urine phthalate metabolites.
Results: After adjusting for covariates, each unit increase in the natural logarithm-transformed serum folate concentration was associated with significant reductions of 7.41% in MEHP and 7.10% in MEHHP. After further adjustment for HEI-2020, these inverse associations strengthened to 8.11% (95% CI: −13.18, −2.76%) for MEHP and 8.07% (95% CI: −14.20, −1.52%) for MEHHP. Quartile analysis revealed that participants in the highest serum folate quartile exhibited significantly lower levels of MEHP, MEOHP, MECPP, and MEHHP compared to those in the lowest quartile (all p for trend <0.01). Furthermore, restricted cubic spline analyses and generalized additive models demonstrated significant inverse linear relationships between serum folate concentrations and MEHP, MEOHP, and MEHHP levels. No significant associations were observed between red blood cell folate concentrations and phthalate metabolites.
Conclusion: These findings indicate that folate is associated with reduced concentrations of phthalate metabolites in urine, which may hold significant relevance for the utilization of folate as a strategy to reduce the accumulation of phthalate burden.
1 Introduction
Phthalates are chemical plasticizers commonly used in the manufacture of polyvinyl chloride (PVC) and are detected in a wide range of consumer products (1). These extensive uses of phthalates have resulted in widespread exposure, occurring primarily through dietary intake, inhalation, and dermal contact (2). Phthalates have been widely identified in many human fluids, including urine, blood, and breast milk (3). Exposure to phthalates has been shown to impact fetal development and cause reproductive toxicity (4), neurotoxicity (5), respiratory health and cardiovascular health (6). These findings underscore the significant public health concerns associated with phthalate exposure. Despite restrictions on the production of certain phthalates in several countries owing to their rising health concerns, these compounds remain extensively utilized due to their low cost (7). Given the widespread exposure to phthalates in the coming years, it is important to identify effective strategies to alleviate the exposure levels and mitigates the adverse effects of phthalates on human health.
Nutrition has long been recognized as a modulator against the toxicity of environmental pollutants (8, 9). Intake of certain dietary nutrients, such as folate (10), or adherence to a healthy dietary pattern can alleviate the toxicity of certain environmental pollutants (11). Folic acid or folate, an essential water-soluble B vitamin found naturally in fruits and vegetables (12), is essential for one-carbon metabolism and involved in DNA and RNA synthesis and methylation reactions (13). The intake of folate supplements, organically cultivated foods, and vegetarian diets are frequently associated with lower urinary concentrations of phthalate metabolites (14–16). Additionally, folate possesses the ability to mitigate the adverse effects of various environmental pollutants on health. For example, a prospective cohort study has documented the protective effects of folate supplementation in relation to the association between gestational phthalate exposure and autistic traits in children (17). Consequently, an inverse connection between folate and phthalates may occur due to their antagonistic actions. Nevertheless, the aforementioned research employed questionnaires to assess individual folate levels, resulting in a less precise assessment. To date, no research has been undertaken to examine the relationship between blood folate biomarkers and urinary levels of phthalate metabolites in overall adult population.
Thus, for the current study, we aimed to investigate whether there was a relationship between blood folate biomarkers and urinary concentrations of phthalate metabolites utilizing the data from the National Health and Nutrition Examination Survey (NHANES).
2 Methods
2.1 Study participants
The NHANES commenced in 1971 and is a cross-sectional survey of the U.S. population conducted by the National Center for Health Statistics. In this study, we utilized data from participants aged 20 years and older from the NHANES 2005–2016 cycle, who had complete data on folate biomarkers in red blood cells and serum, as well as phthalate metabolites in urine. After excluding participants who had lacked data on body mass index (BMI) (n = 96), poverty index ratio (n = 828), education level (n = 7), alcohol consumption (n = 678) and serum cotinine (n = 26), a total of 8,218 participants were included, as shown in Supplementary Figure S1. All participants provided written consent to participate in NHANES (18).
2.2 Measurements of folate biomarkers
Peripheral blood samples were collected at the mobile examination center for all participants. In the cycle of 2005–2006, serum and red blood cell folate were measured using the Second Mid-Term Folate Radio assay Kit (Bio-Rad Laboratories, UK) (19). In the cycles of 2007–2008 and 2009–2010, the whole blood folate and serum folate concentration was measured using the microbiological assay (20). From the cycle of 2011–2012 and onwards, the folate in serum were determined using isotope dilution high-performance liquid chromatography tandem mass spectrometry (HPLC-MS/MS) (21, 22). Red blood cell folate is determined by the difference between whole blood folate and serum folate levels (20, 21). If the measured value of a folate form serum or red blood cell was below the detection limit (LOD), it was replaced with LOD/√2. Detailed methods and quality assurance have been provided in the laboratory procedure manuals (19–22).
2.3 Determination of phthalate metabolites in urine
Urine samples were procured at the Mobile Examination Center and preserved below −20°C for further analysis (23). Quantification of urinary phthalate metabolites was achieved through the application of high-performance liquid chromatography-electrospray ionization-tandem mass spectrometry (HPLC-ESI-MS/MS). In detail, compounds were isolated, preserved and ionised by ESI technology, then analyzed and detected by MS/MS to quantify the concentration of metabolites. Seven phthalate metabolites in urine were included in the present study: mono-ethyl phthalate (MEP), mono-butyl phthalate (MBP), mono-benzyl phthalate (MBzP), mono-(2-ethyl)-hexyl phthalate (MEHP), mono(2-ethyl-5-oxohexyl) phthalate (MEOHP), and mono-(2-ethyl-5-carboxypentyl) phthalate (MEHHP) and mono-2-ethyl-5-carboxypentyl phthalate (MECPP). The LODs for phthalate metabolites in urine ranged from 0.2 to 1.2 ng/mL, and compounds below the LOD were replaced with LOD/√2. To mitigate the impact of urine dilution, we used urinary creatinine measurements as covariates in the statistic models (24).
2.4 Covariates assessment
All covariates included in the model were selected based on evidence from previous studies related to phthalate exposure and folate. Participants’ weight and height were measured during physical examinations and used to calculate BMI (kg/m2), with obesity being defined as a BMI of 30 kg/m2 or greater in U.S. adults (25). Serum cotinine was determined using isotope dilution-high performance liquid chromatography/atmospheric pressure chemical ionization tandem mass spectrometry. The income-to-poverty ratio was calculated by dividing household monthly income by the specific poverty threshold based on household size. Dietary data from two 24-h dietary recalls was also extracted to calculated the Healthy Eating Index (HEI-2020) score. This indicator of diet quality includes nine food and nutrient components, with higher scores indicating better diet quality. A detailed description of HEI-2020 can be found elsewhere (26).
2.5 Statistical analyses
Data on continuous or categorical basic characteristics of the participants were expressed as mean (standard deviation, SD) or n (%), respectively. Survey generalized linear regression models were constructed using folate concentrations in red blood cells and in serum as independent variables and phthalate metabolite concentrations in urine as dependent variables. To account for the complex sampling design of NHANES, three variables were used based on the survey-weighted generalized linear models: strata (sdmvstra), cluster (sdmvpsu), and combined weight of phthalate in 2005–2016 cycles. Both blood folate and urinary phthalate metabolites were natural logarithm (ln)-transformed to improve the normality of distribution in the regression analyses. To enhance the interpretability of effect sizes, percent changes (%Δ) for estimated coefficients (β, which were obtained from the survey-weighted generalized linear models) has been back-transformed using formula [%Δ = (eβ − 1) × 100] (27). Additionally, the “e” in the formula represents the natural constant, approximately equal to 2.718. Based on previous studies (28, 29), covariates in our study included age (continuous), gender (male or female), race/ethnicity (Mexican American, non-Hispanic White, non-Hispanic Black, other Hispanic and other race), BMI (continuous), education level (less than middle school, high school graduate, college degree, college graduate or above), serum cotinine levels (continuous), income-to-poverty ratio (continuous), urinary creatinine (continuous), alcohol consumption (yes or no), folate detection methods (BR, MA, HPLC-MS/MS) and HEI-2020. Models were also fit using the quartiles of serum or blood cell folate, and the lowest quartile was assigned as referent group. The median values of quartiles of folate were modeling as a continuous variable to evaluate the linear trends. Furthermore, restricted cubic splines and generalized additive model were employed to elucidate potential dose-relationships. Gender stratified associations between blood folate biomarker concentrations and urinary phthalate were also explored. The interactions were assessed by adding interaction terms of stratifying variables and folate concentrations. The association analyses adhered to the NHANES Statistical Analysis Protocol and Reporting Guidelines. To evaluate the robustness of the findings, the estimated glomerular filtration rate (eGFR) and liver enzyme levels (ALT/AST) were further adjusted (30, 31), which were known factors for urinary phthalate metabolite analyses.
All of the statistical analyses were performed using R 4.3.1. Survey-weighted generalized linear regression analysis was performed using the svyglm () function in the R software package “survey.” Restricted cubic spline and generalized additive models were plotted using the R software packages “rcssci,” “mgcv” and “ggplot2.” Statistical significance was considered when two-side p value less than 0.05.
3 Results
3.1 Participant characteristics
The basic characteristics of 8,218 adults are presented in Table 1. Overall, the participants were on average age of 48.9 years, with 49.3% participants being male. The mean of BMI and income-to-poverty ratio of those adults were 29.2 kg/m2 and 2.5 at the survey, respectively. Regarding race and ethnicity, 45.3 and 20.9% of the participants were non-Hispanic White and non-Hispanic Black. Over half of the subjects have achieved a college degree or higher level of education. Alcohol drinking was reported by 72.5% of the participants. The overall mean levels of serum cotinine and urinary creatinine were 59.5 ng/mL and 124.6 mg/dL, respectively. The baseline characteristics of excluded participants are presented in Supplementary Table S1. No significant differences were observed between the included and excluded groups.
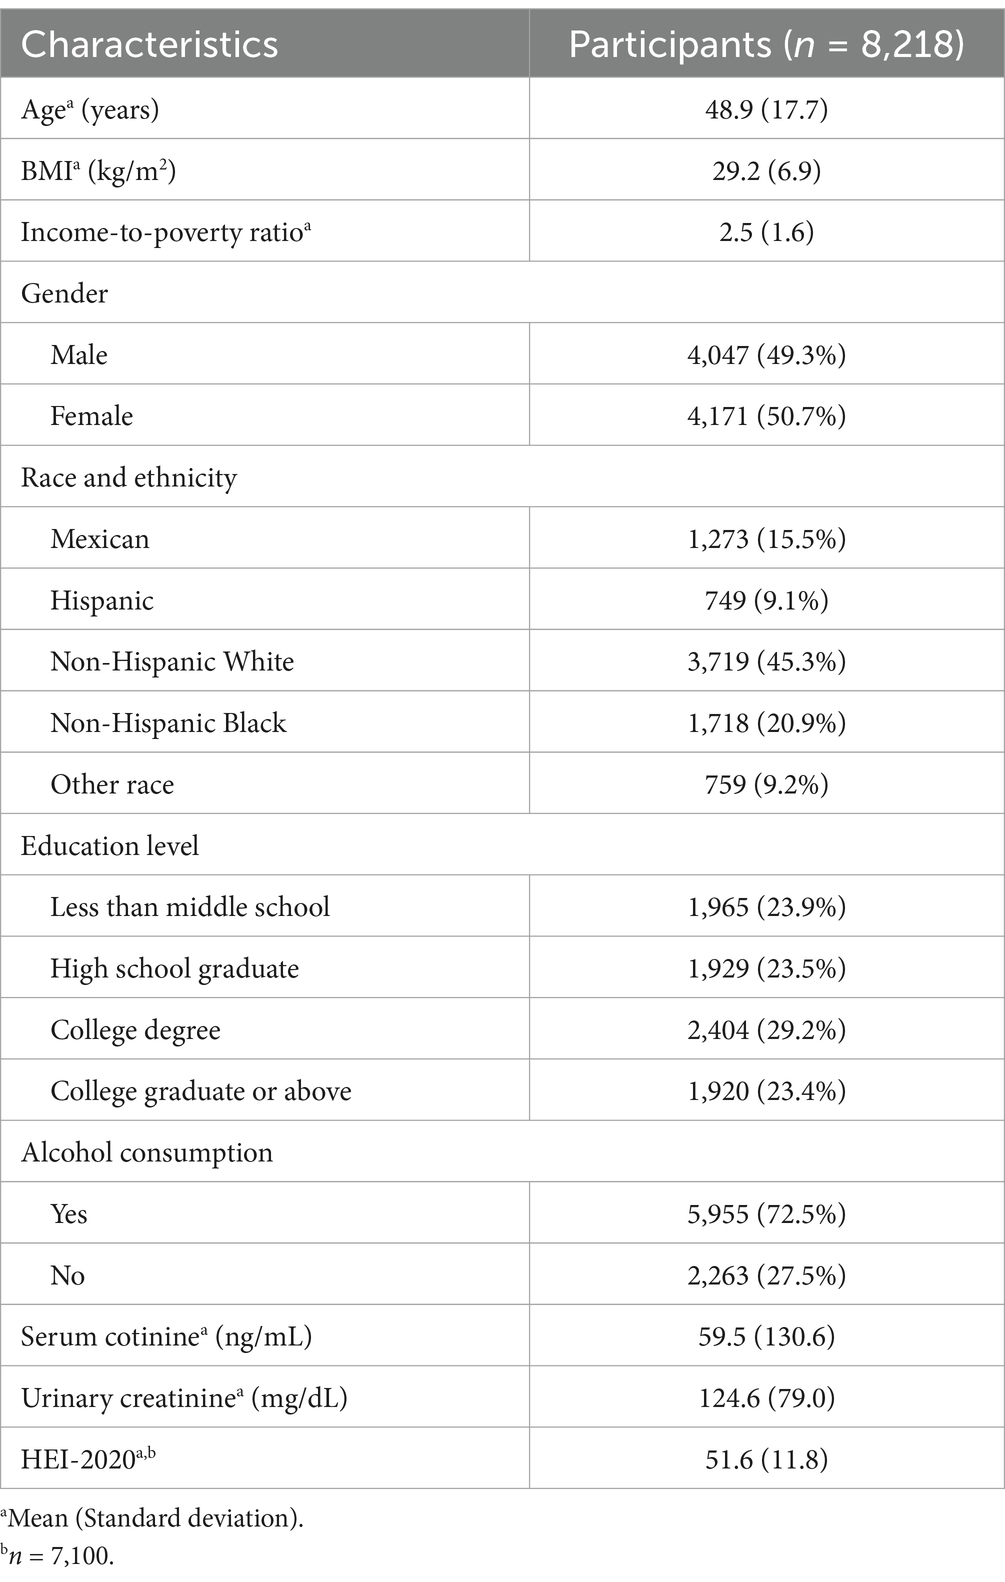
Table 1. Basic characteristics of the study population.
The distributions of folate biomarker concentrations in serum and red blood cells, and urinary phthalate metabolite concentrations are shown in Table 2. The medians of folate in serum and red blood cell were 15.40 ng/mL and 438.40 ng/mL, respectively. Most of urinary phthalate metabolites were highly detected (>97%). Urinary MEP had the highest median concentration (61.31 ng/mL), followed by MECPP (15.85 ng/mL) and MBP (13.75 ng/mL).
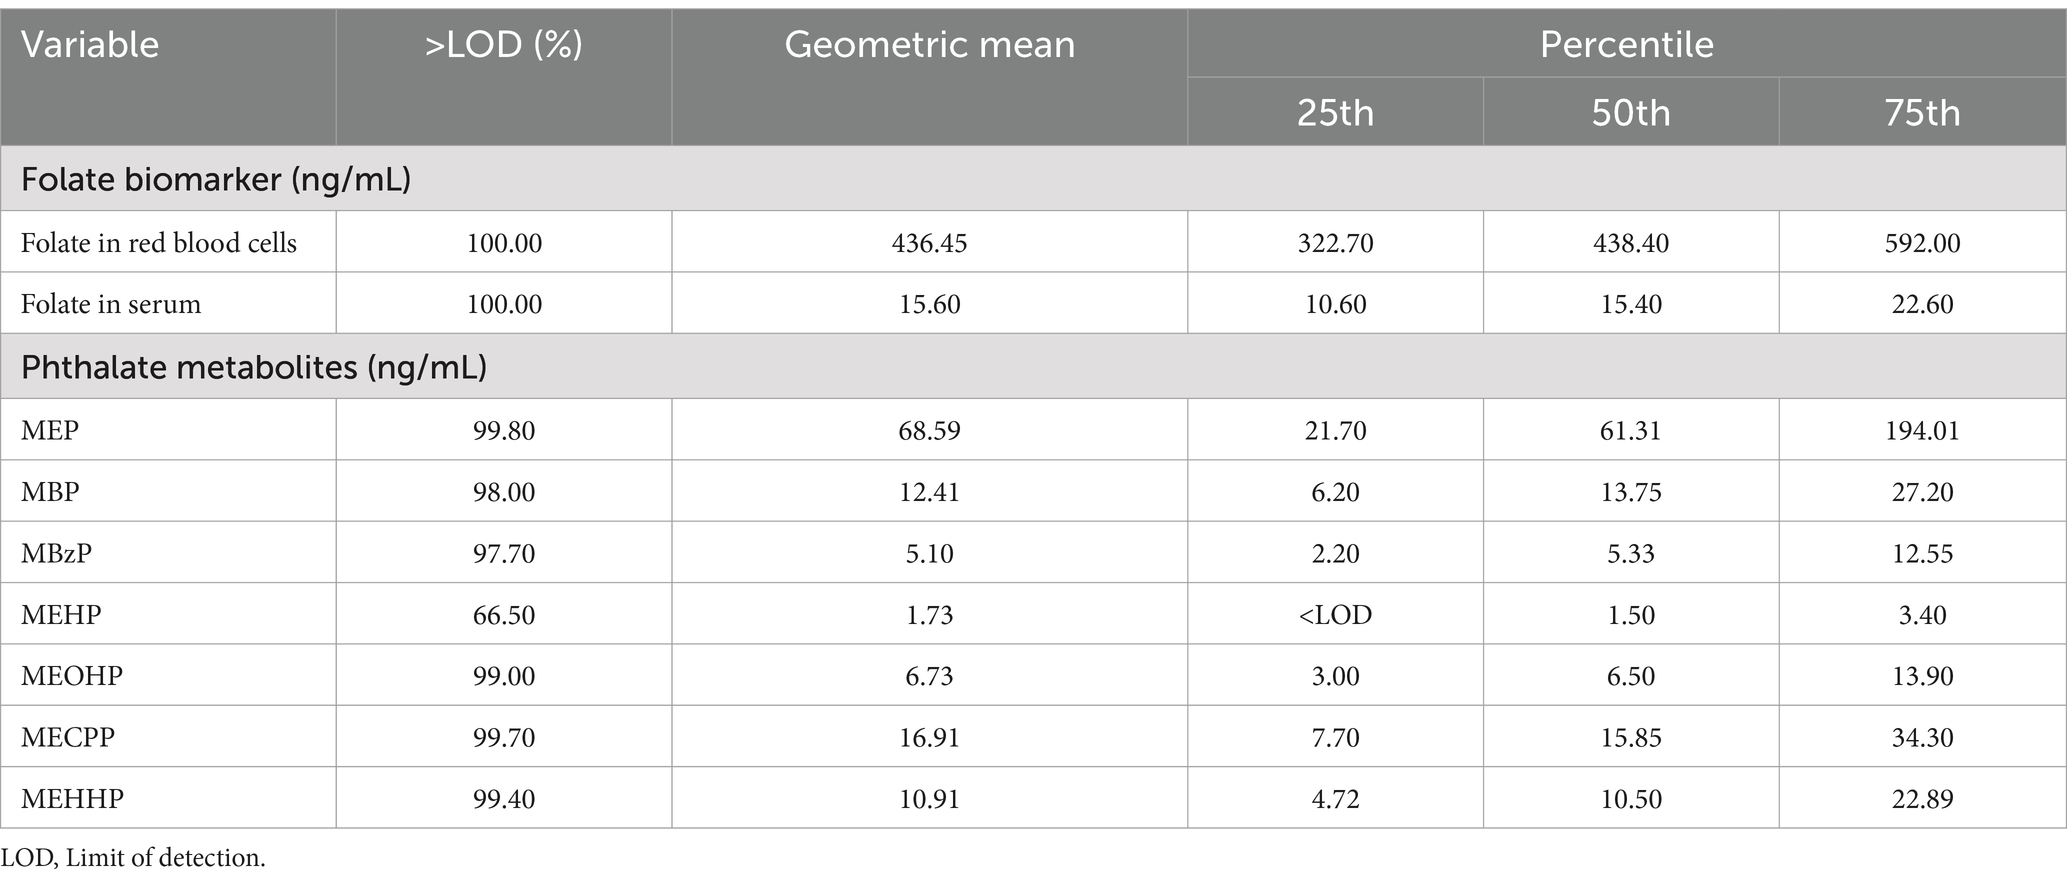
Table 2. Distributions of folate biomarker concentrations (red blood cells and serum), and urinary phthalate metabolite concentrations.
3.2 Associations between folate in red blood cells and urinary phthalate metabolites
As presented in Figure 1 and Supplementary Table S2, after adjusting for age, gender, race/ethnicity, BMI, education, serum cotinine, poverty index ratio, urinary creatinine, drinking and folate detection methods, no significant association was observed in red blood cell folate and phthalate metabolites. After additional adjustment for the HEI-2020, a significant positive association was observed between the natural log-transformed red blood cell folate concentration and urinary MBzP levels (Percent change: 8.63, 95% CI: 0.68, 17.21%) in linear regression models. However, quartile-based analysis did not reveal a statistically significant linear association. Furthermore, dose–response relationships between red blood cell folate and urinary phthalate metabolites—assessed using restricted cubic splines and generalized additive models (Supplementary Figures S2, S4)—did not yield significant findings, as illustrated in Figure 1.
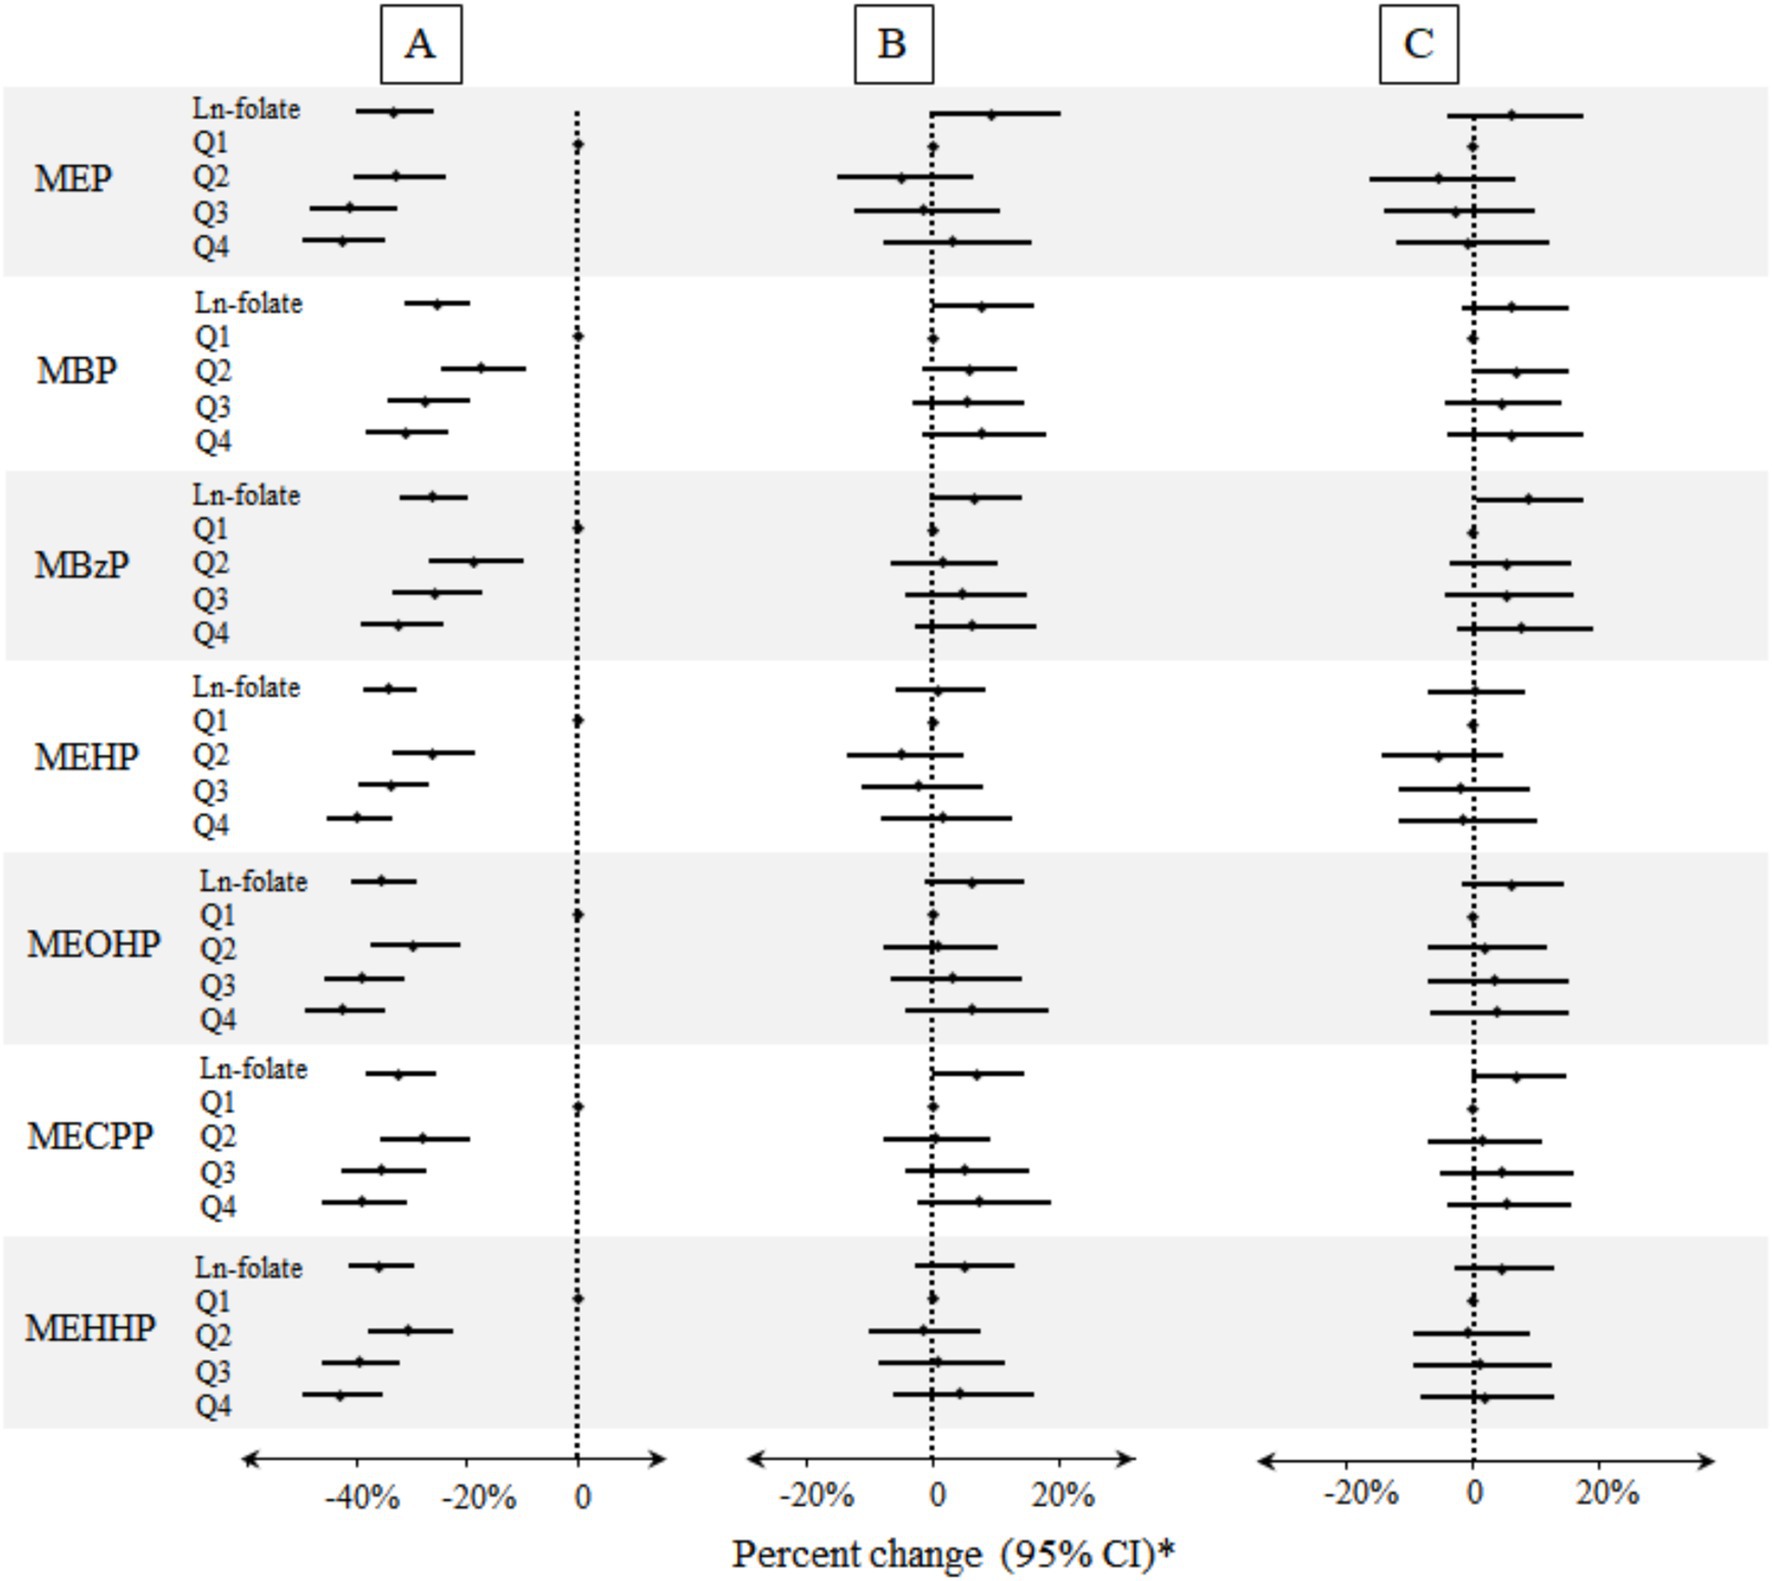
Figure 1. Percent changes of urinary phthalate metabolites in relation to folate concentrations in red blood cells. A: Unadjusted model (n = 8,218). B: Models were adjusted for age, gender, race/ethnicity, BMI, education, serum cotinine, poverty index ratio, urinary creatinine, drinking, and folate detection methods (n = 8,218). C: Models were adjusted for potential confounders described above and HEI-2020 (n = 7,100). *Folate biomarkers were the independent variables and the individual urinary phthalate metabolites were the dependent variables.
3.3 Associations between folate in serum and urinary phthalate metabolites
As shown in Figure 2 and Supplementary Table S3, multiple inverse associations between serum folate concentrations and urinary phthalate metabolites were observed. Per unit increase in ln-transformed serum folate concentrations was associated with a reduction of 7.41% (95% CI: −12.18, −2.38%) and 7.10% (95% CI: −13.18, −0.60%) in urinary concentrations of MEHP and MEHHP, respectively (Supplementary Table S3). Significant negative trend was also found between higher quartile of serum folate concentration and most urinary phthalate metabolites. Specifically, compared with 1st quartile, the 4th quartile of serum folate concentration was associated with reductions in urinary concentrations of MEHP (Percent change: −11.14%; 95% CI: −18.29, −3.36%), MEOHP (Percent change: −9.96%; 95% CI: −17.82, −1.34%), and MEHHP (Percent change = −12.86%; 95% CI: −20.76, −4.16%).
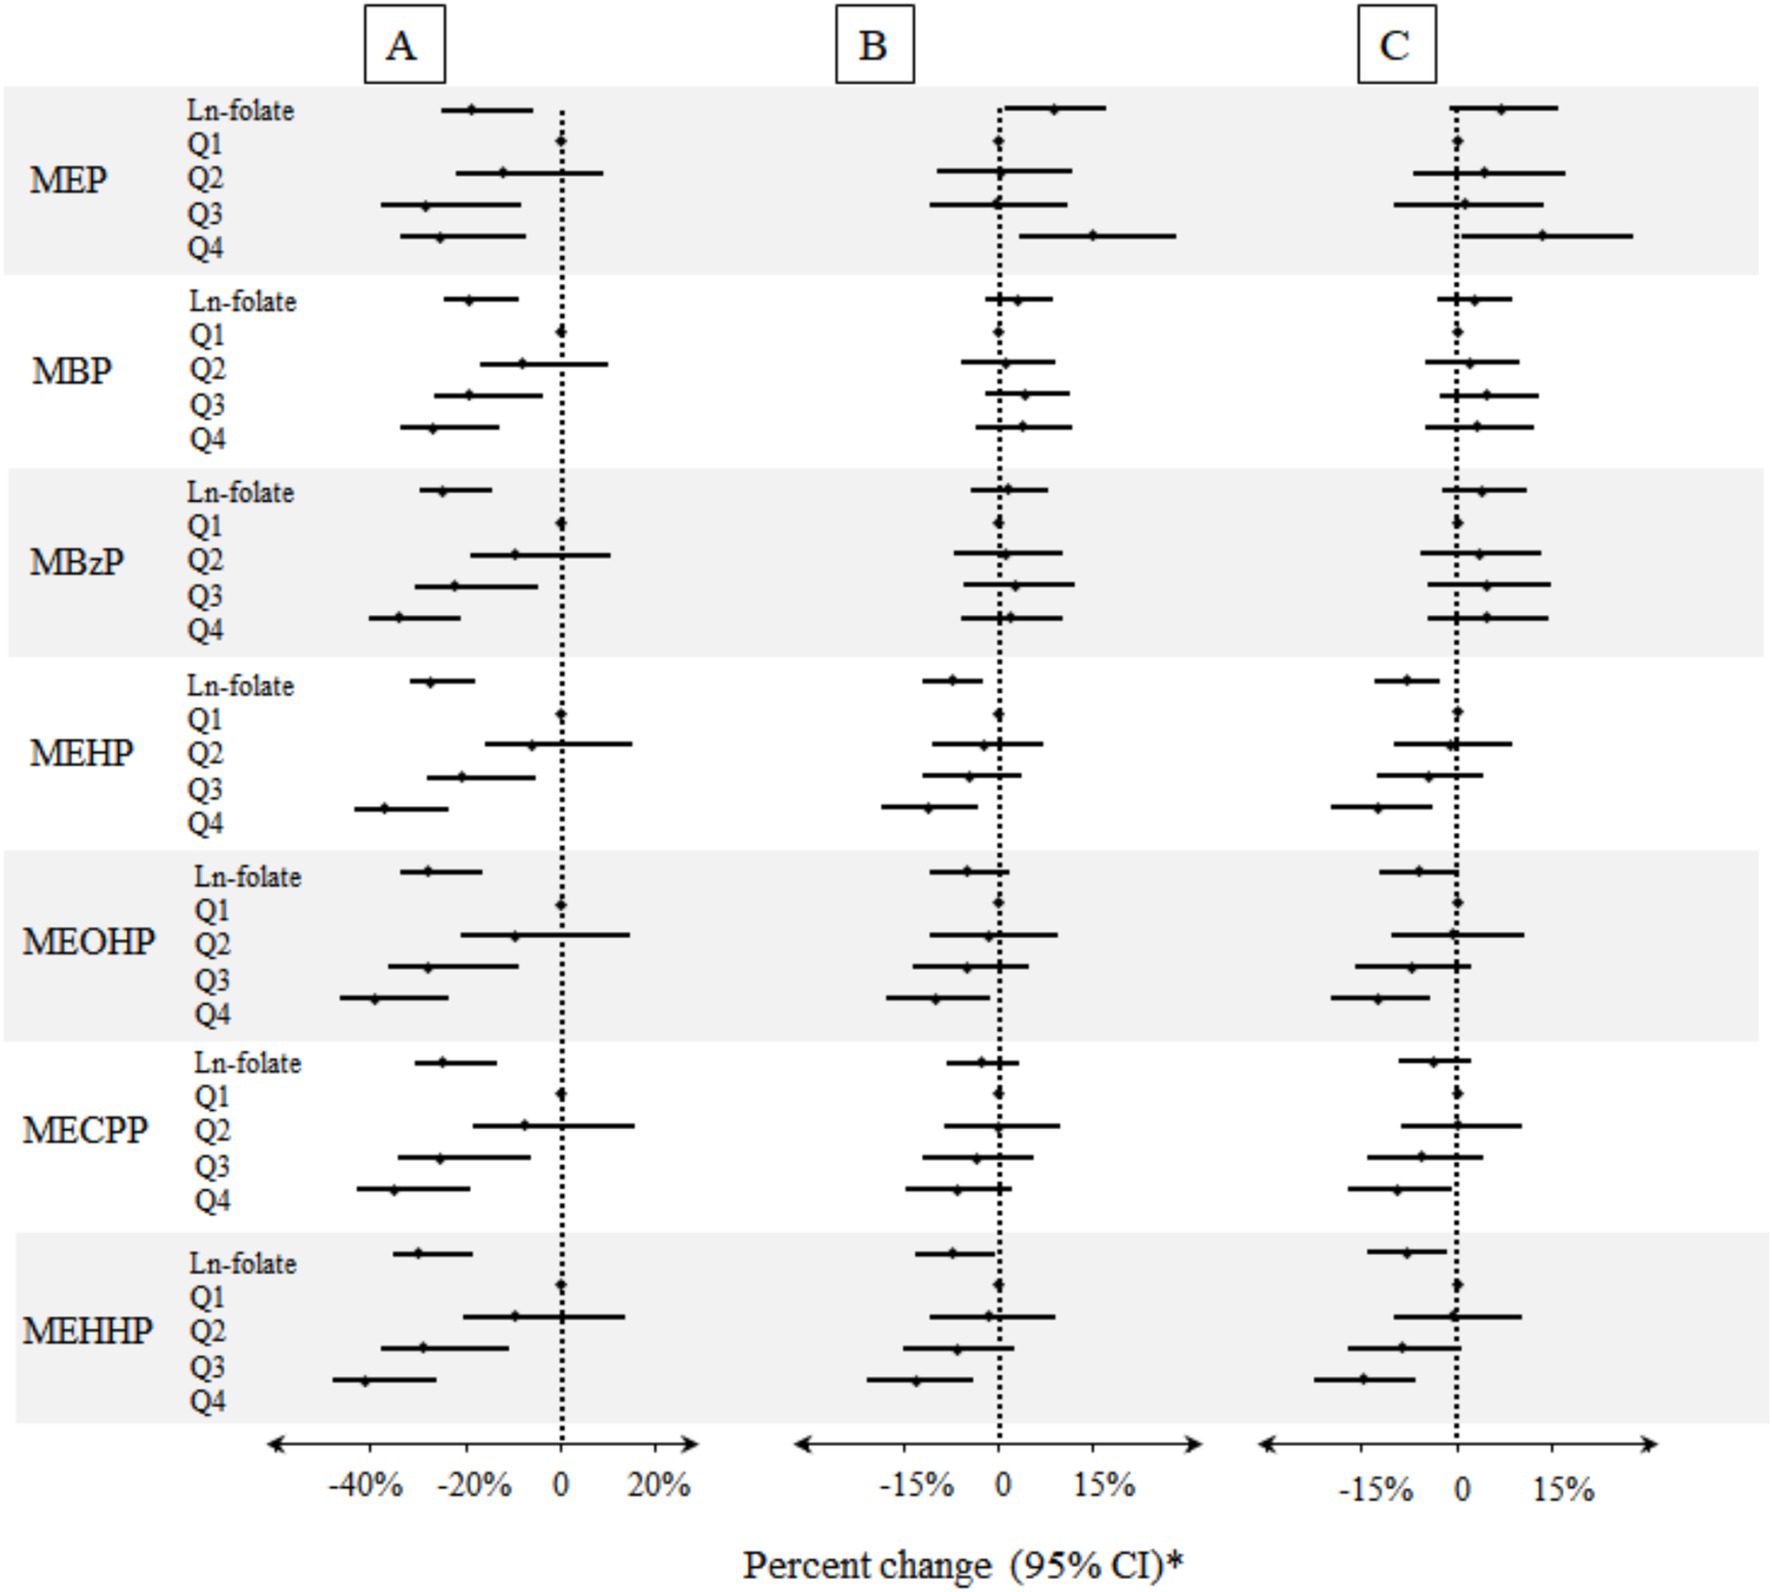
Figure 2. Percent changes of urinary phthalate metabolites in relation to folate concentrations in serum. A: Unadjusted model (n = 8,218). B: Models were adjusted for age, gender, race/ethnicity, BMI, education, serum cotinine, poverty index ratio, urinary creatinine, drinking, and folate detection methods (n = 8,218). C: Models were adjusted for potential confounders described above and HEI-2020 (n = 7,100). * Folate biomarkers were the independent variables and the individual urinary phthalate metabolites were the dependent variables.
After additional adjustment for HEI-2020, similar negative association patterns were also observed (Supplementary Table S3). For example, a unit increase in serum folate concentrations was associated with an 8.11 and 8.07% reduction in urinary concentration of MEHP and MEHHP (Supplementary Table S3). In addition, compared with the lowest quartile, the participants who were in the highest quartile of serum folate concentration had a significantly decrease in urinary phthalate metabolites with percent change ranged from −9.35% (95% CI: −17.10, −0.87% for MECPP; p trend < 0.01) to −14.91% (95% CI: −22.50, −6.59% for MEHHP; p trend < 0.01) (Supplementary Table S3). Notably, serum folate concentration exhibited a positive association with urinary MEP levels (8.74, 95% CI: 1.03, 17.05%; p-trend < 0.05). However, this association was attenuated and lost statistical significance after further adjustment for HEI-2020. Supplementary Figures S3, S5 illustrates the dose–response relationships between serum folate concentrations and urinary phthalate metabolite levels, which indicated a significant downward trend in the correlation between serum folate concentrations and most urinary phthalate metabolite levels, in alignment with results in Figure 2.
3.4 Folate biomarkers in relation to phthalate metabolites stratified by gender
The folate concentration in red blood cell was positively correlated with urinary MBzP concentrations in the male population (Supplementary Table S4). Specifically, compared to the lowest quartile of red blood cell folate, each unit increase in the highest quartile was associated with a 20.14% increase in urinary MBzP (Supplementary Table S4). However, in serum folate analysis, the inverse associations were observed in male population (Supplementary Table S5). Specifically, compared to the lowest quartile of serum folate, the participants who were in the highest quartile of serum folate concentration had a significantly decrease in MEHP, MEOHP and MEHHP, with percent change ranged from −15.50% (95% CI: −26.46, −2.90% for MEHP; p trend = 0.01) to −17.77% (95% CI: −29.31, −4.37% for MEHHP; p trend = 0.01). No significant association between folate in red blood cell and serum was observed in female participants (Supplementary Tables S4, S5).
3.5 Sensitivity analyses
To address potential confounding by renal and hepatic function, we conducted sensitivity analyses adjusting for estimated glomerular filtration rate (eGFR) and alanine aminotransferase/aspartate aminotransferase (ALT/AST) levels (Supplementary Table S6). The inverse associations between serum folate concentrations and phthalate metabolites remained robust after these additional adjustments, suggesting that kidney and liver function are unlikely to substantially influence the observed relationships.
4 Discussion
In this large-scale epidemiology study, concentrations of folate measured in serum were inversely associated with the most of the urinary concentrations of phthalate metabolites among adults. Linearity of these associations was also confirmed by restricted cubic splines and generalized additive models. These relationships were more pronounced among male participants.
Consistent with our findings, prior studies have generally observed inverse associations for folic acid supplement use in relation to urinary phthalate metabolites. A cohort study from Netherlands found pregnancies who lacked folic acid supplement during pregnancy had a 19.75 nmol/L higher DEHP metabolite concentrations (32). In addition, the pregnancies who have taken over 400 μg/day folic acid supplementation had lower levels of all the urinary phthalate metabolites measured (32). Dietary consumption of beans, legumes, vegetables, and fruits, which are folate-rich foods (12, 14, 16), and adherence to a diet consisting fresh foods or vegetarian products (33) were also associated with decreased urinary concentrations of specific phthalate metabolites. An NHANES study reported that fruit intake was negatively associated with urinary phthalate metabolites, with each additional gram of fruit consumed decreasing the concentration of di-2-ethylhexyl phthalate metabolites by 0.04% (34). Furthermore, extensive evidence suggested that folic acid can alleviate the harmful effects of phthalates in humans (10, 17). The above research suggests that folic acid is likely to mitigate the adverse effects of phthalates by reducing the burden of phthalates.
As far as we know, our work is the first investigation into the correlation between serum folate indicators and urine levels phthalate metabolites in adults. Previous studies assessed dietary food intake, rather than blood folate biomarkers, in relation to urinary phthalate metabolites. Folate in red blood cell and serum facilitated a more objective and precise assessment of this specific nutrient (35), which was crucial for mechanistic experiments and intervention research. To mitigate the potential influence of dietary confounding, we adjusted the HEI-2020 as a covariate in our regression analyses, reinforcing the observed negative associations between folate levels and phthalate exposure. Recently, Mascari et al. have explored the individual and joint associations between a mixture of 39 pollutants and red blood cell folate concentrations in the U.S. population (36). In individual association, two phthalate metabolites, were positively associated with red blood cell folate. In joint associations, no significant association was observed between phthalate and RBC folate. This study has similar results with our study. Another study has demonstrated the inverse association between urine phthalate levels and serum folate concentrations among children (37). This study postulated that phthalates could potentially affect folate metabolism and thus leading to reduced folate levels. Conversely, we hypothesize that serum folate might reduce phthalate levels which was an innovative perspective based on the mode of action between folate and phthalate. It is established that red blood cell folate level is reflective of the long-term folate intake, whereas the serum folate level is reflective of the recent folate intake (38). Our findings, showing a significant inverse association between serum folate (but not red blood cell folate) and urinary phthalate metabolites, support an alternative hypothesis: higher folate levels may attenuate phthalate accumulation through mechanistic pathways related to phthalate metabolism and transport.
There are several plausible explanations for our findings. Phthalates ingested into the body undergo hydrolysis to form monoester metabolites through the catalytic activity of lipase or esterase, which may subsequently be hydroxylated and oxidized to yield secondary metabolites. Lipase activity was one of the most important sections to determine the phthalate metabolite concentration (39). Folic acid supplementation in pregnancy was associated with a significantly decrease in mRNA and protein expression levels of lipases, as well as an increase in DNA methylation levels in the promoter and first exon region of adipose lipases in offspring compared to the control group (40). The decreased phthalate metabolite concentration might be partially attributed to the decreased lipase activity of high folic acid (39). Folate and phthalate are the same substrates for several transporters (41), such as solute carrier transport (42, 43), ATP-binding cassette transporters (41, 44) and organic anion transporters (45, 46). These transporters are ubiquitously distributed across nearly all body organs, with an elevated concentration in the gastrointestinal tract system, kidneys, and liver. Folate may reduce phthalate concentrations by competing with phthalates for transporter binding, hence diminishing intestinal absorption and renal reabsorption of phthalates. The decrease in intestinal absorption and renal reabsorption of phthalates might be attributed to a reduction in phthalate burden.
Stratified analysis indicated a stronger correlation between erythrocyte and serum folate concentrations and phthalate metabolite levels among males. This may be partially attributable to gender differences in sensitivity to phthalates (47). Phthalates, which are analogues of sex hormones, can potentially interact with gender-specific endocrine pathways, including androgen biosynthesis (48). However, the observed stratification discrepancy could also be partly attributed to other unmeasured confounding, including but not limited to lifestyle factors and diet.
The present study boasts several noteworthy strengths. Firstly, it is grounded in a nationwide survey which ensures a large sample size and nationally representative. Second, it is the first study to reveal the association between serum folate biomarkers and urinary concentrations of phthalate metabolites in adults. Thirdly, given the pervasive exposure and potential adverse health effects of phthalates, findings of the present study may offer a preventive approach to mitigating phthalates exposure. Inevitable, this study also has limitations. Firstly, the cross-sectional design of the study precludes the establishment of causal relationships. Secondly, the study was conducted in adult population participating in NHANES, which may limit the generalizability of the findings to populations with varying geographic and anthropogenic factors worldwide. Further large-scale cohort studies with mixture analysis and physiological mechanistic are warranted to validate the findings.
5 Conclusion
The present study, conducted in a nationally representative sample, revealed significant inverse correlations between serum folate concentrations and urinary metabolite concentrations of phthalates. These results hold significant implications for developing interventions designed to alleviate the burden of phthalates within the human body. Moreover, our findings furnish a scientific foundation for further inquiry into the capacity of dietary nutrients to counteract the harmful effects of environmental exposures on human health. This underscores the importance of public focus to dietary health and the necessity for heightened awareness of public health and prevention measures. Further prospective and experimental studies are indispensable to validate or exclude a causal relationship between folic acid and phthalate metabolite concentrations, and to elucidate the underlying mechanisms.
Data availability statement
Publicly available datasets were analyzed in this study. This data can be found at: https://www.cdc.gov/nchs/nhanes/index.htm.
Ethics statement
The studies involving humans were approved by the Ethical Review Board of the National Center for Health Statistics. The studies were conducted in accordance with the local legislation and institutional requirements. The participants provided their written informed consent to participate in this study.
Author contributions
XH: Methodology, Software, Visualization, Writing – original draft, Writing – review & editing. HZ: Methodology, Software, Visualization, Writing – original draft, Writing – review & editing. YL: Methodology, Software, Writing – original draft. CY: Methodology, Software, Writing – original draft. JH: Methodology, Software, Writing – original draft. TZ: Supervision, Writing – original draft, Writing – review & editing. JQ: Validation, Writing – original draft. JL: Validation, Writing – original draft. SZ: Validation, Writing – original draft. YZ: Methodology, Writing – original draft. LZ: Conceptualization, Supervision, Writing – review & editing. XS: Conceptualization, Supervision, Writing – original draft, Writing – review & editing.
Funding
The author(s) declare that financial support was received for the research and/or publication of this article. This work was supported by the National Natural Science Foundation of China (No. 42207491), Hubei Provincial Natural Science Foundation of China (No. 2025AFB488), Wuhan Preventive Medicine Research Special Project (No. WY22M01), the 14th Five Year Plan Hubei Provincial advantaged characteristic disciplines (groups) project of Wuhan University of Science and Technology (No. 2023C0101), and Open Fund Project of Hubei Province Key Laboratory of Occupational Hazard Identification and Control (No. OHIC2023Y01).
Conflict of interest
The authors declare that the research was conducted in the absence of any commercial or financial relationships that could be construed as a potential conflict of interest.
Generative AI statement
The author(s) declare that no Gen AI was used in the creation of this manuscript.
Publisher’s note
All claims expressed in this article are solely those of the authors and do not necessarily represent those of their affiliated organizations, or those of the publisher, the editors and the reviewers. Any product that may be evaluated in this article, or claim that may be made by its manufacturer, is not guaranteed or endorsed by the publisher.
Supplementary material
The Supplementary material for this article can be found online at: https://www.frontiersin.org/articles/10.3389/fnut.2025.1542952/full#supplementary-material
References
1. Chang, WH, Herianto, S, Lee, CC, Hung, H, and Chen, HL. The effects of phthalate ester exposure on human health: a review. Sci Total Environ. (2021) 786:147371. doi: 10.1016/j.scitotenv.2021.147371
2. Guo, Y, and Kannan, K. A survey of phthalates and parabens in personal care products from the United States and its implications for human exposure. Environ Sci Technol. (2013) 47:14442–9. doi: 10.1021/es4042034
3. Zhang, Y-J, Guo, J-L, Xue, J-c, Bai, C-L, and Guo, Y. Phthalate metabolites: characterization, toxicities, global distribution, and exposure assessment. Environ Pollut. (2021) 291:118106. doi: 10.1016/j.envpol.2021.118106
4. Lyche, JL, Gutleb, AC, Bergman, A, Eriksen, GS, Murk, AJ, Ropstad, E, et al. Reproductive and developmental toxicity of phthalates. J Toxicol Environ Health B Crit Rev. (2009) 12:225–49. doi: 10.1080/10937400903094091
5. Holahan, MR, and Smith, CA. Phthalates and neurotoxic effects on hippocampal network plasticity. Neurotoxicology. (2015) 48:21–34. doi: 10.1016/j.neuro.2015.02.008
6. Mariana, M, and Cairrao, E. Phthalates implications in the cardiovascular system. J Cardiovasc Dev Dis. (2020) 7:26. doi: 10.3390/jcdd7030026
7. Benjamin, S, Masai, E, Kamimura, N, Takahashi, K, Anderson, RC, and Faisal, PA. Phthalates impact human health: epidemiological evidences and plausible mechanism of action. J Hazard Mater. (2017) 340:360–83. doi: 10.1016/j.jhazmat.2017.06.036
8. He, W, Yang, H, Pu, Q, and Li, Y. Novel control strategies for the endocrine-disrupting effect of PAEs to pregnant women in traffic system. Sci Total Environ. (2022) 851:158269. doi: 10.1016/j.scitotenv.2022.158269
9. Hennig, B, Ormsbee, L, McClain, CJ, Watkins, BA, Blumberg, B, Bachas, LG, et al. Nutrition can modulate the toxicity of environmental pollutants: implications in risk assessment and human health. Environ Health Perspect. (2012) 120:771–4. doi: 10.1289/ehp.1104712
10. Ormond, G, Nieuwenhuijsen, MJ, Nelson, P, Toledano, MB, Iszatt, N, Geneletti, S, et al. Endocrine disruptors in the workplace, hair spray, folate supplementation, and risk of hypospadias: case–control study. Environ Health Perspect. (2009) 117:303–7. doi: 10.1289/ehp.11933
11. Luo, C, Deng, J, Chen, L, Wang, Q, Xu, Y, Ping, L, et al. Phthalate acid esters and polycyclic aromatic hydrocarbons concentrations with their determining factors among Chinese pregnant women: a focus on dietary patterns. Sci Total Environ. (2022) 852:158344. doi: 10.1016/j.scitotenv.2022.158344
12. van der Windt, M, Schoenmakers, S, van Rijn, B, Galjaard, S, Steegers-Theunissen, R, and van Rossem, L. Epidemiology and (Patho)physiology of folic acid supplement use in obese women before and during pregnancy. Nutrients. (2021) 13:331. doi: 10.3390/nu13020331
13. Araujo, JR, Martel, F, Borges, N, Araujo, JM, and Keating, E. Folates and aging: role in mild cognitive impairment, dementia and depression. Ageing Res Rev. (2015) 22:9–19. doi: 10.1016/j.arr.2015.04.005
14. Pacyga, DC, Sathyanarayana, S, and Strakovsky, RS. Dietary predictors of phthalate and Bisphenol exposures in pregnant women. Adv Nutr. (2019) 10:803–15. doi: 10.1093/advances/nmz029
15. Sieck, NE, Bruening, M, van Woerden, I, Whisner, C, and Payne-Sturges, DC. Erratum: "Effects of behavioral, clinical, and policy interventions in reducing human exposure to Bisphenols and phthalates: a scoping review". Environ Health Perspect. (2024) 132:49004. doi: 10.1289/EHP15045
16. Tordjman, K, Grinshpan, L, Novack, L, Göen, T, Segev, D, Beacher, L, et al. Exposure to endocrine disrupting chemicals among residents of a rural vegetarian/vegan community. Environ Int. (2016) 97:68–75. doi: 10.1016/j.envint.2016.10.018
17. Oulhote, Y, Lanphear, B, Braun, JM, Webster, GM, Arbuckle, TE, Etzel, T, et al. Gestational exposures to phthalates and folic acid, and autistic traits in Canadian children. Environ Health Perspect. (2020) 128:27004. doi: 10.1289/EHP5621
18. Johnson, CL, Dohrmann, SM, Burt, VL, and Mohadjer, LK. National health and nutrition examination survey: sample design, 2011-2014. Vital Health Stat. (2014) 1–33. Available online at: https://www.cdc.gov/nchs/data/series/sr_02/sr02_162.pdf
19. CDC. Laboratory procedure manual: folate—RBC & serum. Available online at: https://wwwn.cdc.gov/Nchs/Data/Nhanes/Public/2005/DataFiles/FOLATE_D.htm (Accessed April 15, 2025).
20. CDC. Laboratory procedure manual: folate—RBC & serum. Available online at: https://wwwn.cdc.gov/nchs/data/nhanes/public/2007/labmethods/folate_e_met.pdf (Accessed April 15, 2025).
21. CDC. Laboratory procedure manual: folate—RBC. Available online at: https://wwwn.cdc.gov/nchs/data/nhanes/public/2011/labmethods/folate_g_met.pdf (Accessed April 15, 2025).
22. CDC. Laboratory procedure manual: folate forms – Total & individual – serum. Available online at: https://wwwn.cdc.gov/nchs/data/nhanes/public/2011/labmethods/folfms_g_met.pdf (Accessed April 15, 2025).
23. Hu, P, Pan, C, Su, W, Vinturache, A, Hu, Y, Dong, X, et al. Associations between exposure to a mixture of phenols, parabens, and phthalates and sex steroid hormones in children 6–19 years from NHANES, 2013–2016. Sci Total Environ. (2022) 822:153548. doi: 10.1016/j.scitotenv.2022.153548
24. Barr, DB, Wilder, LC, Caudill, SP, Gonzalez, AJ, Needham, LL, and Pirkle, JL. Urinary creatinine concentrations in the U.S. population: implications for urinary biologic monitoring measurements. Environ Health Perspect. (2005) 113:192–200. doi: 10.1289/ehp.7337
25. Ogden, CL, Carroll, MD, Kit, BK, and Flegal, KM. Prevalence of childhood and adult obesity in the United States, 2011-2012. JAMA. (2014) 311:806–14. doi: 10.1001/jama.2014.732
26. Shams-White, MM, Pannucci, TE, Lerman, JL, Herrick, KA, Zimmer, M, Meyers Mathieu, K, et al. Healthy eating Index-2020: review and update process to reflect the dietary guidelines for Americans, 2020-2025. J Acad Nutr Diet. (2023) 123:1280–8. doi: 10.1016/j.jand.2023.05.015
27. Barrera-Gómez, J, and Basagaña, X. Models with transformed variables: interpretation and software. Epidemiology. (2015) 26:e16–7. doi: 10.1097/EDE.0000000000000247
28. Tan, Y, Fu, Y, Yao, H, Wu, X, Yang, Z, Zeng, H, et al. Relationship between phthalates exposures and hyperuricemia in US general population, a multi-cycle study of NHANES 2007–2016. Sci Total Environ. (2023) 859:160208. doi: 10.1016/j.scitotenv.2022.160208
29. Zhang, Y, Mustieles, V, Wang, YX, Sun, Y, Agudelo, J, Bibi, Z, et al. Folate concentrations and serum perfluoroalkyl and polyfluoroalkyl substance concentrations in adolescents and adults in the USA (National Health and nutrition examination study 2003-16): an observational study. Lancet Planet Health. (2023) 7:E449–58. doi: 10.1016/S2542-5196(23)00088-8
30. Levey, AS, Stevens, LA, Schmid, CH, Zhang, YL, Castro, AF 3rd, Feldman, HI, et al. A new equation to estimate glomerular filtration rate. Ann Intern Med. (2009) 150:604–12. doi: 10.7326/0003-4819-150-9-200905050-00006
31. Yu, L, Yang, M, Cheng, M, Fan, L, Wang, X, Xu, T, et al. Associations between urinary phthalate metabolite concentrations and markers of liver injury in the US adult population. Environ Int. (2021) 155:106608. doi: 10.1016/j.envint.2021.106608
32. Philips, EM, Jaddoe, VW, Asimakopoulos, AG, Kannan, K, Steegers, EA, Santos, S, et al. Bisphenol and phthalate concentrations and its determinants among pregnant women in a population-based cohort in the Netherlands, 2004–5. Environ Res. (2018) 161:562–72. doi: 10.1016/j.envres.2017.11.051
33. Correia-Sa, L, Kasper-Sonnenberg, M, Palmke, C, Schutze, A, Norberto, S, Calhau, C, et al. Obesity or diet? Levels and determinants of phthalate body burden – a case study on Portuguese children. Int J Hyg Environ Health. (2018) 221:519–30. doi: 10.1016/j.ijheh.2018.02.001
34. Trasande, L, Sathyanarayana, S, Jo Messito, M, Gross, R, Attina, TM, and Mendelsohn, AL. Phthalates and the diets of U.S. children and adolescents. Environ Res. (2013) 126:84–90. doi: 10.1016/j.envres.2013.07.007
35. Bailey, LB, Stover, PJ, McNulty, H, Fenech, MF, Gregory, JF 3rd, Mills, JL, et al. Biomarkers of nutrition for development-folate review. J Nutr. (2015) 145:1636S–80S. doi: 10.3945/jn.114.206599
36. Mascari, M, Reeves, K, Balasubramanian, R, Liu, Z, Laouali, N, and Oulhote, Y. Associations of environmental pollutant mixtures and red blood cell folate concentrations: a mixture analysis of the U.S. adult population based on NHANES data, 2007-2016. Toxics. (2025) 13:200. doi: 10.3390/toxics13030200
37. He, X, Xue, Q, Li, D, Zhang, S, Wu, N, Li, S, et al. Association between biomarkers of phthalate exposure and serum folate concentrations in children: a population-based cross-sectional study of the NHANES from 2011 to 2016. J Nutr. (2024) 154:1596–603. doi: 10.1016/j.tjnut.2024.03.008
38. Nguyen, B, Weiss, P, Beydoun, H, and Kancherla, V. Association between blood folate concentrations and depression in reproductive aged U.S. women, NHANES (2011–2012). J Affect Disord. (2017) 223:209–17. doi: 10.1016/j.jad.2017.07.019
39. Hayashi, Y, Ito, Y, Yanagiba, Y, Kamijima, M, Naito, H, and Nakajima, T. Differences in metabolite burden of di(2-ethylhexyl) phthalate in pregnant and postpartum dams and their offspring in relation to drug-metabolizing enzymes in mice. Arch Toxicol. (2012) 86:563–9. doi: 10.1007/s00204-011-0790-2
40. Yang, X, Huang, YF, Sun, CH, and Li, J. Maternal prenatal folic acid supplementation programs offspring lipid metabolism by aberrant DNA methylation in hepatic ATGL and adipose LPL in rats. Nutrients. (2017) 9:935. doi: 10.3390/nu9090935
41. Jadhao, M, Tsai, E-M, Yang, H-C, Chen, Y-F, Liang, S-S, Wang, T-N, et al. The long-term DEHP exposure confers multidrug resistance of triple-negative breast cancer cells through ABC transporters and intracellular ROS. Antioxidants. (2021) 10:949. doi: 10.3390/antiox10060949
42. Tastet, V, Le Vée, M, Bruyère, A, and Fardel, O. Interactions of human drug transporters with chemical additives present in plastics: potential consequences for toxicokinetics and health. Environ Pollut. (2023) 331:121882. doi: 10.1016/j.envpol.2023.121882
43. Zhang, Q, Zhang, X, Zhu, Y, Sun, P, Zhang, L, Ma, J, et al. Recognition of cyclic dinucleotides and folates by human SLC19A1. Nature. (2022) 612:170–6. doi: 10.1038/s41586-022-05452-z
44. Zhao, R, Diop-Bove, N, Visentin, M, and Goldman, ID. Mechanisms of membrane transport of folates into cells and across epithelia. Annu Rev Nutr. (2011) 31:177–201. doi: 10.1146/annurev-nutr-072610-145133
45. Popovic, M, Zaja, R, Fent, K, and Smital, T. Interaction of environmental contaminants with zebrafish organic anion transporting polypeptide, Oatp1d1 (Slcold1). Toxicol Appl Pharm. (2014) 280:149–58. doi: 10.1016/j.taap.2014.07.015
46. Takeuchi, A, Masuda, S, Saito, H, Abe, T, and Inui, K. Multispecific substrate recognition of kidney-specific organic anion transporters OAT-K1 and OAT-K2. J Pharmacol Exp Ther. (2001) 299:261–7. doi: 10.1016/S0022-3565(24)29326-5
47. Sheng, N, Wang, J, Xing, F, Duan, X, and Xiang, Z. Associations between exposure to phthalates and rheumatoid arthritis risk among adults in NHANES, 2007-2016. Chemosphere. (2023) 338:139472. doi: 10.1016/j.chemosphere.2023.139472
Keywords: phthalates, folic acid, exposure, NHANES, biomarkers
Citation: Huang X, Zhang H, Luo Y, Yang C, Huang J, Zhou T, Qi J, Li J, Zhu S, Zhang Y, Zhang L and Sun X (2025) Association between serum and red blood cell folate concentrations and urinary phthalate metabolite concentrations in US adults: evidence from a large population-based study. Front. Nutr. 12:1542952. doi: 10.3389/fnut.2025.1542952
Edited by:
Roland Eghoghosoa Akhigbe, Ladoke Akintola University of Technology, NigeriaReviewed by:
Chih-Fu Wei, National Taiwan University Hospital Yunlin Branch, TaiwanChongfei Jiang, The University of Hong Kong, China
Copyright © 2025 Huang, Zhang, Luo, Yang, Huang, Zhou, Qi, Li, Zhu, Zhang, Zhang and Sun. This is an open-access article distributed under the terms of the Creative Commons Attribution License (CC BY). The use, distribution or reproduction in other forums is permitted, provided the original author(s) and the copyright owner(s) are credited and that the original publication in this journal is cited, in accordance with accepted academic practice. No use, distribution or reproduction is permitted which does not comply with these terms.
*Correspondence: Xiaojie Sun, c3VueGlhb2ppZUB3dXN0LmVkdS5jbg==; Ling Zhang, emhhbmdsaW5nQHd1c3QuZWR1LmNu