 Xin Hou†
 Zhenghao Zhu†Xinmin Chen†Yanhui Li†Guofeng Feng†Xiangjie ZhouZheng GongYang YangXiaohong Zhang*
- Department of Cardiology, The Third Affiliated Hospital of Anhui Medical University, Hefei, Anhui, China
Background and aims: The non-high-density lipoprotein cholesterol to high-density lipoprotein cholesterol ratio (NHHR) is an innovative composite lipid measure. This study aims to examine the correlation between NHHR and hyperuricemia in the middle-aged and elderly demographic in China.
Methods: This investigation comprised 4,639 individuals who were devoid of hyperuricemia at baseline in 2011, utilizing data from the China Health and Retirement Longitudinal Study (CHARLS). We utilized multivariable logistic regression, restricted cubic spline (RCS) analysis, and subgroup analysis to investigate the relationship between NHHR and hyperuricemia.
Results: A total of 499 participants (10.76%) experienced hyperuricemia at the 4-year follow-up. The incidence of hyperuricemia was 176% higher for participants in the highest quartile of NHHR than for those in the lowest quartile (OR 2.76, 95% CI 2.10–3.62, p < 0.001). The risk of hyperuricemia was 64% higher in the highest quartile of NHHR than in the lowest quartile in a fully adjusted model (OR 1.64, 95% CI 1.16–2.31, p = 0.005). The risk of hyperuricemia and NHHR had a linearly positive connection, according to restricted cubic spline (RCS) analysis (P for non-linearity > 0.05). Subgroup analysis showed that among women, non-smokers, and those over 60, the relationship between NHHR and hyperuricemia was more significant.
Conclusion: NHHR and hyperuricemia have a substantial linear positive connection, indicating that NHHR might be used as a tool for assessing hyperuricemia risk and offering valuable information for both prevention and therapy.
Background
Hyperuricemia is a metabolic condition resulting from disruptions in purine metabolism, marked by increased plasma uric acid levels that are beyond normal thresholds. In recent years, the global prevalence of hyperuricemia has increased (1), progressively becoming a significant public health concern worldwide (1–3). The incidence of hyperuricemia in China is rising annually. In 2018–2019, the estimated prevalence of hyperuricemia among Chinese adults was 14.0%, with notable increasing trends seen between 2015–2016 and 2018–2019 (4). Hyperuricemia has emerged as the second most common metabolic condition following diabetes (5). Hyperuricemia is intricately associated with the pathogenesis of gout (6). Elevated uric acid levels serve as an early predictor and major cause of gout, while also representing important risk factors for hypertension, coronary heart disease, stroke, diabetes, chronic renal disease, and heightened mortality rates (7–11).
The cholesterol content of the majority of atherogenic lipoproteins, including low-density lipoprotein cholesterol (LDL-C), lipoprotein(a), intermediate-density lipoprotein, and remnants of very-low-density lipoprotein (VLDL) (12, 13), is represented by non-HDL-C, which is computed by deducting high-density lipoprotein cholesterol (HDL-C) from total cholesterol (14). On the other hand, HDL-C, which can help prevent atherosclerosis, is made up of the densest and smallest lipoprotein particles (15). A novel composite indicator for lipid evaluation, NHHR includes a variety of lipid particles that either promote or inhibit atherosclerosis. According to recent research, NHHR is very useful for determining the risk and prognosis of atherosclerosis and cardiovascular disease (16–18). However, it is also useful in assessing the risk of metabolic syndromes, including sarcopenia (19), diabetes mellitus (20), hypertension (21), diabetic kidney disease (22), and non-alcoholic fatty liver disease (23).
Hyperuricemia is a common metabolic condition in which uric acid acts as both an indicator of metabolic dysregulation and a facilitator of these disturbances (24). Dysregulation of lipid metabolism can modify the body’s metabolic processes and influence illness progression in individuals with hyperuricemia (25, 26). At present, only a few studies have evaluated the correlation between NHHR and the risk of hyperuricemia (27, 28). Nonetheless, these researches predominantly concentrated on populations in the United States, leaving the potential association ambiguous within the Chinese community. This study aims to investigate the potential correlation between NHHR and hyperuricemia utilizing the CHARLS database.
Materials and methods
Study population
This research constitutes a secondary analysis utilizing data from the China Health and Retirement Longitudinal Study (CHARLS). CHARLS1 is an extensive national cohort study designed to evaluate the economic, social, and health conditions of the population (29). The CHARLS cohort was formed by a multi-stage probability sampling method, with the baseline survey including 12,115 individuals aged 45 and above, drawn from 450 localities across 150 counties in 28 provinces between June 2011 and March 2012. The study design and cohort profile have been detailed in prior publications (29). The research obtained ethical clearance from the Biomedical Ethics Review Committee at Peking University, Beijing, China (IRB00001052-11015). All study participants furnished signed consent before enrollment. The dataset pertinent to this analysis is freely available on the CHARLS project website (29).
Our research employed data from the CHARLS survey carried out between 2011 and 2015. The initial survey (2011–2012) served as the baseline, and people devoid of hyperuricemia were incorporated into the study. The follow-up occurred in 2015–2016. Participants with incomplete serum uric acid data at baseline and those lacking serum uric acid data at follow-up were excluded from the trial (a comprehensive summary of the recruitment process is illustrated in Figure 1). A total of 4,639 patients were incorporated into this study and categorized according to the development of hyperuricemia after 4 years.
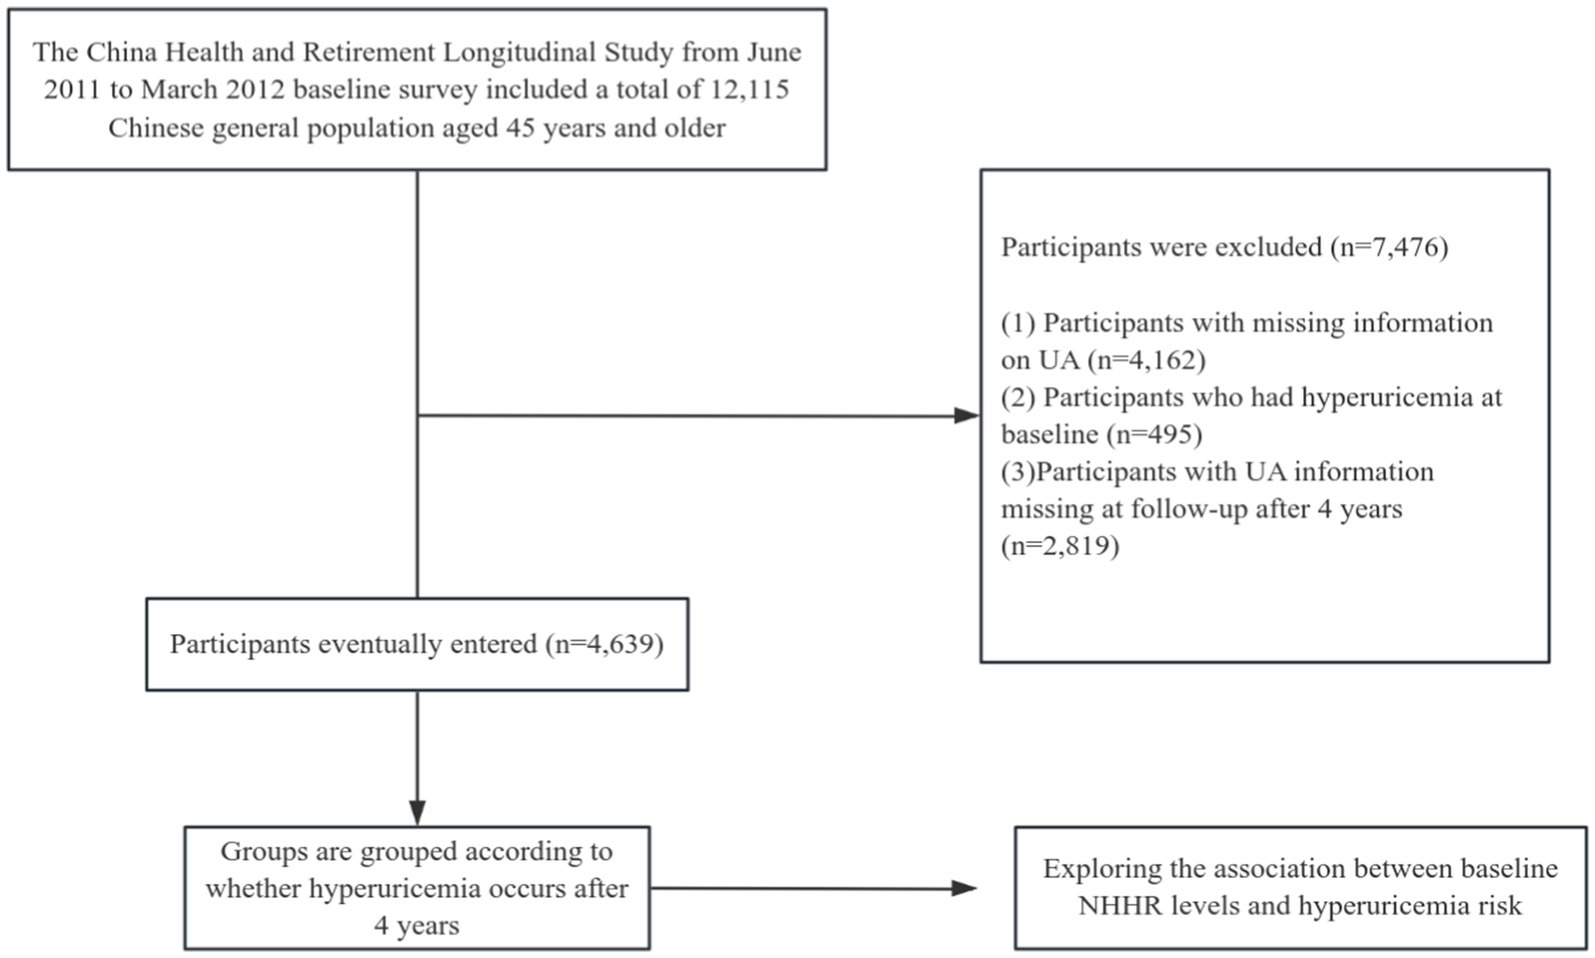
Figure 1. Flow chart of the study.
Exposure and outcome definitions
Participants underwent overnight fasting before blood sample collection. The specimen was promptly frozen at −20 degrees Celsius and conveyed to the Chinese Center for Disease Control and Prevention in Beijing for analysis within a fortnight (30). Total cholesterol (TC) and HDL-C were quantified by skilled medical professionals utilizing enzymatic colorimetry. This study estimated non-HDL-C by subtracting HDL-C from total cholesterol (TC) (31, 32), and NHHR was derived as the ratio of non-HDL-C to HDL-C. Hyperuricemia is characterized by serum uric acid (SUA) concentrations of ≥7 mg/dL in males and ≥6 mg/dL in females (33).
Covariates
Based on previous research and clinical expertise (34), this study considered various potential covariates, including age, gender, marital status, residence, education level, smoking status, drinking status, and self-reported chronic diseases [hypertension, diabetes mellitus (DM), heart disease]. Physical and chemical indicators included waist circumference (WC), body mass index [BMI = weight (kg)/height (m)2], systolic blood pressure (SBP), diastolic blood pressure (DBP), fasting plasma glucose (FPG), hemoglobin A1c (HbA1c), blood urea nitrogen (BUN), serum creatinine (Scr), cystatin C, triglycerides (TG), total cholesterol (TC), high-density lipoprotein cholesterol (HDL-C), low-density lipoprotein cholesterol (LDL-C), and the triglyceride-glucose (TyG) index (ln[FPG (mg/dL) × TG (mg/dL)/2]).
Statistical analysis
Statistical analyses were performed utilizing SPSS software version 26.0 and R language software version 3.4.3. Statistical significance was established with a p value of less than 0.05 (two-tailed). This study experienced missing data, including age (3, 0.06%), marital status (3, 0.06%), residence (7, 0.15%), education level (9, 0.19%), smoking status (54, 1.16%), drinking status (3, 0.06%), hypertension (35, 0.75%), DM (58, 1.25%), heart disease (51, 1.10%), WC (609, 13.13%), BMI (637, 13.73%), SBP (621, 13.39%), DBP (621, 13.39%), FPG (1, 0.02%), HBA1c (35, 0.75%), Scr (3, 0.06%), cystatin C (1,148, 24.75%), TG (1, 0.02%), TC (1, 0.02%), LDL-C (8, 0.17%), and TyG index (1, 0.02%). The missing data analysis process assumed missing at random (MAR), and we created five imputed datasets, combining results using the multiple imputation method with chained equations and Markov Chain Monte Carlo (35, 36).
Participants were grouped based on whether hyperuricemia occurred at the 4-year follow-up, and baseline characteristics of individuals in the two groups were compared. Continuous variables are presented as mean ± standard deviation (SD), while categorical variables are described using percentages and frequencies. The differences between the two groups for categorical variables were compared using the χ2 test, and for continuous variables, the t-test was used.
Logistic regression analysis was utilized to investigate the relationship between NHHR and the occurrence of hyperuricemia. The variance inflation factor was further applied to detect multicollinearity in regression analyses. Four models were established sequentially: Model 1 did not adjust for any covariates, Model 2 adjusted for age (continuous) and gender, Model 3 adjusted for age, gender, marital status, residence, education level, smoking status, drinking status, self-reported chronic diseases (hypertension, DM, heart disease), WC, and BMI. Model 4 further adjusted for HbA1c, BUN, Scr, cystatin C, and the TyG index. To visualize the non-linear relationship between NHHR and hyperuricemia, we used restricted cubic spline (RCS) analysis, while considering the covariates from the aforementioned Model 4. The RCS model with three knots positioned at the 10th, 50th, and 90th percentiles was selected based on its minimal BIC value. Receiver operating characteristic (ROC) curve analysis was employed to evaluate the efficacy of NHHR, non-HDL-C, and TyG index in assessing the risk of hyperuricemia. Additionally, we conducted exploratory subgroup analyses to identify any statistically significant differences across subgroups, including age (<60 or ≥60 years), gender, marital status, residence, smoking status, alcohol consumption status, as well as history of hypertension, diabetes mellitus (DM), and heart disease.
Results
Baseline characteristics of participants
A total of 4,639 participants were analyzed and completed follow-up, comprising 2,101 males (45.29%) and 2,538 females (54.71%). The average age was 58.35 (9.10) years (Table 1). Compared to the non-hyperuricemia group, the hyperuricemia group was older and had a higher proportion of males, as well as more individuals with hypertension and heart disease (p < 0.05). Additionally, individuals in the hyperuricemia group exhibited elevated levels of systolic blood pressure (SBP), diastolic blood pressure (DBP), waist circumference (WC), blood glucose concentration, serum creatinine concentration, cystatin C concentration, triglyceride concentration, total cholesterol concentration, non-HDL cholesterol concentration, NHHR values, and the TyG index (p < 0.05). Conversely, a decrease in the proportion of married individuals and HDL cholesterol concentration was observed (p < 0.05).
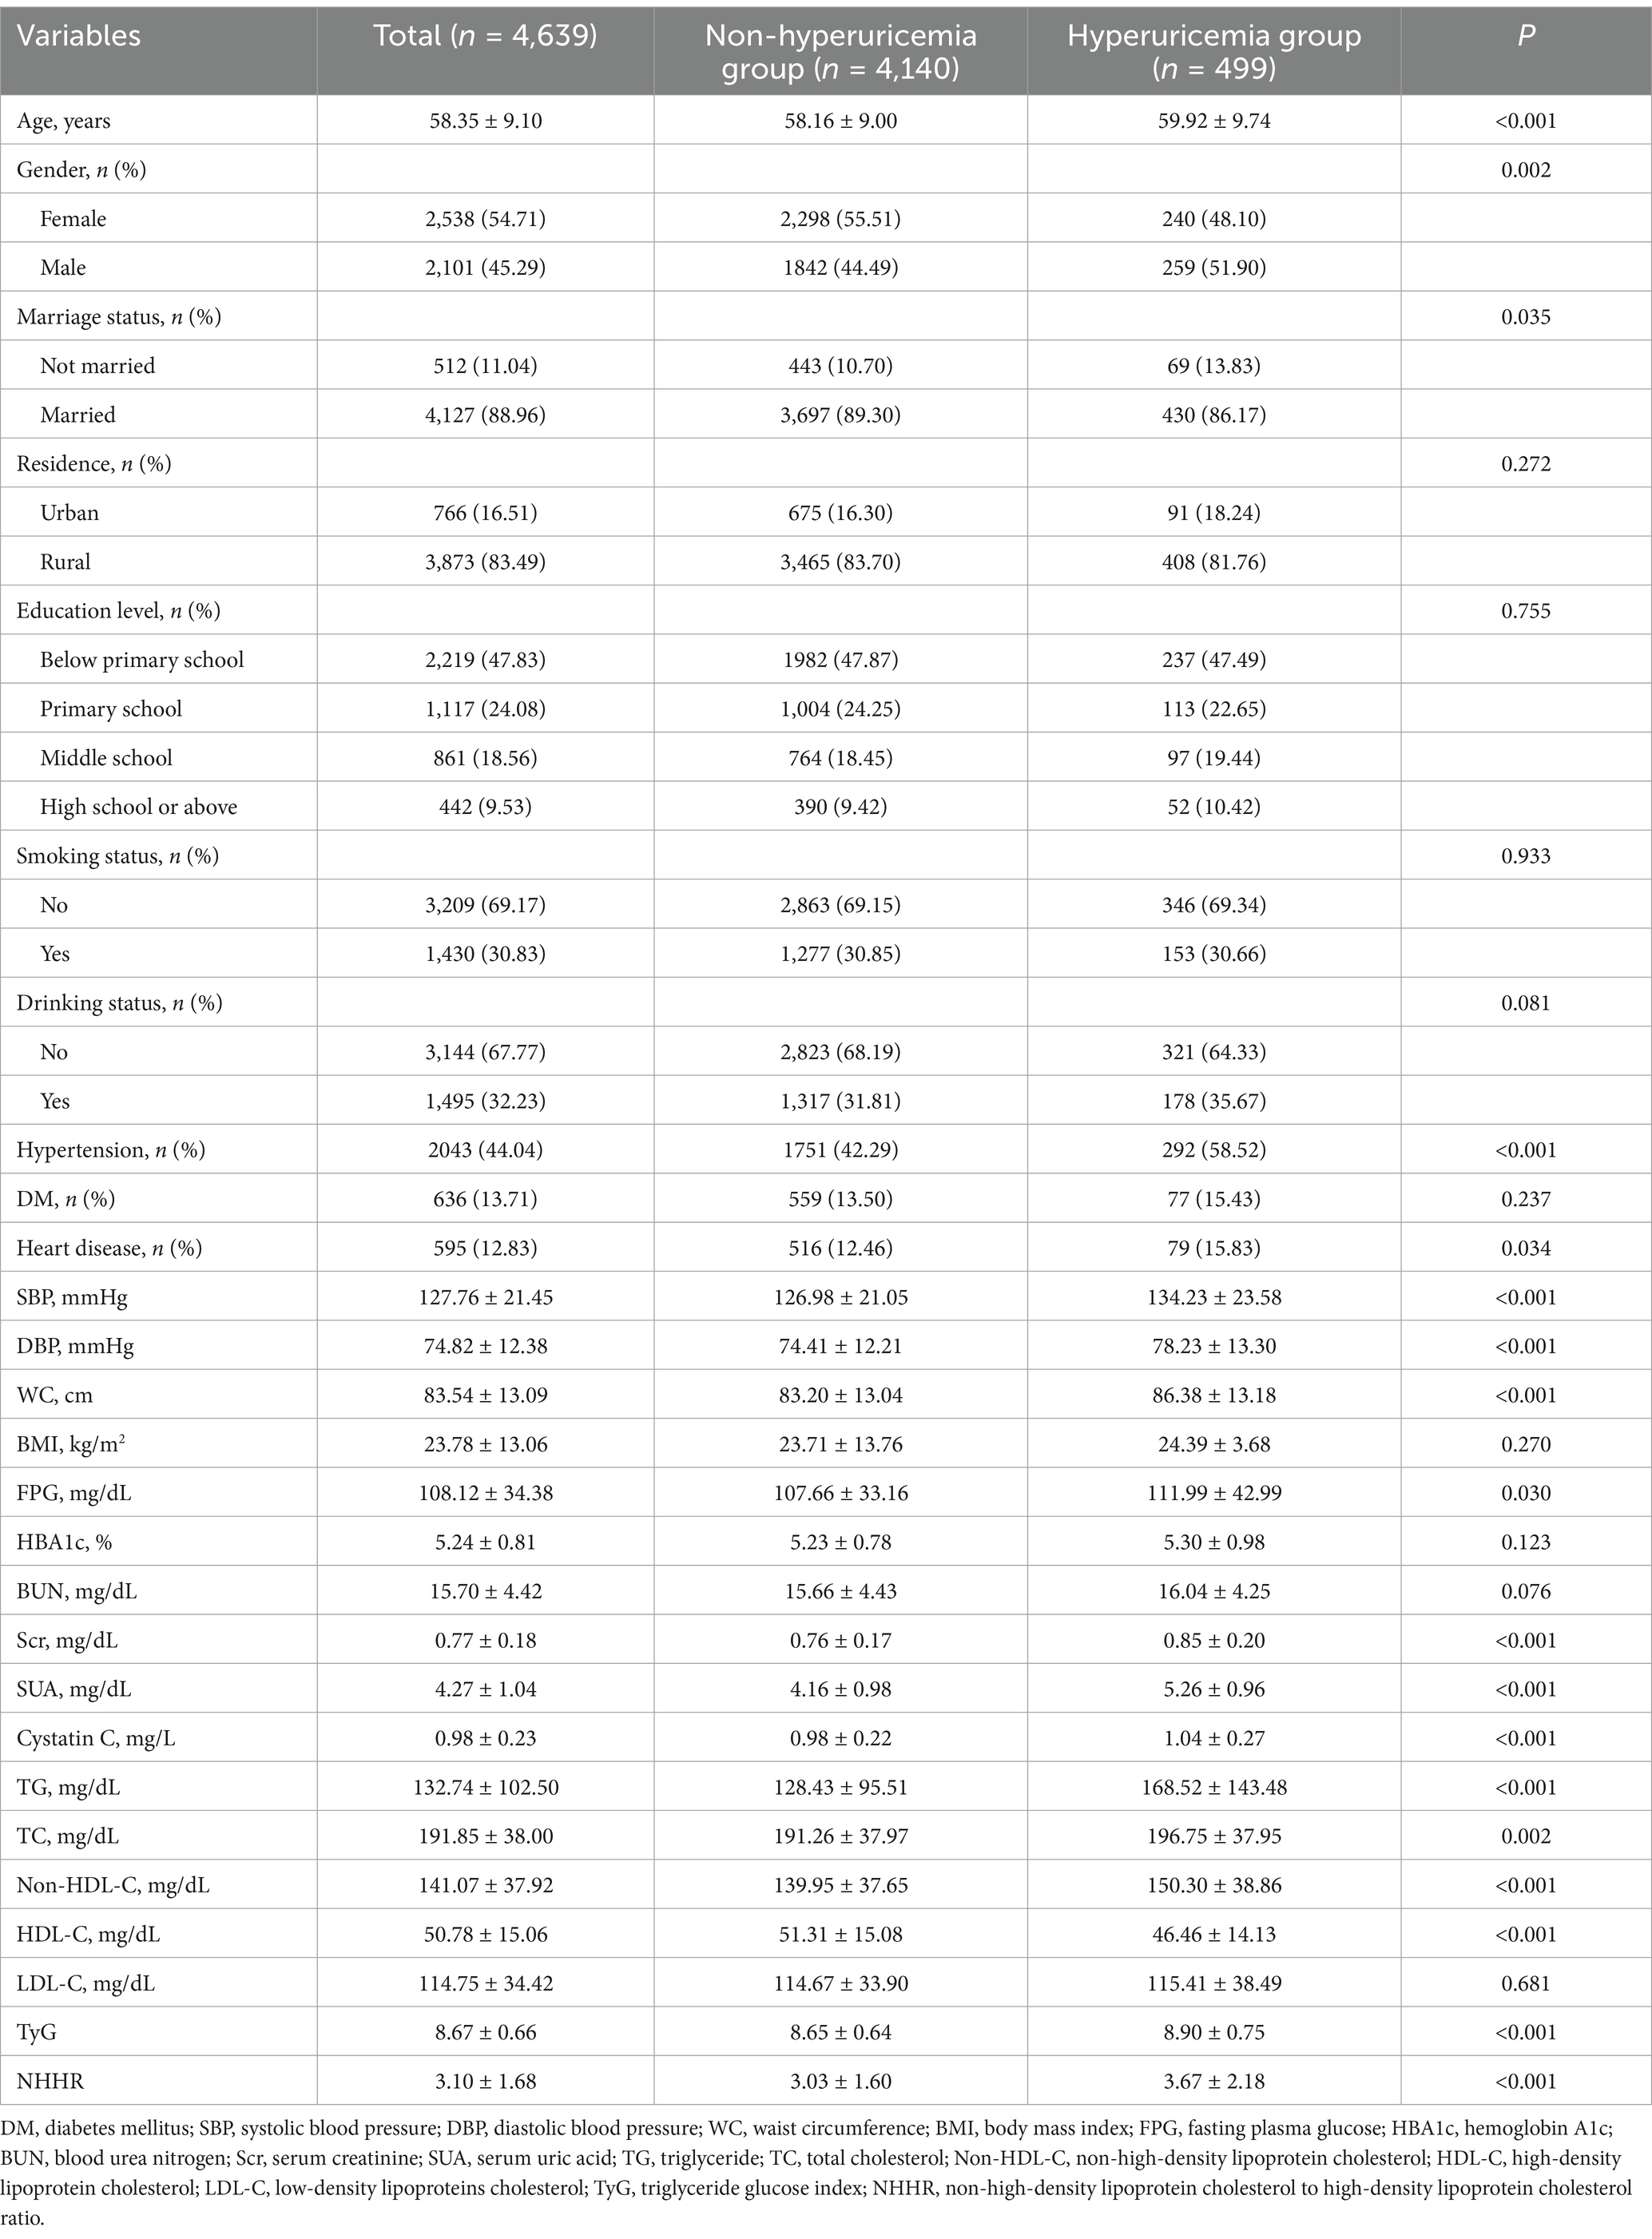
Table 1. Baseline characteristics of participants grouped according to hyperuricemia.
Association between NHHR and hyperuricemia
Table 2 indicates that 499 subjects (10.76%) exhibited hyperuricemia. Participants were categorized into four groups based on the quartiles of NHHR, with hyperuricemia incidence rates as follows: Quartile 1: 6.98%, Quartile 2: 8.54%, Quartile 3: 10.34%, and Quartile 4: 17.16%. To investigate the correlation between NHHR and the risk of hyperuricemia, we constructed four logistic regression models, as outlined in Table 2. In Model 1, participants in the highest NHHR quartile exhibited a 176% greater risk of hyperuricemia compared to those in the lowest quartile (OR 2.76, 95% CI 2.10–3.62, p < 0.001). In the fully adjusted model (Model 4), participants in the highest NHHR quartile exhibited a 64% greater risk of hyperuricemia compared to those in the lowest quartile (OR 1.64, 95% CI 1.16–2.31, p = 0.005).
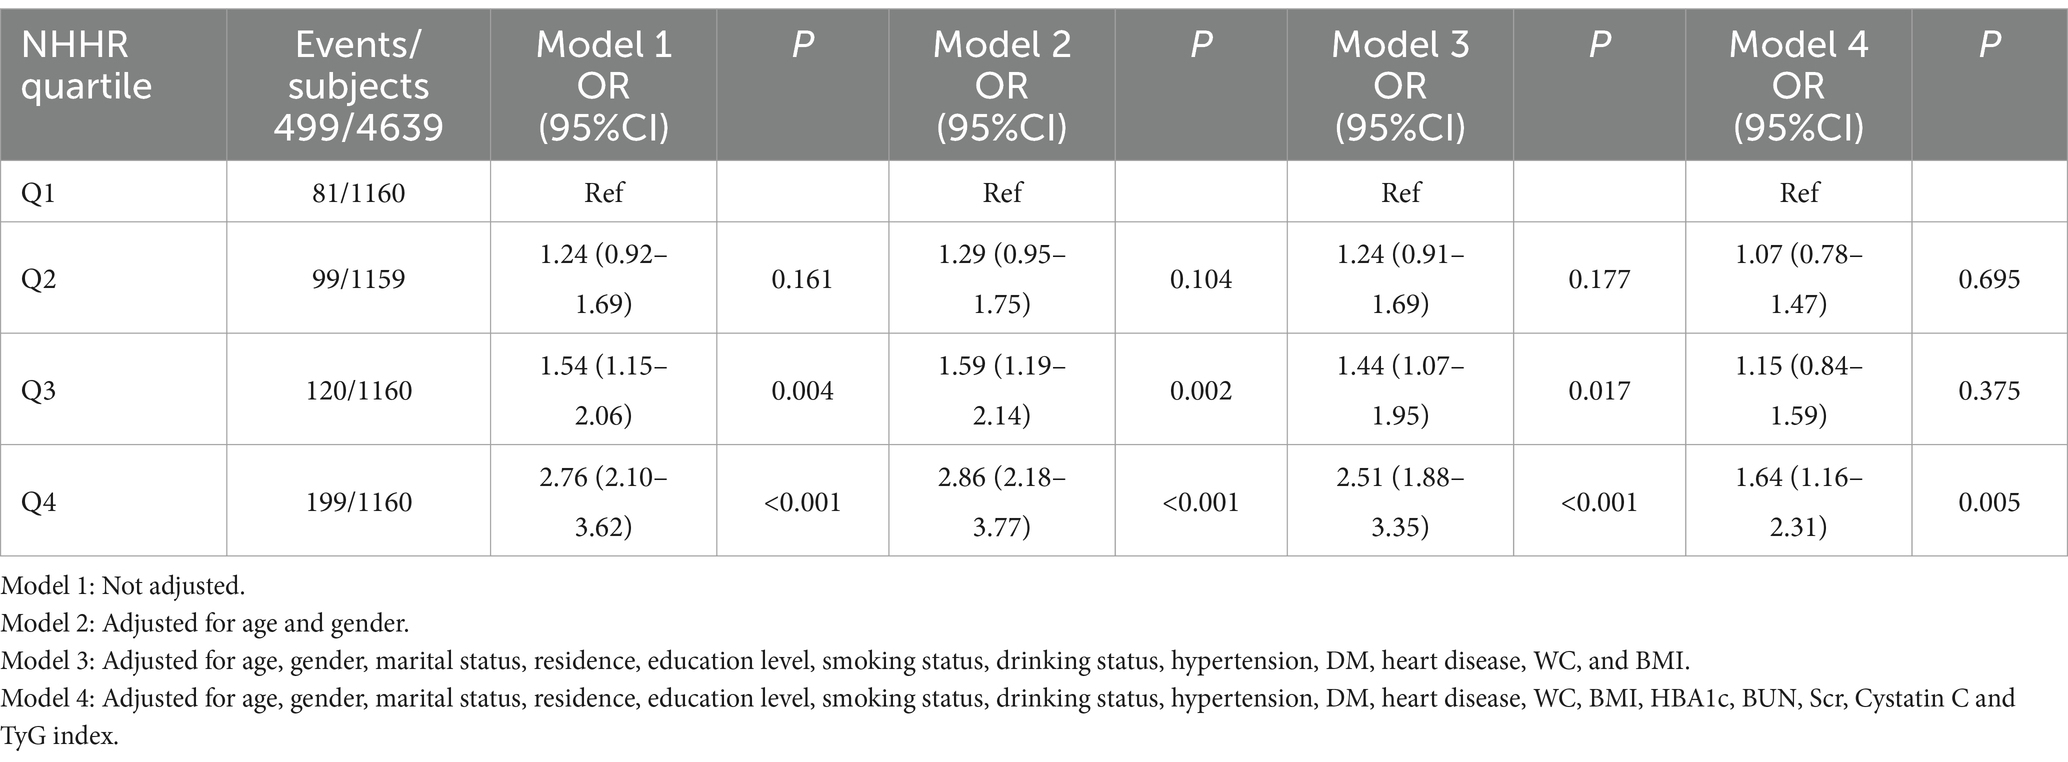
Table 2. Correlation between NHHR and the risk of hyperuricemia in different models.
The restricted cubic spline (RCS) analysis showed a linear relationship between NHHR and the risk of hyperuricemia after taking into account the same variables as in Model 4 (Figure 2, P for non-linearity > 0.05). There was no discernible threshold or saturation relationship; the risk of hyperuricemia rose by 7% for every standard deviation increase in NHHR (OR 1.07, 95% CI 1.00–1.15, p = 0.058). Additionally, according to the results of the ROC curve, the area under the curve (AUC) for the TyG index, non-HDL-C, and NHHR was 0.608, 0.583, and 0.613, respectively (Figure 3).
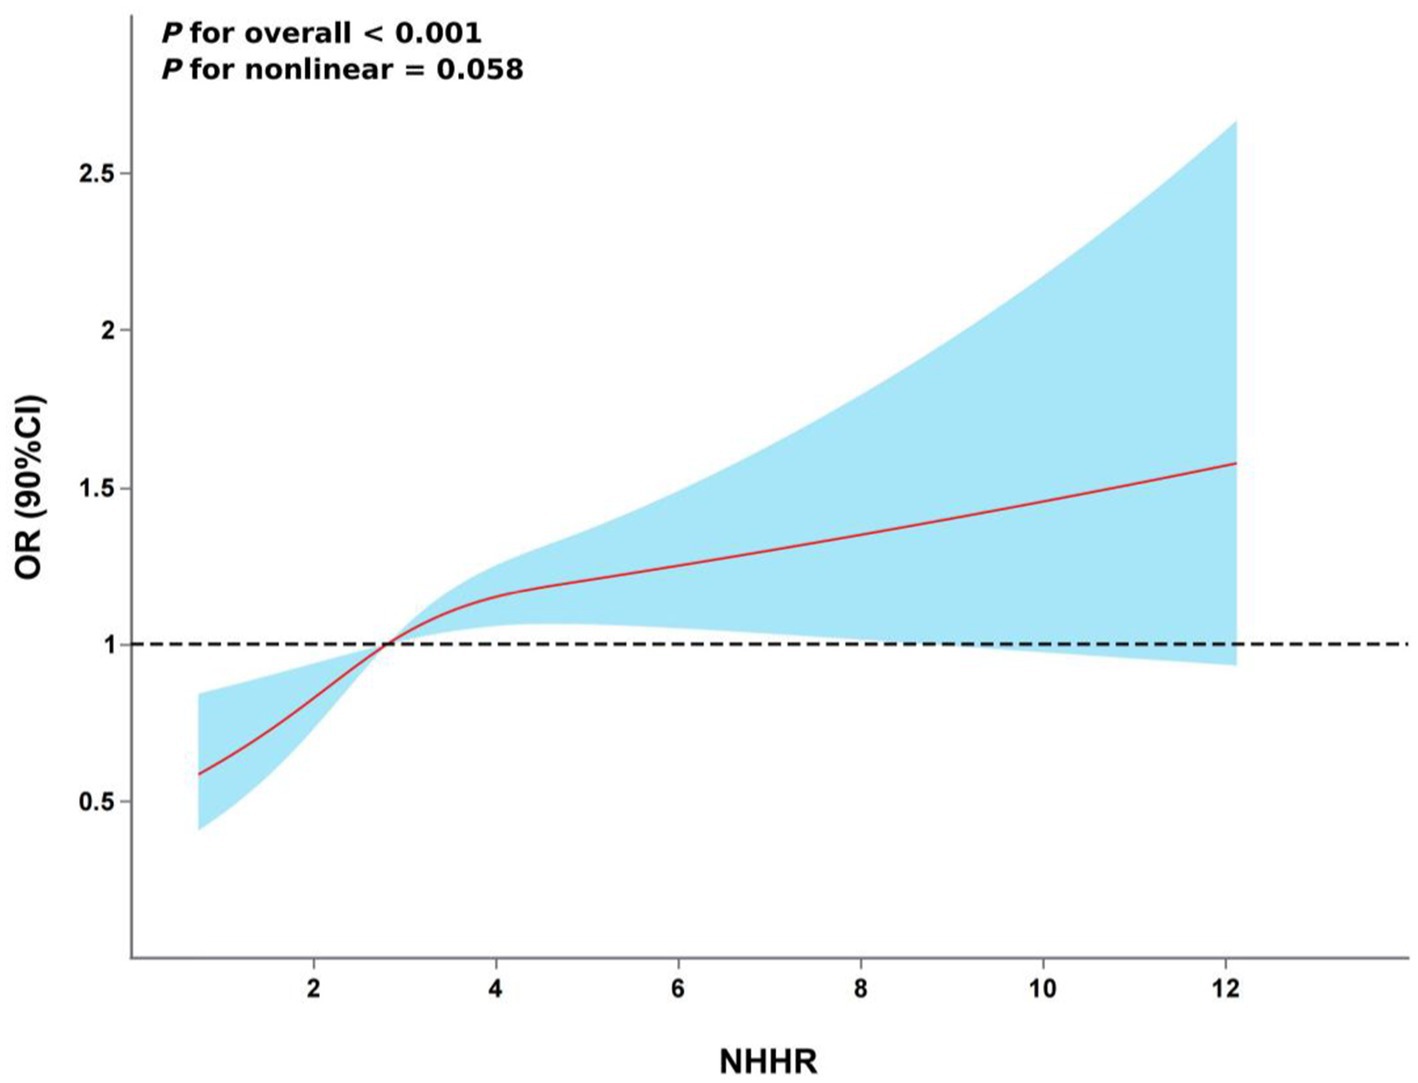
Figure 2. The association between NHHR and hyperuricemia risk. The model was adjusted for age, gender, marital status, residence, education level, smoking status, drinking status, hypertension, DM, heart disease, WC, BMI, HBA1c, BUN, Scr, Cystatin C and TyG index.

Figure 3. ROC curve.
Subgroup analysis
A exploratory subgroup analysis was performed to evaluate the consistency of the association between NHHR and hyperuricemia across various demographics (refer to Figure 4). We analyzed the interactions based on age (<60 years, >=60 years), gender, marital status, residence, smoking, and drinking status, as well as the history of hypertension, DM, and heart disease. The findings demonstrated that the correlation between NHHR and hyperuricemia in middle-aged and elderly adults in China was unaffected by marital status, residence, drinking status, or the history of hypertension, DM, and heart disease (interaction p > 0.05). We noted a significant interaction between NHHR and hyperuricemia across age, gender, and smoking status subgroups (p < 0.05), revealing a greater prevalence of hyperuricemia in adults aged over 60, females, and non-smokers.
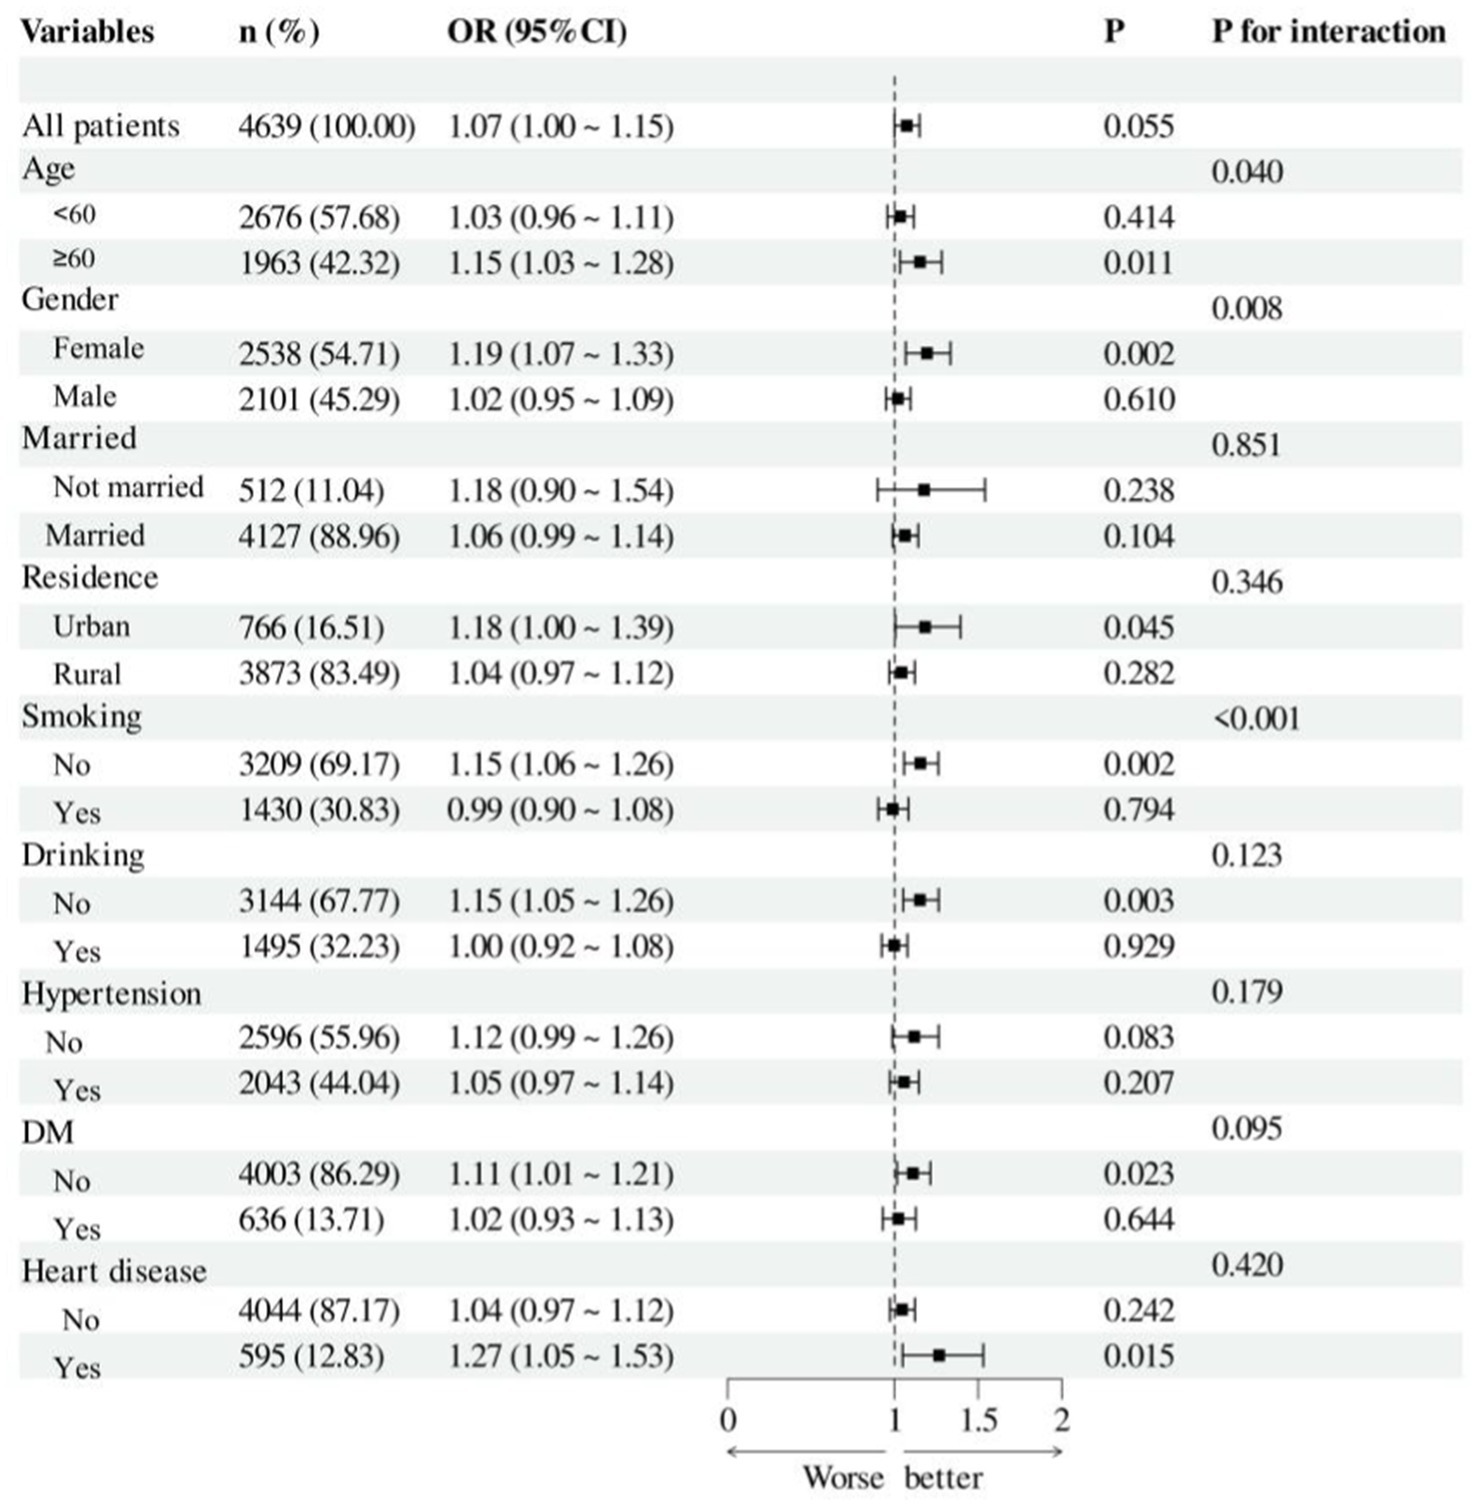
Figure 4. Forest plot of hyperuricemia risk according to different subgroups. The analysis with adjustment for age, gender, marital status, residence, education level, smoking status, drinking status, hypertension, DM, heart disease, WC, BMI, HBA1c, BUN, Scr, Cystatin C and TyG. In each case, the model is not adjusted for the stratification variable.
Discussion
This study utilized data from CHARLS 2011–2015, comprising 4,639 participants, to examine the potential correlation between NHHR and hyperuricemia. The findings demonstrated a favorable connection between NHHR and the incidence of hyperuricemia. The restricted cubic spline (RCS) analysis results indicated a linear positive connection between NHHR and hyperuricemia. The subgroup analysis indicated significant interactions among age, gender, and smoking status with NHHR levels, influencing the probability of hyperuricemia prevalence.
NHHR, a recently established lipid index, is largely utilized to evaluate atherosclerosis and is widely considered a significant marker of cardiovascular risk (16). It offers detailed information regarding both detrimental and beneficial lipid particles linked to atherosclerosis, potentially indicating the equilibrium between these two categories of lipoproteins (37). Research in metabolic diseases has demonstrated that NHHR has superior prediction powers for metabolic syndrome and insulin resistance (IR) (37, 38). Recent studies have demonstrated a strong correlation between NHHR and the prevalence of several metabolic disorders, including hypertension (21), DM (20), diabetic kidney disease (22), non-alcoholic fatty liver disease (23), sarcopenia (19), and hyperuricemia (28, 34). The association between uric acid and metabolic syndrome is intricate and reciprocal; increased uric acid levels are both a result of metabolic syndrome and a factor that can worsen its elements, including insulin resistance, obesity, and dyslipidemia. Conversely, insulin resistance enhances the renal reabsorption of uric acid, hence elevating uric acid concentrations (24). A growing body of research suggests that lipid metabolism plays a critical role in the emergence of hyperuricemia. Higher total cholesterol levels were found to be a risk factor for hyperuricemia, and a study carried out in northwest China revealed that dyslipidemia raises the prevalence of hyperuricemia (39). Higher triglyceride to HDL-C ratios were positively correlated with the prevalence of hyperuricemia, according to a four-year, large-scale cohort study conducted in China with 15,198 individuals by Liu et al. (40). Non-HDL-C was found to be the lipid index most substantially linked with hyperuricemia in prior studies conducted on middle-aged and older populations in China (32). Furthermore, research on additional markers of lipid metabolism, including residual cholesterol, the triglyceride-glucose index, and the triglyceride to HDL-C ratio, showed a linearly positive connection with hyperuricemia (41, 42). Increased NHHR may indicate a disruption in lipid metabolism in individuals, associated with the synthesis and elimination of uric acid. Nonetheless, research on the relationship between lipid ratios and the likelihood of developing hyperuricemia is sparse. Results from the National Health and Nutrition Examination Survey (NHANES) demonstrate that elevated NHHR levels correlate positively with hyperuricemia prevalence (28, 34). Our analysis utilizing the CHARLS revealed that, after adjusting for all relevant variables, individuals in the highest quartile of NHHR exhibited a 64% elevated risk of hyperuricemia relative to those in the lowest quartile (OR 1.64, 95% CI 1.16–2.31, p = 0.005). Subsequent restricted cubic spline (RCS) analysis revealed a linear positive connection between NHHR and the risk of developing hyperuricemia. Ultimately, subgroup analysis and interaction tests indicated that NHHR exhibited greater sensitivity in individuals aged over 60, females, and non-smokers. Prior cross-sectional research within the Chinese population revealed that the prevalence of hyperuricemia in males diminishes with advancing age, but females display a contrasting tendency (43). This may result from dietary practices, including the intake of high-purine meals, and lifestyle variations among middle-aged males, which may disguise the influence of NHHR, complicating the observation of this effect in subgroups. Prior research indicated a negative correlation between smoking and the prevalence of hyperuricemia among Chinese people (44, 45), aligning with our study findings.
The precise mechanism linking NHHR and hyperuricemia remains ambiguous. Potential causes encompass: (1) Increased lipid metabolism levels are strongly correlated with insulin resistance (46, 47). The lipid abnormalities associated with insulin resistance are directly linked to increased hepatic VLDL secretion, a central feature of the dyslipidemic profile characterized by elevated levels of small dense LDL particles and low HDL particle levels (48, 49). Studies indicate that HDL contributes to the maintenance of normoglycemia through both insulin-dependent and insulin-independent mechanisms (50, 51). Additionally, HDL suppresses stress-induced pancreatic β-cell death and may enhance glucose-stimulated insulin secretion, thereby contributing to its antidiabetic functions (52). Insulin resistance correlates with heightened expression of Urate transporter 1, facilitating uric acid reabsorption and impairing the activity of ATP-binding cassette sub-family G member 2, hence diminishing uric acid excretion (53), which results in raised serum uric acid concentrations. (2) Non-HDL-C constitutes a significant element of NHHR, encompassing LDL-C and residual cholesterol, both of which influence uric acid metabolism. Increased residual cholesterol amplifies the synthesis and consumption of free fatty acids, augments ATP catabolism, and elevates uric acid concentrations (54). It may also provoke insulin resistance, enhancing uric acid reabsorption in the proximal renal tubules (55). Oxidized LDL-C and lipid peroxidation cause disruptions in purine metabolism and elevate uric acid concentrations (56). (3) Reduced blood HDL-C levels might result in diminished glomerular filtration performance, consequently elevating serum uric acid levels. Reduced serum HDL-C levels are a significant contributor to atherosclerosis and a primary cause of renal artery stenosis and deteriorating glomerular filtration performance (57). Significant evidence indicates that low serum HDL-C levels correlate with the advancement of chronic renal disease (58). Additionally, HDL-C exhibits anti-inflammatory characteristics and can suppress endothelial inflammatory factors while downregulating the expression of the xanthine oxidase gene, thereby diminishing uric acid synthesis (59, 60). Reduced HDL-C levels may diminish antioxidant and anti-inflammatory properties (61). They can elicit inflammatory reactions and oxidative stress in the organism, enhance purine metabolism, and elevate uric acid synthesis (62, 63). Consequently, we can deduce that increased NHHR levels correlate with hyperuricemia.
This study has several advantages. This is the inaugural report of a linear positive connection between NHHR and hyperuricemia in the Chinese population. The data for this study are derived from the CHARLS database, which has a substantial sample size and is nationally representative. The effective management of potential confounding variables improves the reliability of the outcomes. Moreover, subgroup studies indicated that the association between NHHR and hyperuricemia is especially pronounced in those over 60 years of age, females, and non-smokers. It is important to emphasize that the subgroup analysis in this study carries the risk of multiple comparisons, which may lead to false-positive conclusions. Future research should validate these subgroup effects in independent cohorts.
However, this study is not without limitations. The cross-sectional approach hinders the discovery of definitive causal links, necessitating additional prospective investigations for confirmation. Although we accounted for numerous confounding variables, certain potential confounders remain unaccounted for. For instance, as demonstrated by Song et al. (64), a significant positive association exists between plasma aldosterone levels in hypertensive patients and the development of hyperuricemia and gout. Additional factors include the use of urate-lowering medications, lipid-lowering agents, and dietary habits characterized by excessive alcohol consumption and high-fat diets.
Conclusion
In summary, NHHR, as a comprehensive lipid index, is closely associated with the occurrence of hyperuricemia. Therefore, monitoring NHHR in clinical practice may help to better assess patients’ metabolic status and provide important references for the prevention and treatment of hyperuricemia.
Data availability statement
Publicly available datasets were analyzed in this study. This data can be found at: http://www.isss.pku.edu.cn/cfps/.
Ethics statement
The studies involving humans were approved by The Biomedical Ethics Review Committee of Peking University. The studies were conducted in accordance with the local legislation and institutional requirements. Written informed consent for participation was not required from the participants or the participants’ legal guardians/next of kin in accordance with the national legislation and institutional requirements.
Author contributions
XH: Data curation, Formal analysis, Methodology, Software, Validation, Writing – original draft. ZZ: Formal analysis, Investigation, Resources, Validation, Writing – original draft. XC: Formal analysis, Investigation, Methodology, Visualization, Writing – original draft. YL: Conceptualization, Formal analysis, Methodology, Visualization, Writing – original draft. GF: Conceptualization, Formal analysis, Methodology, Resources, Software, Writing – original draft. XZho: Formal analysis, Investigation, Writing – original draft. ZG: Funding acquisition, Project administration, Supervision, Writing – review & editing. YY: Conceptualization, Project administration, Supervision, Writing – review & editing. XZha: Conceptualization, Project administration, Resources, Supervision, Writing – review & editing.
Funding
The author(s) declare that financial support was received for the research and/or publication of this article. This study was funded by the 2022 Anhui Medical University Youth Science Fund Project “Study on the Regulation and Molecular Mechanism of Myocardial Fibrosis by Ubiquitin C-Terminal Hydrolase L1 through Nuclear Factor κB” (2022xkj106).
Acknowledgments
Data from the China Health and Retirement Longitudinal Study (CHARLS) was employed in this investigation. We would like to express our gratitude to the CHARLS research team for their hard work and dedication to the CHARLS project.
Conflict of interest
The authors declare that the research was conducted in the absence of any commercial or financial relationships that could be construed as a potential conflict of interest.
Generative AI statement
The authors declare that no Gen AI was used in the creation of this manuscript.
Publisher’s note
All claims expressed in this article are solely those of the authors and do not necessarily represent those of their affiliated organizations, or those of the publisher, the editors and the reviewers. Any product that may be evaluated in this article, or claim that may be made by its manufacturer, is not guaranteed or endorsed by the publisher.
Footnotes
References
1. Michael, C-X, Chio, Y, Sharan, KR, Michael, HP, and Hyon, KC. Contemporary prevalence of gout and hyperuricemia in the United States and decadal trends: the National Health and nutrition examination survey, 2007-2016. Arthritis Rheumatol. (2019) 71:991–9. doi: 10.1002/art.40807
2. Shu, J, Zhao, R, Xu, H, Liu, X, Guo, H, and Lu, C. Hyperuricemia is associated with metabolic syndrome: a cross-sectional analysis of the National Health and nutrition examination survey (NHANES). Prev Med Rep. (2023) 36:102520. doi: 10.1016/j.pmedr.2023.102520
3. Yin, Y, Zhou, E, and Wu, J. Association between hyperuricemia and long-term mortality in patients with hypertension: results from the NHANES 2001-2018. Front Cardiovas Med. (2024) 11:1306026. doi: 10.3389/fcvm.2024.1306026
4. Mei, Z, Xiaoxia, Z, Jing, W, Zhengjing, H, Zhenping, Z, Xiao, Z, et al. Prevalence of hyperuricemia among Chinese adults: findings from two nationally representative cross-sectional surveys in 2015-16 and 2018-19. Front Immunol. (2022) 12:1983. doi: 10.3389/fimmu.2021.791983
5. Multidisciplinary Expert Task Force on Hyperuricemia and Related Diseases. Chinese multidisciplinary expert consensus on the diagnosis and treatment of hyperuricemia and related diseases. Chin Med J. (2017) 130:2473–88. doi: 10.4103/0366-6999.216416
6. Hyon, KC, David, BM, and Anthony, MR. Pathogenesis of gout. Ann Intern Med. (2005) 143:499–516. doi: 10.7326/0003-4819-143-7-200510040-00009
7. Lippi, G, Montagnana, M, Franchini, M, Favaloro, E, and Targher, G. The paradoxical relationship between serum uric acid and cardiovascular disease. Clin Chim Acta. (2008) 392:1–7. doi: 10.1016/j.cca.2008.02.024
8. Zhu, Y, Pandya, B, and Choi, H. Comorbidities of gout and hyperuricemia in the US general population: NHANES 2007-2008. Am J Med. (2012) 125:679–87.e1. doi: 10.1016/j.amjmed.2011.09.033
9. Facchini, F, Chen, Y, Hollenbeck, C, and Reaven, G. Relationship between resistance to insulin-mediated glucose uptake, urinary uric acid clearance, and plasma uric acid concentration. JAMA. (1991) 266:3008–11. doi: 10.1001/jama.1991.03470210076036
10. Crawley, W, Jungels, C, Stenmark, K, and Fini, M. U-shaped association of uric acid to overall-cause mortality and its impact on clinical management of hyperuricemia. Redox Biol. (2022) 51:102271. doi: 10.1016/j.redox.2022.102271
11. Zheng, L, Zhu, Y, Ma, Y, Zhang, H, Zhao, H, Zhang, Y, et al. Relationship between hyperuricemia and the risk of cardiovascular events and chronic kidney disease in both the general population and hypertensive patients: a systematic review and meta-analysis. Int J Cardiol. (2024) 399:131779. doi: 10.1016/j.ijcard.2024.131779
12. Hodkinson, A, Tsimpida, D, Kontopantelis, E, Rutter, M, Mamas, M, and Panagioti, M. Comparative effectiveness of statins on non-high density lipoprotein cholesterol in people with diabetes and at risk of cardiovascular disease: systematic review and network meta-analysis. BMJ. (2022) 376:e067731. doi: 10.1136/bmj-2021-067731
13. Blaha, M, Blumenthal, R, Brinton, E, and Jacobson, T. The importance of non-HDL cholesterol reporting in lipid management. J Clin Lipidol. (2008) 2:267–73. doi: 10.1016/j.jacl.2008.06.013
14. Qi, X, Wang, S, Huang, Q, Chen, X, Qiu, L, Ouyang, K, et al. The association between non-high-density lipoprotein cholesterol to high-density lipoprotein cholesterol ratio (NHHR) and risk of depression among US adults: a cross-sectional NHANES study. J Affect Disord. (2024) 344:451–7. doi: 10.1016/j.jad.2023.10.064
15. Di Bartolo, B, Cartland, S, Genner, S, Manuneedhi Cholan, P, Vellozzi, M, Rye, K, et al. HDL improves cholesterol and glucose homeostasis and reduces atherosclerosis in diabetes-associated atherosclerosis. J Diabetes Res. (2021) 2021:1–10. doi: 10.1155/2021/6668506
16. Zhu, L, Lu, Z, Zhu, L, Ouyang, X, Yang, Y, He, W, et al. Lipoprotein ratios are better than conventional lipid parameters in predicting coronary heart disease in Chinese Han people. Kardiol Pol. (2015) 73:931–8. doi: 10.5603/KP.a2015.0086
17. Kouvari, M, Panagiotakos, D, Chrysohoou, C, Georgousopoulou, E, Tousoulis, D, and Pitsavos, A. Sex-related differences of the effect of lipoproteins and apolipoproteins on 10-year cardiovascular disease risk; insights from the ATTICA study (2002-2012). Molecules. (2020) 25:1506. doi: 10.3390/molecules25071506
18. Yu, B, Li, M, Yu, Z, Zheng, T, Feng, X, Gao, A, et al. The non-high-density lipoprotein cholesterol to high-density lipoprotein cholesterol ratio (NHHR) as a predictor of all-cause and cardiovascular mortality in US adults with diabetes or prediabetes: NHANES 1999-2018. BMC Med. (2024) 22:317. doi: 10.1186/s12916-024-03536-3
19. Yanming, M, Lingjiang, L, Renji, W, Xiaojun, Y, Yinguang, W, Ruoyu, L, et al. Association between non-high-density lipoprotein cholesterol to high-density lipoprotein cholesterol ratio and sarcopenia based on NHANES. Sci Rep. (2024) 14:30166. doi: 10.1038/s41598-024-81830-z
20. Tan, M, Weng, L, Yang, Z, Zhu, S, Wu, S, and Su, J. The association between non-high-density lipoprotein cholesterol to high-density lipoprotein cholesterol ratio with type 2 diabetes mellitus: recent findings from NHANES 2007-2018. Lipids Health Dis. (2024) 23:151. doi: 10.1186/s12944-024-02143-8
21. Wu, J, and Guo, J. Non-high-density lipoprotein cholesterol to high-density lipoprotein cholesterol ratio (NHHR) and hypertension in American adults: a NHANES cross-sectional study. Front Physiol. (2024) 15:1398793. doi: 10.3389/fphys.2024.1398793
22. Pan, J, Li, C, Zhang, J, Sun, Z, Yu, X, Wan, Q, et al. Association between non-high-density lipoprotein cholesterol to high-density lipoprotein cholesterol ratio (NHHR) and diabetic kidney disease in patients with diabetes in the United States: a cross-sectional study. Lipids Health Dis. (2024) 23:317. doi: 10.1186/s12944-024-02308-5
23. Huang, X, Li, J, Zhang, L, Zhang, C, and Li, C. The association between the non-high-density lipoprotein cholesterol to high-density lipoprotein cholesterol ratio and non-alcoholic fatty liver disease in US adults: a cross-sectional study. Sci Rep. (2024) 14:24847. doi: 10.1038/s41598-024-76002-y
24. Claudio, B, Federica, F, and Federica, P. Not all the eggs and the chickens are the same: the case of uric acid and metabolic syndrome. Eur J Intern Med. (2022) 103:36–7. doi: 10.1016/j.ejim.2022.07.006
25. Kvasnička, A, Friedecký, D, Brumarová, R, Pavlíková, M, Pavelcová, K, Mašínová, J, et al. Alterations in lipidome profiles distinguish early-onset hyperuricemia, gout, and the effect of urate-lowering treatment. Arthritis Res Ther. (2023) 25:234. doi: 10.1186/s13075-023-03204-6
26. Ma, L, Wang, J, Ma, L, Ge, Y, and Wang, X. The effect of lipid metabolism disorder on patients with hyperuricemia using multi-omics analysis. Sci Rep. (2023) 13:18211. doi: 10.1038/s41598-023-45564-8
27. Jiang, Z, Zhu, X, Zhao, D, Jiang, H, Wang, X, and Su, F. Associations between non-high-density lipoprotein cholesterol to high-density lipoprotein cholesterol ratio and hyperuricemia: a cross-sectional study. Lipids Health Dis. (2024) 23:280. doi: 10.1186/s12944-024-02269-9
28. He, R, Zhu, Q, Ye, Y, Chen, S, and Xie, C. Nonlinear association between non-high-density lipoprotein cholesterol to high-density lipoprotein cholesterol ratio and hyperuricemia in cancer patients: evidence from NHANES 2007-2018. Lipids Health Dis. (2024) 23:269. doi: 10.1186/s12944-024-02261-3
29. Zhao, Y, Hu, Y, Smith, J, Strauss, J, and Yang, G. Cohort profile: the China health and retirement longitudinal study (CHARLS). Int J Epidemiol. (2014) 43:61–8. doi: 10.1093/ije/dys203
30. Jiang, X, Zhuang, J, Juan, Y, Zheng, X, and Zhang, H. Association between remnant cholesterol and the risk of cardiovascular disease in Chinese population. J Stroke Cerebrovasc Dis. (2024) 33:107825. doi: 10.1016/j.jstrokecerebrovasdis.2024.107825
31. Hu, H, Fukunaga, A, Yokoya, T, Nakagawa, T, Honda, T, Yamamoto, S, et al. Non-high-density lipoprotein cholesterol and risk of cardiovascular disease: the Japan epidemiology collaboration on occupational health study. J Atheroscler Thromb. (2022) 29:1295–306. doi: 10.5551/jat.63118
32. Xu, J, Peng, H, Ma, Q, Zhou, X, Xu, W, Huang, L, et al. Associations of non-high density lipoprotein cholesterol and traditional blood lipid profiles with hyperuricemia among middle-aged and elderly Chinese people: a community-based cross-sectional study. Lipids Health Dis. (2014) 13:117. doi: 10.1186/1476-511X-13-117
33. Feig, D, Kang, D, and Johnson, R. Uric acid and cardiovascular risk. N Engl J Med. (2008) 359:1811–21. doi: 10.1056/NEJMra0800885
34. Wang, Z, Wu, M, Du, R, Tang, F, Xu, M, Gu, T, et al. The relationship between non-high-density lipoprotein cholesterol to high-density lipoprotein cholesterol ratio (NHHR) and hyperuricaemia. Lipids Health Dis. (2024) 23:187. doi: 10.1186/s12944-024-02171-4
35. White, I, Royston, P, and Wood, A. Multiple imputation using chained equations: issues and guidance for practice. Stat Med. (2011) 30:377–99. doi: 10.1002/sim.4067
36. Groenwold, R, White, I, Donders, A, Carpenter, J, Altman, D, and Moons, K. Missing covariate data in clinical research: when and when not to use the missing-indicator method for analysis. CMAJ. (2012) 184:1265–9. doi: 10.1503/cmaj.110977
37. Sheng, G, Liu, D, Kuang, M, Zhong, Y, Zhang, S, and Zou, Y. Utility of non-high-density lipoprotein cholesterol to high-density lipoprotein cholesterol ratio in evaluating incident diabetes risk. Diabetes Metab Syndr Obes. (2022) 15:1677–86. doi: 10.2147/DMSO.S355980
38. Kim, S, Jee, J, Kim, H, Jin, S, Suh, S, Bae, J, et al. Non-HDL-cholesterol/HDL-cholesterol is a better predictor of metabolic syndrome and insulin resistance than apolipoprotein B/apolipoprotein A1. Int J Cardiol. (2013) 168:2678–83. doi: 10.1016/j.ijcard.2013.03.027
39. Liu, F, Du, G, Song, N, Ma, Y, Li, X, Gao, X, et al. Hyperuricemia and its association with adiposity and dyslipidemia in Northwest China: results from cardiovascular risk survey in Xinjiang (CRS 2008-2012). Lipids Health Dis. (2020) 19:58. doi: 10.1186/s12944-020-01211-z
40. Liu, X, Wu, Q, Chen, Z, Yan, G, Lu, Y, Dai, H, et al. Elevated triglyceride to high-density lipoprotein cholesterol (TG/HDL-C) ratio increased risk of hyperuricemia: a 4-year cohort study in China. Endocrine. (2020) 68:71–80. doi: 10.1007/s12020-019-02176-5
41. Zhou, X, Weng, X, Xu, J, and Wang, W. Correlation between remnant cholesterol and hyperuricemia in American adults. Lipids Health Dis. (2024) 23:176. doi: 10.1186/s12944-024-02167-0
42. Yutong, H, Zonglei, Z, Yuge, Z, Genming, Z, and Biao, X. The Association of Surrogates of insulin resistance with hyperuricemia among middle-aged and older individuals: a population-based Nationwide cohort study. Nutrients. (2023) 15:3139. doi: 10.3390/nu15143139
43. Song, J, Jin, C, Shan, Z, Teng, W, and Li, J. Prevalence and risk factors of hyperuricemia and gout: a cross-sectional survey from 31 provinces in mainland China. J Transl Int Med. (2022) 10:134–45. doi: 10.2478/jtim-2022-0031
44. Chen, H, Sheng, L, Wan, Z, Wang, X, Lin, Y, Wang, Y, et al. The relationship between smoking and hyperuricemia in Chinese residents. Zhonghua Yu Fang Yi Xue Za Zhi. (2018) 52:524–9. doi: 10.3760/cma.j.issn.0253-9624.2018.05.012
45. Yang, T, Zhang, Y, Wei, J, Zeng, C, Li, L, Xie, X, et al. Relationship between cigarette smoking and hyperuricemia in middle-aged and elderly population: a cross-sectional study. Rheumatol Int. (2017) 37:131–6. doi: 10.1007/s00296-016-3574-4
46. Iqbal, J, Al Qarni, A, Hawwari, A, Alghanem, A, and Ahmed, G. Metabolic syndrome, dyslipidemia and regulation of lipoprotein metabolism. Curr Diabetes Rev. (2018) 14:427–33. doi: 10.2174/1573399813666170705161039
47. Goodpaster, B, and Kelley, D. Skeletal muscle triglyceride: marker or mediator of obesity-induced insulin resistance in type 2 diabetes mellitus? Curr Diab Rep. (2002) 2:216–22. doi: 10.1007/s11892-002-0086-2
48. Taskinen, M. Diabetic dyslipidaemia: from basic research to clinical practice. Diabetologia. (2003) 46:733–49. doi: 10.1007/s00125-003-1111-y
49. Vergès, B. New insight into the pathophysiology of lipid abnormalities in type 2 diabetes. Diabetes Metab. (2005) 31:429–39. doi: 10.1016/S1262-3636(07)70213-6
50. von Eckardstein, A, and Sibler, R. Possible contributions of lipoproteins and cholesterol to the pathogenesis of diabetes mellitus type 2. Curr Opin Lipidol. (2011) 22:26–32. doi: 10.1097/MOL.0b013e3283412279
51. Klancic, T, Woodward, L, Hofmann, S, and Fisher, E. High density lipoprotein and metabolic disease: potential benefits of restoring its functional properties. Mol Metab. (2016) 5:321–7. doi: 10.1016/j.molmet.2016.03.001
52. Drew, B, Rye, K, Duffy, S, Barter, P, and Kingwell, B. The emerging role of HDL in glucose metabolism. Nat Rev Endocrinol. (2012) 8:237–45. doi: 10.1038/nrendo.2011.235
53. Toyoki, D, Shibata, S, Kuribayashi-Okuma, E, Xu, N, Ishizawa, K, Hosoyamada, M, et al. Insulin stimulates uric acid reabsorption via regulating urate transporter 1 and ATP-binding cassette subfamily G member 2. Am J Physiol Renal Physiol. (2017) 313:F826–34. doi: 10.1152/ajprenal.00012.2017
54. Lin, H, Xu, J, and Teng, C. Correlation between remnant cholesterol and hyperuricemia in patients with type 2 diabetes mellitus: a cross-sectional study. Lipids Health Dis. (2024) 23:155. doi: 10.1186/s12944-024-02148-3
55. Fukushima, M, Taniguchi, A, Nakai, Y, Sakai, M, Doi, K, Nin, K, et al. Remnant-like particle cholesterol and insulin resistance in nonobese nonhypertensive Japanese glucose-tolerant relatives of type 2 diabetic patients. Diabetes Care. (2001) 24:1691–4. doi: 10.2337/diacare.24.9.1691
56. Balasubramanian, T. Uric acid or 1-methyl uric acid in the urinary bladder increases serum glucose, insulin, true triglyceride, and total cholesterol levels in Wistar rats. Scientific World J. (2003) 3:930–6. doi: 10.1100/tsw.2003.90
57. Textor, S, Misra, S, and Oderich, G. Percutaneous revascularization for ischemic nephropathy: the past, present, and future. Kidney Int. (2013) 83:28–40. doi: 10.1038/ki.2012.363
58. Kawachi, K, Kataoka, H, Manabe, S, Mochizuki, T, and Nitta, K. Low HDL cholesterol as a predictor of chronic kidney disease progression: a cross-classification approach and matched cohort analysis. Heart Vessel. (2019) 34:1440–55. doi: 10.1007/s00380-019-01375-4
59. Murphy, A, Woollard, K, Hoang, A, Mukhamedova, N, Stirzaker, R, McCormick, S, et al. High-density lipoprotein reduces the human monocyte inflammatory response. Arterioscler Thromb Vasc Biol. (2008) 28:2071–7. doi: 10.1161/ATVBAHA.108.168690
60. Xie, F, Wu, Z, Feng, J, Li, K, Li, M, and Wu, Y. Association between systemic immune-inflammation index and serum uric acid in U.S. adolescents: a population-based study. Nutr Metab Cardiovasc Dis. (2024) 34:206–13. doi: 10.1016/j.numecd.2023.10.008
61. Bauer, R, Brüne, B, and Schmid, T. Cholesterol metabolism in the regulation of inflammatory responses. Front Pharmacol. (2023) 14:1121819. doi: 10.3389/fphar.2023.1121819
62. de Oliveira, E, and Burini, R. High plasma uric acid concentration: causes and consequences. Diabetol Metab Syndr. (2012) 4:12. doi: 10.1186/1758-5996-4-12
63. Yamamoto, S, Yancey, P, Ikizler, T, Jerome, W, Kaseda, R, Cox, B, et al. Dysfunctional high-density lipoprotein in patients on chronic hemodialysis. J Am Coll Cardiol. (2012) 60:2372–9. doi: 10.1016/j.jacc.2012.09.013
Keywords: non-high-density lipoprotein cholesterol to high-density lipoprotein cholesterol ratio, hyperuricemia, CHARLS, non-HDL cholesterol, HDL cholesterol
Citation: Hou X, Zhu Z, Chen X, Li Y, Feng G, Zhou X, Gong Z, Yang Y and Zhang X (2025) Association between non-high-density lipoprotein cholesterol to high-density lipoprotein cholesterol ratio (NHHR) and hyperuricemia: evidence from the CHARLS study. Front. Nutr. 12:1552184. doi: 10.3389/fnut.2025.1552184
Edited by:
Yoo Kim, Oklahoma State University, United StatesReviewed by:
Alessandro De Oliveira, Universidade Federal de São João del-Rei, BrazilXintian Cai, Sichuan Academy of Medical Sciences and Sichuan Provincial People’s Hospital, China
Ricardo Adrian Nugraha, Faculty of Medicine Universitas Airlangga - Dr. Soetomo General Hospital, Indonesia
Copyright © 2025 Hou, Zhu, Chen, Li, Feng, Zhou, Gong, Yang and Zhang. This is an open-access article distributed under the terms of the Creative Commons Attribution License (CC BY). The use, distribution or reproduction in other forums is permitted, provided the original author(s) and the copyright owner(s) are credited and that the original publication in this journal is cited, in accordance with accepted academic practice. No use, distribution or reproduction is permitted which does not comply with these terms.
*Correspondence: Xiaohong Zhang, aG91MTU4NTY3QDEyNi5jb20=
†These authors have contributed equally to this work