 Jinjian Xu
 Yingdi Yang2†
 Ye Hu
Ye Hu Xiao Ye
 Yu-ming Chen
 Xiaohong Wu
- 1Key Laboratory of Endocrine Gland Diseases of Zhejiang Province, Department of Endocrinology, Geriatric Medicine Center, Zhejiang Provincial People’s Hospital (Affiliated People’s Hospital, Hangzhou Medical College), Hangzhou, China
- 2Department of Clinical Medicine, Xinjiang Medical University, Urumqi, China
- 3Department of Epidemiology, School of Public Health, Sun Yat-sen University, Guangzhou, China
- 4Department of Pharmaceutical Sciences, Institute of Pharmacology, Zhejiang University of Technology, Hangzhou, China
Background and aims: The non-invasive Chinese visceral adiposity index (CVAI) was linked to the risk of cardiovascular disease and mortality. The associations of the CVAI and its longitudinal changes with hypertension and related comorbidities remain poorly understood. This study aims to examine the associations between CVAI, its trajectories, and hypertensive comorbidities.
Methods: This study included 5,058 participants from the China Health and Retirement Longitudinal Study (CHARLS), with baseline data collected in 2011–2012. Participants were subsequently followed across four waves: 2013–2014, 2015–2016, 2017–2018, and 2019–2020. Study outcomes included hypertension (HTN) and its comorbidities: overweight (HTN-OW), metabolic unhealthiness (HTN-MET), and diabetes (HTN-DM). Prospective associations between baseline CVAI and these outcomes were analyzed using Cox regression. Longitudinal trajectories of CVAI over 3 years (2012–2015) were identified through K-means clustering analysis.
Results: From 2013 to 2020, 1,581 participants (31.3% of the 5,058 total) developed HTN. The higher CVAI was significantly associated with risk of HTN (HR per 1 SD increase = 1.20; 95% CI: 1.08–1.33) and hypertensive co-morbidities (HTN-OW, HTN-MET, and HTN-DM) (HR = 1.20–1.38, p < 0.01). Both per-quartile increment in CVAI and cumulative CVAI showed significant positive associations with HTN risk and its comorbidities (all p-trend < 0.05). K-means clustering analysis generated three trajectories of change in CVAI levels (low, moderate, and high) between 2012 and 2015, and higher class was significantly associated with risk of HTN and co-morbidities compared to low class (HR = 1.63∼1.65, p < 0.05, p-trend < 0.05).
Conclusion: The findings highlight the significant positive correlation between the change in CVAI with hypertension and comorbidities in the middle-aged and elderly population, suggesting a potential application in the clinical assessment and prevention of cardiometabolic disease.
Introduction
Primary hypertension (HTN) affects nearly one-third of adults worldwide and is one of the leading causes of premature death (1). In 2015, 245 million Chinese adults over the age of 18 suffered from hypertension, and 2.54 million patients died from elevated systolic blood pressure (SBP) in 2017, with a disability-adjusted life expectancy of more than 5% (2). HTN has become a serious problem in public health due to the promoter for adverse cardiovascular events, kidney damage, and mortality (3, 4).
Visceral fat accumulation (VFA) significantly contributes to the risk of hypertension, metabolic syndrome and stroke in European and American populations (5), and is positively associated with cardiovascular disease and mortality in East Asian population (6). VFA was identified as a significant independent risk factor for cardiovascular and all-cause mortality (7). Although, imaging-based computed tomography (CT), magnetic resonance imaging (MRI) and dual energy X-ray absorptiometry (DEXA) can accurately visualize the distribution of visceral fat in abdomen, their unaffordable price, bulky equipment have limited the promotion and application in clinical and epidemiological investigations (8–10). Anthropometric measures and lipid levels have been used by the visceral adiposity index (VAI) to determine the quantity of visceral fat which can reflect the distribution of visceral fat in Western population (11, 12).
The Chinese visceral adiposity index (CVAI), an improved version of the VAI, integrates age, BMI, waist circumference, triglyceride levels, and HDL cholesterol levels to better match Chinese composition and was significantly associated with cardiovascular diseases (CVD), diabetic complications and mortality (13–16). CVAI was positively linked with carotid plaque risk in a non-linear dose-response pattern (17). In recent years, study found that both CVAI and other abdominal obesity indices were associated with cardiovascular events and highlighted that CVAI may be a valuable indicator for identifying Chinese T2DM patients at high risk of CVD (18). Moreover, elevated CVAI was substantially and favorably linked to the risk of T2DM in hypertensive patients (19). Conversely, one standard deviation (SD) increase in CVAI was not linked to the incidence of diabetic retinopathy (DR), but it was significantly linked to a higher prevalence of diabetic kidney disease (DKD) in both men and women (14). The previous studies were not clear about the prospective relationship between VAI or CVAI with HTN. Meanwhile, the relationship between the longitudinal change in CVAI and the risk of new-onset HTN needs to be further explored. Studies have shown that patients with HTN have a higher prevalence of co-morbidities with obesity, diabetes mellitus, and abnormal lipid metabolism (20). The presence of co-morbidities was associated with higher risk of mortality, and disability (21). However, studies on the association between CVAI and hypertensive co-morbidities were sparse.
In this nationwide prospective cohort study, we systematically evaluated the associations of baseline Chinese visceral adiposity index (CVAI) levels and their longitudinal trajectories with incident hypertension and its cardiometabolic comorbidities in Chinese adults.
Materials and methods
Study participants
The current study was based on a nationwide cohort of the China Health and Retirement Longitudinal Study (CHARLS)1 which aims to collect high-quality health data representing families and individuals of middle-aged and elderly people aged 45 and above in China, to illuminate the problem of aging in China, and promote interdisciplinary study. Participants are drawn from both rural and urban residence using a multistage stratified probability proportional-to-size sampling strategy, and there are five waves between 2011 and 2020 (22). The first survey (2011–2012) was used as a baseline, and then participants were followed up at four subsequent visits (2013–2014, 2015–2016, 2017–2018, 2019–2020). Totally, 17,705 participants were recruited at baseline. This study further selected the subjects at baseline according to the exclusion criteria: (1) without biochemical measurements (n = 7,423); (2) malignant tumor (n = 180); (3) hypertension and comorbidities (n = 3,359); (4) missing anthropometrics measurements (n = 1,685). Finally, 5,058 participants were eligible for further study (Figure 1).
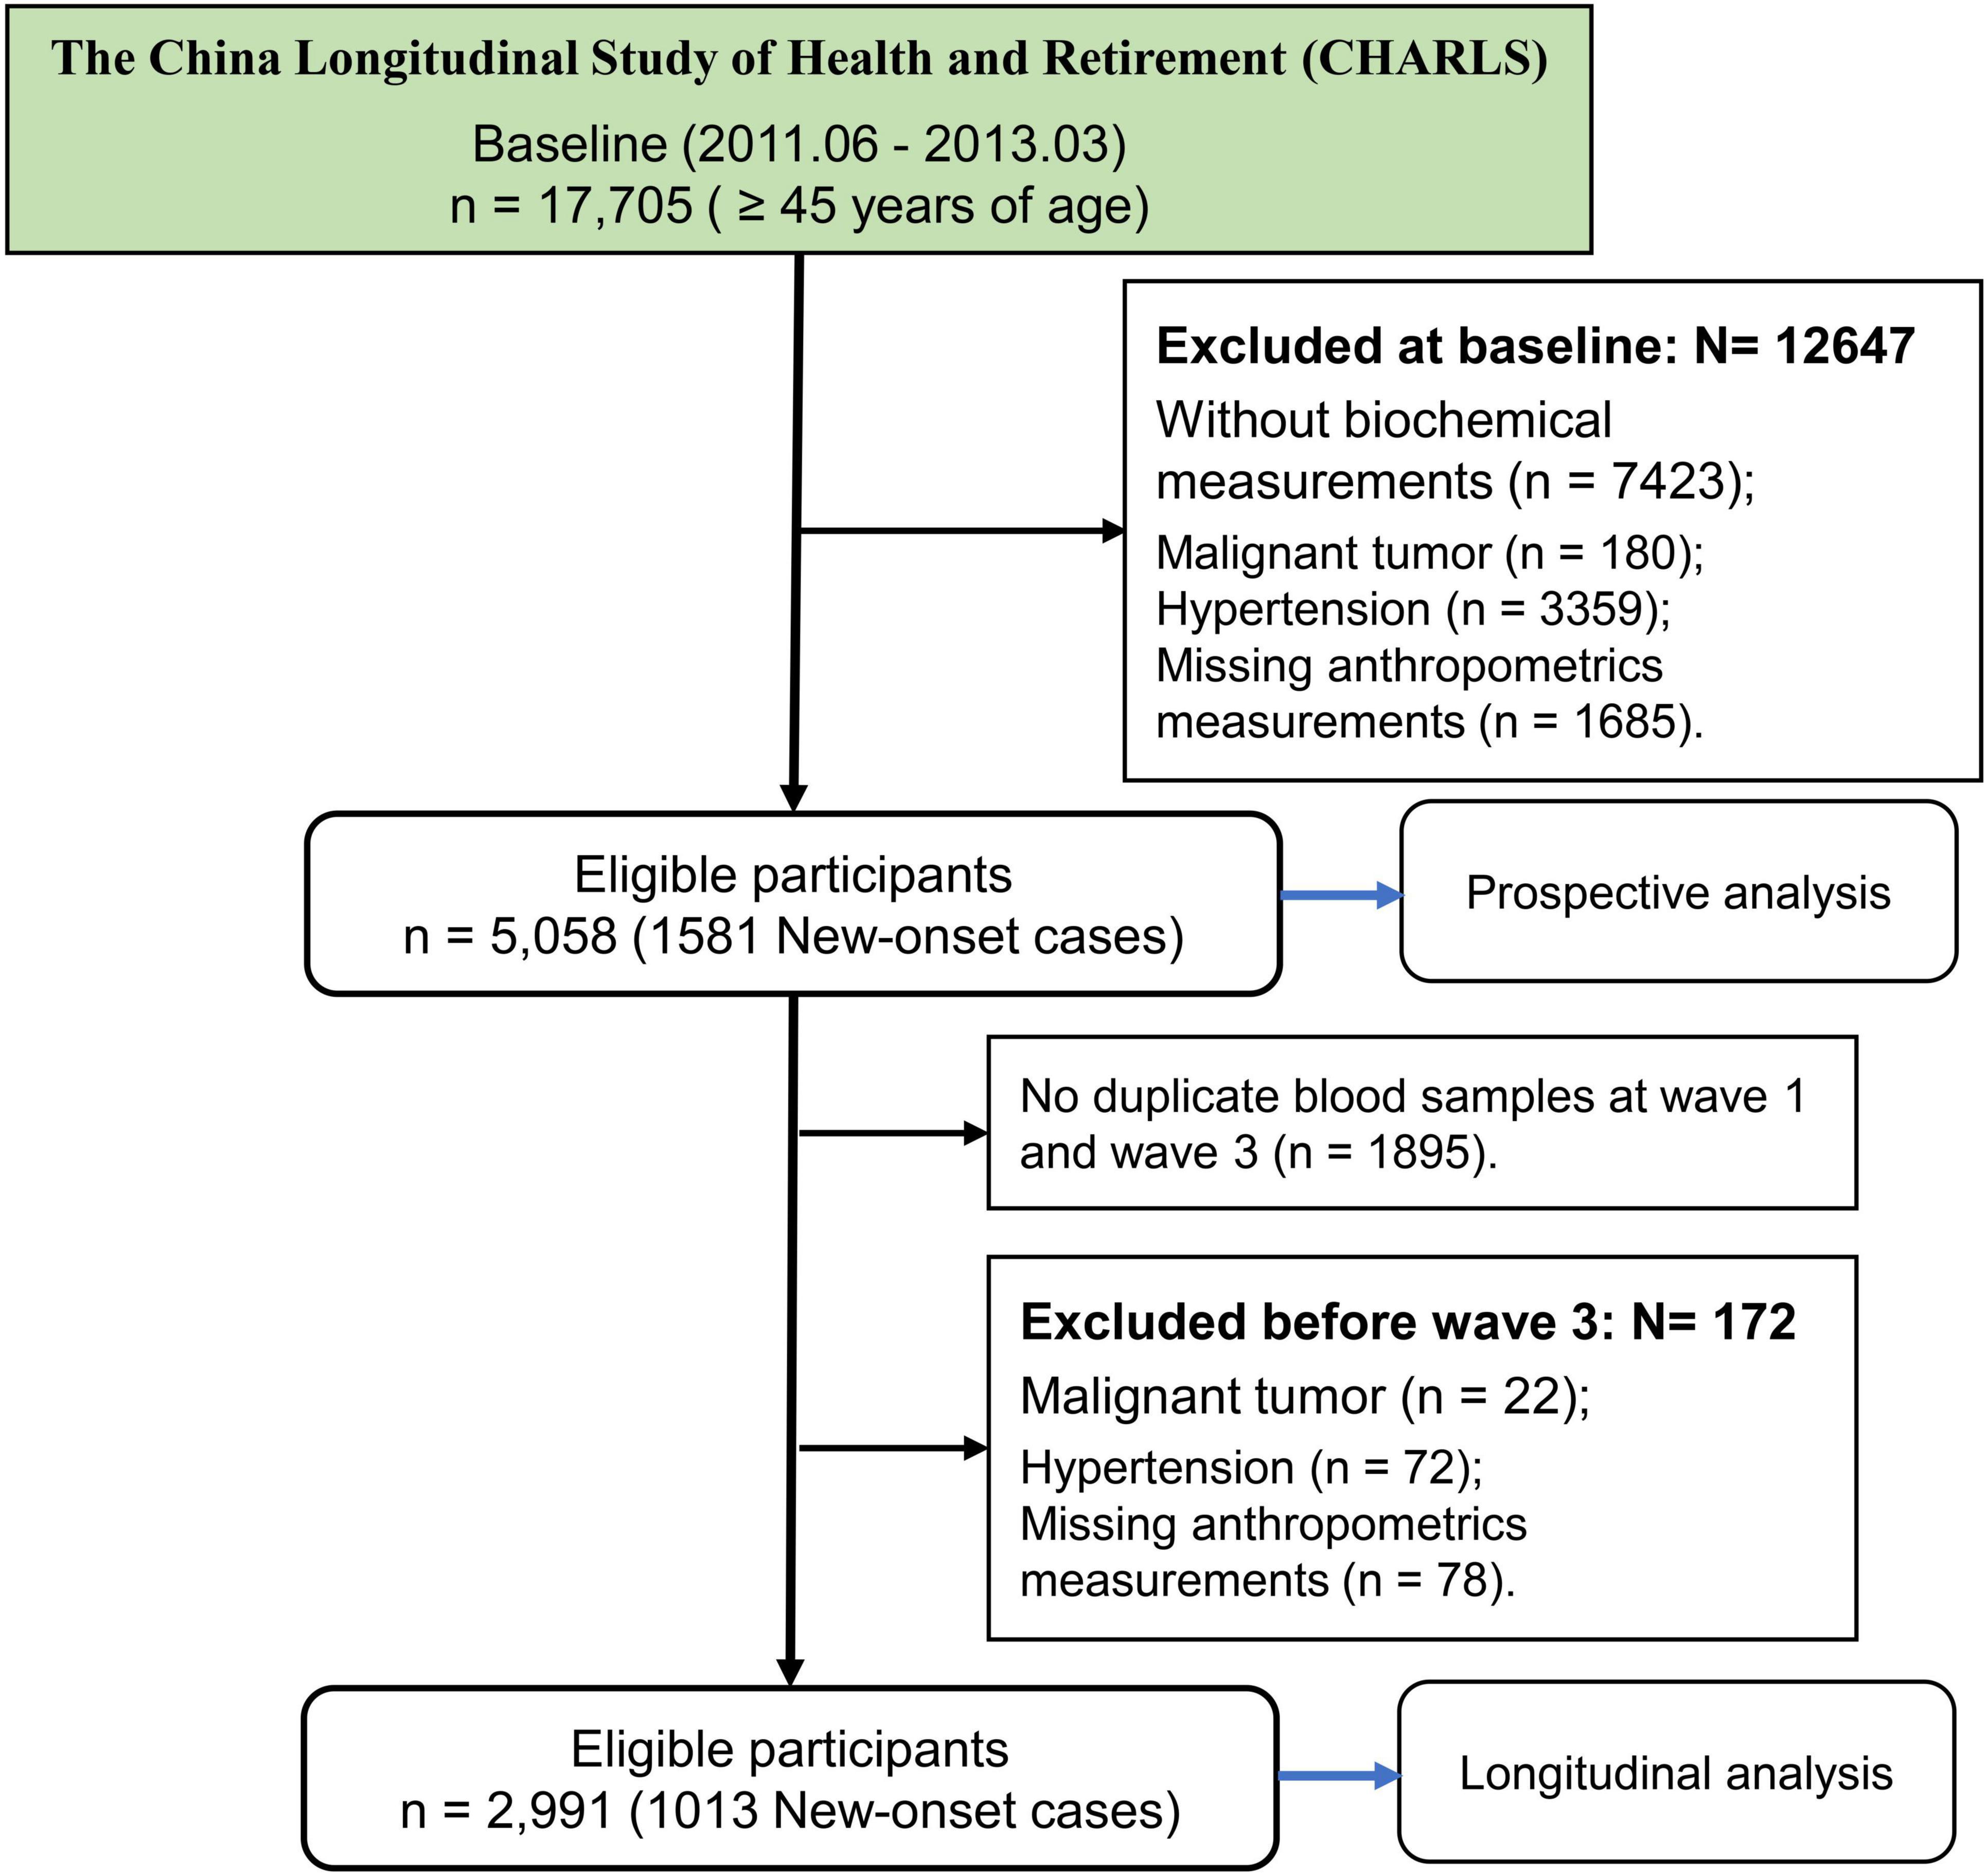
Figure 1. The flowchart of study participants.
The CHARLS study was approved by the institutional review board of Peking University. All participants provided written informed consent.
Definition of outcomes
Primary hypertension (PHTN) was defined as blood pressure measurements with systolic blood pressure (SBP) ≥ 140 mmHg and/or a diastolic blood pressure (DBP) ≥ 90 mmHg on three readings or use of antihypertensive drugs (23). Diagnosis of type 2 diabetes mellitus defined as random blood glucose ≥ 11.1 mmol/L, or fasting blood glucose ≥ 126 mg/dL (7.0 mmol/L), or HbA1c ≥ 6.5%, or oral glucose tolerance test (OGTT) 2-h glucose ≥ 200 mg/dL (11.1 mmol/L), and/or classic symptoms of hyperglycemia, and/or hypoglycemic therapy (24). BMI was used to evaluate the state of obesity. Participants in the CHARLS were divided into normal weight (18.5 ≤ BMI < 24.0 kg/m2), overweight (24.0 ≤ BMI < 28.0 kg/m2), and obesity (BMI ≥ 28.0 kg/m2) (25). Metabolic status was assessed based on four metabolic components (26). Participants were categorized as metabolically unhealthy if they satisfied two or more of the four following criteria (27): (1) Abdominal obesity: WC ≥ 90 cm for men and WC ≥ 85 for women; (2) Impaired glycemic control: fasting plasma glucose (FPG) ≥ 5.6 mmol/L or use of antidiabetic drugs; (3) Elevated triglyceride (TG): TG ≥ 1.7 mmol/L or use of lipid-lowering drugs; (4) Reduced high-density lipoprotein cholesterol (HDL-C): HDL-C < 1.03 mmol/L for men or < 1.29 mmol/L for women or use of lipid-lowering drugs. According to the hypertension and coexisting conditions with overweight, metabolically unhealthy, or diabetes, the four phenotypes of hypertension and comorbidities were generated as HTN (Simple hypertension), HTN-OW (hypertension combined overweight), HTN-MET (hypertension combined metabolically unhealthy), and HTN-DM (hypertension combined diabetes).
Data collection for covariates and exposures
The venous blood samples were taken at two waves (wave 1 and 3) by trained professionals using a standard phlebotomy process and tested for biochemical parameters. Following the separation of the venous blood into plasma and buffy coat, the plasma was kept in three 0.5 mL cryovials, while the buffy coat was kept in a different cryovial. After being instantly frozen at −20°C, these cryovials were shipped to the Chinese Center for Disease Control and Prevention (China CDC) in Beijing within 2 weeks (22). The blood samples from participants were tested for complete blood count (CBC) and blood chemistry panel. The lipid profiles and FPG were detected by enzymatic colorimetric test, while HbA1c was measured using boronate affinity high performance liquid chromatography. The methods and detection limits of bioassays were shown in Supplementary Table S1. Several covariates were collected by trained interviewers with standard questionnaires, including demographic information (such as age, gender, education, residence, living standard, marital status, smoking status, and alcohol consumption), health status and functioning (such as history of diseases and medication use). The detailed information about the categorical variables was presented in Supplementary material.
The primary exposures of this study were CVAI levels at baseline and change of CVAI between 2012 and 2015 (28). The minor exposures primarily involved common lipid metabolism indices, including body roundness index (BRI), lipid accumulation product (LAP), WC, WHtR, and BMI. The cumulative CVAI was determined by the expression: (CVAI–2012 + CVAI–2015)/ 2 × time (2015–2012) (29). The equations and information for primary exposure of CVAI and minor exposures of BRI and LAP were provided in Supplementary Table S2.
Statistical analysis
In the study, continuous variables were presented as means (SD), while categorical variables were reported as counts (percentages). Baseline characteristics between groups were compared using one-way ANOVA or the Kruskal-Wallis test for continuous variables, and the Pearson’s Chi-squared test for categorical variables.
The predictive abilities of CVAI and secondary exposures of adipose indices (BRI, LAP, WHtR, BMI, and WC) to risk of HTN and comorbidities were explored by receiver operator characteristic curve (ROC). In prospective study, restricted cubic spline (RCS) curve with 4 knots was conducted to test non-linearity for CVAI when estimating HTN, HTN-OW, HTN-MET, and HTN-DM. Then, Cox model assumption of proportionality was checked for CVAI and secondary exposures of adipose indices (BRI, LAP, WHtR, BMI, and WC). The associations of adipose indices with HTN and comorbidities were quantified using hazard ratios (HRs) with 95% CIs before and after adjusting for confounding factors. Crude model, didn’t adjust any covariable; Model 1 was adjusted for sex and age; Model 2 was adjusted for sex, age, (BMI), education, marital status, residence, living standard, smoking status, drinking status, uric acid, serum creatinine, FPG, history and medication use of CVD, liver disease, kidney disease, chronic lung diseases.
In the longitudinal studies for the associations of cumulative CVAI with HTN and comorbidities incidences after wave 3 were conducted by Cox proportional-hazards regression. The longitudinal trajectory of CVAI within 3 years was investigated using K-means clustering analysis, a form of unsupervised machine learning technology. We utilized the elbow approach to determine the optimal number of clusters (30). Each observation was assigned to the cluster with the closest mean value, which serves as the prototype of the cluster. The relationships between longitudinal trajectories of CVAI with HTN and comorbidities were assessed using Cox proportional-hazards regression in three models with the same adjustment of covariates as above. Meanwhile, the subgroup analyses of CVAI and trajectories in relation to HTN and its co-morbidities across multiple categories of confounders and disease states were performed with Cox regression models, and the interaction effects of CVAI with confounders in relation to HTN and its co-morbidities were also explored.
All analyses were performed with the R programming environment version 4.4.0 (R Project for Statistical Computing). P-values were 2-tailed, with P < 0.05 indicating statistical significance.
Results
The design of study
The current study was based on a nationwide cohort of the China Health and Retirement Longitudinal Study (CHARLS), in which participants were followed up at four successive visits (2013–2014, 2015–2016, 2017–2018, and 2019–2020) after the initial survey (2011–2012) served as a baseline. The outcomes of the study included hypertension (HTN) and coexisting conditions with diabetes (HTN-DM), metabolically unhealthy (HTN-MET), or overweight (HTN-OW). The primary exposure of study was CVAI level at baseline and change of CVAI between 2012 and 2015 (Figure 2).
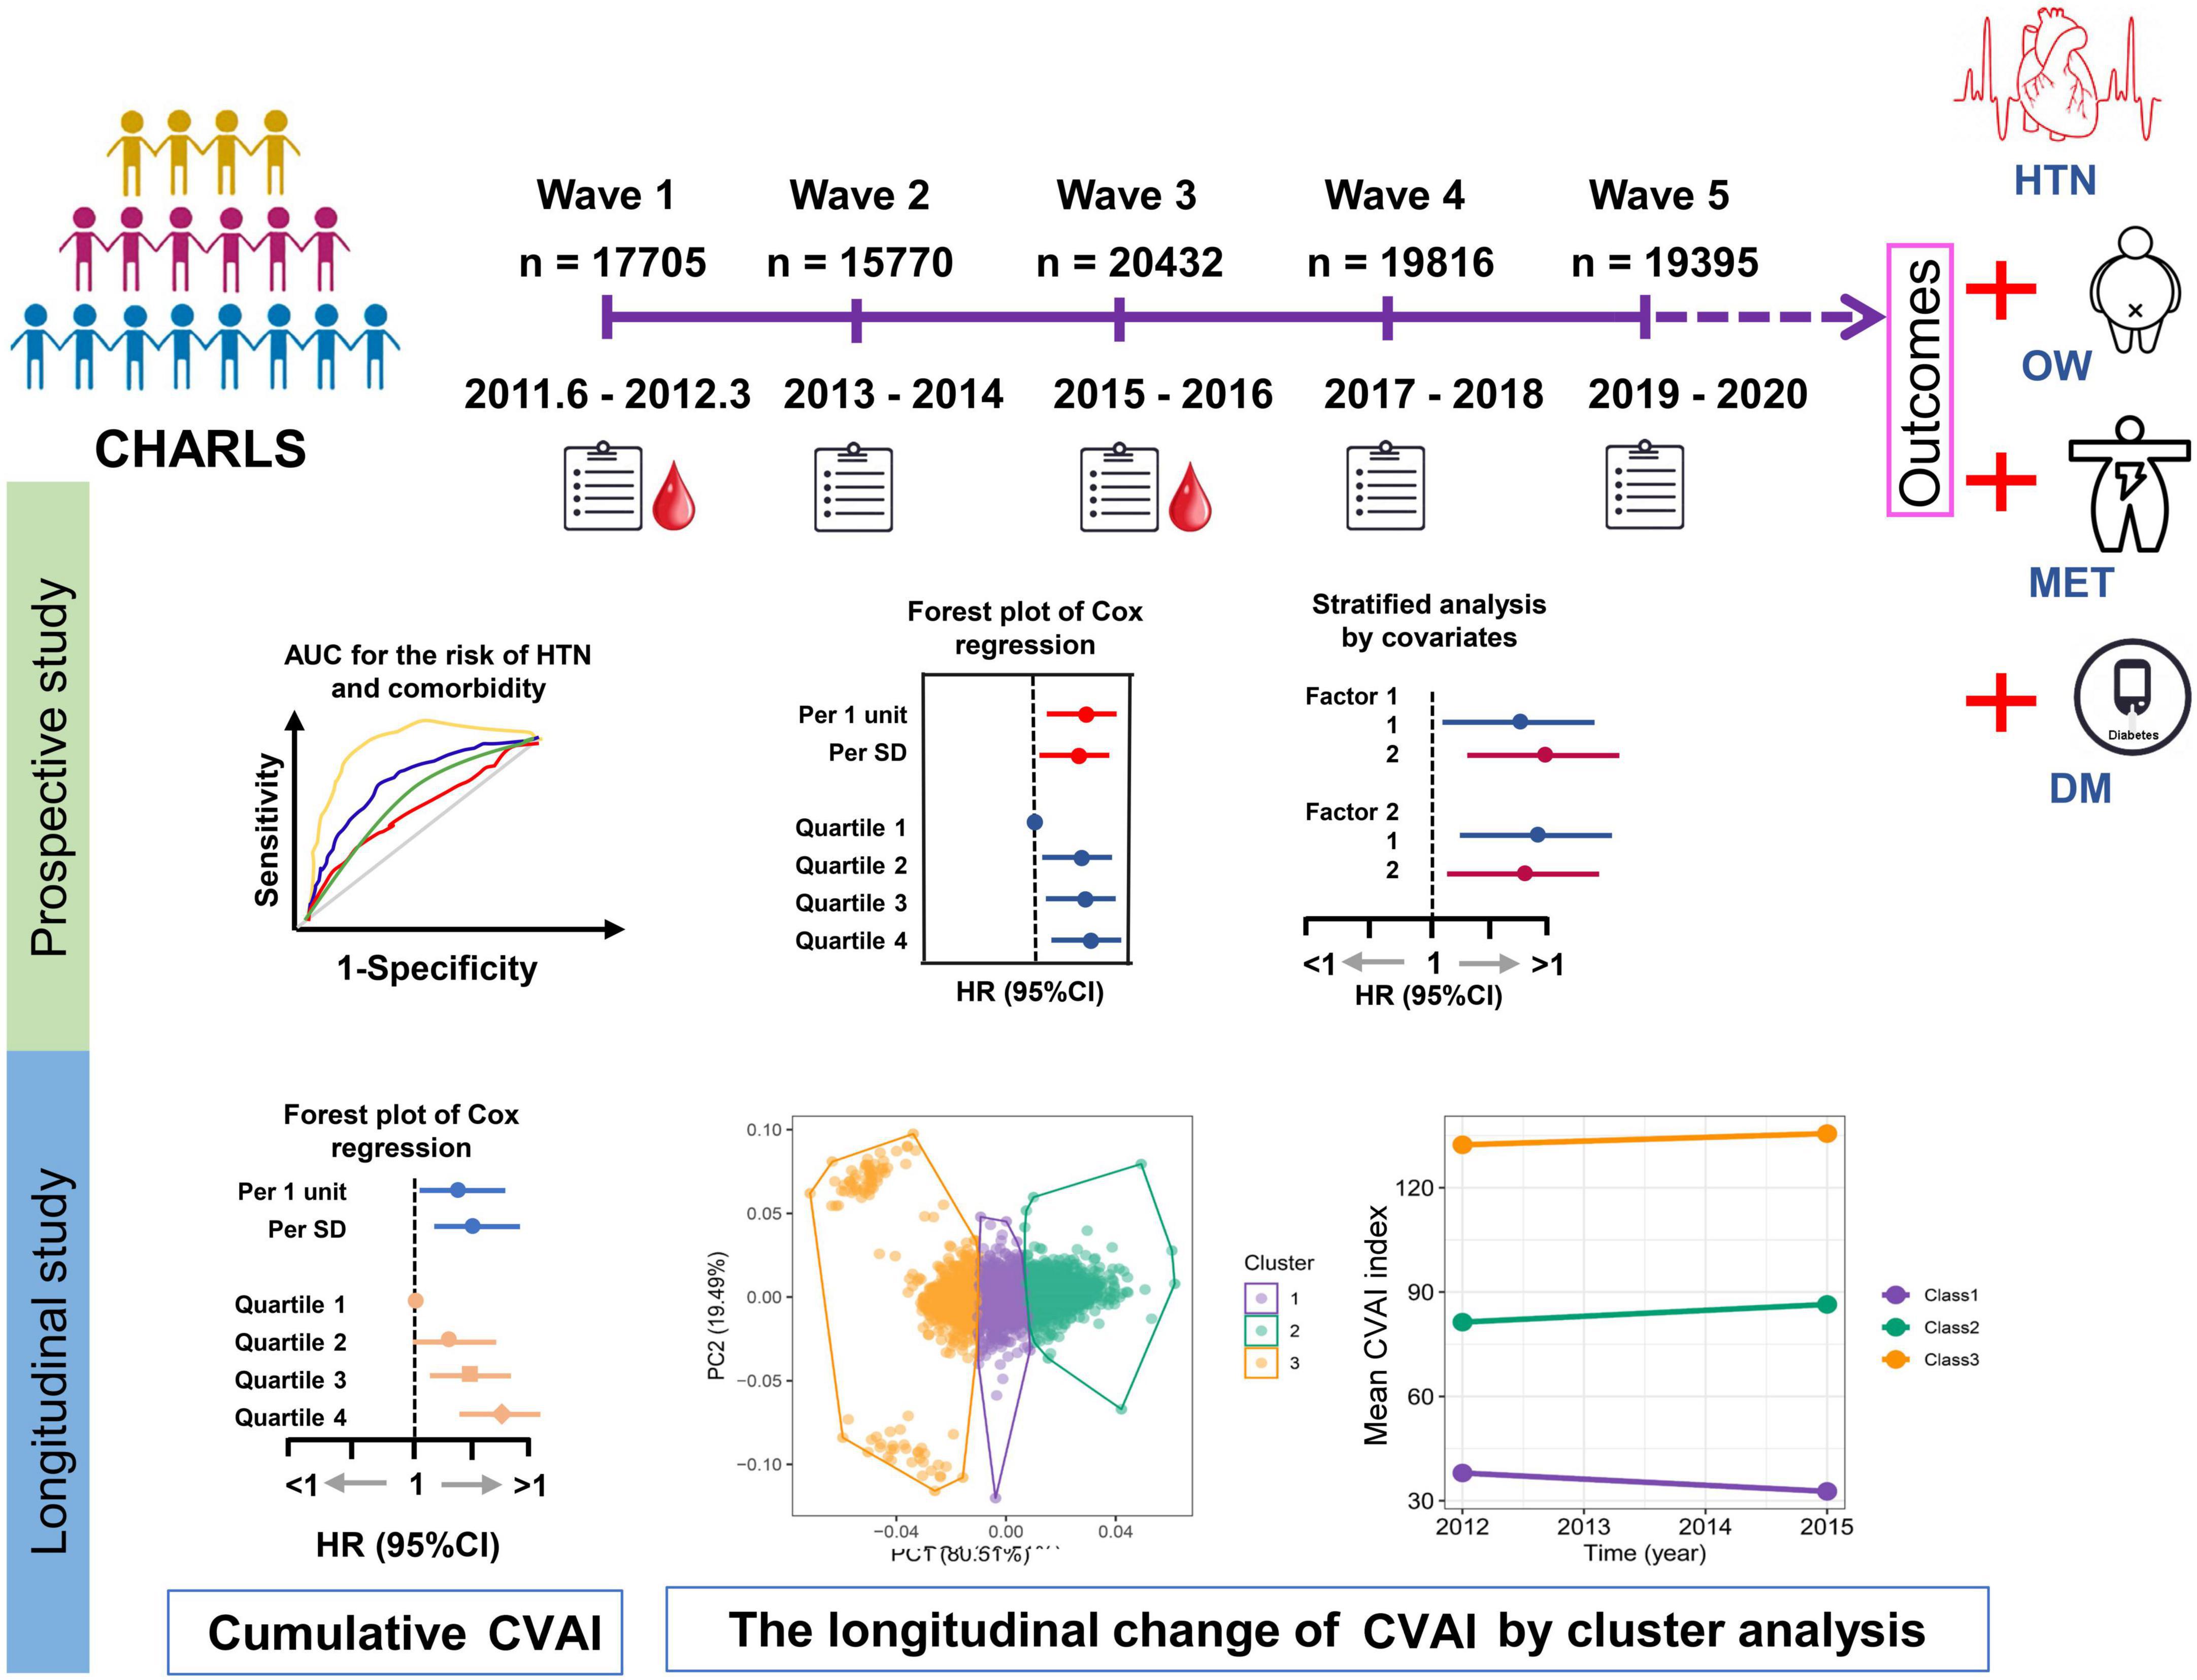
Figure 2. The design of study. The current study was based on a nationwide cohort of the China Health and Retirement Longitudinal Study (CHARLS) which the first survey (2011–2012) was used as a baseline, and then participants were followed up at four subsequent visits (2013–2014, 2015–2016, 2017–2018, and 2019–2020). The HTN and coexisting conditions with overweight (HTN-OW), metabolically unhealthy (HTN-MET), or diabetes (HTN-DM) were study outcomes. The prospective associations of baseline Chinese visceral fat index (CVAI) and other adipose indices with HTN and comorbidities were estimated by Cox regression. In the longitudinal studies for the associations of cumulative CVAI and other adipose indices with HTN and comorbidities incidences after wave 3 were conducted by Cox regression. The longitudinal trajectory of the change in CVAI within 3 years (2012∼2015) was investigated using K-means clustering analysis.
Baseline characteristics of study participants
A total of 5,058 study participants were included in this study, with 1,581 patients with new-onset essential hypertension from 2013 to 2020. The baseline clinical and demographic characteristics of participants were grouped by quartiles of CVAI and longitudinal change trajectories in CVAI. The means (SD) of age and BMI at baseline was 57.03 (9.24) years and 22.62 (3.25) kg/m2, with 2,679 (53%) being female. Participants with higher CVAI quartiles and groups of trajectories tended to be higher age, BMI, WC, WHtR, SBP, DBP, FPG, and lipids profiles compared to those in the lowest quartile and trajectory class (p < 0.001) (Table 1, Supplementary Table S3).
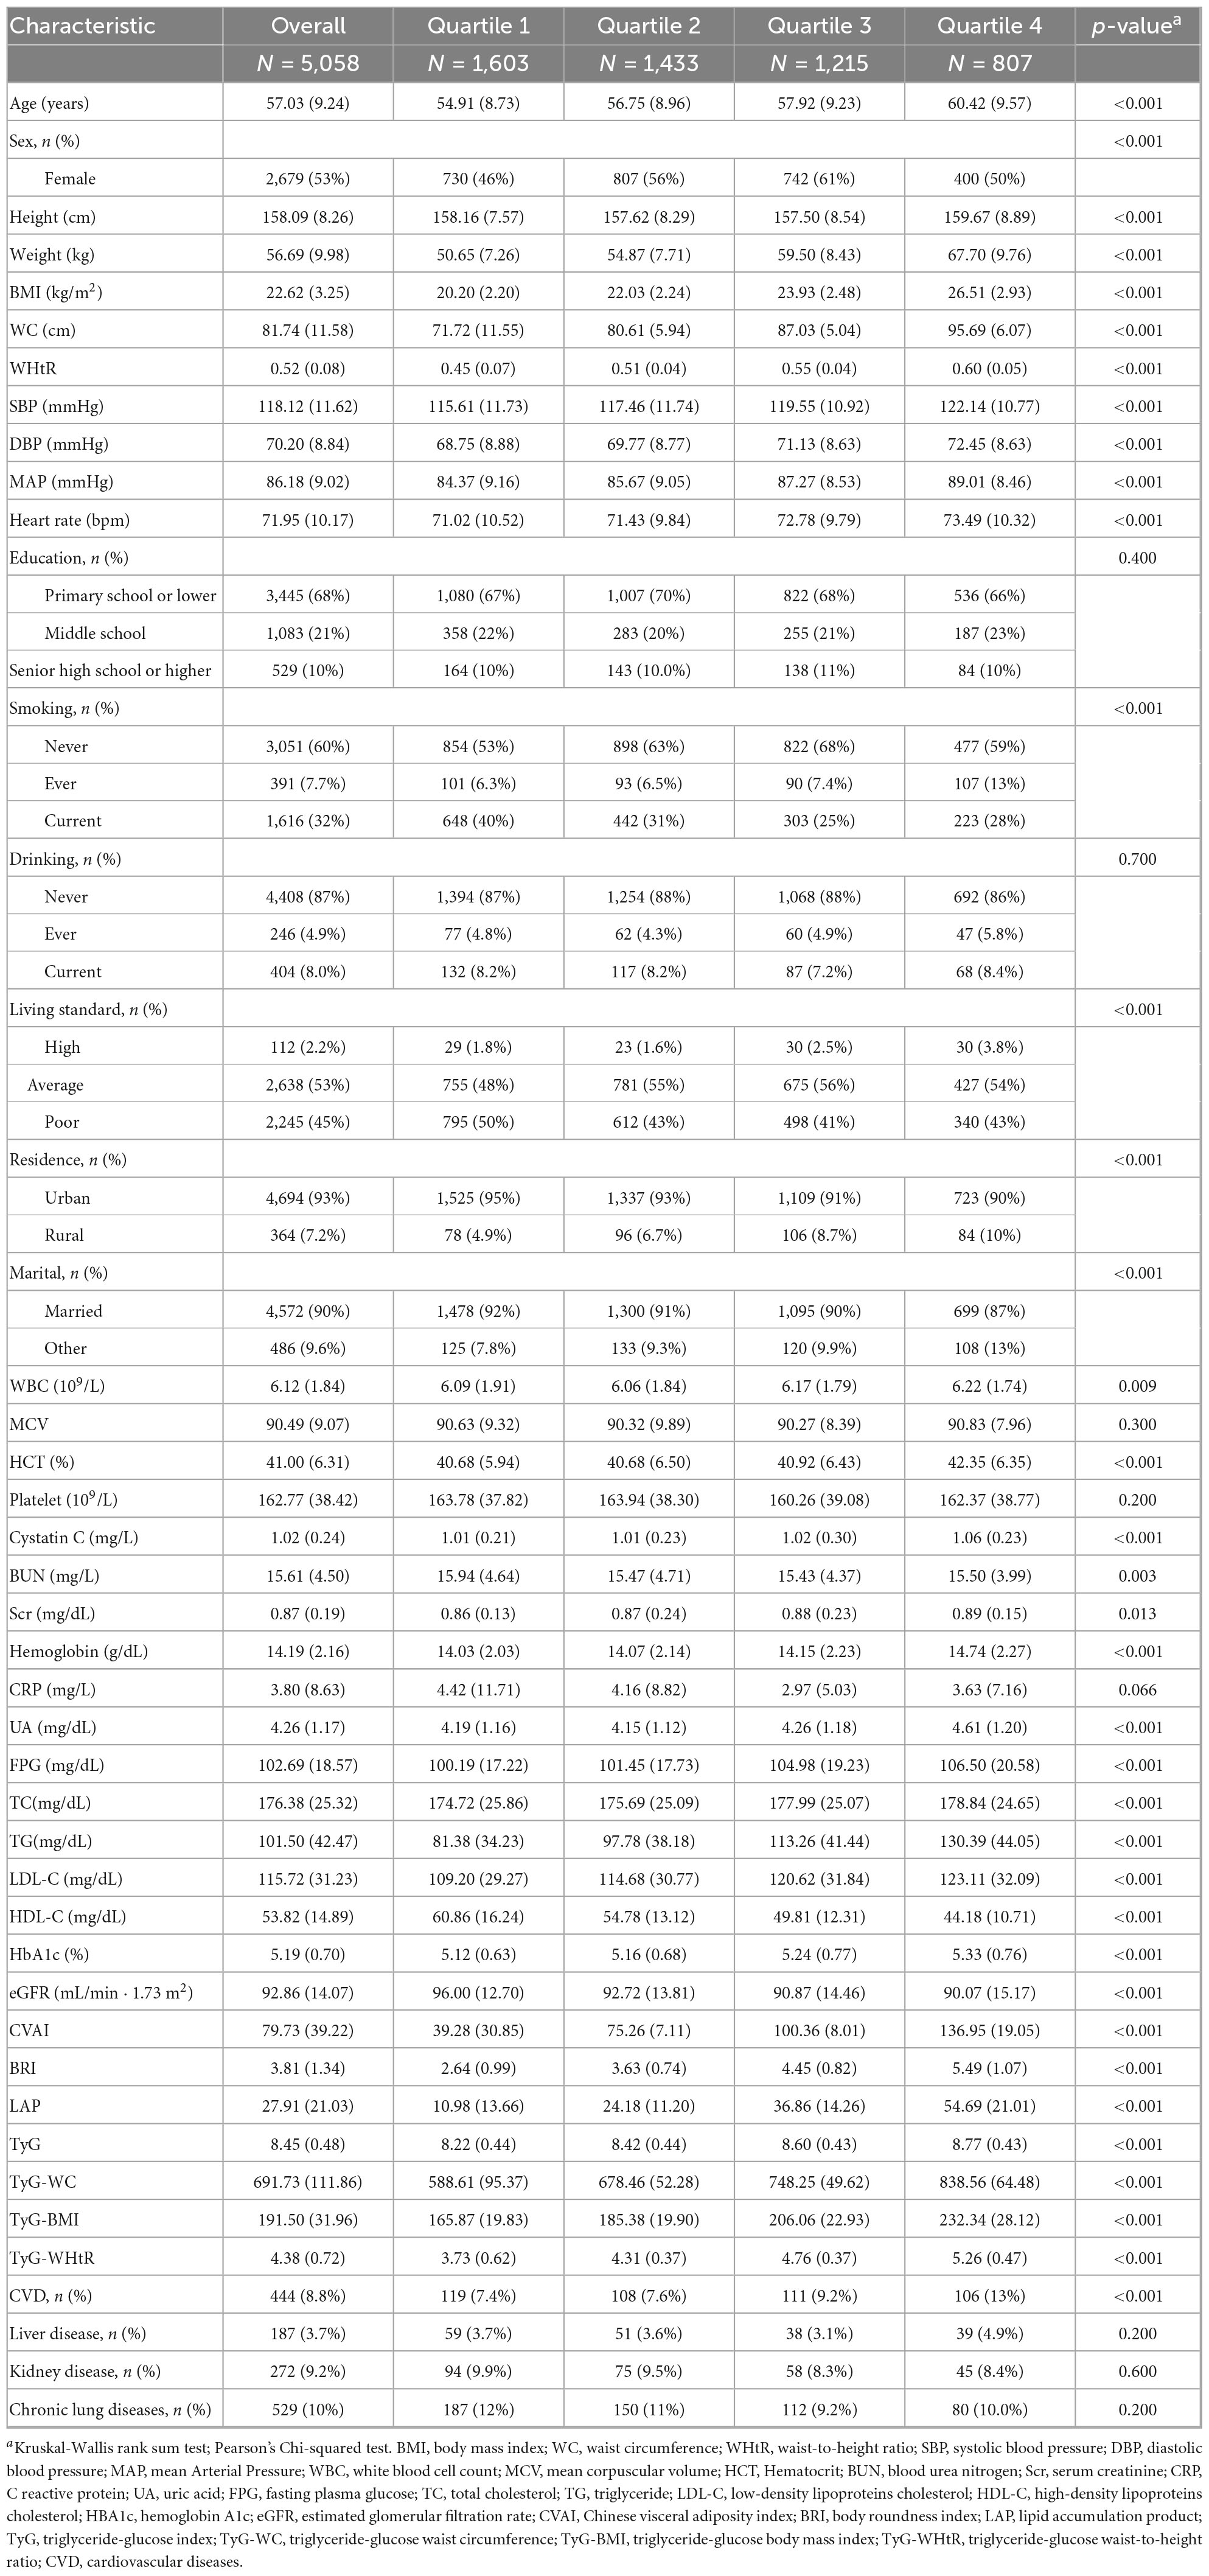
Table 1. Baseline characteristics of study participants by the quartiles of CVAI.
Pearson’s correlation showed that CVAI was strongly related to BRI, LAP, WHtR, WC, BMI (p < 0.001), and the correlation coefficients of CVAI with BRI, WHtR, WC were greater than 0.8 (Supplementary Figure S1).
Baseline CVAI with risk of hypertension and comorbidities
The ROC curves and area under the curves (AUCs) were used to predict the risk of hypertension (HTN) and comorbidities by baseline CVAI and other adipose indices.
The results showed that the predictability of baseline CVAI to HTN, HTN-OW, HTN-MET, and HTN-DM was better compared to BRI, LAP, and WHtR (Supplementary Figures S2A–D). CVAI levels were significantly higher in the group with hypertension and hypertensive co-morbidities compared to those without HTN and co-morbidities (Figures 3A, B). Meanwhile, CVAI showed superior predictability to HTN-OW (AUC = 0.82) and HTN-MET (AUC = 0.77) risk (Figure 3C). A higher CVAI was significantly associated with higher risk of HTN, HTN-OW, HTN-MET, and HTN-DM (p < 0.05) in RCS study, and the significant non-linear relationships of CVAI with risk of HTN-OW (p-non-linear = 0.002) and HTN-MET (p-non-linear = 0.005) were observed (Figure 3D). Furthermore, CVAI was significantly associated with risk of HTN (HR per 1 SD increase = 1.20; 95% CI: 1.08–1.33) and hypertensive co-morbidities (HTN-OW, HTN-MET, and HTN-DM) (HR = 1.20–1.23, p < 0.01). The per-quartile increment in CVAI showed significant positive associations with HTN risk and its comorbidities (all p-trend < 0.05) (Figure 4).
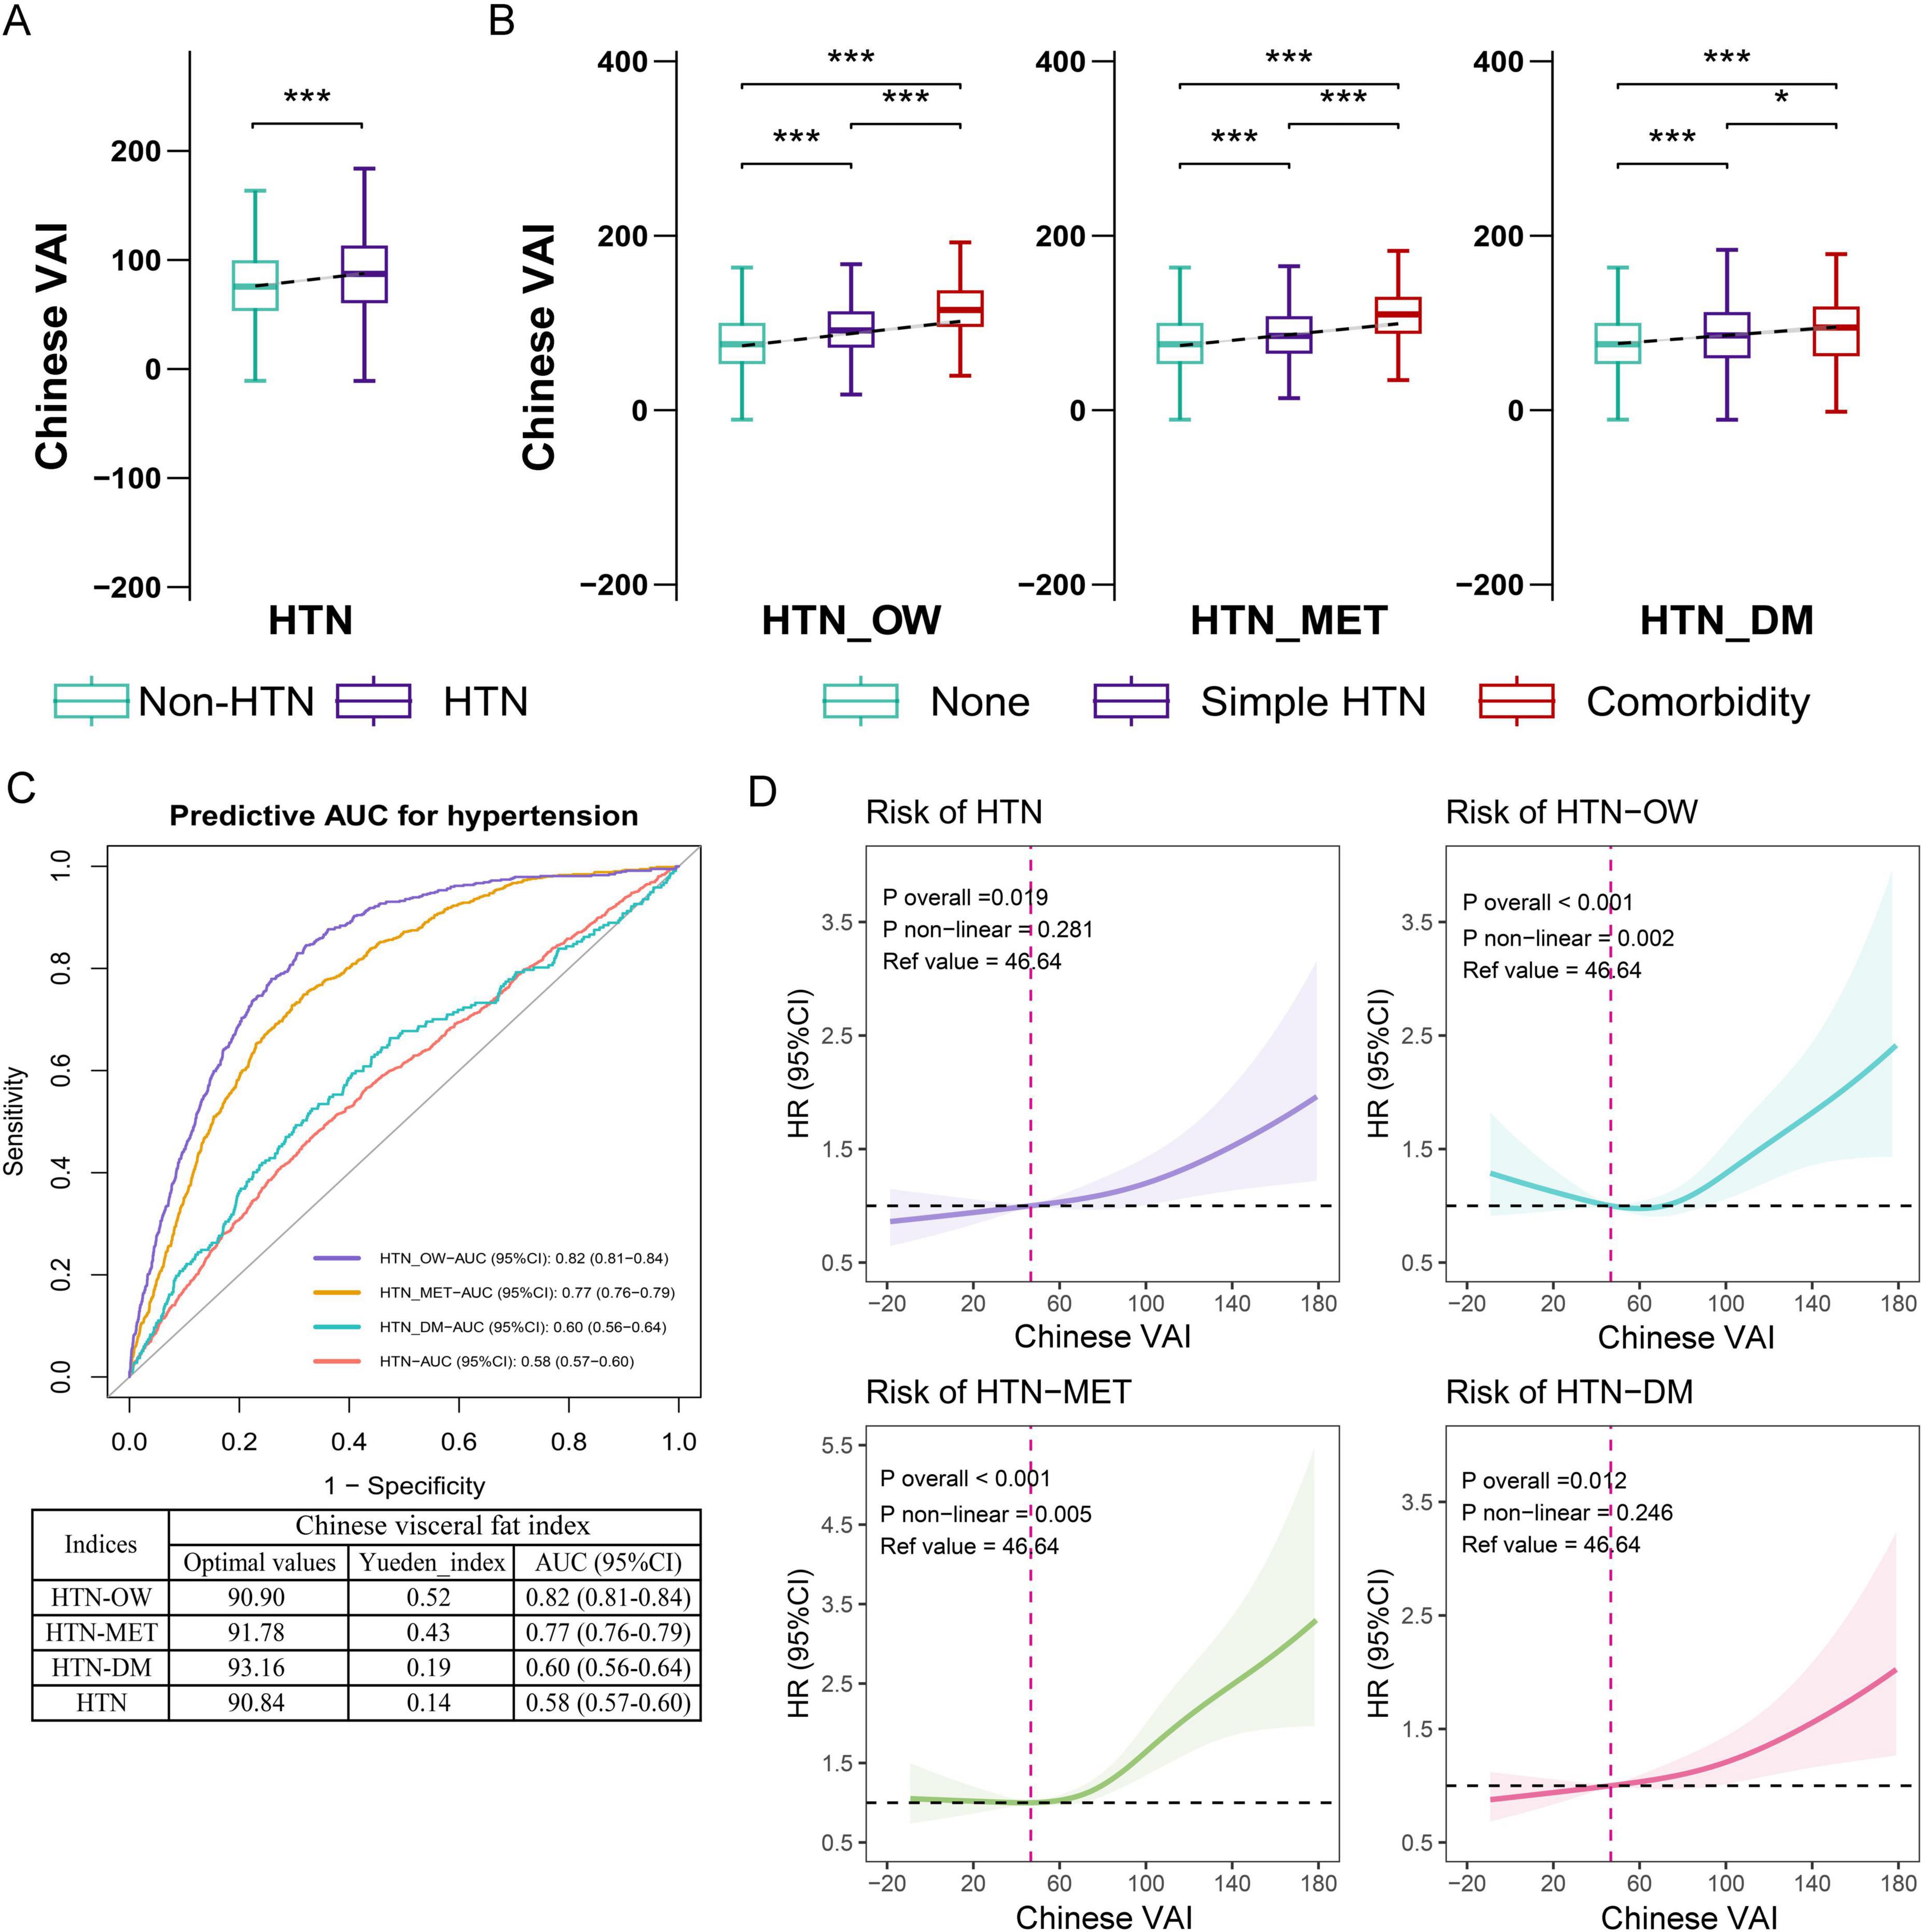
Figure 3. The associations of baseline CVAI with the risk of hypertension and comorbidities. (A) Difference in CVAI across status of hypertension. (B) Difference in CVAI across status of hypertension and comorbidities. (C) The ROC curves and area under the curves (AUCs) (95% CIs) of baseline CVAI for predicting the risk of hypertension and comorbidities. (D) RCS plot of the dose-response relationship of CVAI with hypertension and comorbidities. CVAI, Chinese visceral adiposity index; HTN, hypertension; HTN-OW, hypertension and overweight comorbidity; HTN-MET, hypertension and metabolic disorder comorbidity; HTN-DM, hypertension and diabetes comorbidity; ROC, receiver operator characteristic curve; RCS, restricted cubic spline.
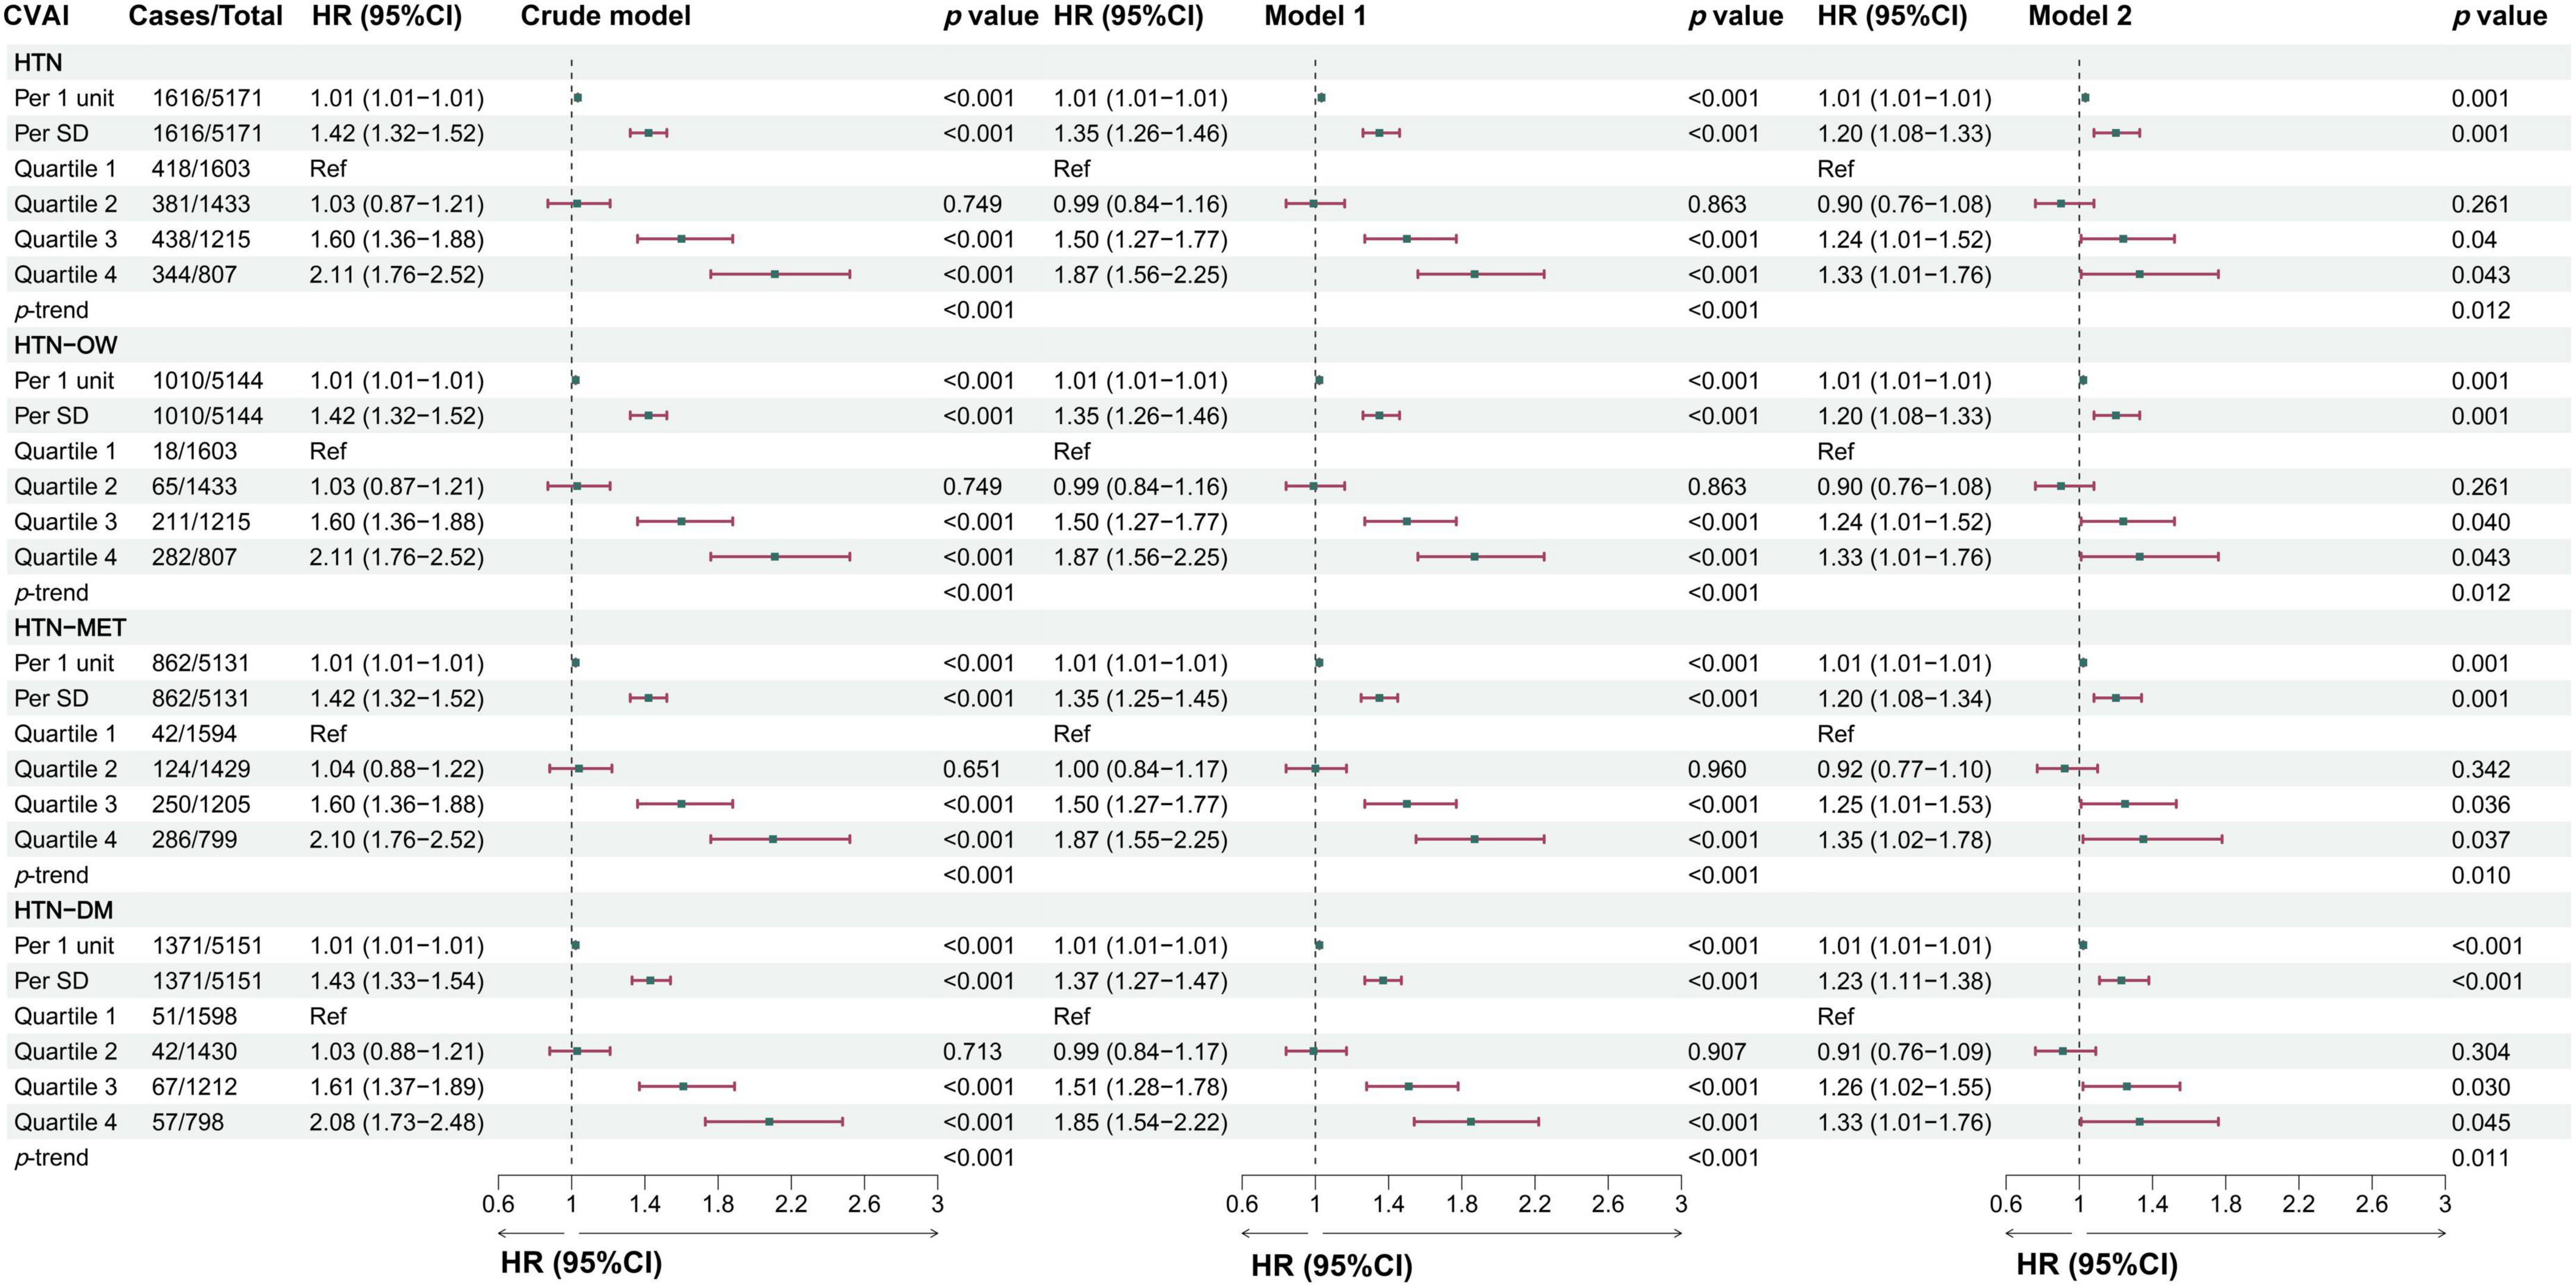
Figure 4. The associations between baseline CVAI and the risk of hypertension and comorbidities in different models. Crude model, didn’t adjust any covariable; Model 1, adjusted for sex and age; Model 2, adjusted for sex, age, BMI, education, marital status, residence, living standard, smoking status, drinking status, uric acid, serum creatinine, FPG, history of dyslipidemia, diabetes, CVD, liver disease, kidney disease, chronic lung diseases at baseline.
The longitudinal associations of change in CVAI with hypertension and comorbidities
In the longitudinal study, we calculated cumulative CVAI using retested CVAI levels at baseline and wave3, and Cox regression found the 13% risk in HTN, HTN-OW, HTN-MET, and HTN-DM for each SD increase in cumulative CVAI. Meanwhile, the risk of HTN and co-morbidities increased by 65% with each quartile increment cumulative CVAI (p-trend < 0.05) (Figure 5). K-clustering analysis generated three trajectories of change in CVAI levels (low, moderate, and high) between 2012 and 2015, and higher class was positively associated with higher risk of HTN and co-morbidities compared to low class (HR = 1.63∼1.65, p < 0.05, p-trend < 0.05) (Figures 6, 7).
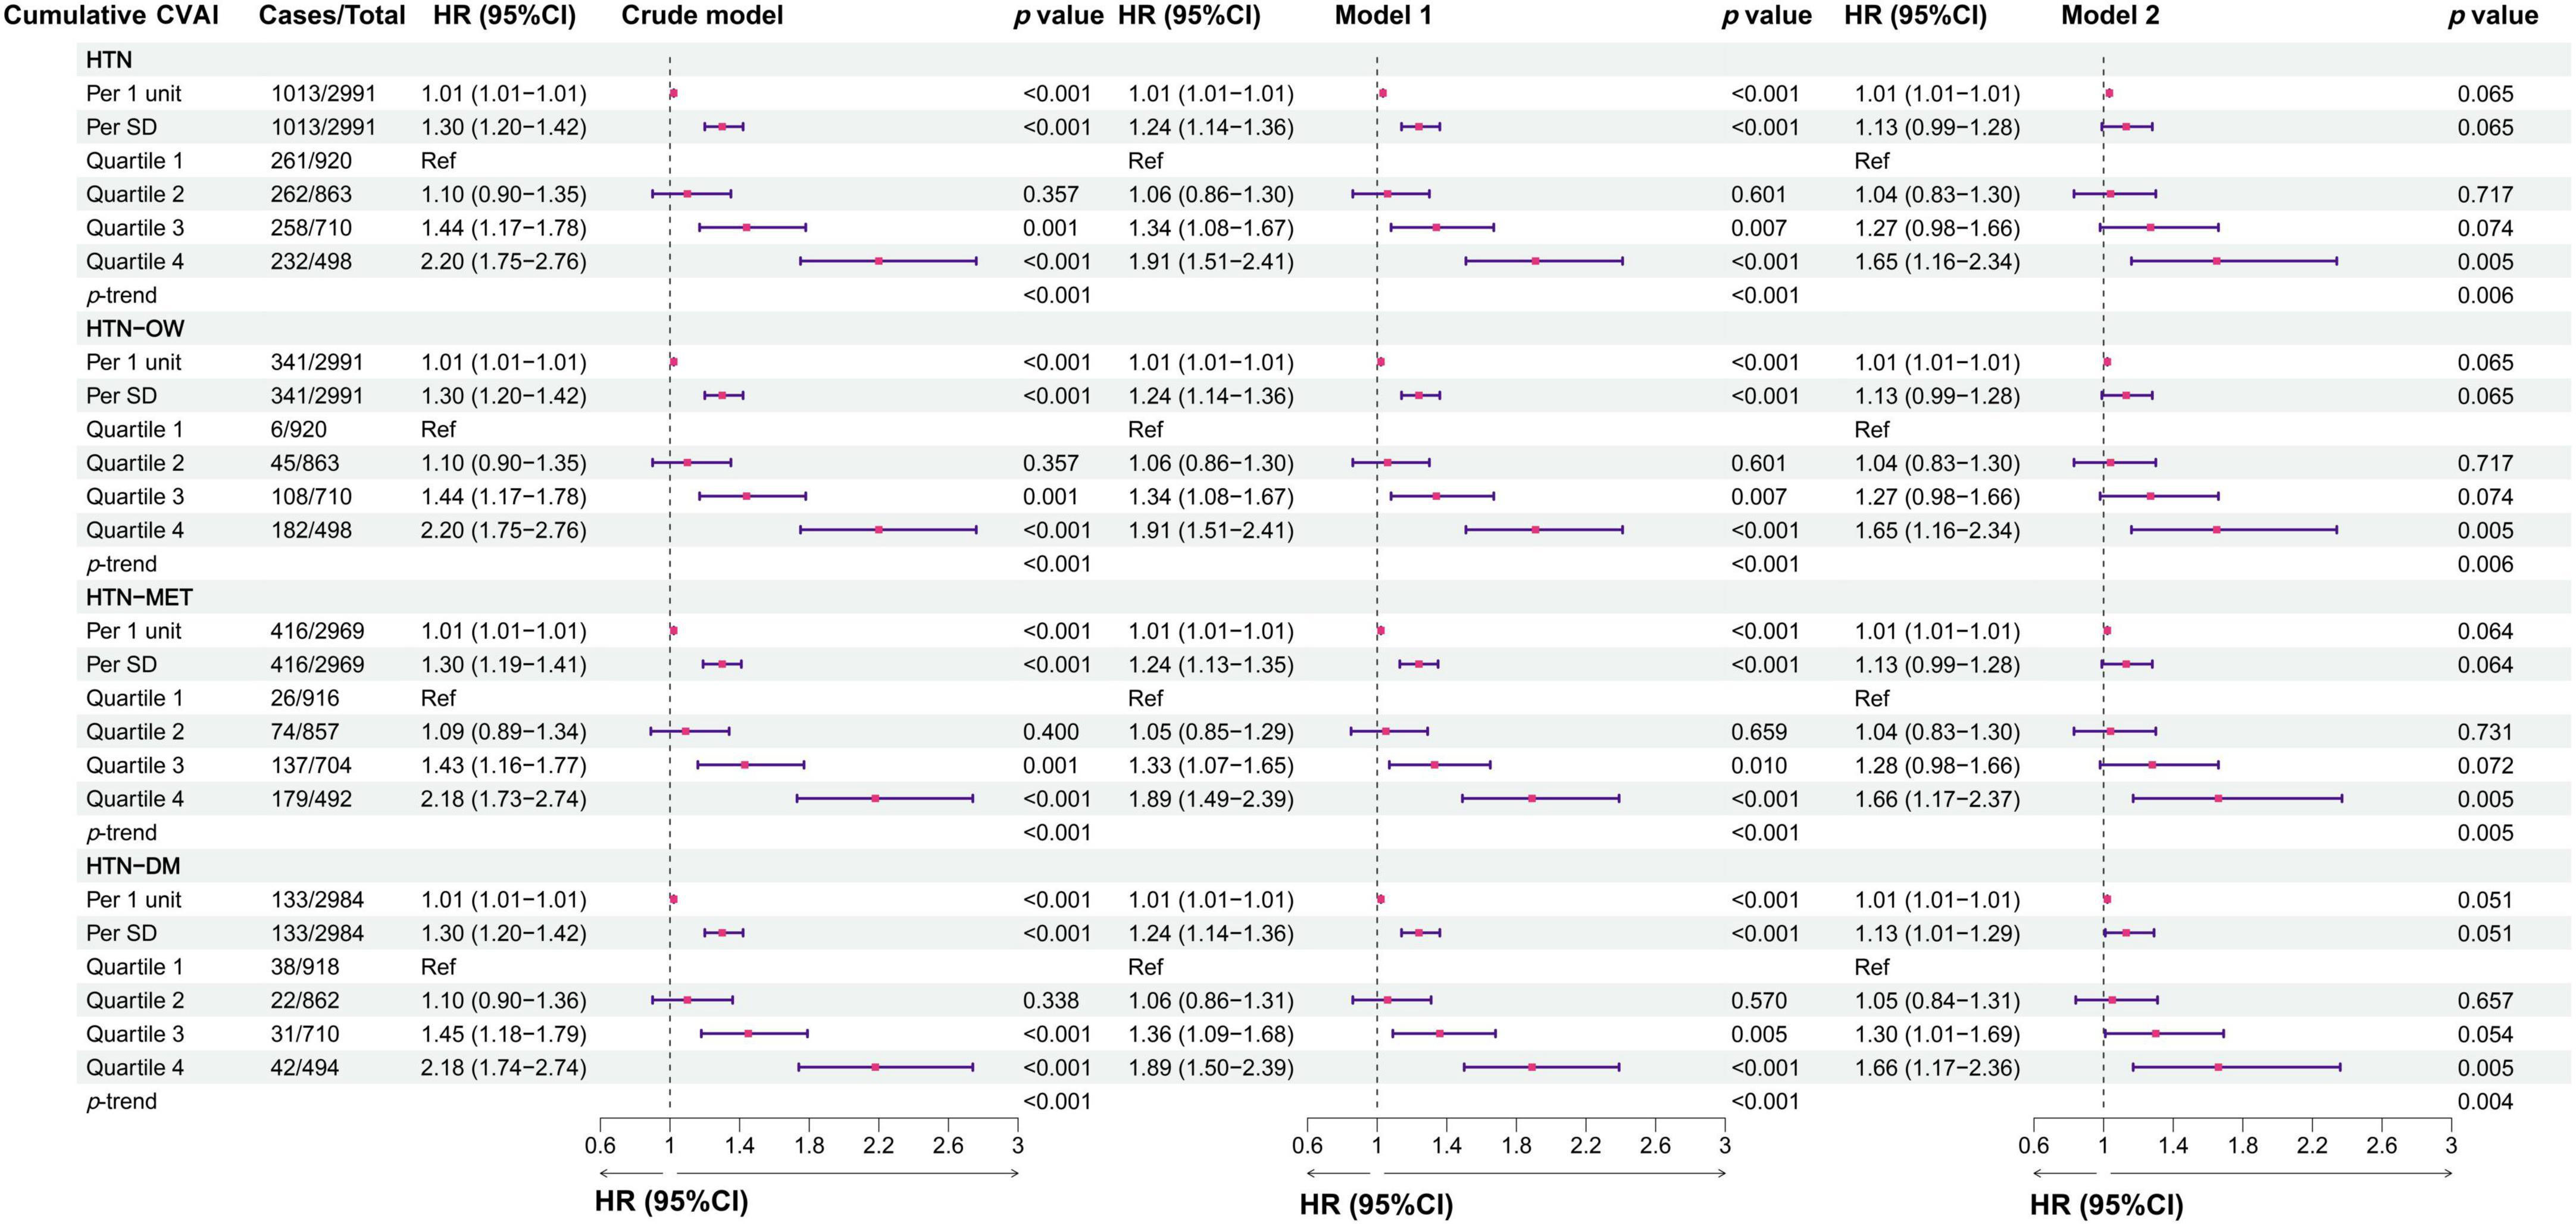
Figure 5. The associations between cumulative CVAI and the risk of hypertension and comorbidities in different models. Crude model, didn’t adjust any covariable; Model 1, adjusted for sex and age; Model 2, adjusted for sex, age, BMI, education, marital status, residence, living standard, smoking status, drinking status, uric acid, serum creatinine, FPG, history of dyslipidemia, diabetes, CVD, liver disease, kidney disease, chronic lung diseases at baseline.
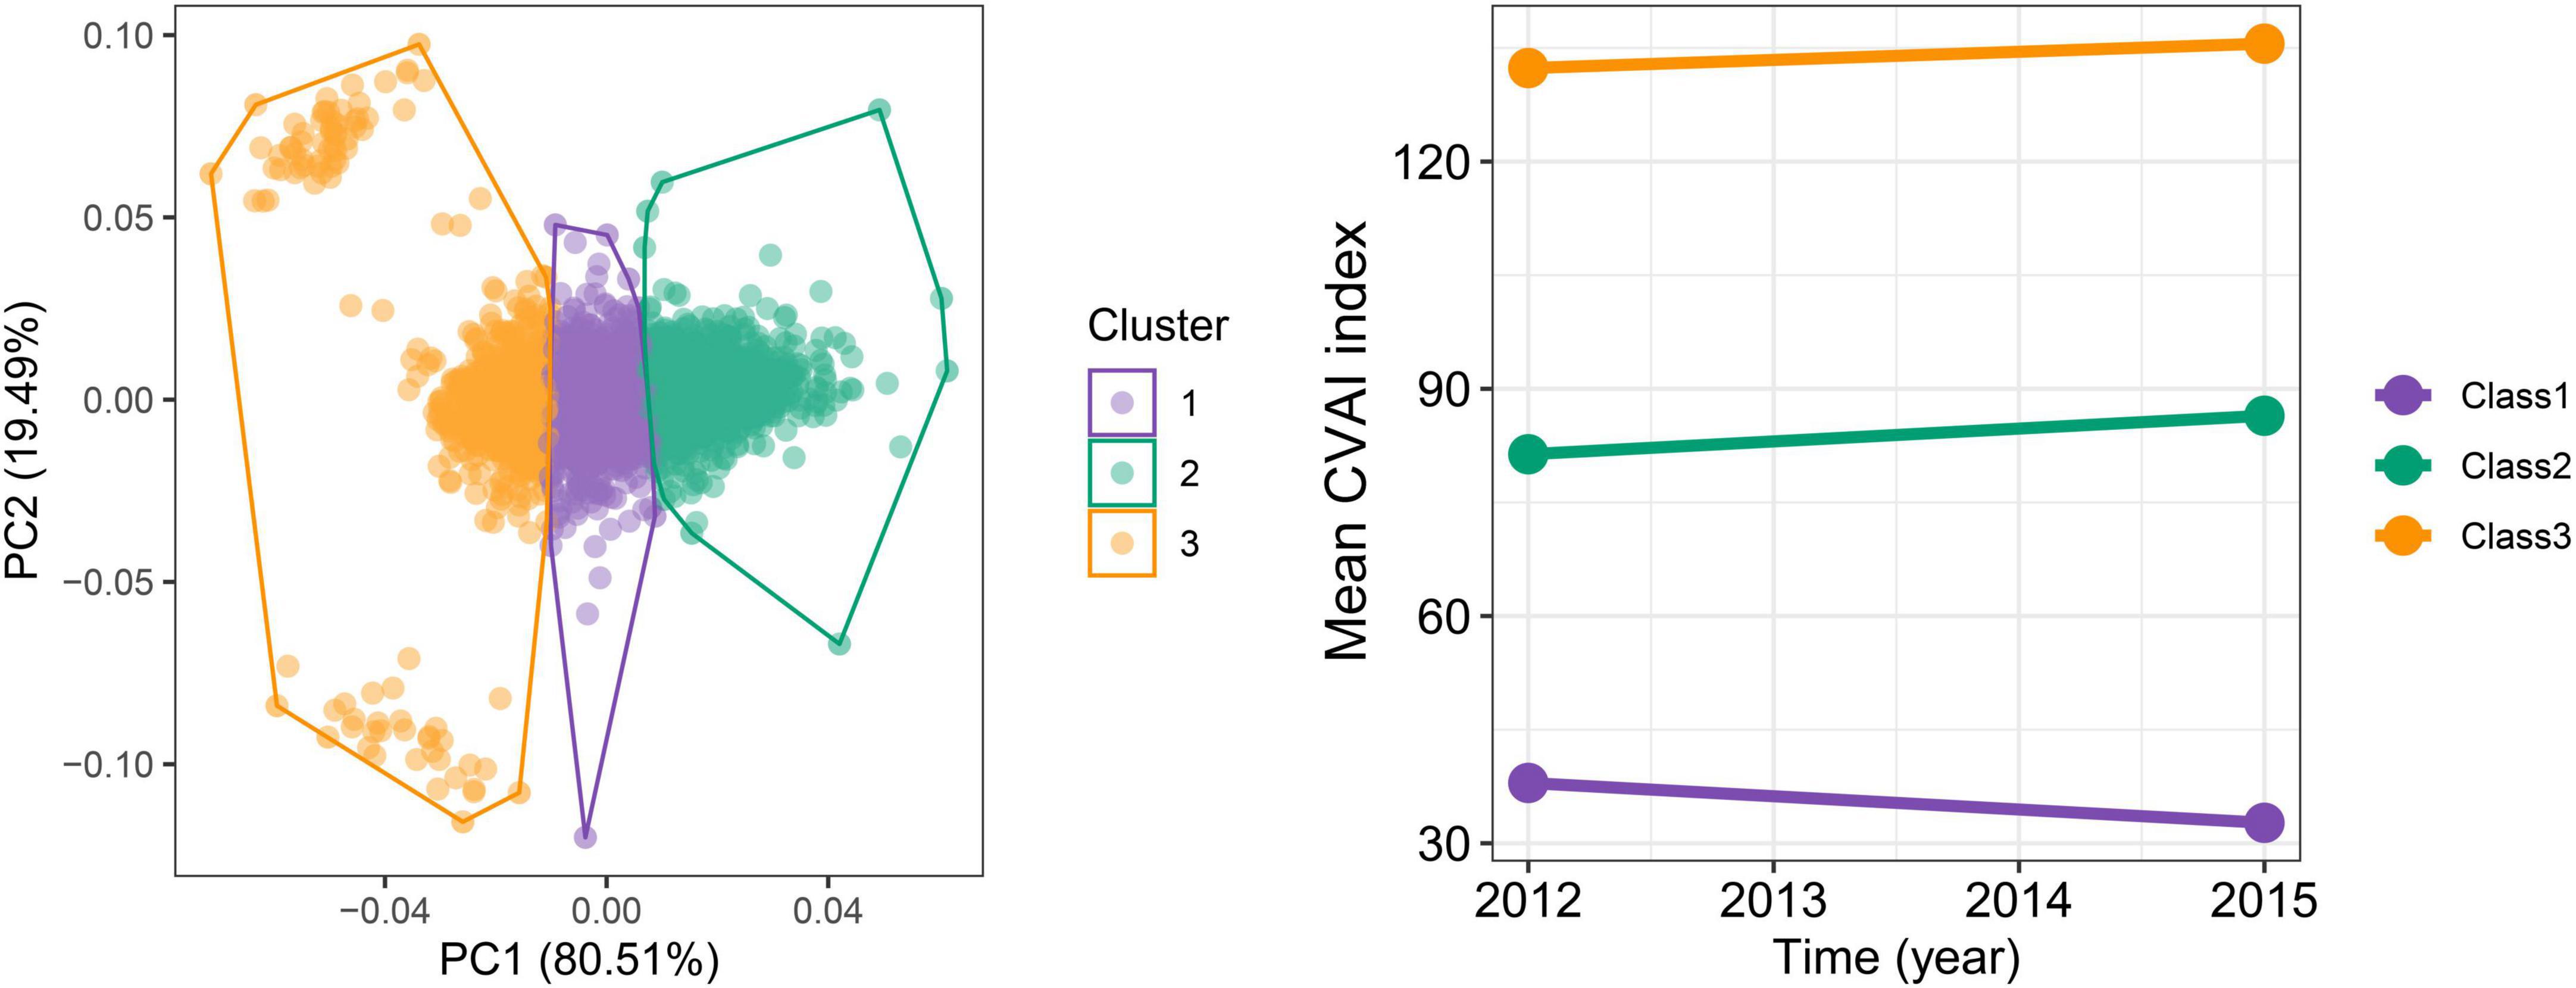
Figure 6. The trajectories for the changes of CVAI during follow-up periods by K-means clustering. The optimal numbers of clusters are determined using the elbow method by calculating the sum of squared errors.
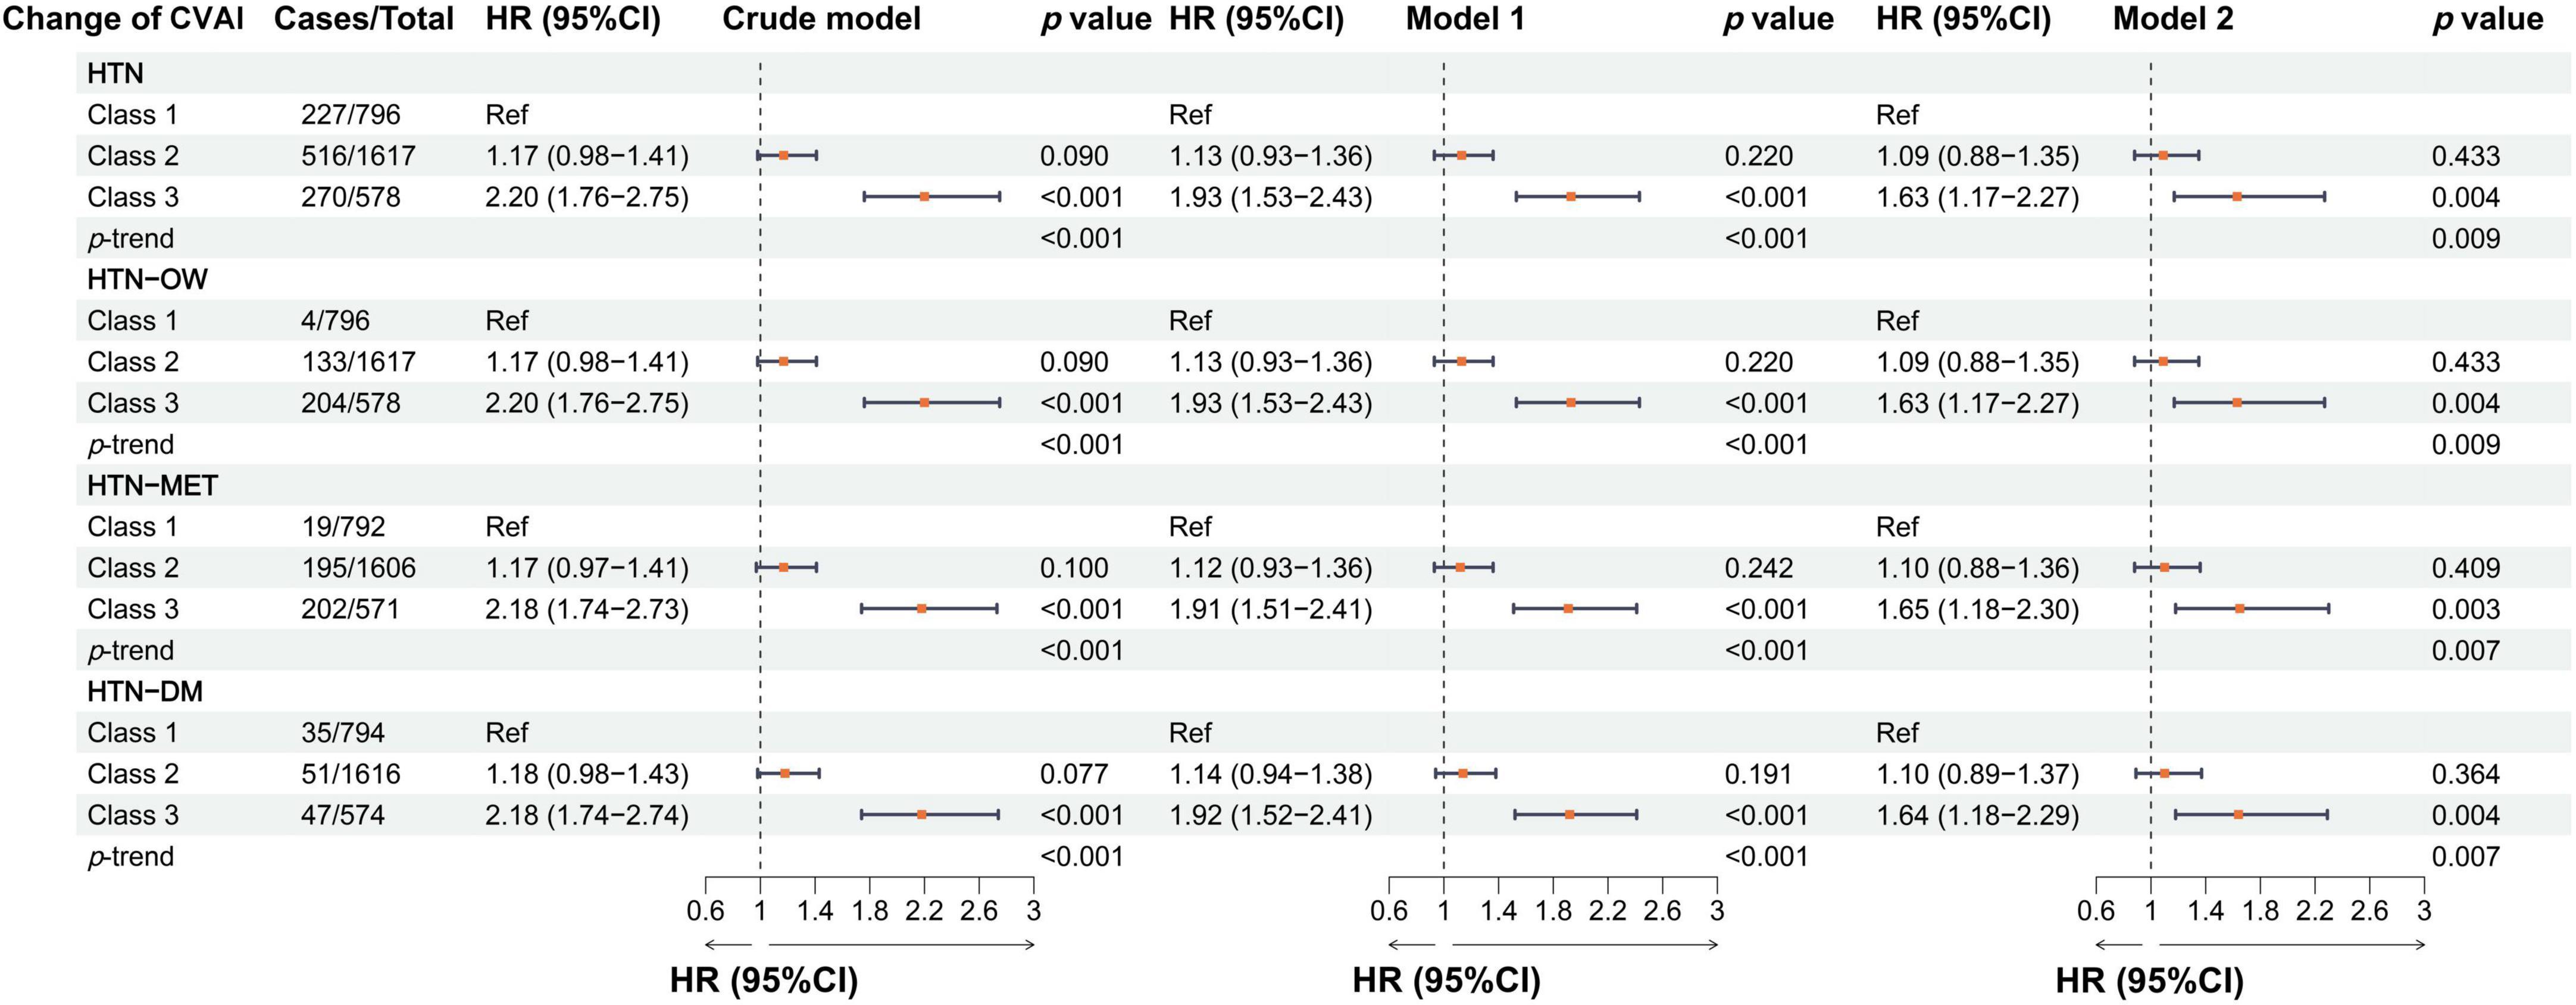
Figure 7. The associations between the longitudinal changes of CVAI and the risk of hypertension and comorbidities in different models. Crude model, didn’t adjust any covariable; Model 1, adjusted for sex and age; Model 2, adjusted for sex, age, BMI, education, marital status, residence, living standard, smoking status, drinking status, uric acid, serum creatinine, FPG, history of dyslipidemia, diabetes, CVD, liver disease, kidney disease, chronic lung diseases at baseline.
Subgroup analyses
In the subgroup analyses stratified by sex, the associations between CVAI and HTN risk were both significant in males and females, and the HR was larger in females than in males [per 1-SD increase, for males: HR, 1.25 (95% CI, 1.15–1.37); for females: HR, 1.75 (95% CI, 1.55–1.97)]. We found a significant interaction effect between gender and CVAI in relation to HTN (p-interaction = 0.001). There was also a significant interaction effect between smoking and CVAI in relation to HTN (p-interaction = 0.002) (Supplementary Table S4). Moreover, the findings showed that the longitudinal change in CVAI was also a significant interaction with sex in relation to HTN (p-interaction = 0.036) (Table 2).
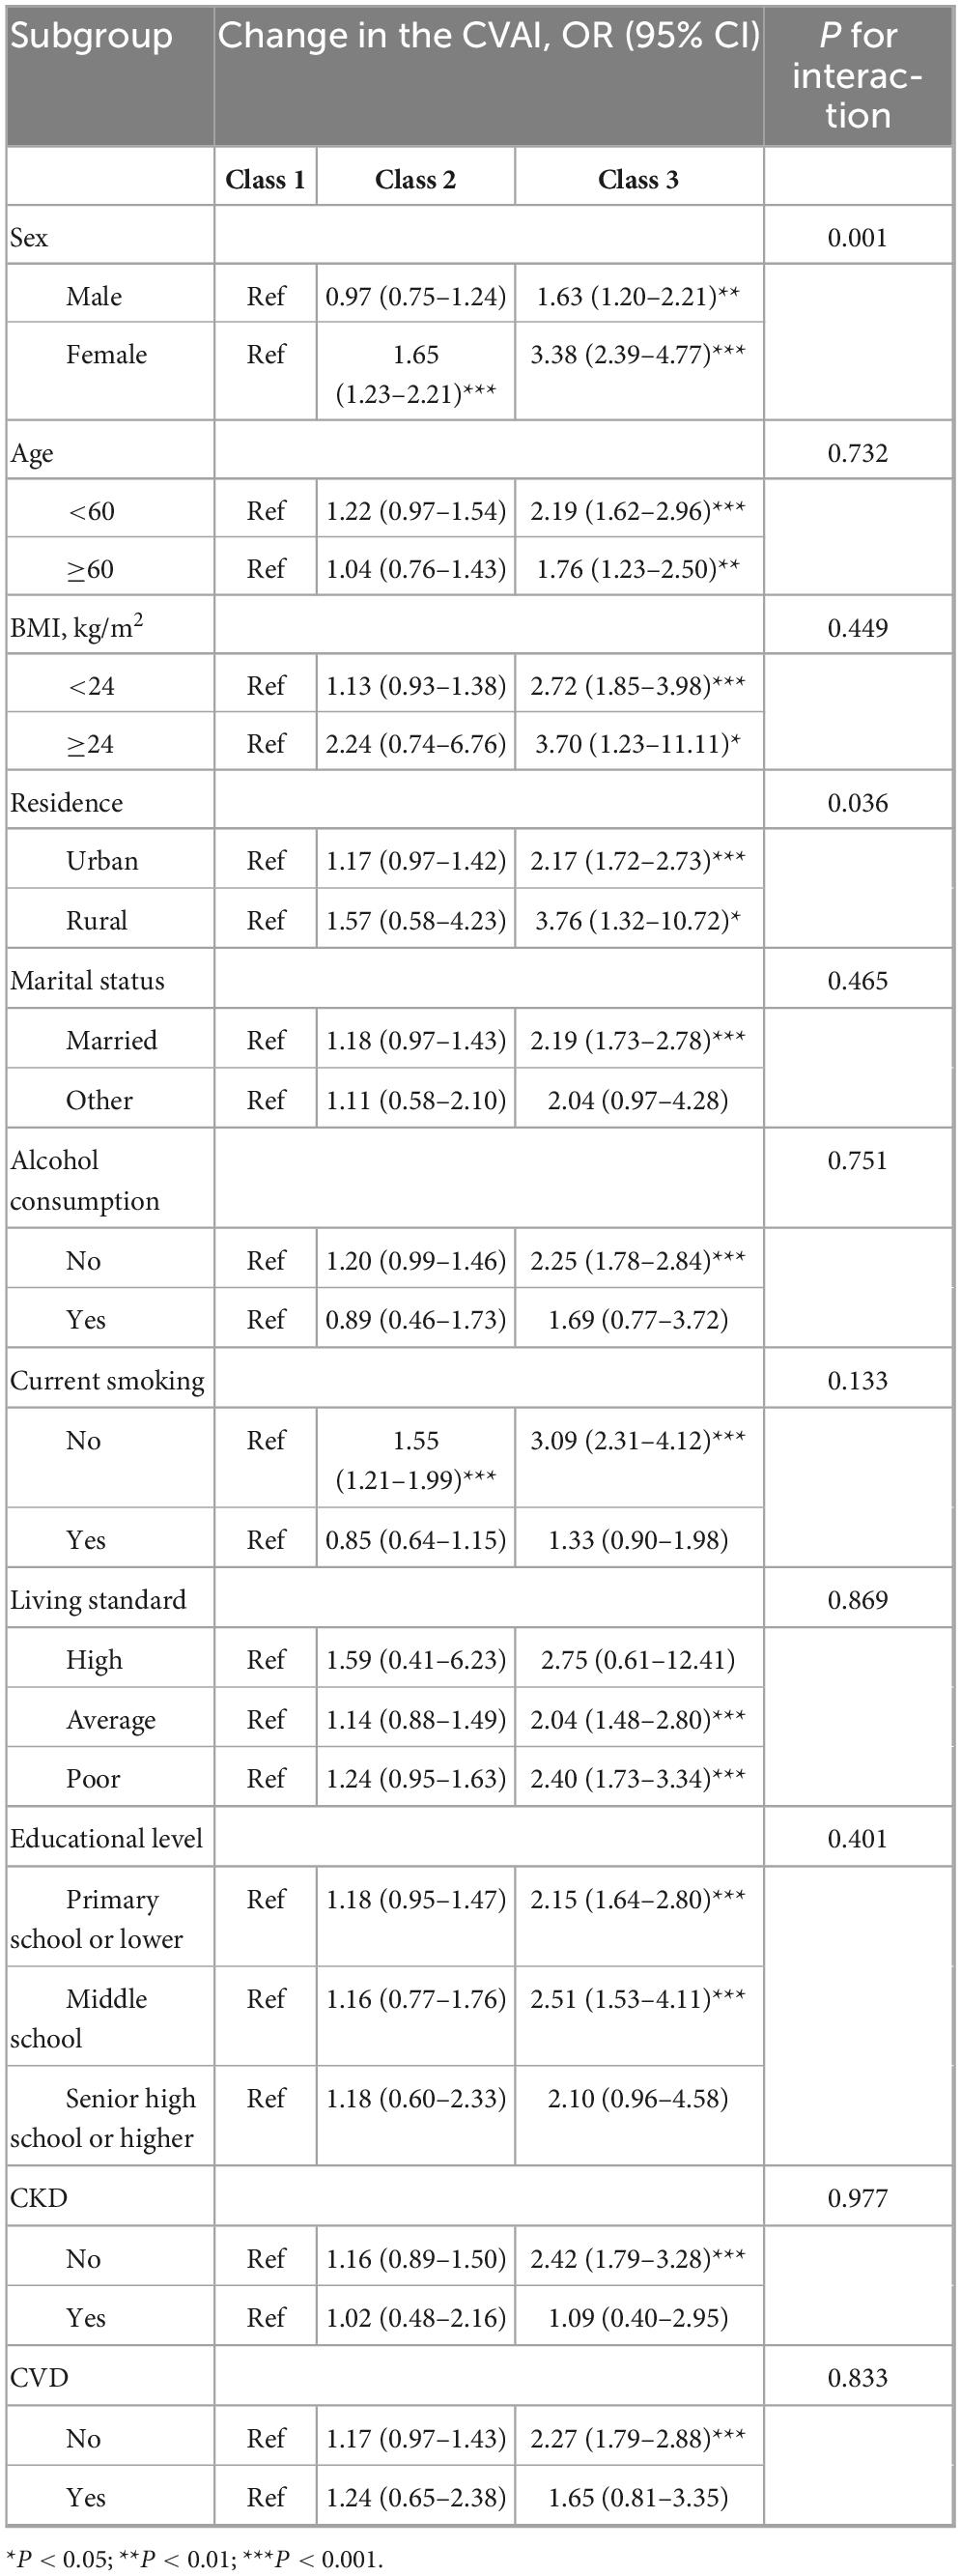
Table 2. Stratified associations between different classes of change in CVAI and hypertension incidence.
Baseline adiposity indices and risk of hypertension and comorbidities
The risk of hypertension (HTN) and comorbidities was significantly related to the increasing quartiles of BRI, LAP, WC, WHtR, and BMI. HTN risk was also increased with per-SD increase in BRI, LAP, WC, WHtR, and BMI, the corresponding HRs for HTN with per-SD increase were 1.17 (95% CI, 1.07–1.27) for BRI, 1.15 (95% CI, 1.06–1.25) for LAP, 1.13 (95% CI, 1.05–1.21) for WC, 1.13 (95% CI, 1.05–1.22) for WHtR, 1.36 (95% CI, 1.28–1.44) for BMI (Supplementary Figure S3).
Discussion
The current study found that the CVAI levels and its longitudinal trajectories were significantly positively associated with HTN and its co-morbidities in a middle-aged and elderly Chinese population. The higher CVAI and trajectory class were associated with higher risks of HTN and co-morbidities, and CVAI was non-linearly associated with the risk of HTN-OW and HTN-MET over the nearly 8-year follow-up period, and these associations were independent of BMI. The CVAI exerted a superior predictability to the risk of HTN-OW and HTN-MET over the future follow-up period. Meanwhile, the findings suggested that CVAI was in a stable dynamic between 2012 and 2015, and that the risks of HTN and co-morbidities were higher in the persistently high-level CVAI compared to the low-level population.
The VAI was created using an empirical mathematical model based on the BMI and WC, as well as lipid levels of HDL-C, and TG, which was strongly related to visceral fat distribution and validated through CT scans (12). Meanwhile, the CVAI was more correlated with HTN, T2DM, and CVD than traditional obesity indicators such as BMI, WC, and WHtR (16). In the HTN study, it was found that per 1 SD increase in CVAI after adjusting for confounders, the risks of HTN were over by 9% and 14% in men and women, respectively. The CVAI had a better predictive ability than both WC and BMI in hypertension (31). In addition, compared to the lowest quartile group, the highest quartile group of modified CVAI had a 1.747-fold higher risk of prehypertension and a 2.475-fold higher risk of hypertension in a cross-sectional study involving over 30,000 participants (32). However, studies have not explored the trajectory of CVAI in relation to HTN risk and have not examined the relationship with more complex HTN co-morbidities. Our study explored their prospective and longitudinal associations with HTN and its comorbidities using baseline CVAI and two repeated-measures trajectories of CVAI change, respectively. Those findings provided a better understanding to the association between CVAI and HTN in terms of temporal change.
In addition, CVAI was significantly associated with advanced cardiovascular events in Chinese population, with better predictive ability than LAP, VAI, WC, and BMI (33). Participants in quartiles (Q) 1-4 of CVAI had stroke occurrences of 4.42, 7.29, 9.06, and 13.04%, respectively. According to the fully adjusted model, the risk of incident stroke increases significantly with each 1.0-SD increase in CVAI (34). Poor glycemic control, dyslipidemia, and raised triglyceride-glucose index and its derivatives were observed in female T2DM patients with elevated VAI, indicating that VAI is a strong predictor of glycemic control status (35). Therefore, VAI and CVAI can offer crucial information for early cardiovascular disease screening and intervention as an indication that reflects the role of visceral adiposity.
Visceral fat was linked to insulin resistance and hyperinsulinemia, and was considered as an important indicator for advanced CVD (36). The alterations in hormone levels may affect renal sodium reabsorption and sympathetic nerve activity, thereby leading to elevated blood pressure (37). Additionally, visceral fat was also related to the secretion of epinephrine and norepinephrine, hormones that can cause vasoconstriction and increase blood pressure (38). Visceral adipose tissue was considered an important endocrine organ that secretes a variety of cytokines and adipokines, such as tumor necrosis factor-α (TNF-α) and interleukin-6 (IL-6) (39). These inflammatory mediators can trigger a systemic inflammatory response that leads to vascular endothelial dysfunction and promotes atherosclerosis, thereby increasing the risk of hypertension (40).
Study strengths and limitations
The current study exhibits several noteworthy strengths that enhance its contributions to the understanding of the relationship between the CVAI and hypertension. Firstly, the study not only examines the relationship between CVAI and hypertension but also explores its association with various comorbidities, including HTN-OW, HTN-MET, and HTN-DM. This multi-faceted approach provides a holistic view of how visceral adiposity influences overall cardiovascular health, making the findings particularly relevant for comprehensive patient care. Additionally, the longitudinal design, with multiple follow-up assessments, allows for the examination of temporal changes in CVAI and strengthens causal inferences about its association with hypertension and its comorbidities. Furthermore, the focus on a middle-aged and elderly population addresses a critical demographic at heightened risk for hypertension and related conditions. The findings underscore the potential clinical utility of CVAI as a biomarker for risk assessment and intervention strategies aimed at preventing cardiometabolic diseases.
Despite these strengths, the study has limitations. The reliance on self-reported data may introduce recall bias, affecting result validity. Additionally, while the sample is substantial, its specific demographic context may limit generalizability to other populations, as lifestyle and genetic factors can vary. The association of CVAI with hypertension and its cardiometabolic complications, as well as its predictive efficacy, requires further replication and validation in diverse populations with varying ethnicities, dietary habits, and climatic backgrounds. Furthermore, the study may not adequately control unmeasured confounders, such as psychosocial and environmental influences. Lastly, focusing solely on CVAI as a predictor may overlook interactions with other adiposity measures.
Conclusion
In conclusion, the current study elucidated the prospective associations between CVAI and its trajectories with HTN and the comorbidities among the middle-aged and elderly adults in China. Higher levels of CVAI were positively associated with an increased risk of HTN and comorbidities, and their association may also remain consistent across time-series changes. These results underscore the potential utility of CVAI as a critical tool for clinical assessment and risk stratification in the management of HTN and comorbidities. Nevertheless, it is imperative that future research endeavors validate these findings across diverse populations and further investigate the underlying mechanisms linking CVAI to HTN and its comorbidities.
Data availability statement
The datasets presented in this study can be found in online repositories. The names of the repository/repositories and accession number(s) can be found in the article/Supplementary material.
Ethics statement
The studies involving humans were approved by the institutional review board of Peking University. The studies were conducted in accordance with the local legislation and institutional requirements. Written informed consent for participation in this study was provided by the participants’ legal guardians/next of kin.
Author contributions
JX: Conceptualization, Data curation, Project administration, Formal Analysis, Investigation, Methodology, Resources, Software, Supervision, Validation, Visualization, Writing – original draft. YY: Investigation, Validation, Visualization, Writing – review & editing. YH: Investigation, Validation, Writing – review & editing, Methodology. YS: Investigation, Validation, Writing – review & editing, Data curation. XY: Data curation, Investigation, Writing – review & editing, Methodology, Resources. Y-mC: Methodology, Resources, Writing – review & editing, Supervision, Validation. HL: Resources, Supervision, Validation, Writing – review & editing, Funding acquisition, Investigation. XW: Funding acquisition, Writing – review & editing, Conceptualization, Data curation, Project administration.
Funding
The author(s) declare that financial support was received for the research and/or publication of this article. This work was supported by the Joint Funds of Zhejiang Provincial Natural Science. The Foundation of China (Grant No. LHDMZ23H070001), the Zhejiang Province Science and Technology Plan Project (Grant No. 2021R52022), the Zhejiang Province Health Innovative Talents Project (Grant No. 2021-CXRC07-01), and the Natural Science Foundation of Zhejiang Province (Grant No. LZ24H310002).
Acknowledgments
We thank all the members of CHALRS for their contributions and the participants who contributed their data.
Conflict of interest
The authors declare that the research was conducted in the absence of any commercial or financial relationships that could be construed as a potential conflict of interest.
Generative AI statement
The authors declare that no Generative AI was used in the creation of this manuscript.
Publisher’s note
All claims expressed in this article are solely those of the authors and do not necessarily represent those of their affiliated organizations, or those of the publisher, the editors and the reviewers. Any product that may be evaluated in this article, or claim that may be made by its manufacturer, is not guaranteed or endorsed by the publisher.
Supplementary material
The Supplementary Material for this article can be found online at: https://www.frontiersin.org/articles/10.3389/fnut.2025.1557868/full#supplementary-material
Abbreviations
BMI, body mass index; BUN, blood urea nitrogen; CHARLS, China health and retirement longitudinal study; CVAI, Chinese visceral adiposity index; DBP, diastolic blood pressure; eGFR, estimated glomerular filtration rate; FPG, Fasting plasma glucose; CRP, C reactive protein; HDL-C, high-density lipoproteins cholesterol; HBA1c, hemoglobin A1c; HCT, Hematocrit; LAP, lipid accumulation product; LDL-C, low-density lipoproteins cholesterol; MAP, mean Arterial Pressure; MCV, mean corpuscular volume; SBP, systolic blood pressure; Scr, serum creatinine; TC, total cholesterol; TG, triglyceride; TyG, triglyceride-glucose index; TyG-WC, triglyceride-glucose waist circumference; TyG-BMI, triglyceride-glucose body mass index; TyG-WHtR, triglyceride-glucose waist-to-height ratio; UA, uric acid; VAI, visceral adiposity index; WC, waist circumference; WHtR, waist-to-height ratio; WBC, white blood cell count; SD, standard deviation.
Footnotes
footnote. ^1http://charls.pku.edu.cn/
References
1. Mills K, Stefanescu A, He J. The global epidemiology of hypertension. Nat Rev Nephrol. (2020) 16:223–37. doi: 10.1038/s41581-019-0244-2
2. Wang J, Zhang W, Li Y, Liu L. Hypertension in China: Epidemiology and treatment initiatives. Nat Rev Cardiol. (2023) 20:531–45. doi: 10.1038/s41569-022-00829-z
3. Zhang X, Lu J, Yang Y, Cui J, Zhang X, Xu W, et al. Cardiovascular disease prevention and mortality across 1 million urban populations in China: Data from a nationwide population-based study. Lancet Public Health. (2022) 7:e1041–50. doi: 10.1016/s2468-2667(22)00170-0
4. Mills K, Bundy J, Kelly T, Reed J, Kearney P, Reynolds K, et al. Global disparities of hypertension prevalence and control: A systematic analysis of population-based studies from 90 Countries. Circulation. (2016) 134:441–50. doi: 10.1161/circulationaha.115.018912
5. Agrawal S, Klarqvist M, Diamant N, Stanley T, Ellinor P, Mehta N, et al. BMI-adjusted adipose tissue volumes exhibit depot-specific and divergent associations with cardiometabolic diseases. Nat Commun. (2023) 14:266. doi: 10.1038/s41467-022-35704-5
6. Mina T, Xie W, Low D, Wang X, Lam B, Sadhu N, et al. Adiposity and metabolic health in Asian populations: An epidemiological study using dual-energy x-ray absorptiometry in Singapore. Lancet Diabetes Endocrinol. (2024) 12:704–15. doi: 10.1016/s2213-8587(24)00195-5
7. Rao V, Bush C, Mongraw-Chaffin M, Hall M, Clark D III, Fudim M, et al. Regional adiposity and risk of heart failure and mortality: The Jackson Heart Study. J Am Heart Assoc. (2021) 10:e020920. doi: 10.1161/jaha.121.020920
8. Shi J, Bao G, Hong J, Wang S, Chen Y, Zhao S, et al. Deciphering CT texture features of human visceral fat to evaluate metabolic disorders and surgery-induced weight loss effects. EBioMedicine. (2021) 69:103471. doi: 10.1016/j.ebiom.2021.103471
9. Zeng Q, Wang L, Dong S, Zha X, Ran L, Li Y, et al. CT-derived abdominal adiposity: Distributions and better predictive ability than BMI in a nationwide study of 59,429 adults in China. Metabolism. (2021) 115:154456. doi: 10.1016/j.metabol.2020.154456
10. Hauser J, Burden S, Karunakaran A, Muthurangu V, Taylor A, Jones A. Whole-body magnetic resonance imaging assessment of the contributions of adipose and nonadipose tissues to cardiovascular remodeling in adolescents. J Am Heart Assoc. (2023) 12:e030221. doi: 10.1161/jaha.123.030221
11. Jayedi A, Soltani S, Motlagh S, Emadi A, Shahinfar H, Moosavi H, et al. Anthropometric and adiposity indicators and risk of type 2 diabetes: Systematic review and dose-response meta-analysis of cohort studies. Bmj. (2022) 376:e067516. doi: 10.1136/bmj-2021-067516
12. Amato M, Giordano C, Galia M, Criscimanna A, Vitabile S, Midiri M, et al. Visceral adiposity index: A reliable indicator of visceral fat function associated with cardiometabolic risk. Diabetes Care. (2010) 33:920–2. doi: 10.2337/dc09-1825
13. Wu X, Wang C, Lv D, Chen B, Wu Y, Wu X, et al. Associations between Chinese visceral adiposity index and risks of all-cause and cause-specific mortality: A population-based cohort study. Diabetes Obes Metab. (2024) 26:1264–72. doi: 10.1111/dom.15424
14. Wan H, Wang Y, Xiang Q, Fang S, Chen Y, Chen C, et al. Associations between abdominal obesity indices and diabetic complications: Chinese visceral adiposity index and neck circumference. Cardiovasc Diabetol. (2020) 19:118. doi: 10.1186/s12933-020-01095-4
15. Liu L, Peng J, Zang D, Zhang Y, Wu Z, Song C, et al. The Chinese visceral adiposity index: A novel indicator more closely related to cardiovascular disease than other abdominal obesity indices among postmenopausal women. J Transl Med. (2024) 22:855. doi: 10.1186/s12967-024-05665-y
16. Han M, Qin P, Li Q, Qie R, Liu L, Zhao Y, et al. Chinese visceral adiposity index: A reliable indicator of visceral fat function associated with risk of type 2 diabetes. Diabetes Metab Res Rev. (2021) 37:e3370. doi: 10.1002/dmrr.3370
17. Bi H, Zhang Y, Qin P, Wang C, Peng X, Chen H, et al. Association of Chinese visceral adiposity index and its dynamic change with risk of carotid d plaque in a large cohort in China. J Am Heart Assoc. (2022) 11:e022633. doi: 10.1161/jaha.121.022633
18. Qiao T, Luo T, Pei H, Yimingniyazi B, Aili D, Aimudula A, et al. Association between abdominal obesity indices and risk of cardiovascular events in Chinese populations with type 2 diabetes: A prospective cohort study. Cardiovasc Diabetol. (2022) 21:225. doi: 10.1186/s12933-022-01670-x
19. Deng H, Hu P, Li H, Zhou H, Wu X, Yuan M, et al. Novel lipid indicators and the risk of type 2 diabetes mellitus among Chinese hypertensive patients: Findings from the Guangzhou Heart Study. Cardiovasc Diabetol. (2022) 21:212. doi: 10.1186/s12933-022-01660-z
20. Lauder L, Mahfoud F, Azizi M, Bhatt D, Ewen S, Kario K, et al. Hypertension management in patients with cardiovascular comorbidities. Eur Heart J. (2023) 44:2066–77. doi: 10.1093/eurheartj/ehac395
21. Hu Y, Wang Z, He H, Pan L, Tu J, Shan G. Prevalence and patterns of multimorbidity in China during 2002-2022: A systematic review and meta-analysis. Ageing Res Rev. (2024) 93:102165. doi: 10.1016/j.arr.2023.102165
22. Zhao Y, Hu Y, Smith J, Strauss J, Yang G. Cohort profile: The China Health and Retirement Longitudinal Study (CHARLS). Int J Epidemiol. (2014) 43:61–8. doi: 10.1093/ije/dys203
23. Khera R, Lu Y, Lu J, Saxena A, Nasir K, Jiang L, et al. Impact of 2017 ACC/AHA guidelines on prevalence of hypertension and eligibility for antihypertensive treatment in United States and China: Nationally representative cross sectional study. Bmj. (2018) 362:k2357. doi: 10.1136/bmj.k2357
24. American Diabetes Association Professional Practice Committee. 2. Diagnosis and Classification of Diabetes: Standards of care in diabetes-2024. Diabetes Care. (2024) 47:S20–42. doi: 10.2337/dc24-S002
25. Wang L, Zhou B, Zhao Z, Yang L, Zhang M, Jiang Y, et al. Body-mass index and obesity in urban and rural China: Findings from consecutive nationally representative surveys during 2004-18. Lancet. (2021) 398:53–63. doi: 10.1016/s0140-6736(21)00798-4
26. Grundy S, Cleeman J, Daniels S, Donato K, Eckel R, Franklin B, et al. Diagnosis and management of the metabolic syndrome: An American Heart Association/National Heart, Lung, and Blood Institute Scientific Statement. Circulation. (2005) 112:2735–52. doi: 10.1161/circulationaha.105.169404
27. He D, Qiu Y, Yan M, Zhou T, Cheng Z, Li J, et al. Associations of metabolic heterogeneity of obesity with frailty progression: Results from two prospective cohorts. J Cachexia Sarcopenia Muscle. (2023) 14:632–41. doi: 10.1002/jcsm.13169
28. Huo R, Zhai L, Liao Q, You X. Changes in the triglyceride glucose-body mass index estimate the risk of stroke in middle-aged and older Chinese adults: A nationwide prospective cohort study. Cardiovasc Diabetol. (2023) 22:254. doi: 10.1186/s12933-023-01983-5
29. Cui H, Liu Q, Wu Y, Cao L. Cumulative triglyceride-glucose index is a risk for CVD: A prospective cohort study. Cardiovasc Diabetol. (2022) 21:22. doi: 10.1186/s12933-022-01456-1
30. Huang J, Ng M, Rong H, Li Z. Automated variable weighting in k-means type clustering. IEEE Trans Pattern Anal Mach Intell. (2005) 27:657–68. doi: 10.1109/tpami.2005.95
31. Han M, Qie R, Li Q, Liu L, Huang S, Wu X, et al. Chinese visceral adiposity index, a novel indicator of visceral obesity for assessing the risk of incident hypertension in a prospective cohort study. Br J Nutr. (2021) 126:612–20. doi: 10.1017/s0007114520004298
32. Li B, Wang J, Zhou X, Liu Y, Wang W, Gao Z, et al. Chinese visceral adiposity index is more closely associated with hypertension and prehypertension than traditional adiposity indices in Chinese population: Results from the reaction study. Front Endocrinol. (2022) 13:921997. doi: 10.3389/fendo.2022.921997
33. Xie Y, Zhang Y, Qin P, Ping Z, Wang C, Peng X, et al. The association between Chinese Visceral Adipose Index and coronary heart disease: A cohort study in China. Nutr Metab Cardiovasc Dis. (2022) 32:550–9. doi: 10.1016/j.numecd.2021.10.020
34. Zhang Z, Zhao L, Lu Y, Meng X, Zhou X. Association between Chinese visceral adiposity index and risk of stroke incidence in middle-aged and elderly Chinese population: Evidence from a large national cohort study. J Transl Med. (2023) 21:518. doi: 10.1186/s12967-023-04309-x
35. Hameed E, AbdulQahar Z. Visceral adiposity index in female with type 2 diabetic mellitus and its association with the glycemic control. Diabetes Metab Syndr. (2019) 13:1241–4. doi: 10.1016/j.dsx.2019.01.039
36. Huang H, Zheng X, Wen X, Zhong J, Zhou Y, Xu L. Visceral fat correlates with insulin secretion and sensitivity independent of BMI and subcutaneous fat in Chinese with type 2 diabetes. Front Endocrinol. (2023) 14:1144834. doi: 10.3389/fendo.2023.1144834
37. Hall J, do Carmo J, da Silva A, Wang Z, Hall M. Obesity, kidney dysfunction and hypertension: Mechanistic links. Nat Rev Nephrol. (2019) 15:367–85. doi: 10.1038/s41581-019-0145-4
38. Froy O, Garaulet M. The circadian clock in white and brown adipose tissue: Mechanistic, endocrine, and clinical aspects. Endocr Rev. (2018) 39:261–73. doi: 10.1210/er.2017-00193
39. Mikolajczyk T, Szczepaniak P, Vidler F, Maffia P, Graham G, Guzik T. Role of inflammatory chemokines in hypertension. Pharmacol Ther. (2021) 223:107799. doi: 10.1016/j.pharmthera.2020.107799
Keywords: Chinese visceral adiposity index, trajectory analysis, hypertension, comorbidity, prospective cohort study
Citation: Xu J, Yang Y, Hu Y, Song Y, Ye X, Chen Y-m, Li H and Wu X (2025) Associations between dynamic change of Chinese visceral adiposity index and hypertensive co-morbidities in the middle-aged and elderly population: a Chinese prospective cohort study. Front. Nutr. 12:1557868. doi: 10.3389/fnut.2025.1557868
Received: 09 January 2025; Accepted: 20 June 2025;
Published: 09 July 2025.
Edited by:
Abraham Wall-Medrano, Universidad Autónoma de Ciudad Juárez, MexicoReviewed by:
Miguel Murguía-Romero, National Autonomous University of Mexico, MexicoHan Yan, Zhejiang University, China
Raushan Kumar, ERA’s Lucknow Medical College, India
Copyright © 2025 Xu, Yang, Hu, Song, Ye, Chen, Li and Wu. This is an open-access article distributed under the terms of the Creative Commons Attribution License (CC BY). The use, distribution or reproduction in other forums is permitted, provided the original author(s) and the copyright owner(s) are credited and that the original publication in this journal is cited, in accordance with accepted academic practice. No use, distribution or reproduction is permitted which does not comply with these terms.
*Correspondence: Hanbing Li, aGFubmliYWxsZWVAemp1dC5lZHUuY24=; Xiaohong Wu, ZHJ4aHd1QG5qbXUuZWR1LmNu
†ORCID: Jinjian Xu, orcid.org/0009-0002-7625-6187; Yingdi Yang, orcid.org/0000-0001-6816-2653; Yu-ming Chen, orcid.org/0000-0003-1658-5528; Hanbing Li, orcid.org/0000-0003-3873-4061; Xiaohong Wu, orcid.org/0000-0001-5984-3342