 Xiaoqiang Liu1†
 Xiaobo Liu2†
 Yingxuan Huang1
 Chanchan Lin1
 Xinqi Chen1
 Yingyi Li1
 Yisen Huang1*
 Yubin Wang1*
- 1Department of Gastroenterology, First Hospital of Quanzhou Affiliated to Fujian Medical University, Quanzhou, China
- 2McConnell Brain Imaging Centre, Montreal Neurological Institute, McGill University, Montreal, QC, Canada
Objectives: Growing attention has been paid to the relationship between the gut microbiota and diarrhea. A recently proposed Dietary Index for Gut Microbiota (DI-GM) reflects the overall dietary quality as it pertains to gut microbiota diversity. However, evidence regarding the association between DI-GM and diarrhea is still lacking. This study aims to investigate the association between DI-GM and the risk of diarrhea.
Methods: A total of 15,590 adults (≥20 years old) from National Health and Nutrition Examination Survey (NHANES) 2005–2010 were included in this analysis. Diarrhea was defined by self-reported common Bristol Stool Form Scale (BSFS) type 6 or 7, or more than three bowel movements per day. DI-GM comprises 14 food/nutrient components known to be associated with gut microbiota. A higher score indicates a more favorable diet for the gut microbiota. Multivariable logistic regression was used to evaluate the association between DI-GM and diarrhea, with subgroup and sensitivity analyses performed to confirm robustness.
Results: After adjusting for age, gender, race, physical activity, chronic diseases, and other confounders, each 1-point increase in DI-GM was associated with a 5% reduction in diarrhea risk (adjusted OR = 0.95, 95% CI: 0.91–0.98, p = 0.005). Compared with those who had a DI-GM score of 0–3, individuals with a DI-GM score ≥ 6 demonstrated a significantly lower risk of diarrhea (OR = 0.77, 95% CI: 0.65–0.91, p = 0.002). Subgroup and sensitivity analyses further supported this negative association. Notably, the “beneficial component” was found to have a more pronounced effect on reducing diarrhea risk.
Conclusion: Based on a large representative population, our findings suggest that a higher DI-GM score is significantly associated with a lower risk of diarrhea, underscoring the importance of overall dietary patterns in maintaining gut function and homeostasis.
1 Introduction
Diarrhea is a common gastrointestinal symptom and a global public health concern, with etiologies ranging from infections and medications to metabolic abnormalities. According to the World Health Organization, diarrhea remains one of the leading causes of morbidity and mortality worldwide, particularly in low- and middle-income countries, although it also poses a significant clinical burden in developed regions (1). Epidemiological data indicate that up to 3–5% of adults in the general population report frequent diarrhea symptoms, and it is also frequently observed in functional bowel disorders such as irritable bowel syndrome (IBS) (2–4). Although multiple interventions exist to alleviate diarrhea, clinical outcomes and recurrence rates still vary considerably among individuals (5). With recent advances in microbiome research, the critical role of gut microbiota in intestinal homeostasis, immune modulation, and the onset and progression of diarrhea has gained increasing attention (6–8).
Existing studies have shown that diet is a key exogenous factor influencing gut microbiota composition and activity (9, 10). High-fiber diets, probiotics, and fermented dairy products can promote the proliferation of beneficial gut microbes and improve intestinal barrier function, thereby lowering the risk of diarrhea (11, 12). In contrast, excessive intake of red meat, refined sugars, and high-fat foods can disturb gut microbiota stability, increase intestinal permeability, and ultimately lead to inflammation or diarrhea (13, 14). Despite some success in interventions targeting single nutrients or specific foods, the multifaceted and complex relationship between dietary structure and the gut microbiota remains insufficiently quantified (15).
To address this gap, Kase et al. introduced a new dietary quality assessment metric in 2024—the Dietary Index for Gut Microbiota (DI-GM) (16). DI-GM integrates various foods and nutrients closely associated with gut microbiota health, encompassing beneficial items (e.g., high-fiber, fermented dairy, whole grains) and unfavorable components (e.g., high-fat, red meat, processed meats). This index aims to capture the potential impacts of overall dietary patterns on gut microbiota diversity and function. Some recent research based on the National Health and Nutrition Examination Survey (NHANES) population in the United States has linked higher DI-GM scores to lower risk of chronic diseases like diabetes and functional bowel disorders such as constipation (17, 18). However, whether a similar association exists between DI-GM and diarrhea remains unexplored.
Accordingly, using large-scale cross-sectional data from NHANES 2005–2010, the present study aimed to investigate, for the first time, the association between DI-GM and diarrhea. We hypothesized that, after adjusting for demographic characteristics, lifestyle factors, and other common chronic conditions, higher DI-GM scores would be associated with lower diarrhea risk. By analyzing a large, diverse population, this study seeks to provide insights that may inform clinical prevention and management strategies for diarrhea through dietary modulation of the gut microbiota.
2 Methods
2.1 Data source
This study was based on data from the 2005–2010 NHANES, a nationally representative cross-sectional survey of the non-institutionalized U.S. population. NHANES employs a complex, multistage probability sampling method to collect health, nutrition, and demographic data. All data used in this study are publicly available.1 Ethical approval was obtained from the National Center for Health Statistics Research Ethics Review Board, and all participants provided informed consent. The reporting of this study followed the Strengthening the Reporting of Observational Studies in Epidemiology (STROBE) guidelines (19).
2.2 Study design and participants
We included adults aged ≥20 years from NHANES 2005–2010. Exclusion criteria encompassed the presence of constipation, a confirmed diagnosis of colorectal cancer, ulcerative colitis, or Crohn’s disease, lack of a DI-GM score, absence of Bowel Health Questionnaire data, or insufficient essential covariate information. A total of 15,590 eligible participants were finally included in the analysis, of whom 1,498 were classified as having diarrhea and 14,092 as without diarrhea (Figure 1).
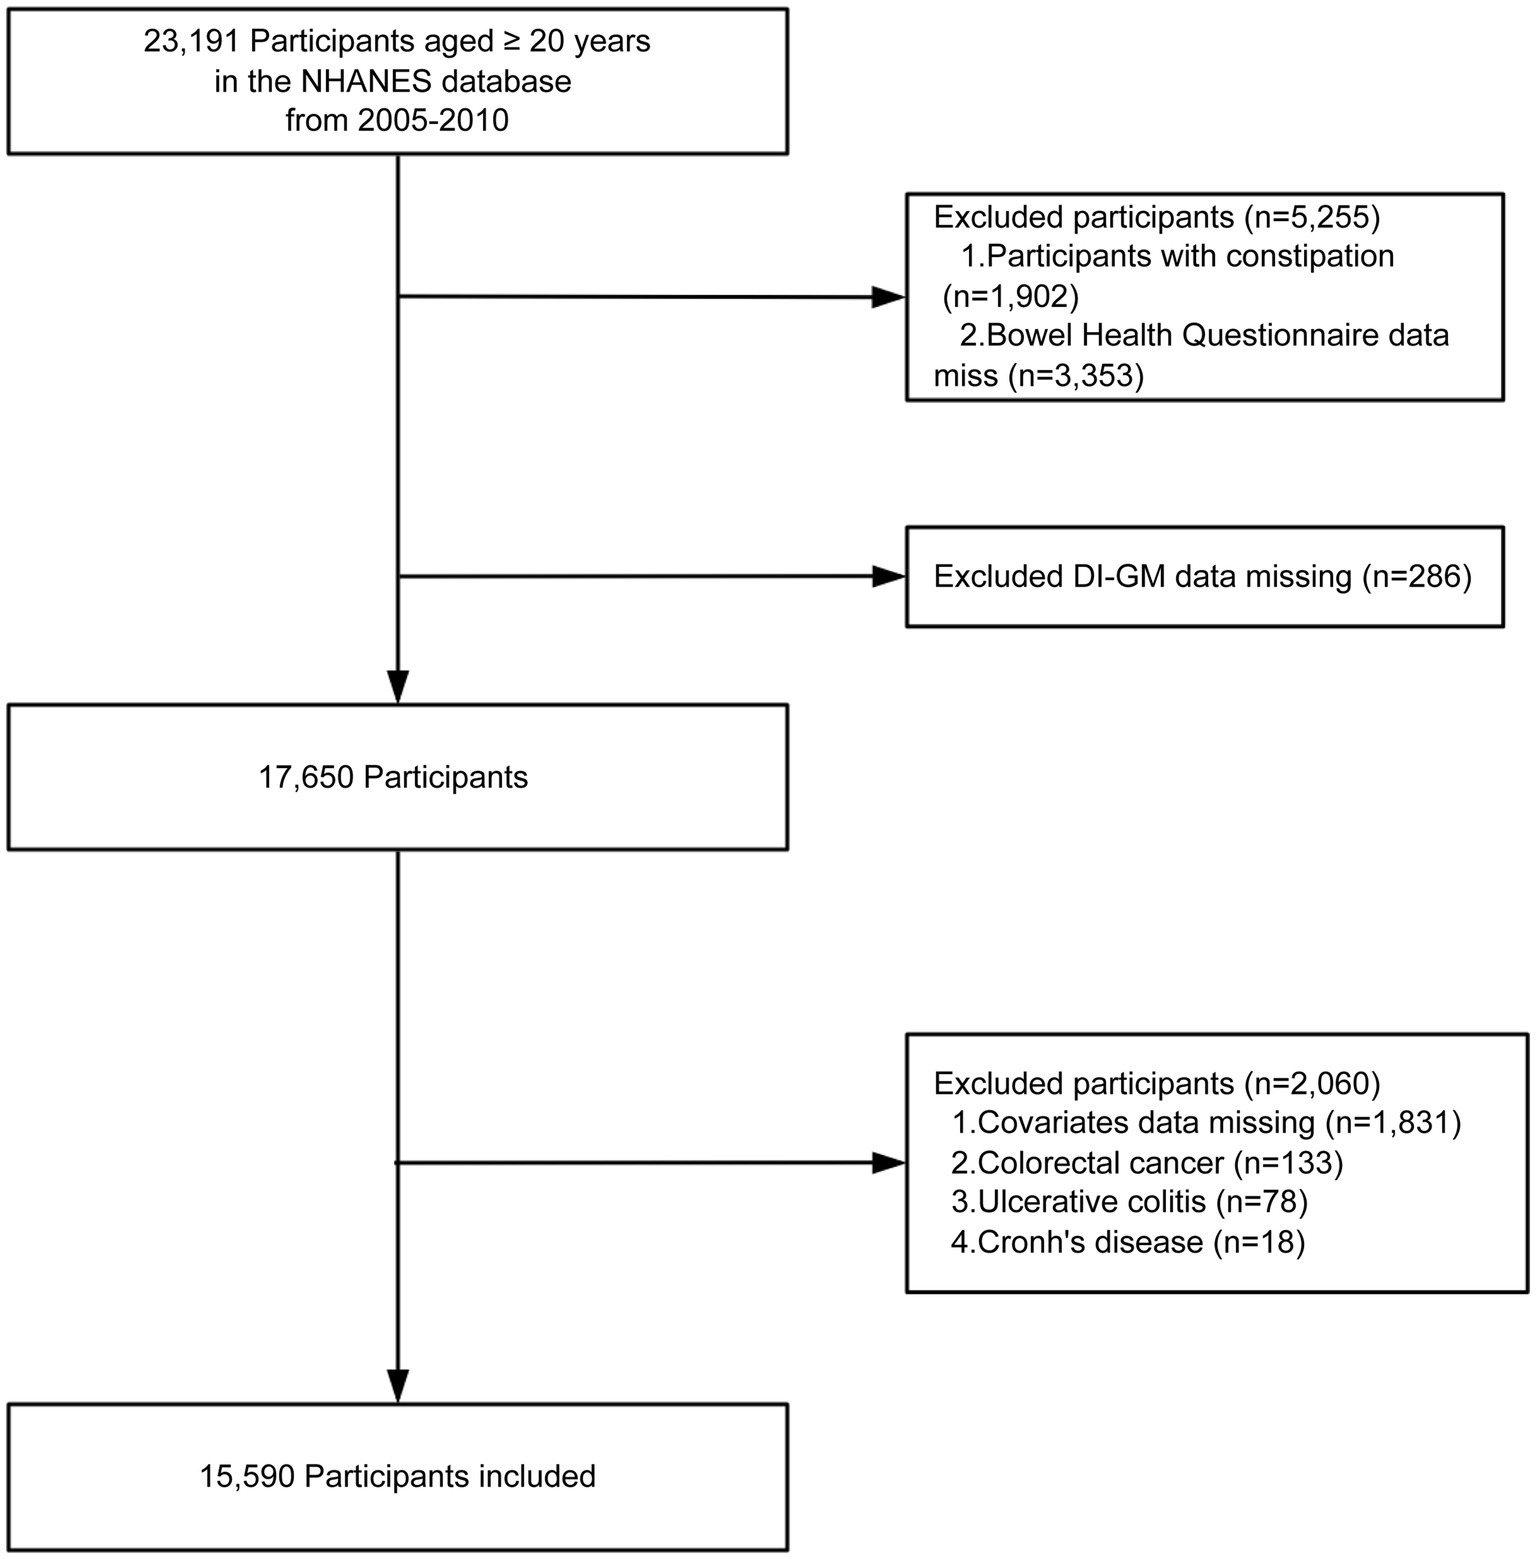
Figure 1. Flow chart of the screening of the NHANES 2005–2010 participants. DI-GM, dietary index for gut microbiota.
2.3 Definition of diarrhea
Diarrhea was defined based on responses to the Bowel Health Questionnaire administered via computer-assisted personal interviews (CAPI) in mobile examination centers (MEC). Participants were shown a color card illustrating the seven types of the Bristol Stool Form Scale (BSFS, Types 1–7) and were asked: “Please look at this card and tell me the number of the stool type that best fits your usual or common stool form.” Consistent with previous studies, chronic diarrhea was defined as self-reported usual stool types corresponding to BSFS Type 6 (fluffy pieces with ragged edges) or Type 7 (watery, no solid pieces). Chronic constipation was defined as BSFS Type 1 (separate hard lumps like nuts) or Type 2 (sausage-shaped but lumpy). Participants who did not meet these criteria were classified as having normal bowel habits (20, 21). To assess stool frequency, participants were asked, “How many times a week do you usually have a bowel movement?” In this study, individuals reporting two or fewer bowel movements per week were classified as having constipation, whereas diarrhea was defined as more than three bowel movements per day (22). Participants who had used laxatives within the past month were excluded. For the purposes of analysis, participants who met either the stool form based or stool frequency based criterion for diarrhea were classified as having diarrhea. Conversely, participants who did not meet either the stool form based or stool frequency based criteria for diarrhea or constipation were classified as having normal bowel habits.
2.4 Assessment of the dietary index for gut microbiota
The Dietary Index for DI-GM is a novel diet quality index developed to capture the potential impact of dietary components on gut microbiota diversity (16). It comprises 14 foods and nutrients theoretically linked to gut microbiota health, including 10 “beneficial” components (avocado, broccoli, chickpeas, coffee, cranberries, fermented dairy products, fiber, green tea, soy, and whole grains) and 4 “unfavorable” components (red meat, processed meat, refined grains, and a high-fat diet, defined as ≥40% of total energy from fat). However, because NHANES does not differentiate green tea from other teas, that component could not be scored in our analyses. As a result, we ultimately used 13 components to derive the total DI-GM score.
Each food/nutrient is scored based on sex-specific median intake. Participants receive 1 point if intake of beneficial components is above the median (or if fat intake is below 40% for the high-fat diet component), and 0 points otherwise. Conversely, participants receive 1 point if unfavorable components are below the median, and 0 points otherwise. The components along with scoring criteria for the DI-GM can be found in Supplementary Table 1. Total DI-GM scores range from 0 to 13. Higher scores indicate a diet more likely to benefit the gut microbiota. Based on prior research and a quartile-based approach, DI-GM scores were categorized into four groups: 0–3, 4, 5, and ≥6 (23).
2.5 Covariates
Based on previous studies and clinical judgment (20, 24), we adjusted for a range of potential confounders, including age, gender, race, marital status, education level, poverty-to-income ratio (PIR), physical activity, smoking status, alcohol use, body mass index (BMI), total energy intake, diabetes, cardiovascular disease (CVD), hypertension, hyperlipidemia, and depression. Age was treated as a continuous variable. Gender referred to biological sex. Race was categorized as non-Hispanic White and “Other” (non-Hispanic Black, Mexican American, other Hispanic, and other races). Marital status was classified as married/living with partner versus unmarried/other (including widowed, divorced, or separated). Education level was categorized as <High school, High school/equivalent, and >High school. PIR was grouped as 1–1.3, 1.31–3.50, and >3.50 (25). Physical activity was categorized based on the time (MET-min/week) spent walking, bicycling, working, and recreational activities: inactive (0 MET-min/week), insufficiently active (1–599 MET-min/week), and sufficiently active (≥600 MET-min/week) (26). Smoking status was defined as never smokers (<100 cigarettes in lifetime), former smokers (≥100 cigarettes in lifetime but currently not smoking), or current smokers (≥100 cigarettes in lifetime and currently smoking) (27). Alcohol intake was categorized as never (lifetime <12 drinks), former (≥12 drinks in a given year but none in the past year, or no drinking in the past year but ≥12 drinks in a lifetime), or current drinkers (≥12 drinks in any year and drank in the past year) (28). BMI was calculated as weight (kg) divided by height squared (m2). Total energy intake was determined using the first 24 h dietary recall data (DR1TOT) from the NHANES. NHANES uses the Automated Multiple Pass Method (AMPM), an interviewer administered 24 h recall procedure that systematically captures all foods and beverages consumed from midnight to midnight the previous day. The reported foods are then coded, and total nutrient intakes, including kilocalories, are calculated, with DR1TOT representing total energy intake. Diabetes was defined by laboratory tests (HbA1c ≥ 6.5%, fasting plasma glucose ≥7.0 mmol/L, random/2-h OGTT glucose ≥11.1 mmol/L) and/or physician diagnosis or use of antidiabetic medication/insulin (29). CVD was based on self-reported physician diagnoses of coronary heart disease, angina, stroke, heart attack, or congestive heart failure. Hypertension was defined by systolic BP ≥140 mmHg and/or diastolic BP ≥90 mmHg, self-reported physician diagnosis, or use of antihypertensive medication (27). Hyperlipidemia was identified if any of the following criteria were met: use of lipid-lowering drugs, high triglycerides (≥150 mg/dL), or high cholesterol (total cholesterol ≥200 mg/dL, LDL ≥130 mg/dL, or HDL <40 mg/dL) (30). Depression was screened via the PHQ-9 questionnaire. A PHQ-9 score ≥ 10 was defined as depression (31).
2.6 Statistical analysis
All statistical analyses were performed using R (version 4.2.3) and Free Statistics software (version 1.9.2). Statistical significance was defined as a two-sided P-value < 0.05. Continuous variables were expressed as mean ± standard deviation (SD) for normally distributed data or as median (interquartile range) for skewed data. Categorical variables were described as counts (percentages). Between-group differences were compared using the independent samples t-test, chi-square test, and Mann–Whitney U test, as appropriate.
To assess the association between DI-GM and diarrhea, we constructed multivariable logistic regression models to estimate odds ratios (OR) and 95% confidence intervals (CI). The covariates included in the model were determined based on clinical expertise, univariate screening results (P-value < 0.05), or whether they led to a change in the effect estimate >10%. Model 1 adjusted for age and gender; Model 2 further included race, marital status, education level, PIR, physical activity, smoking status, alcohol intake, BMI, total calories intake, diabetes, CVD, hypertension, hyperlipidemia, and depression. We also categorized DI-GM into four groups (0–3, 4, 5, ≥6) to examine potential dose–response relationships. Restricted cubic spline (RCS) analyses with three knots (at the 10th, 50th, and 90th percentiles of DI-GM) were used to explore possible nonlinear associations. Subgroup analyses were conducted by stratifying participants according to age, gender, race, CVD, hypertension, hyperlipidemia, diabetes, and depression status, to test consistency across different population subgroups. For sensitivity analysis, multiple imputation by chained equations was used to handle missing values. Five imputed datasets were generated, and results were combined using Rubin’s rules (32).
3 Results
3.1 Baseline characteristics
Table 1 presents the basic characteristics of the study population. Among the 15,590 participants, 1,498 had diarrhea and 14,092 did not. The average age in the diarrhea group was 52.8 years (SD 16.4), which was significantly higher than the 49.4 years (SD 17.7) in the without diarrhea group (p < 0.001). The proportion of females was also higher in the diarrhea group than in the without diarrhea group (56.1% vs. 43.9%, p < 0.001). In addition, the diarrhea group had higher proportions of lower income (PIR ≤ 1.3), and lower education levels (all p < 0.001). The mean BMI in the diarrhea group was higher compared to the without diarrhea group (30.8 vs. 29.1 kg/m2, p < 0.001). Regarding diet, both total energy intake (2058.3 kcal vs. 2147.9 kcal, p = 0.001) and DI-GM scores (4.4 vs. 4.5, p < 0.001) were significantly lower in the diarrhea group compared to the without diarrhea group.
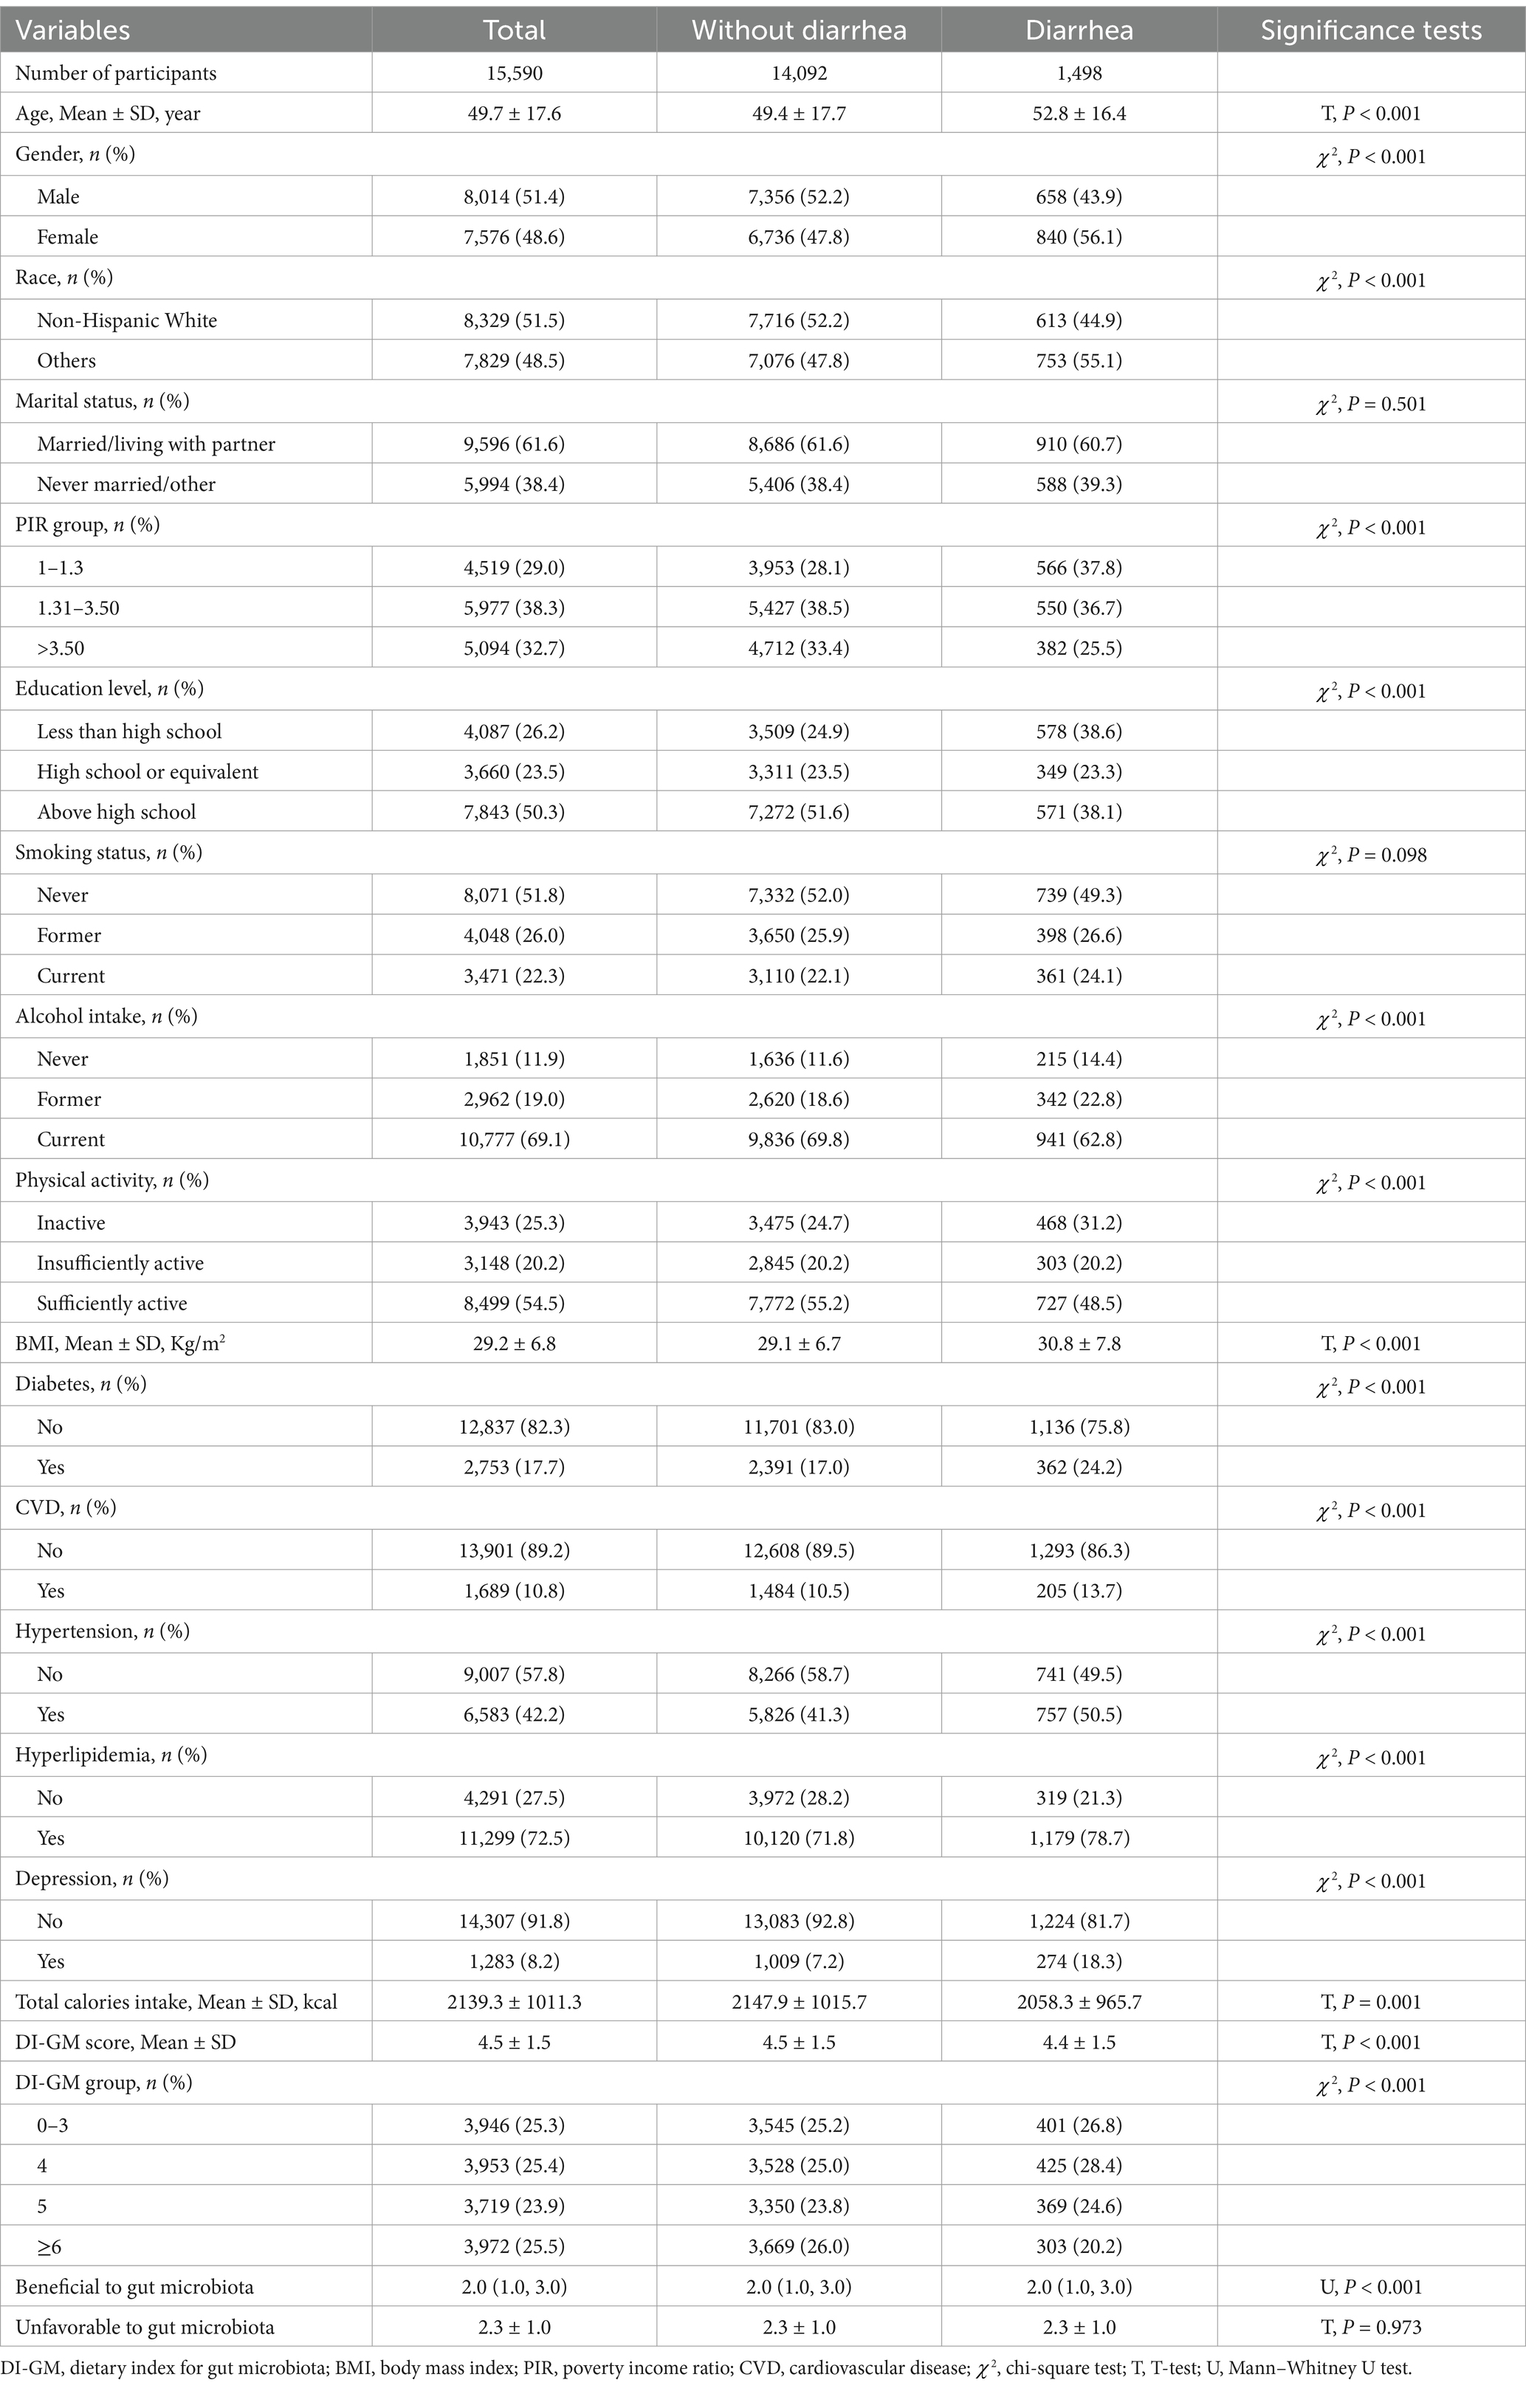
Table 1. Characteristics of the NHANES 2005–2010 participants.
3.2 Association between DI-GM and diarrhea
Multivariable logistic regression analysis (Table 2) demonstrated that each 1-point increase in DI-GM was associated with a 5% reduction in diarrhea risk (adjusted OR = 0.95, 95% CI: 0.91–0.98, p = 0.005) after full covariate adjustment. Further, subgroup analyses by DI-GM categories showed that individuals with DI-GM ≥6 had a markedly lower diarrhea risk compared with those scoring 0–3 (OR = 0.77, 95% CI: 0.65–0.91, p = 0.002). Trend testing also confirmed a significant negative correlation between DI-GM and diarrhea (p = 0.010). When the dietary components were separated into “beneficial score” and “unfavorable score,” we found that each 1-point increase in the beneficial score was associated with further reductions in diarrhea risk (OR = 0.91, 95% CI: 0.87–0.96, p < 0.001), whereas the unfavorable components did not show a similarly robust association in this model. The RCS analysis (Figure 2) indicated a significant nonlinear relationship between beneficial score and diarrhea risk (p = 0.039). In contrast, the association between the total DI-GM and diarrhea appeared linear (p = 0.062), and no notable nonlinear relationship was observed for the unfavorable score (p = 0.073).
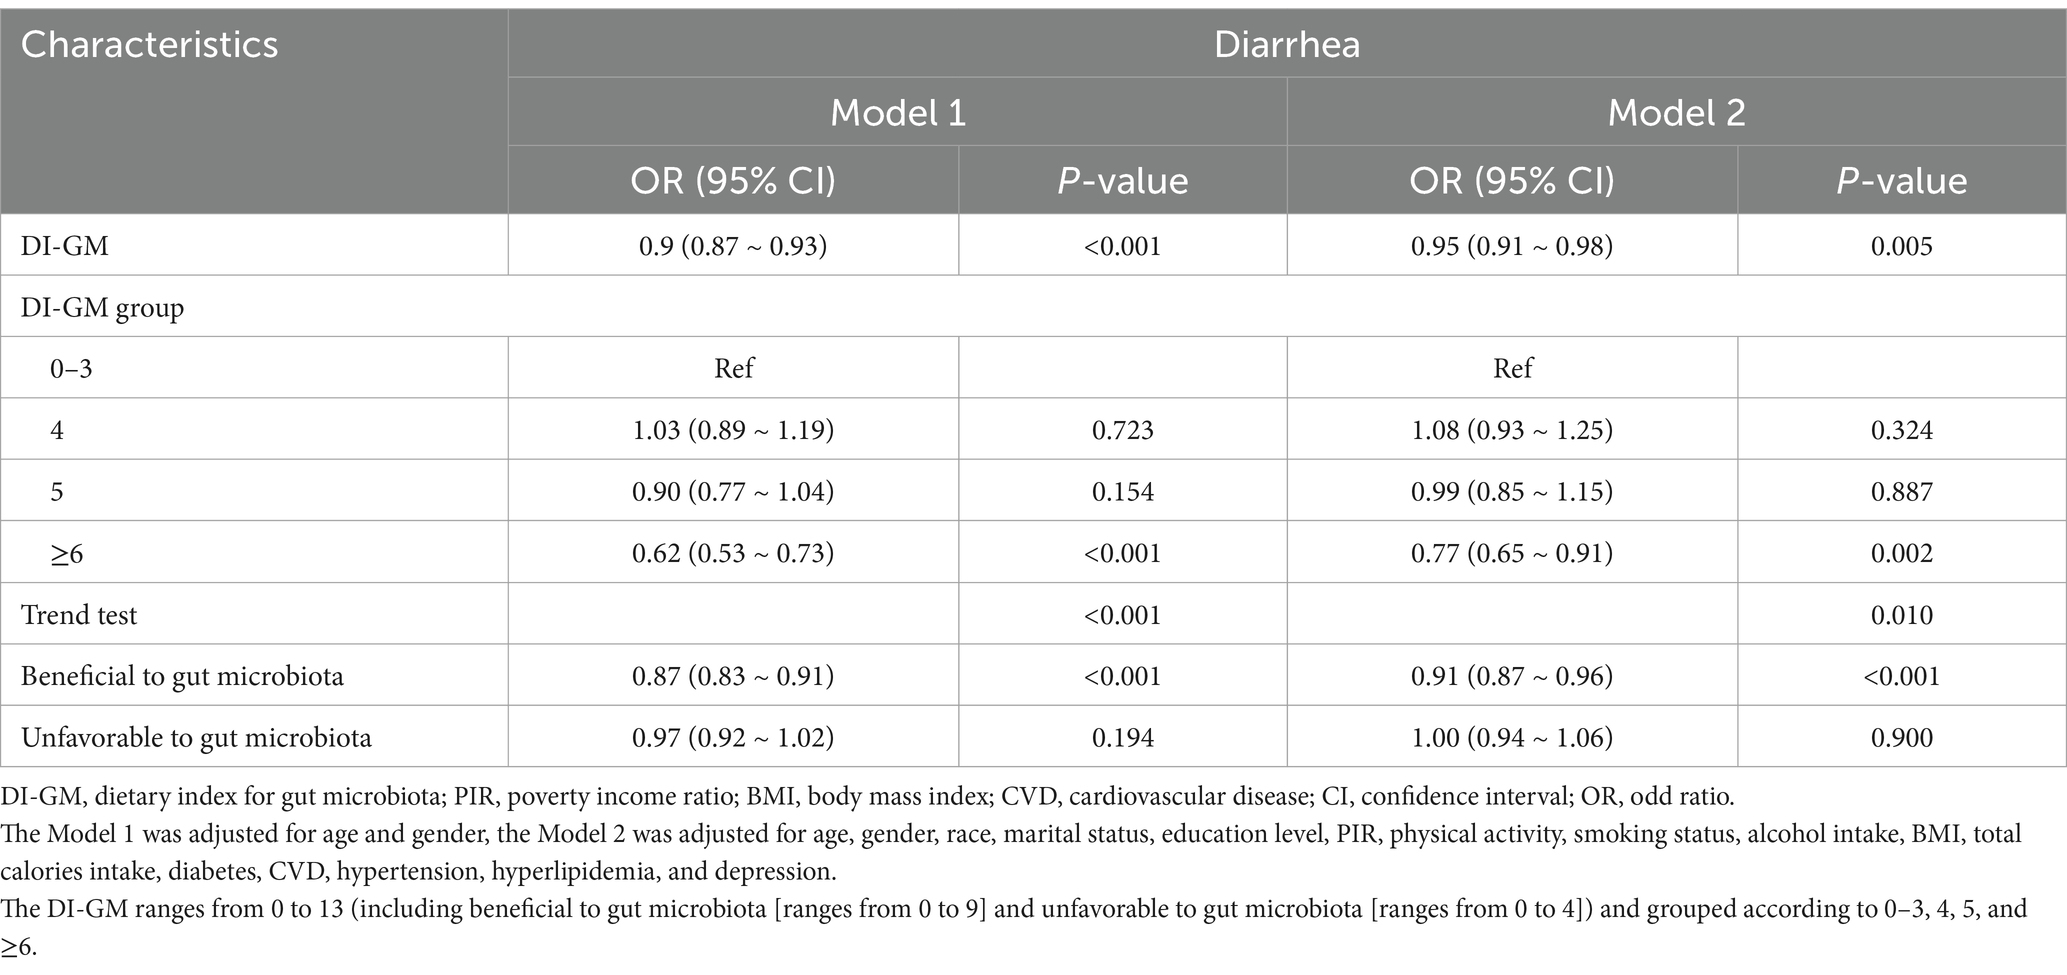
Table 2. Association between DI-GM and diarrhea.
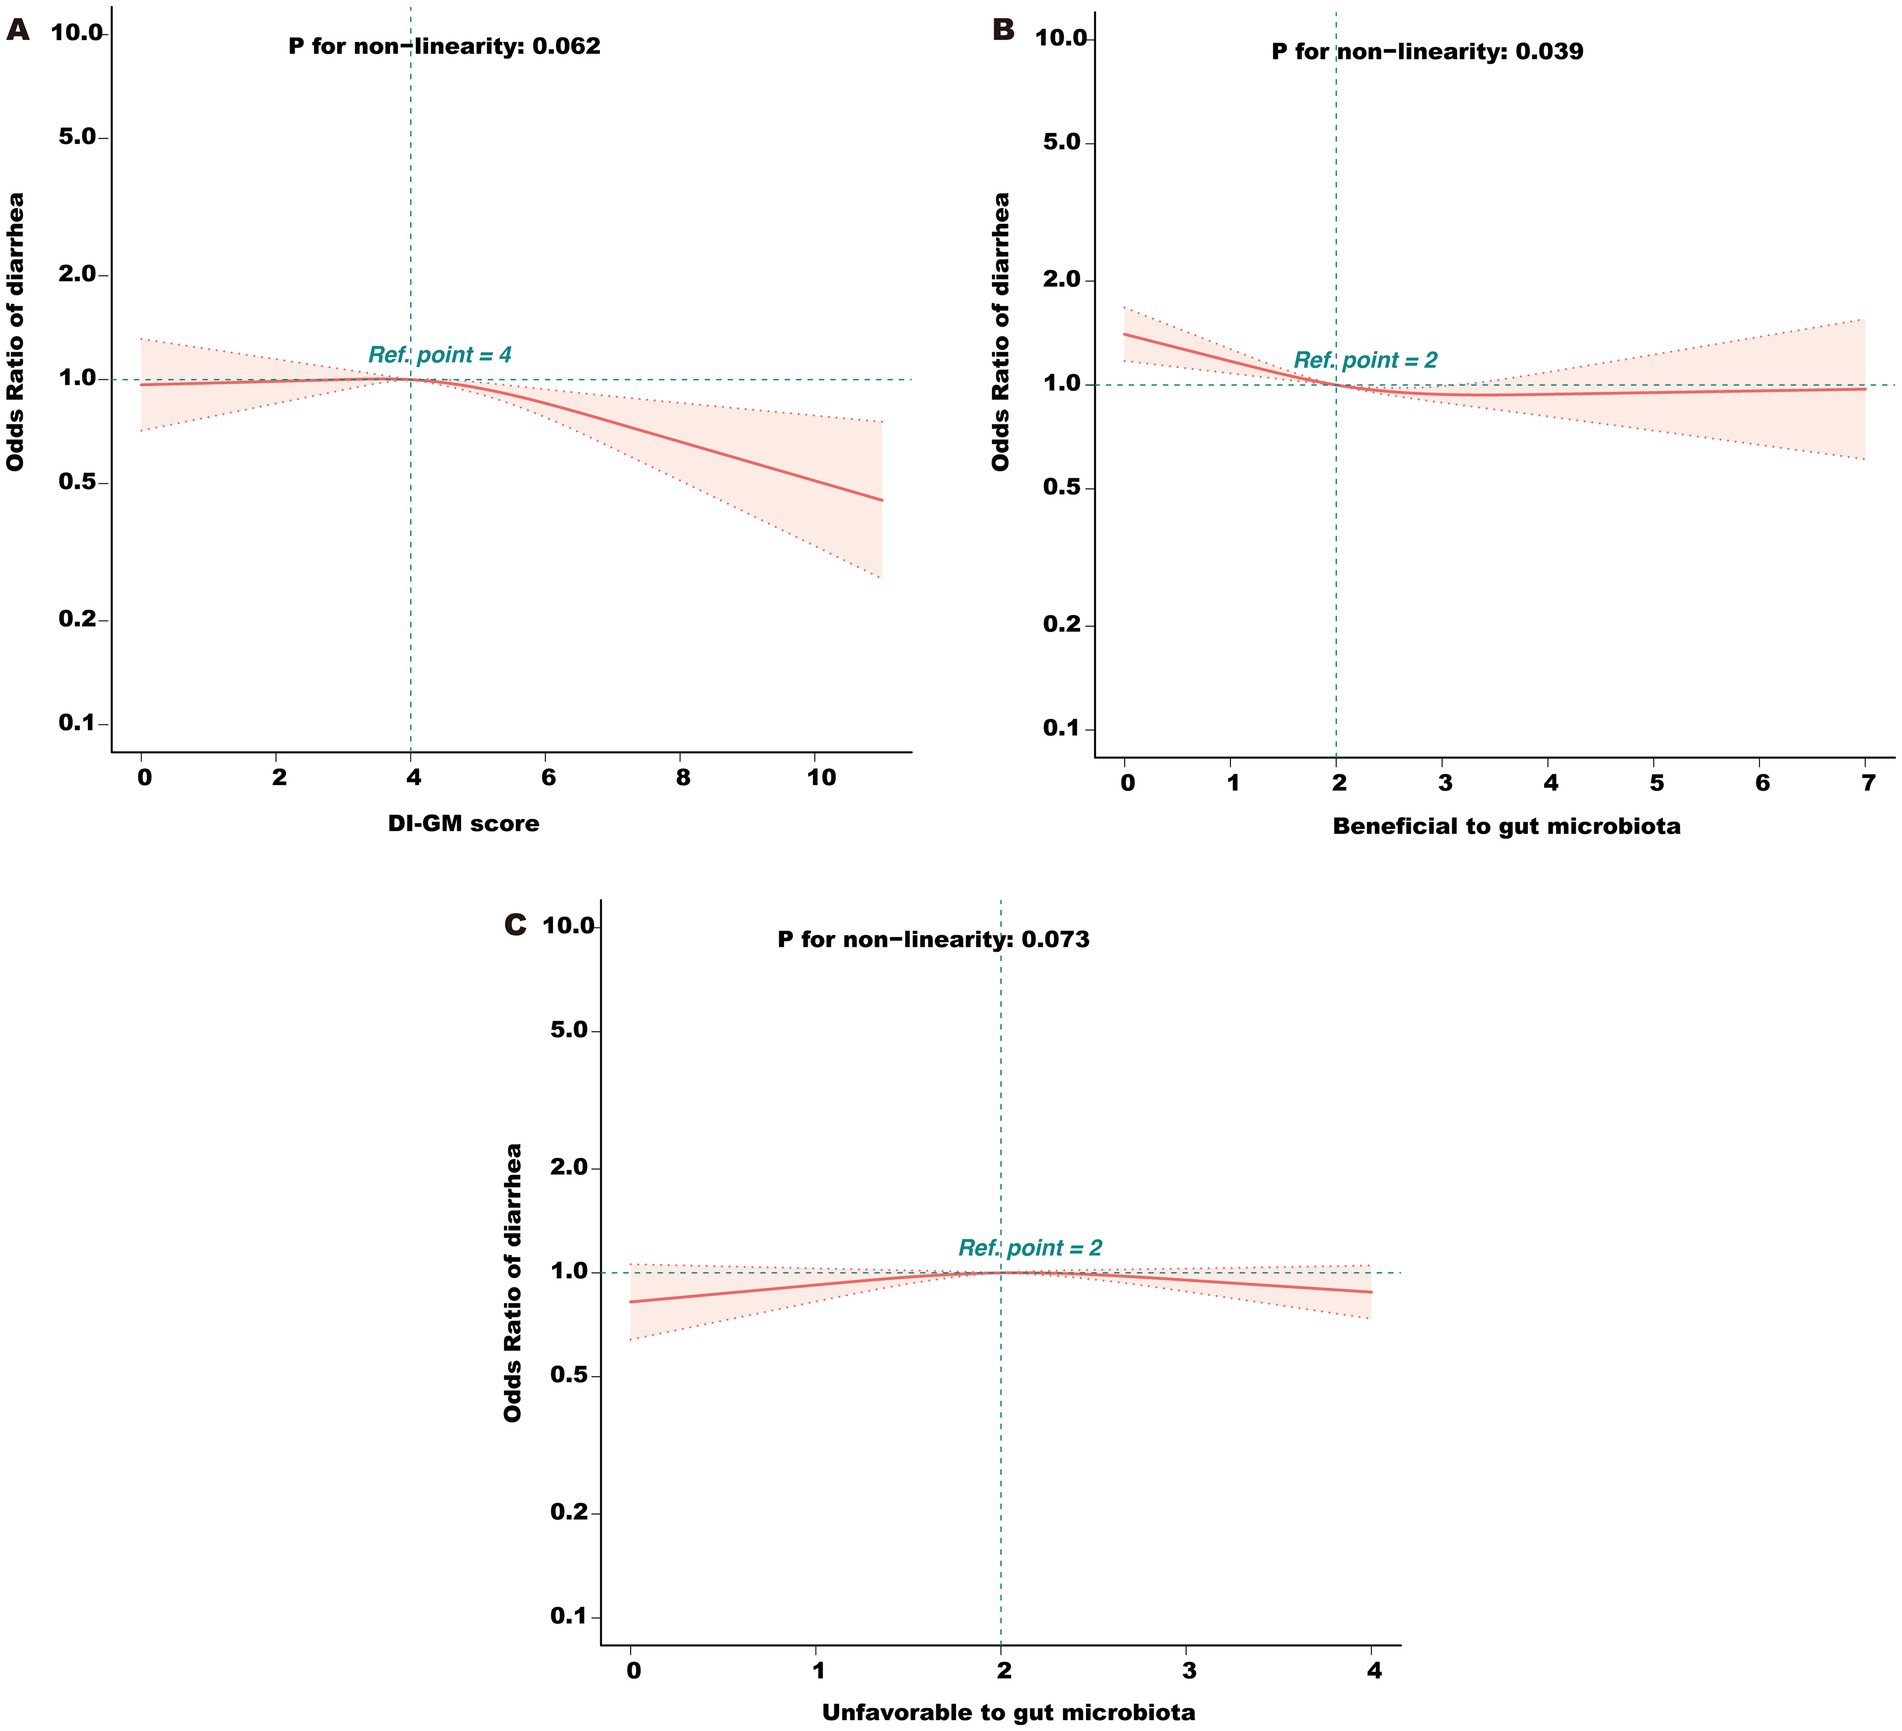
Figure 2. (A) Association between total DI-GM score and odds ratio (OR) of diarrhea. (B) Association between the beneficial component score and OR of diarrhea. (C) Association between the unfavorable component score and OR of diarrhea. DI-GM, dietary index for gut microbiota; PIR, poverty income ratio; BMI, body mass index; CVD, cardiovascular disease; RCS, restricted cubic spline. The model was adjusted for age, gender, race, marital status, education level, PIR, physical activity, smoking status, alcohol intake, BMI, total calories intake, diabetes, CVD, hypertension, hyperlipidemia, and depression.
Stratified analyses by age, gender, race, CVD, hypertension, hyperlipidemia, diabetes, and depression (Figure 3) revealed that the inverse association between DI-GM and diarrhea was generally consistent across most subgroups, underscoring the robustness and potential broad applicability of DI-GM. Notably, significant interactions were observed between DI-GM and gender (p = 0.003), as well as between DI-GM and race (p = 0.046).
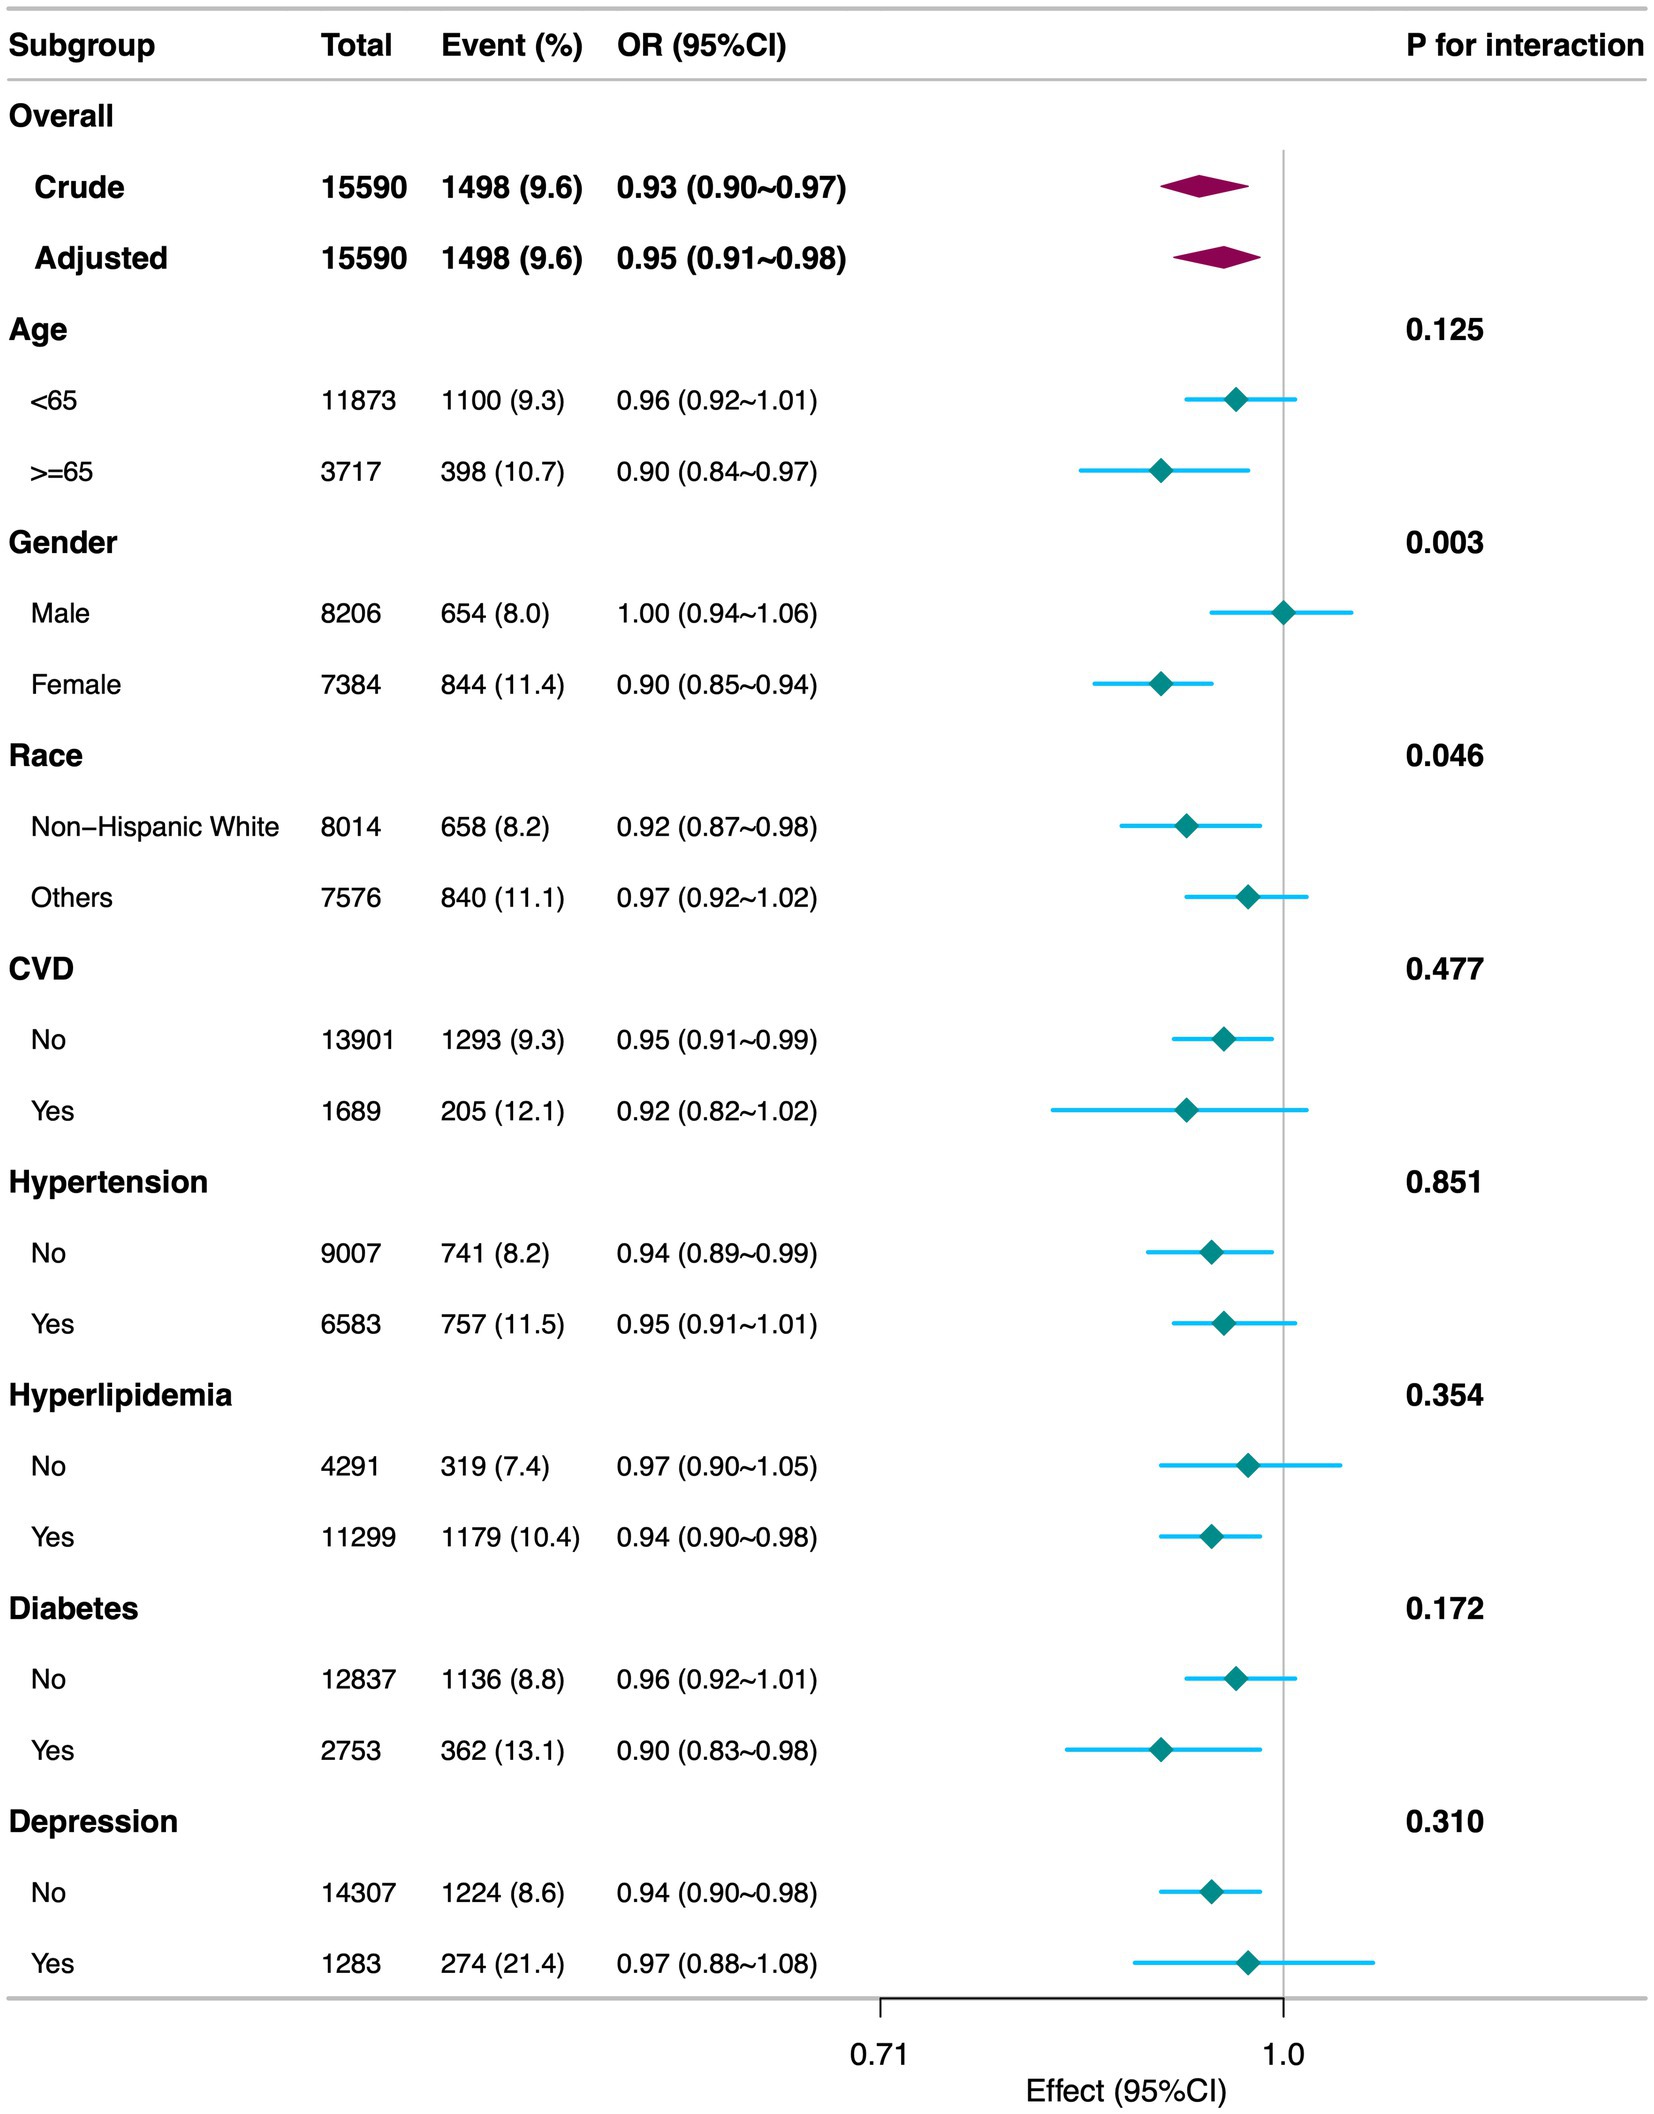
Figure 3. Subgroup analyses of the association between DI-GM and diarrhea among participants. DI-GM, dietary index for gut microbiota; PIR, poverty income ratio; BMI, body mass index; CVD, cardiovascular disease; CI, confidence interval; OR, odd ratio. The model was adjusted for age, gender, race, marital status, education level, PIR, physical activity, smoking status, alcohol intake, BMI, total calories intake, diabetes, CVD, hypertension, hyperlipidemia, and depression.
3.3 Sensitivity analyses
Multiple imputation for missing data (Supplementary Table 2) confirmed the robustness of the inverse association between DI-GM and diarrhea (adjusted OR = 0.96, 95% CI: 0.93–0.99, p = 0.021). Moreover, compared with the 0–3 group, those with DI-GM ≥6 remained at a significantly lower risk of diarrhea (OR = 0.82, 95% CI: 0.71–0.96, p = 0.013).
4 Discussion
Using large-scale, cross-sectional NHANES data from 2005 to 2010, this study provides the first systematic examination of the association between the newly proposed Dietary Index for Gut Microbiota (DI-GM) and diarrhea. Our key findings include the following: after adjusting for demographic, lifestyle, and health-related confounders, each 1-point increase in DI-GM was associated with a 5% reduction in diarrhea risk, with DI-GM ≥6 conferring a substantially lower risk than DI-GM scores of 0–3. This relationship remained robust after multiple sensitivity analyses. Further breakdown of DI-GM components revealed that “beneficial” factors (e.g., high fiber, fermented dairy, whole grains) exerted the most pronounced effect on decreasing diarrhea risk, while the contribution of “unfavorable” components (e.g., high-fat diet, red meat, processed meat, refined grains) was less pronounced under the current model.
Dietary influence on gut microbiota and its potential role in diarrhea have historically been emphasized. For instance, fermented dairy products (categorized as beneficial in DI-GM) may play a key role in maintaining gut homeostasis and reducing inflammation. A randomized controlled trial showed that a diet rich in fermented foods significantly enhanced gut microbial diversity and reduced inflammatory markers, potentially stabilizing the intestinal mucosal barrier and reducing fluid losses, thereby lowering diarrhea risk (33). Conversely, refined grains, classified as unfavorable in DI-GM, are common in Western diets. High intake of refined grains or sugars can not only raise blood glucose levels but also contribute to gut and neural inflammation (34), ultimately exacerbating intestinal dysfunction and increasing the likelihood of diarrhea.
Initially introduced by Kase et al. (16), DI-GM was designed to assess how overall dietary patterns affect gut microbial diversity. Subsequent work by Huang and Zhang in the NHANES population reported inverse associations between DI-GM and diabetes, as well as constipation (17, 18). Our study complements these findings by focusing on diarrhea, demonstrating that higher DI-GM scores were similarly linked to lower risk of a functional gastrointestinal outcome. Together, these results highlight the importance of comprehensive “diet–microbiota” interactions in modulating disease risk and underline DI-GM’s potential applicability to various functional bowel disorders.
Compared with traditional approaches focusing on individual nutrients (e.g., probiotics, prebiotics) or anti-diarrheal medications, DI-GM synthesizes multiple gut microbiota-related dietary components and offers a more holistic measure of overall diet quality. Our results suggest that greater emphasis on beneficial components (such as fermented dairy products, whole grains, and fiber) may critically lower diarrhea risk. Clinicians and dietitians could thus consider incorporating DI-GM or similar metrics into dietary guidance to help patients optimize their gut microbiota. For those suffering from chronic diarrhea, IBS, or other functional bowel disorders, a “microbiota-friendly” dietary intervention could alleviate symptoms, prevent recurrences, and facilitate weight management (35). From a public health perspective, promoting microbiota-oriented dietary patterns may serve as an economical and feasible strategy for diarrhea prevention and management on a broader scale.
Several mechanisms may underlie DI-GM’s beneficial effect on diarrhea risk. First, high fiber, fermented dairy products, and other “microbiota-friendly” foods provide fermentation substrates for beneficial microbes, stimulating short-chain fatty acid (SCFA) production (e.g., butyrate, propionate, and acetate) (36, 37). These metabolites not only supply energy to epithelial cells but also enhance the expression of tight junction proteins (e.g., ZO-1, occludin), strengthening the intestinal barrier and reducing fluid loss (38). In contrast, diets high in refined carbohydrates and fats may diminish SCFA production, compromise barrier integrity, and increase diarrhea risk (39, 40). Next, dietary patterns heavily shape microbial diversity and the relative abundance of beneficial taxa. A more diverse, prebiotic-rich microbiota can suppress colonization and overgrowth of pathogenic or opportunistic bacteria (41). High-fat, high-sugar diets, however, often reduce beneficial microbes and disturb microbial ecology, thereby increasing susceptibility to diarrhea (42). Additionally, excessive intake of fat and red meat alters bile acid secretion and metabolism. An imbalanced microbiota may be less capable of effectively transforming and binding excess bile acids in the colon, promoting mucosal irritation and fluid secretion, which precipitate diarrhea (43). Conversely, probiotics or certain fibers can mitigate these processes and, by regulating enterochromaffin cell-derived serotonin (5-HT), maintain normal intestinal peristalsis (44). Finally, beyond local physiological effects, dietary-induced microbial changes may also modulate central nervous system function via neurotransmitter production (e.g., 5-HT, GABA), immune signaling, and vagal pathways (45). Functional diarrhea often correlates with emotional stress, anxiety, or depression (46). A healthy, diverse microbiota may help modulate central stress responses and improve tolerance to gastrointestinal perturbations, thus reducing diarrhea incidence or severity.
Despite these promising findings, several limitations warrant attention. First, the study used cross-sectional data, which precludes causal inference and does not rule out reverse causation (i.e., diarrhea may alter dietary patterns). Second, we relied on NHANES data from 2005 to 2010, the only period during which the Bowel Health Questionnaire provided consistent Bristol Stool Form Scale-based definitions of diarrhea; therefore, changes in dietary patterns or lifestyle factors in more recent years are not captured. Third, medication use was not considered, potentially overlooking key interactions between pharmacological interventions, dietary habits, and bowel function. Fourth, we did not account for certain underlying gastrointestinal disorders, including exocrine pancreatic insufficiency, which may confound gut microbiota composition and influence diarrhea risk (47). Fifth, the definition of diarrhea was based on self-reported data, which may introduce subjective bias and omit details about duration and frequency, leading to possible misclassification. Sixth, NHANES depends on 24 h dietary recalls, which can introduce recall bias and may not fully reflect long term dietary habits. Seventh, the absence of direct microbial sequencing and inflammatory or immune biomarker assessments limited our ability to identify specific microbial taxa or metabolic pathways that might mediate the observed relationship between diet and diarrhea risk. Finally, only participants who completed the Bowel Health Questionnaire were included, which may introduce selection bias and affect the generalizability of our findings.
From a translational perspective, our findings underscore the potential benefit of a gut-microbiota-friendly diet, as indicated by higher DI-GM scores, in preventing or mitigating diarrhea. Clinically, the DI-GM framework may assist in guiding dietary counseling for individuals with functional bowel disorders, where targeted dietary modifications could alleviate symptoms and reduce recurrence. On a public health level, emphasizing key beneficial components (e.g., high-fiber foods, fermented dairy) may serve as an accessible, cost-effective strategy to improve gut health and lower the burden of gastrointestinal symptoms. Further research in prospective cohorts or randomized controlled trials, ideally integrating multi-omics approaches (e.g., metagenomics, metabolomics) along with immune and gut barrier assessments, is needed to confirm causality and refine personalized dietary interventions for diarrhea and other gut-microbiota-related conditions.
5 Conclusion
In summary, this cross-sectional study of a large NHANES sample reveals that higher DI-GM scores are significantly associated with lower diarrhea risk. Future research in multi-center prospective cohorts and intervention trials using multi-omics techniques may further clarify the causal pathways linking DI-GM to intestinal health and offer more precise guidance for individualized nutritional intervention and public health strategies to prevent and manage diarrhea.
Data availability statement
The datasets presented in this study can be found in online repositories. The names of the repository/repositories and accession number(s) can be found at: Publicly available datasets were analyzed in this study. All data entered into the analysis were from NHANES, which is publicly accessible to all.
Ethics statement
Ethics approval was obtained from the NCHS Ethics Review Committee, and participants provided written informed consent. The studies were conducted in accordance with the local legislation and institutional requirements. The participants provided their written informed consent to participate in this study. Written informed consent was obtained from the individual(s) for the publication of any potentially identifiable images or data included in this article.
Author contributions
XiaoqL: Conceptualization, Data curation, Formal analysis, Methodology, Supervision, Writing – original draft, Writing – review & editing. XiaobL: Conceptualization, Data curation, Formal analysis, Methodology, Supervision, Writing – original draft, Writing – review & editing. YinH: Formal analysis, Writing – original draft. CL: Formal analysis, Writing – original draft. XC: Formal analysis, Writing – original draft. YL: Software, Writing – original draft. YisH: Supervision, Writing – review & editing. YW: Supervision, Writing – review & editing.
Funding
The author(s) declare that financial support was received for the research and/or publication of this article. This study was supported by the Startup Fund for Scientific Research at Fujian Medical University (Grant No. 2022QH1268) and by the China Scholarship Council (Grant No. 201906070289). The funders had no role in the study design, analysis, decision to publish, nor preparation of the manuscript.
Acknowledgments
We thank Huanxian Liu (Department of Neurology, Chinese PLA General Hospital, Beijing, China) for his valuable comments on the study design and manuscript.
Conflict of interest
The authors declare that the research was conducted in the absence of any commercial or financial relationships that could be construed as a potential conflict of interest.
Generative AI statement
The authors declare that no Gen AI was used in the creation of this manuscript.
Publisher’s note
All claims expressed in this article are solely those of the authors and do not necessarily represent those of their affiliated organizations, or those of the publisher, the editors and the reviewers. Any product that may be evaluated in this article, or claim that may be made by its manufacturer, is not guaranteed or endorsed by the publisher.
Supplementary material
The Supplementary material for this article can be found online at: https://www.frontiersin.org/articles/10.3389/fnut.2025.1566314/full#supplementary-material
Footnotes
References
1. Kyu, HH, Vongpradith, A, Dominguez, R-MV, Ma, J, Albertson, SB, Novotney, A, et al. Global, regional, and national age-sex-specific burden of diarrhoeal diseases, their risk factors, and aetiologies, 1990–2021, for 204 countries and territories: a systematic analysis for the global burden of disease study 2021. Lancet Infect Dis. (2024). doi: 10.1016/S1473-3099(24)00691-1
2. Palsson, OS, Whitehead, W, Törnblom, H, Sperber, AD, and Simren, M. Prevalence of Rome IV functional bowel disorders among adults in the United States, Canada, and the United Kingdom. Gastroenterology. (2020) 158:1262–1273.e3. doi: 10.1053/j.gastro.2019.12.021
3. Reiner, RC, Wiens, KE, Deshpande, A, Baumann, MM, Lindstedt, PA, Blacker, BF, et al. Mapping geographical inequalities in childhood diarrhoeal morbidity and mortality in low-income and middle-income countries, 2000–17: analysis for the global burden of disease study 2017. Lancet. (2020) 395:1779–801. doi: 10.1016/S0140-6736(20)30114-8
4. Frese, S, and Riddle, MS. Diarrhea, Dysbiosis, dysfunction, and the disastrous Global Health consequences: piecing the puzzle together. Am J Gastroenterol. (2022) 117:98–9. doi: 10.14309/ajg.0000000000001555
5. Hartman, RM, Cohen, AL, Antoni, S, Mwenda, J, Weldegebriel, G, Biey, J, et al. Risk factors for mortality among children younger than age 5 years with severe diarrhea in low-and middle-income countries: findings from the World Health Organization-coordinated global rotavirus and pediatric diarrhea surveillance networks. Clin Infect Dis. (2023) 76:e1047–53. doi: 10.1093/cid/ciac561
6. Du, Z, Li, J, Li, W, Fu, H, Ding, J, Ren, G, et al. Effects of prebiotics on the gut microbiota in vitro associated with functional diarrhea in children. Front Microbiol. (2023) 14:1233840. doi: 10.3389/fmicb.2023.1233840
7. Campbell, C, Kandalgaonkar, MR, Golonka, RM, Yeoh, BS, Vijay-Kumar, M, and Saha, P. Crosstalk between gut microbiota and host immunity: impact on inflammation and immunotherapy. Biomedicines. (2023) 11:294. doi: 10.3390/biomedicines11020294
8. Xiao, L, Liu, Q, Luo, M, and Xiong, L. Gut microbiota-derived metabolites in irritable bowel syndrome. Front Cell Infect Microbiol. (2021) 11:729346. doi: 10.3389/fcimb.2021.729346
9. Wang, Y, Ma, W, Mehta, R, Nguyen, LH, Song, M, Drew, DA, et al. Diet and gut microbial associations in irritable bowel syndrome according to disease subtype. Gut Microbes. (2023) 15:2262130. doi: 10.1080/19490976.2023.2262130
10. Beam, A, Clinger, E, and Hao, L. Effect of diet and dietary components on the composition of the gut microbiota. Nutrients. (2021) 13:2795. doi: 10.3390/nu13082795
11. Yao, S, Zhao, Y, Chen, H, Sun, R, Chen, L, Huang, J, et al. Exploring the plasticity of diet on gut microbiota and its correlation with gut health. Nutrients. (2023) 15:3460. doi: 10.3390/nu15153460
12. Mahalak, KK, Liu, L, Bobokalonov, J, Narrowe, AB, Firrman, J, Bittinger, K, et al. Supplementation with soluble or insoluble rice-bran fibers increases short-chain fatty acid producing bacteria in the gut microbiota in vitro. Front Nutr. (2024) 11:1304045. doi: 10.3389/fnut.2024.1304045
13. Albracht-Schulte, K, Islam, T, Johnson, P, and Moustaid-Moussa, N. Systematic review of beef protein effects on gut microbiota: implications for health. Adv Nutr. (2021) 12:102–14. doi: 10.1093/advances/nmaa085
14. Hussain, M, Umair Ijaz, M, Ahmad, MI, Khan, IA, Bukhary, SUF, Khan, W, et al. Gut inflammation exacerbates hepatic injury in C57BL/6J mice via gut-vascular barrier dysfunction with high-fat-incorporated meat protein diets. Food Funct. (2020) 11:9168–76. doi: 10.1039/D0FO02153A
15. Randeni, N, Bordiga, M, and Xu, B. A comprehensive review of the triangular relationship among diet-gut microbiota-inflammation. IJMS. (2024) 25:9366. doi: 10.3390/ijms25179366
16. Kase, BE, Liese, AD, Zhang, J, Murphy, EA, Zhao, L, and Steck, SE. The development and evaluation of a literature-based dietary index for gut microbiota. Nutrients. (2024) 16:1045. doi: 10.3390/nu16071045
17. Zhang, Z, Bi, C, Wu, R, and Qu, M. Association of the newly proposed dietary index for gut microbiota and constipation: a cross-sectional study from NHANES. Front Nutr. (2025) 12:1529373. doi: 10.3389/fnut.2025.1529373
18. Huang, Y, Liu, X, Lin, C, Chen, X, Li, Y, Huang, Y, et al. Association between the dietary index for gut microbiota and diabetes: the mediating role of phenotypic age and body mass index. Front Nutr. (2025) 12:1519346. doi: 10.3389/fnut.2025.1519346
19. von Elm, E, Altman, DG, Egger, M, Pocock, SJ, Gøtzsche, PC, and Vandenbroucke, JP. The strengthening the reporting of observational studies in epidemiology (STROBE) statement: guidelines for reporting observational studies. Lancet. (2007) 370:1453–7. doi: 10.1016/S0140-6736(07)61602-X
20. Zhao, Q, Xu, Y, Li, X, and Chen, X. L-shaped association of dietary inflammatory index (DII) and chronic diarrhea: results from NHANES 2005–2010. BMC Public Health. (2025) 25:81. doi: 10.1186/s12889-025-21292-8
21. Ballou, S, Katon, J, Singh, P, Rangan, V, Lee, HN, McMahon, C, et al. Chronic diarrhea and constipation are more common in depressed individuals. Clin Gastroenterol Hepatol. (2019) 17:2696–703. doi: 10.1016/j.cgh.2019.03.046
22. Wang, P, Shen, X, Wang, Y, and Jia, X. Association between constipation and major depression in adult Americans: evidence from NHANES 2005–2010. Front Psych. (2023) 14:1152435. doi: 10.3389/fpsyt.2023.1152435
23. Zhang, X, Yang, Q, Huang, J, Lin, H, Luo, N, and Tang, H. Association of the newly proposed dietary index for gut microbiota and depression: the mediation effect of phenotypic age and body mass index. Eur Arch Psychiatry Clin Neurosci. (2024). doi: 10.1007/s00406-024-01912-x
24. Cao, Y, Yang, Z, and Tang, Q. The association between oxidative balance score with constipation and diarrhea in US adults: a cross-sectional analysis of NHANES 2007–2010. BMC Gastroenterol. (2025) 25:29. doi: 10.1186/s12876-025-03597-5
25. Pan, T, Zhang, Z, He, T, Zhang, C, Liang, J, Wang, X, et al. The association between urinary incontinence and suicidal ideation: findings from the National Health and nutrition examination survey. PLoS One. (2024) 19:e0301553. doi: 10.1371/journal.pone.0301553
26. Wei, X, Min, Y, Xiang, Z, Zeng, Y, Wang, J, and Liu, L. Joint association of physical activity and dietary quality with survival among US cancer survivors: a population-based cohort study. Int J Surg. (2024) 110:5585–94. doi: 10.1097/JS9.0000000000001636
27. Tang, H, Zhang, X, Luo, N, Huang, J, and Zhu, Y. Association of Dietary Live Microbes and Nondietary Prebiotic/probiotic intake with cognitive function in older adults: evidence from NHANES. J Gerontol A Biol Sci Med Sci. (2024) 79:glad175. doi: 10.1093/gerona/glad175
28. Rattan, P, Penrice, DD, Ahn, JC, Ferrer, A, Patnaik, M, Shah, VH, et al. Inverse Association of Telomere Length with Liver Disease and Mortality in the US population. Hepatol Commun. (2022) 6:399–410. doi: 10.1002/hep4.1803
29. Nong, Y, Wu, G, Lu, J, Wei, X, Yu, D, Nong, Y, et al. The mediating role of obesity in the development of depression in individuals with diabetes: a population-based study from NHANES 2005–2014. J Affect Disord. (2024) 351:977–82. doi: 10.1016/j.jad.2024.02.036
30. Mahemuti, N, Jing, X, Zhang, N, Liu, C, Li, C, Cui, Z, et al. Association between systemic immunity-inflammation index and hyperlipidemia: a population-based study from the NHANES (2015–2020). Nutrients. (2023) 15:1177. doi: 10.3390/nu15051177
31. Filipas, DK, Labban, M, Beatrici, E, Stone, BV, Qian, ZJ, Zaplatnikova, A, et al. Association of Urinary Incontinence and Depression: findings from the National Health and nutrition examination survey. Urology. (2023) 181:11–7. doi: 10.1016/j.urology.2023.08.008
32. Chen, H, Tang, H, Zhang, X, Huang, J, Luo, N, Guo, Q, et al. Adherence to Life’s essential 8 is associated with delayed biological aging: a population-based cross-sectional study. Revista Española de Cardiología (English Edition). (2024) 78:37–46. doi: 10.1016/j.rec.2024.04.004
33. Wastyk, HC, Fragiadakis, GK, Perelman, D, Dahan, D, Merrill, BD, Yu, FB, et al. Gut-microbiota-targeted diets modulate human immune status. Cell. (2021) 184:4137–4153.e14. doi: 10.1016/j.cell.2021.06.019
34. González Olmo, BM, Butler, MJ, and Barrientos, RM. Evolution of the human diet and its impact on gut microbiota, immune responses, and brain health. Nutrients. (2021) 13:196. doi: 10.3390/nu13010196
35. Thomas, A, Thomas, A, and Butler-Sanchez, M. Dietary modification for the restoration of gut microbiome and Management of Symptoms in irritable bowel syndrome. Am J Lifestyle Med. (2022) 16:608–21. doi: 10.1177/15598276211012968
36. Frolova, MS, Suvorova, IA, Iablokov, SN, Petrov, SN, and Rodionov, DA. Genomic reconstruction of short-chain fatty acid production by the human gut microbiota. Front Mol Biosci. (2022) 9:949563. doi: 10.3389/fmolb.2022.949563
37. Xiong, R-G, Zhou, D-D, Wu, S-X, Huang, S-Y, Saimaiti, A, Yang, Z-J, et al. Health benefits and side effects of short-chain fatty acids. Food Secur. (2022) 11:2863. doi: 10.3390/foods11182863
38. Song, M, Zhang, Z, Li, Y, Xiang, Y, and Li, C. Midgut microbiota affects the intestinal barrier by producing short-chain fatty acids in Apostichopus japonicus. Front Microbiol. (2023) 14:1263731. doi: 10.3389/fmicb.2023.1263731
39. Tian, B, Zhao, J, Zhang, M, Chen, Z, Ma, Q, Liu, H, et al. Lycium ruthenicum Anthocyanins attenuate high-fat diet-induced colonic barrier dysfunction and inflammation in mice by modulating the gut microbiota. Mol Nutr Food Res. (2021) 65:e2000745. doi: 10.1002/mnfr.202000745
40. Qiao, B, Liu, J, Peng, X, Cai, Y, Peng, M, Li, X, et al. Association of Short-Chain Fatty Acids with gut microbiota and lipid metabolism in mice with diarrhea induced by high-fat diet in a fatigued state. Mol Nutr Food Res. (2023) 67:e2300452. doi: 10.1002/mnfr.202300452
41. Khan, I, Bai, Y, Zha, L, Ullah, N, Ullah, H, Shah, SRH, et al. Mechanism of the gut microbiota colonization resistance and enteric pathogen infection. Front Cell Infect Microbiol. (2021) 11:716299. doi: 10.3389/fcimb.2021.716299
42. Arnone, D, Vallier, M, Hergalant, S, Chabot, C, Ndiaye, NC, Moulin, D, et al. Long-term overconsumption of fat and sugar causes a partially reversible pre-inflammatory bowel disease state. Front Nutr. (2021) 8:758518. doi: 10.3389/fnut.2021.758518
43. Wan, Y, Yuan, J, Li, J, Li, H, Zhang, J, Tang, J, et al. Unconjugated and secondary bile acid profiles in response to higher-fat, lower-carbohydrate diet and associated with related gut microbiota: a 6-month randomized controlled-feeding trial. Clin Nutr. (2020) 39:395–404. doi: 10.1016/j.clnu.2019.02.037
44. Jiang, L, Han, D, Hao, Y, Song, Z, Sun, Z, and Dai, Z. Linking serotonin homeostasis to gut function: nutrition, gut microbiota and beyond. Crit Rev Food Sci Nutr. (2024) 64:7291–310. doi: 10.1080/10408398.2023.2183935
45. Dicks, LMT. Our mental health is determined by an intrinsic interplay between the central nervous system, enteric nerves, and gut microbiota. IJMS. (2023) 25:38. doi: 10.3390/ijms25010038
46. Șchiopu, CG, Ștefănescu, C, Boloș, A, Diaconescu, S, Gilca-Blanariu, G-E, and Ștefănescu, G. Functional gastrointestinal disorders with psychiatric symptoms: involvement of the microbiome–gut–brain Axis in the pathophysiology and case management. Microorganisms. (2022) 10:2199. doi: 10.3390/microorganisms10112199
47. Frost, F, Weiss, FU, Sendler, M, Kacprowski, T, Rühlemann, M, Bang, C, et al. The gut microbiome in patients with chronic pancreatitis is characterized by significant Dysbiosis and overgrowth by opportunistic pathogens. Clin Transl Gastroenterol. (2020) 11:e00232. doi: 10.14309/ctg.0000000000000232
Keywords: gut microbiota, diarrhea, dietary index for gut microbiota, cross-sectional study, NHANES
Citation: Liu X, Liu X, Huang Y, Lin C, Chen X, Li Y, Huang Y and Wang Y (2025) Association between dietary index for gut microbiota and diarrhea among US adults: a cross-sectional analysis of NHANES 2005–2010. Front. Nutr. 12:1566314. doi: 10.3389/fnut.2025.1566314
Edited by:
Honglin Dong, City University of London, United KingdomReviewed by:
Tang Qinqing, First Affiliated Hospital of Anhui Medical University, ChinaMats Lukas Wiese, Münster University of Applied Sciences, Germany
Tao Yang, Central South University of Forestry and Technology, China
Copyright © 2025 Liu, Liu, Huang, Lin, Chen, Li, Huang and Wang. This is an open-access article distributed under the terms of the Creative Commons Attribution License (CC BY). The use, distribution or reproduction in other forums is permitted, provided the original author(s) and the copyright owner(s) are credited and that the original publication in this journal is cited, in accordance with accepted academic practice. No use, distribution or reproduction is permitted which does not comply with these terms.
*Correspondence: Yisen Huang, MTgxNTk1MDMzMzFAMTYzLmNvbQ==; Yubin Wang, eXViaW53YW5nODFAMTI2LmNvbQ==
†These authors have contributed equally to this work and share first authorship