 Maricruz Sepulveda-Villegas1,2
 Arturo Panduro1,2
 Leonardo Leal-Mercado1,2,3
 Juan Pablo Cardenas-Benitez1,2,3
 Claudia Ojeda-Granados1,2†
 Sonia Roman1,2*
- 1Department of Genomic Medicine in Hepatology, Civil Hospital of Guadalajara, “Fray Antonio Alcalde”, Guadalajara, Jalisco, Mexico
- 2Health Sciences Center, University of Guadalajara, Guadalajara, Jalisco, Mexico
- 3Programa Doctoral en Biología Molecular en Medicina, Health Sciences Center, University of Guadalajara, Guadalajara, Jalisco, Mexico
Background: The fat mass and obesity-associated (FTO) rs9939609 T>A polymorphism is associated with excess body fat and metabolic disturbances, including Type 2 diabetes (T2D) and metabolic dysfunction-associated steatotic liver disease (MASLD). However, the genetic effect of the T and the A alleles on the development of these diseases may vary among populations.
Objective: This study aimed to determine the distribution of the FTO rs9939609 T>A polymorphism in West Mexican populations with variable genetic ancestry and analyze its effect on an admixed cohort’s anthropometric and metabolic profile.
Methods: In a cross-sectional study, 684 unrelated adults from West Mexico were included. Subjects were grouped as Amerindian (Wixárika and Nahuas) or admixed: Mestizo-Caucasians (Cuquío, San Miguel-Los Altos, and Villa Purificación) and Mestizo-Guadalajara (Mestizo-GDL). FTO genotyping was determined by an allelic discrimination assay. Assessment of anthropometrics, diet composition, and metabolic profile among 333 Mestizo-GDL subjects and their association with metabolic risk factors was conducted considering the dominant model (AA + AT vs. TT).
Results: The Wixárika group had the highest frequencies of the T allele (94%) and TT genotype (89%) among Amerindians, followed by mestizos from GDL (74% and 56%, respectively). In contrast, Mestizo-Caucasians from Cuquío had the highest A allele frequency (32.4%). No significant effect of the FTO genotype on body mass index (BMI)/body fat was observed in the Mestizo-GDL population. However, the TT carriers exhibited higher waist-to-height ratios (0.52 ± 0.07 vs. 0.49 ± 0.08), insulin levels (10.8 ± 7.3 vs. 8.8 ± 5.2 μU/mL), triglycerides (141.8 ± 66.5 vs. 125.8 ± 65.3 mg/dL), and VLDL-c (29.1 ± 14.8 vs. 25.6 ± 14.2 mg/dL) than AA + AT carriers. The TT genotype was associated with higher odds of hypertriglyceridemia (HTG) (OR = 1.7, 95% CI = 1.07–2.73, p = 0.027), insulin resistance (IR) (OR = 1.79, 95% CI = 1.06–3.07, p = 0.031), and hyperglycemia (HGL) (OR = 2.77, 95% CI = 1.5–5.36, p = 0.002). Multivariable logistic regression confirmed that TT genotype carriers had greater odds of HGL (OR = 2.50, 95% CI = 1.2–5.15, p = 0.013).
Conclusion: The FTO T allele was prominent among native Mexicans. In contrast, the A allele prevailed among the Mestizo with higher European ancestry. The TT genotype carriers had higher odds of IR, HTG, and HGL, highlighting the genetic predisposition to T2D and MASLD in populations exposed to obesogenic and hepatopathogenic environments.
1 Introduction
Excess visceral adipose tissue, or abdominal obesity, is a significant risk factor for metabolic abnormalities such as hypoalphalipoproteinemia (HALP), hypertriglyceridemia (HTG), hypercholesterolemia (HCL), insulin resistance (IR), hyperglycemia (HGL), and elevated levels of liver enzymes, alanine aminotransferase (ALT), and aspartate aminotransferase (AST). Most of these obesity-related conditions are key triggers of Type 2 diabetes mellitus (T2D), cardiovascular disease, and non-alcoholic fatty liver disease (1–3), now referred to as metabolic dysfunction-associated steatotic liver disease (MASLD) (4).
Globally, the number of women and men with obesity in 2022 was 504 million and 374 million, respectively, which represents an increase of 684 million people since 1990 (5). Countries experiencing a nutrition transition tend to have the highest rates of obesity, T2D, and MASLD (6–9). Currently, in Mexico, 74% of the population has excess body weight, of which 4% presents class III obesity (10). Consequently, a significant portion of Mexicans are at risk for various health conditions. Estimates from the 2022 National Survey of Health and Nutrition indicate a prevalence of 22.1% of prediabetes and 18.3% of T2D (11). In a recent study carried out in West Mexico, 57% of 505 patients were at risk for MASLD (12). These chronic conditions rank within the top five causes of morbidity in Mexico (13) and are caused by intricate interactions between obesogenic environments (including hepatopathogenic foods, sedentary lifestyles, and stress) and genetic risk factors, which may vary by region.
The fat mass and obesity-associated (FTO) gene, originally named “Fatso” due to its abbreviation from “FT” (short for “Fused Toes”), referring to limb deformities observed in rats lacking this gene (14), has attracted renewed attention in recent years due to its association with weight gain. Genome-wide Association Studies have identified FTO as the first obesity-susceptibility gene in populations of European ancestry, resulting in its renaming as the “fat mass and obesity-associated” gene (15, 16). The FTO gene (16q12.2) encodes an alpha-ketoglutarate-dependent dioxygenase that performs oxidative demethylation, modifying nucleic acids (DNA and RNA). This enzyme has biological activity in a variety of tissues, predominantly in the brain, regulating the hunger/satiety axis and reward system; in the liver, controlling the expression of lipogenic genes and cellular proliferation; and in adipocytes, influencing the size of white adipose tissue, cell differentiation, browning, and thermogenesis (17, 18).
The FTO gene has been extensively studied for its implications in energy balance (19–21), stimulating adipogenesis, and promoting lipid storage in mature adipocytes (22–24). This gene is highly polymorphic, and among the most studied single-nucleotide polymorphisms (SNP) is the FTO rs9939609 T>A variant in which the highest frequency of the risk A allele has been found in African (49%) and European populations (45%) (25). The presence of the A allele increases FTO gene expression and adipocyte size, which results in a lower quantity of mitochondria (26). Each copy of the A allele is associated with increased BMI by approximately 0.4 kg/m2 and body weight by 1.2 kg in adults (15). Clinical research indicates that the A allele is linked to lower satiety, overeating, a preference for energy-dense foods, lower resting energy expenditure, and a higher prevalence of obesity and severe obesity in Caucasian populations (26–28).
Several studies have reported the association between the A allele and elevated BMI in Mexican subpopulations differing by geographic locations and genetic ancestries (29–32). This ancestral genetic diversity is distinguished by variable degrees of Amerindian, European, and African lineages, considerably influencing several biological characteristics, including anthropometric and metabolic phenotypes (33–35). Furthermore, in prior research, we reported a differential distribution of the genetic and phenotypic traits associated with dyslipidemias across Mexican subpopulations of West Mexico (36, 37) that have been linked to the increased prevalence of IR, HTG, HALP, HCL, and HGL in at-risk individuals for MASLD (12).
Considering the role of FTO in weight gain and the genetic heterogeneity of the Mexican population, it is plausible that the respective T and the A alleles could differentially influence the anthropometric and metabolic profile linked to the risk for T2D and MASLD. Therefore, this study aimed to determine the distribution of the FTO rs9939609 T>A polymorphism in West Mexican populations with variable genetic ancestry and analyze its effect on an admixed cohort’s anthropometric and metabolic profile.
2 Materials and methods
2.1 Participants and study design
This cross-sectional study involved 684 adult participants of both genders from different regions of the State of Jalisco and Nayarit in Western Mexico. The distribution of the FTO (rs9939609) polymorphism among participants was determined using a convenience sampling method. The study population was stratified into three groups according to their prominent genetic ancestry, as described previously (38, 39). Briefly, Wixárika (also known as Huichol) (n = 100) and Nahuas (n = 84) with a background of Amerindian history; Mestizo-Guadalajara (Mestizo-GDL) (n = 333) are admixed populations with an intermediate Amerindian-European ancestry, and Mestizo with major European ancestry were denoted as Mestizo-Caucasians (towns of Cuquío, n = 102; San Miguel-Los Altos, n = 33; Villa Purificación, n = 32).
The recruitment process for the Amerindian groups took place at their rural medical service following an invitation placed by their tribal chief. Mestizo-Caucasian participants were recruited at their community health centers by a public invitation.
The sample size for association analyses in the Mestizo-GDL population was calculated using the formula for quantitative variables in comparative studies, and was based on the allele frequency of the FTO (rs9939609) polymorphism in a case (obese)-control (normal weight) study in Mexicans reported by Villalobos-Comparán et al. (29). The Mestizo-GDL group was outpatients attending the Nutrigenetic Clinic of the Department of Genomic Medicine in Hepatology, Civil Hospital of Guadalajara “Fray Antonio Alcalde.” Participants eligible for inclusion were adults with a BMI ≥18.5 kg/m2 who self-reported as healthy and had no prior medical diagnosis of metabolic dysfunction-associated steatotic liver disease, T2DM, or other chronic conditions, and were not currently receiving treatment for any metabolic disorder. Exclusion criteria comprised pregnancy or lactation, a history of excessive alcohol consumption (>20 g/day for females and >40 g/day for males), confirmed hepatitis B or C virus infection, or evidence of drug-induced hepatotoxicity. The study was conducted from February 2018 to December 2019 and was approved by the Institutional Board Committee (#CI-07218). All participants signed an informed consent before the study.
2.2 Genotyping analysis
Genomic DNA was extracted from leucocytes by a modified salting-out method (40). FTO rs9939609 T>A polymorphism genotyping was performed using a predesigned TaqMan allelic discrimination assay (C_30090620_10, Applied Biosystems, Foster, CA, United States) by a Real-Time PCR technique running on Step One Plus thermocycler (Applied Biosystems, Foster, CA, United States). DNA concentration per sample and assay was 20 ng/μL. PCR conditions were enzyme activation at 95 °C for 10 min, followed by 40 cycles of denaturation at 95 °C for 15 s and annealing/extension at 60 °C for 1 min. Genotyping concordance was verified by including a positive control corresponding to the three possible genotypes in the run. Genotyping was repeated on 10 random samples per plate as a quality control check. The allelic and genotypic distribution of the FTO rs9939609 T>A polymorphism was determined among the population groups by the simple count method.
2.3 Anthropometric and dietary intake assessment
Height was measured without shoes to the nearest 0.1 cm using a stadiometer (Rochester Clinical Research, NY, United States). Body circumferences were measured using a steel flexible tape (Ross Craft Anthrotape, Rosscraft Innovations Inc., Toronto, Canada). The waist circumference measurement was taken at the midpoint between the iliac crest and the edge of the last rib on a horizontal plane, with an accuracy of 0.1 cm. Hip circumference was measured at the maximum protuberance of the gluteus on a horizontal plane, with an accuracy of 0.1 cm. Body composition was determined by electrical bioimpedance (InBody 3.0 Analyzer Composition, and Bio Space, Gangnam-gu, Seoul, Korea) and classified by BMI using the WHO criteria (41). Waist-to-height ratio (WHtR) was determined by the waist circumference divided by the individual’s height, measured in centimeters.
Diet was assessed using a three-day dietary record (two weekdays and one weekend). Average energy and nutrient intake data were processed using Nutrikcal software (Nutrikcal VO®, Mexico City, Mexico), which considers the nutritional composition database of Mexican foods (42).
2.4 Biochemical profile
A 10-mL blood sample was obtained via venipuncture after a 12-h overnight fast to assess the participants’ biochemical profile, which included glucose, insulin, triglycerides (TG), total cholesterol (TC), high-density lipoprotein cholesterol (HDL-c), AST, and ALT. All biochemical tests were conducted using the Clinical Chemistry System (Beckman Coulter’s Inc., California, United States). Low-density lipoprotein cholesterol (LDL-c) concentration was determined using the Friedewald formula (43). Very low-density lipoprotein cholesterol (VLDL-c) concentration was calculated by subtracting the sum of LDL-c and HDL-c from total cholesterol.
IR was evaluated through the homeostatic model assessment (HOMA-IR) using the equation (fasting glucose mg/dL × fasting serum insulin μU/mL)/405 (44). Dyslipidemias were defined according to the NCEP-ATP III (National Cholesterol Education Program Adult Treatment Panel III) as follows: HCL as TC ≥200 mg/dL, high LDL-c (H-LDL) as LDL-c ≥130 mg/dL, HALP as HDL-c <40 mg/dL, and HTG as TG ≥150 mg/dL (45). In addition, HGL was defined as fasting glucose ≥100 mg/dL (45), hyperinsulinemia (HINS) as fasting insulin >9 μU/mL (46), and IR as HOMA-IR ≥2.5 (44).
2.5 Statistical analysis
Qualitative traits were expressed as numbers and percentages, and quantitative traits as mean ± standard deviation (SD). Chi-square test was used to assess the differences between qualitative variables, and the allelic and genotypic frequencies between the study groups. The normal distribution of quantitative variables was evaluated using the Kolmogorov–Smirnov test. Accordingly, the Student’s t-test or Mann–Whitney U test evaluated significant differences between variables. The difference in dietary intake between the FTO rs9939609 genotypes was analyzed with the ANCOVA test adjusted for energy intake. It has been reported that the genetic effect of the FTO rs9939609 T>A polymorphism is additive (46); however, given the low prevalence of the AA genotype in the study population, the analyses based on the genotype were performed using the dominant genetic model (i.e., AA + AT vs. TT). Bivariate and BMI-adjusted multivariable logistic regression analyses were used to evaluate the association between FTO rs9939609 genotypes (AA + AT vs. TT) and metabolic abnormalities. Results were expressed as odds ratio (OR) with a 95% confidence interval (CI). A p-value <0.05 was considered significant. The statistical analysis was performed with SPSS software (version 20.0; SPSS Inc., Chicago, IL, United States). Hardy–Weinberg equilibrium (HWE) was analyzed with Arlequin software for Windows (version 3.1; Berne, Switzerland).
The principal component analysis (PCA) was implemented to plot the genetic divergence between the study populations. Reference populations EUR_TSI (Tuscans, Italy); EUR_CEU (Central Europe); EAS_JPT (East Japan, Tokyo) were included to analyze genetic differentiation and ancestral components based on the genotypic frequencies for the FTO rs9939609 T>A polymorphism (1,000 Genomes Project, http://www.1000genomes.org/). Other Mexican study groups’ FTO rs9939609 allele frequency data were also included (Supplementary Table S1). The R programming language within the R Studio environment was used for the PCA (ver 4.3.3.).
3 Results
3.1 Distribution of the FTO rs9939609 polymorphism and PCA analysis
Table 1 depicts the distribution of the FTO rs9939609 T>A polymorphism among the West Mexico subpopulations included in this study. The Wixárika population had the highest T allele and TT genotype frequencies (94% and 89%), followed by the Mestizo-GDL (74% and 56%). In contrast, Mestizo-Caucasians from the town of Cuquío had the highest A allele frequency (32.4%).
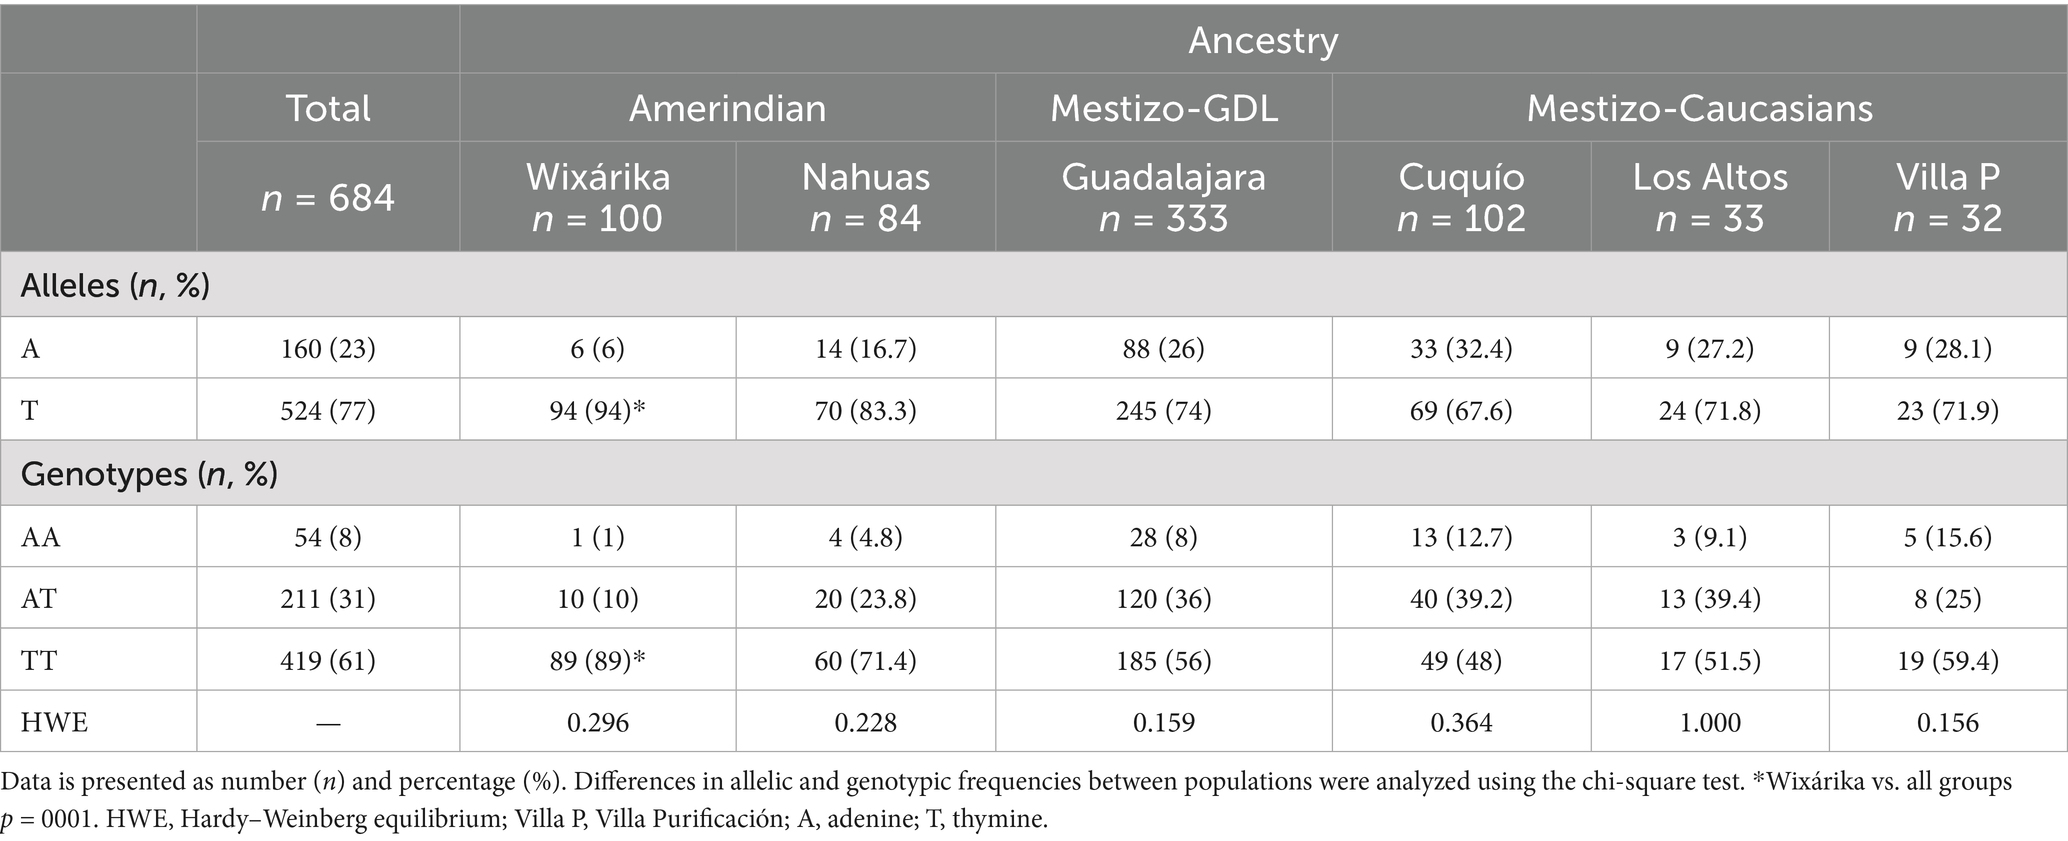
Table 1. Allelic and genotypic distribution among the study population of West Mexico.
Figure 1 illustrates the genetic differentiation between the study and reference populations in agreement with this FTO allelic/genotypic distribution. The Wixárika (Huichol) were the most differentiated group among the Amerindian clusters, which contained data from the north (Yaquis, Seris), central (Nahuas-Puebla), and south (Mayas) of Mexico, and the Nahuas study group. The Cuquío, San Miguel-Los Altos, and Villa Purificación populations clustered towards the EUR_TSI, EUR_CEU, and CDMX reference groups. In contrast, Mestizo-GDL formed an intermediate cluster with Mestizo-Northwest in agreement with the reported ancestry of these populations.
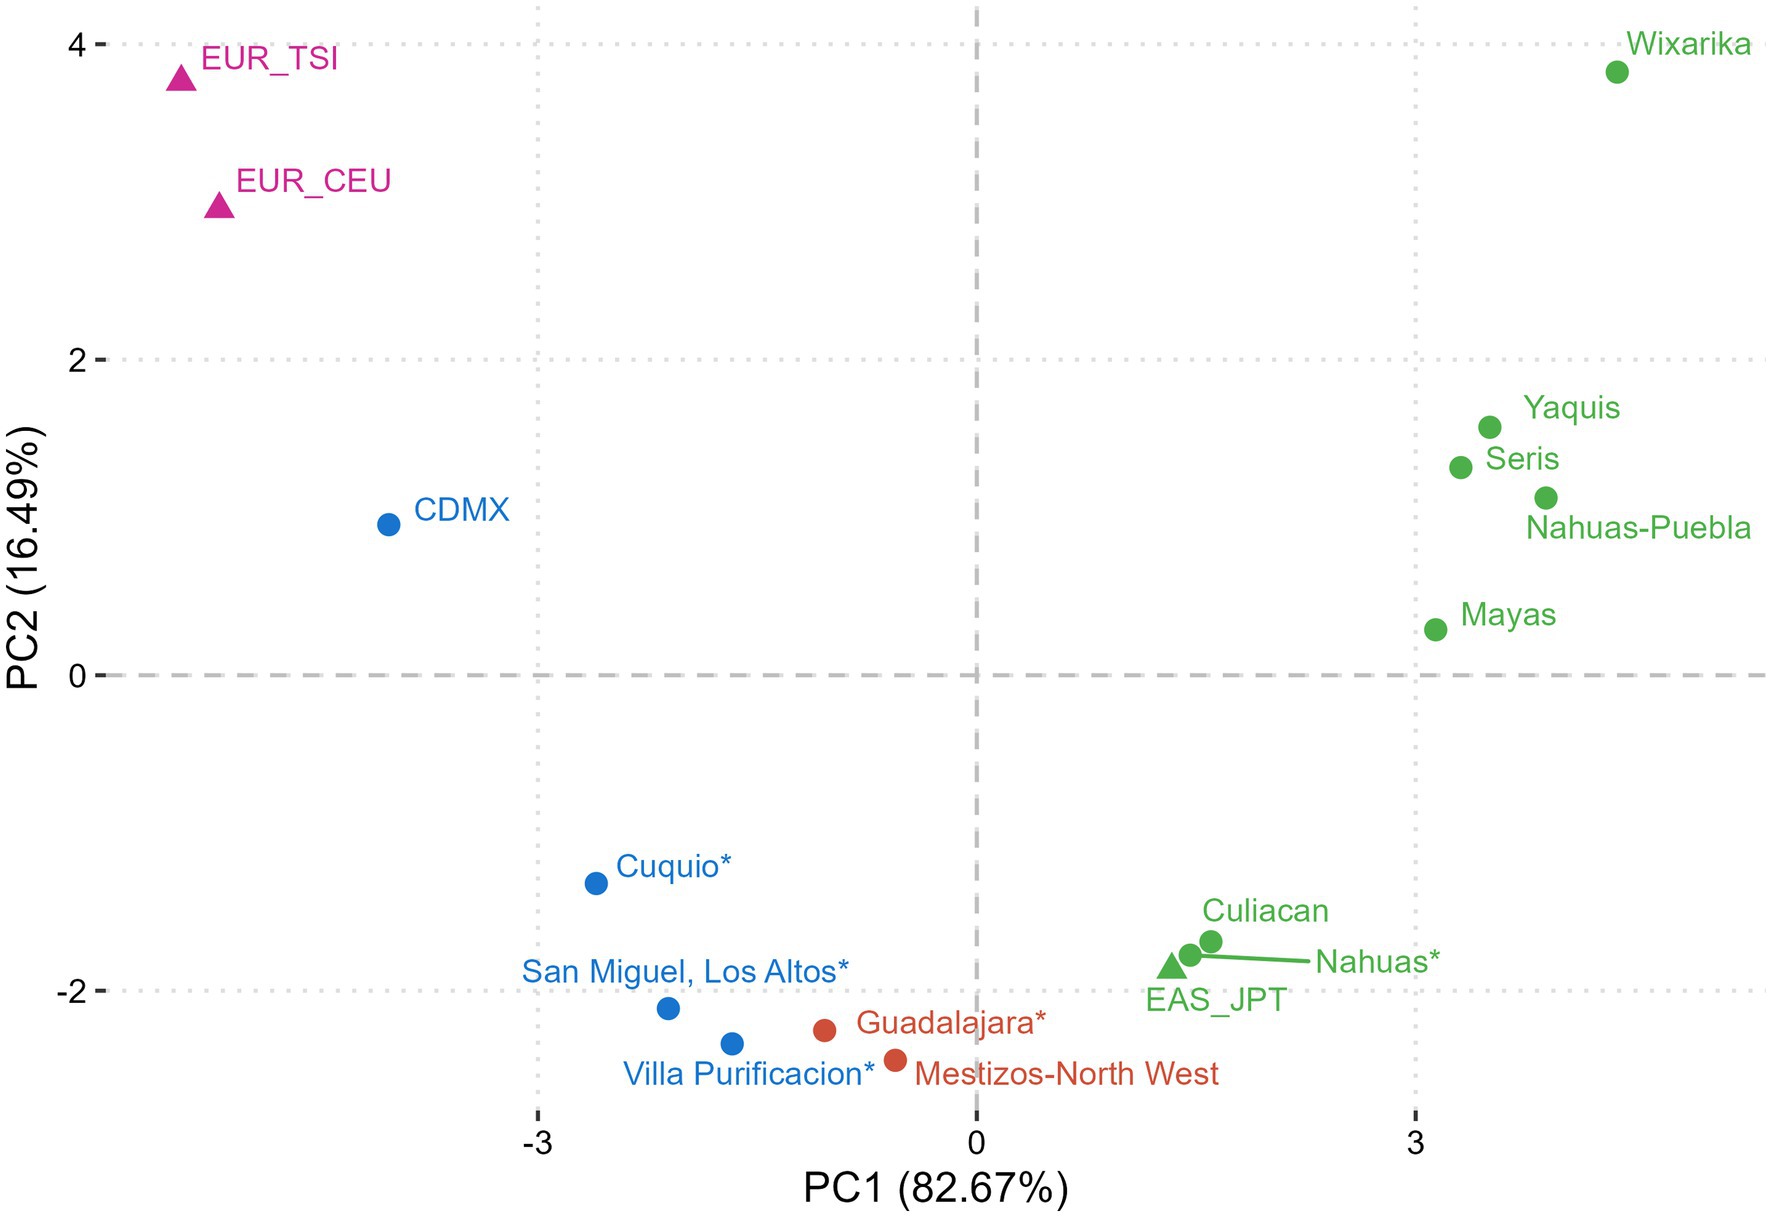
Figure 1. Principal component analysis (PCA) of ancestrality based on the FTO rs9939609 polymorphism. Populations with similar genetic components clustered based on their genetic distances. Mexican Natives (Nahuas* and Wixárika*) grouped with Amerindian references, Mestizo-Caucasians (Cuquío*, San Miguel-Los Altos*, Villa Purificación*) clustered with higher European ancestry study groups, and Mestizo-GDL (Guadalajara*) with intermediate ancestry clustered with Mestizo-Northwest. *This study. Non-Mexican population references: EUR_TSI (Tuscans, Italy); EUR_CEU (Central Europe); EAS_JPT (East Japan, Tokyo) from 1,000 Genomes Project. Mexican population references: CDMX (29), Mestizo-Northwest (48), Culiacan (66), Mayas (49), Nahuas-Puebla (48), Seris (48), and Yaquis (48). Purple dots: European ancestry; Blue dots: Admixed ancestry. Green dots: Amerindian ancestry.
3.2 Association of the FTO rs9939609 T>A polymorphism with demographic, anthropometric, and biochemical characteristics of Mestizo-GDL
In the Mestizo-GDL group, anthropometric, dietary intake, and biochemical profile assessments were performed, and their association with the FTO rs9939609 polymorphism was analyzed. The clinical data of the Mestizo-GDL were analyzed by genotypes (AA + AT vs. TT) (Table 2). The mean age of the subjects was 36.4 ± 12.9 years, and the frequency of genotypes was 46% for AA + AT and 56% for TT. No significant differences were observed in age, gender, BMI, body fat percentage, HOMA-IR, TC, HDL-c, LDL-c, AST, and ALT between AA + AT and TT genotype carriers. Nevertheless, TT genotype carriers presented significantly higher mean values of WHtR (0.52 ± 0.070 vs. 0.49 ± 0.08), insulin (10.8 ± 7.3 μU/mL vs. 8.8 ± 5.2 μU/mL), TG (141.8 ± 66.5 mg/dL vs. 125.8 ± 65.3 mg/dL), and VLDL-c (29.1 ± 14.8 mg/dL vs. 25.6 ± 14.2 mg/dL) compared to AA + AT genotype carriers (p < 0.05).
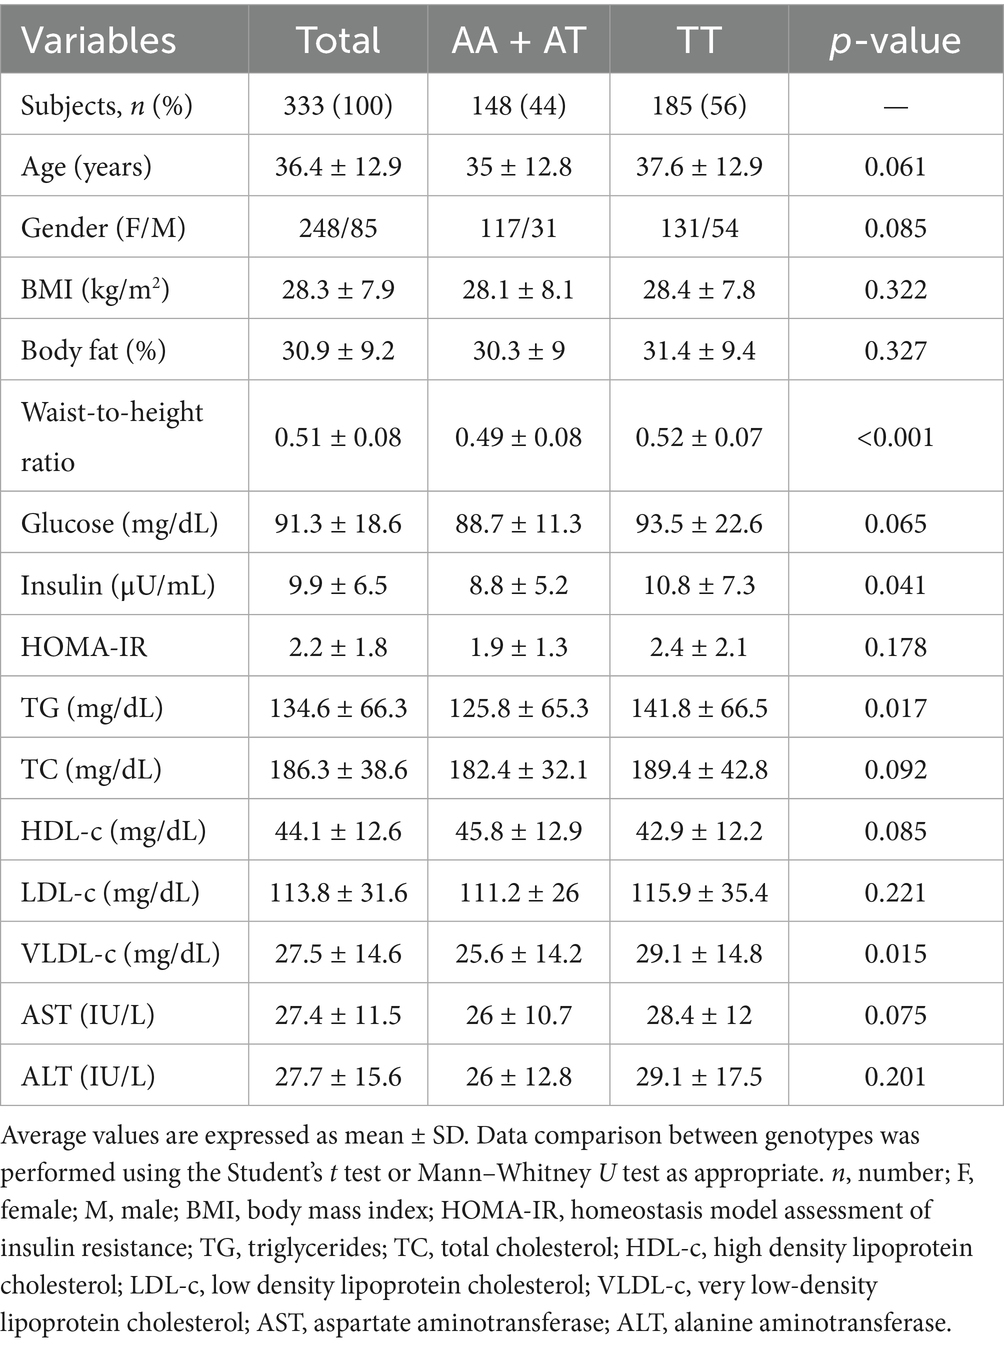
Table 2. Demographic, anthropometric, and biochemical characteristics of the Mestizo-GDL population.
3.3 Association of FTO rs9939609 T>A polymorphism genotypes with metabolic abnormalities in Mestizo-GDL
Bivariate and BMI-adjusted multivariable logistic regression analysis was performed to assess the probability of metabolic abnormalities associated with the genotypes of the FTO rs9939609 T>A polymorphism among the Mestizo-GDL. In the bivariate analysis, HGL, HOMA-IR, and HTG were related to the TT genotype (p < 0.05) (Figure 2). According to multivariable analysis, individuals with the TT genotype had a 2.5-fold higher OR of having HGL (95% CI 1.213–5.152, p = 0.013) than carriers of the AA + AT genotypes (Figure 2).
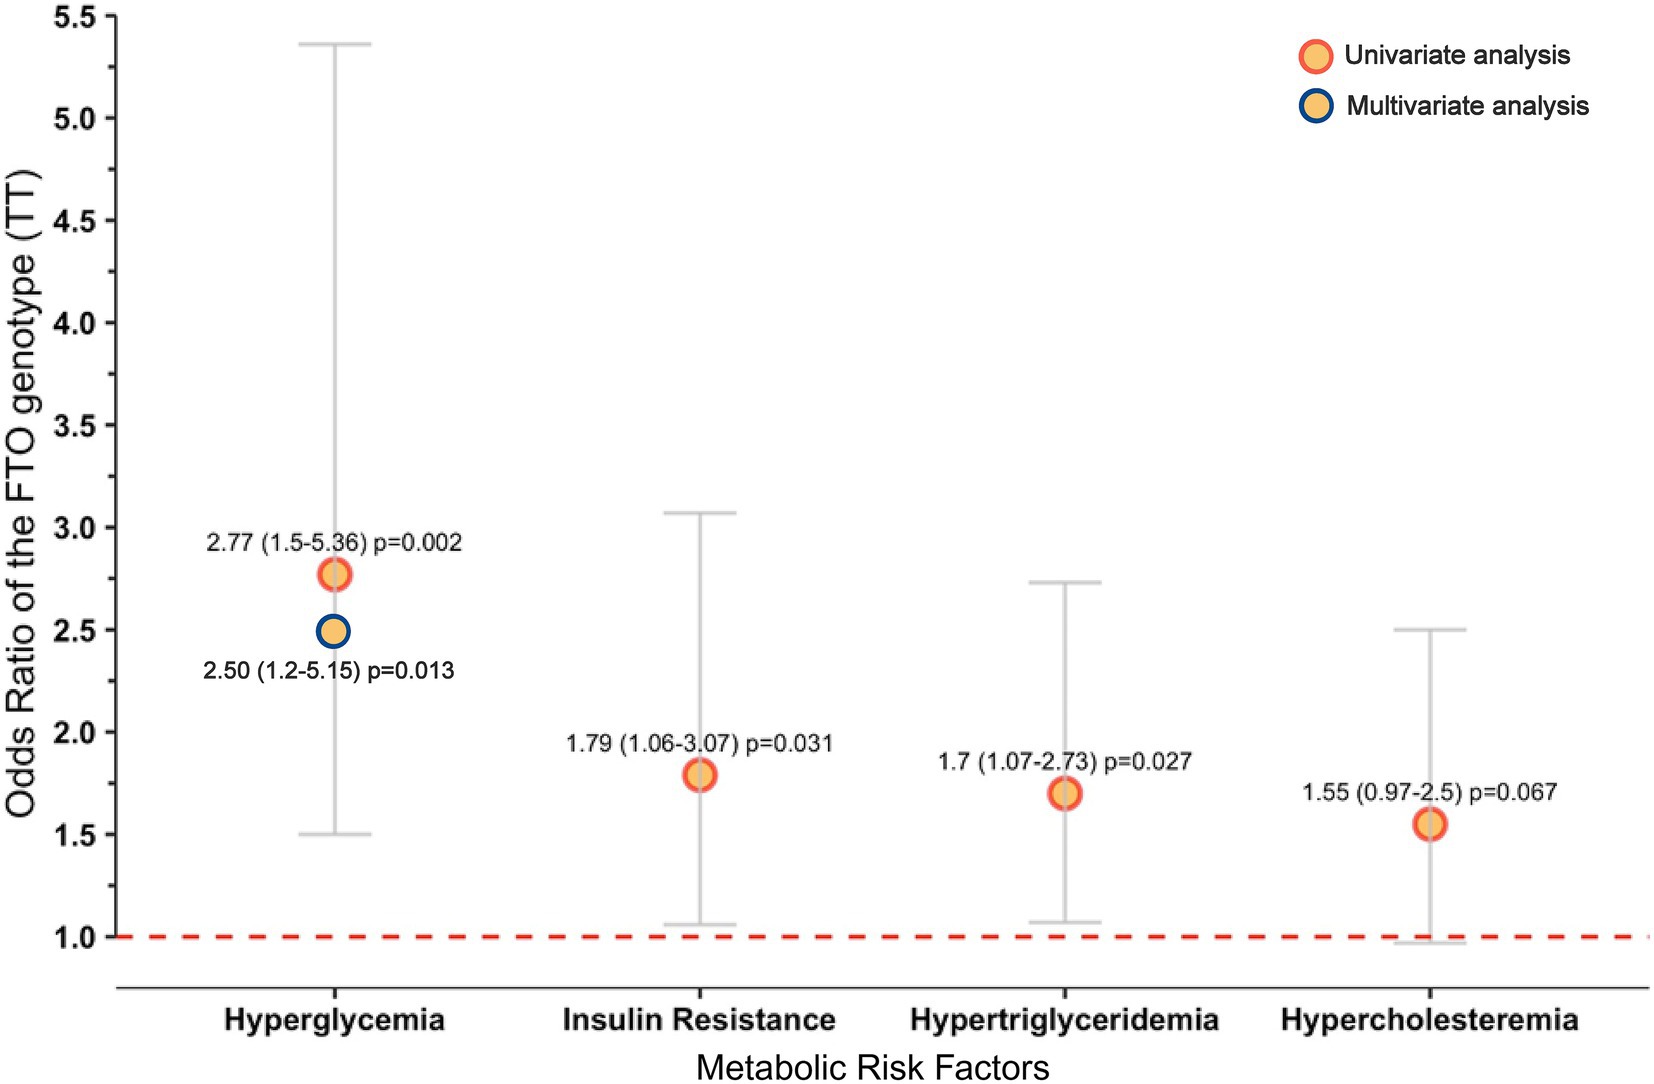
Figure 2. Metabolic abnormalities associated with the TT genotype of the FTO rs9939609 polymorphism in the Mestizo-GDL population. Hosmer and Lemeshow test: chi-square = 1.497, p = 0.473. Only variables with p < 0.05 from the univariate analysis were introduced in the multivariable analysis. Definitions: OR (95% CI), odds ratio (95% confidence interval). Hyperglycemia was defined as fasting glucose levels ≥100 mg/dL, insulin resistance as HOMA-IR ≥ 2.5, hypertriglyceridemia as triglyceride levels ≥150 mg/dL, and hypercholesterolemia as total cholesterol levels ≥200 mg/dL.
3.4 Dietary composition analysis of the study population adjusted by genotypes of the FTO rs9939609 polymorphism
Considering that dietary patterns can influence biochemical profiles, the nutritional characteristics of Mestizo-GDL subjects were analyzed according to FTO rs9939609 genotypes (AA + AT vs. TT) (Table 3). No significant differences in energy and nutrient intake by genotype were observed. Similarly, no significant differences were found when analyzing whether being a carrier of the T allele affected total kilocalories or impacted nutrient intake.
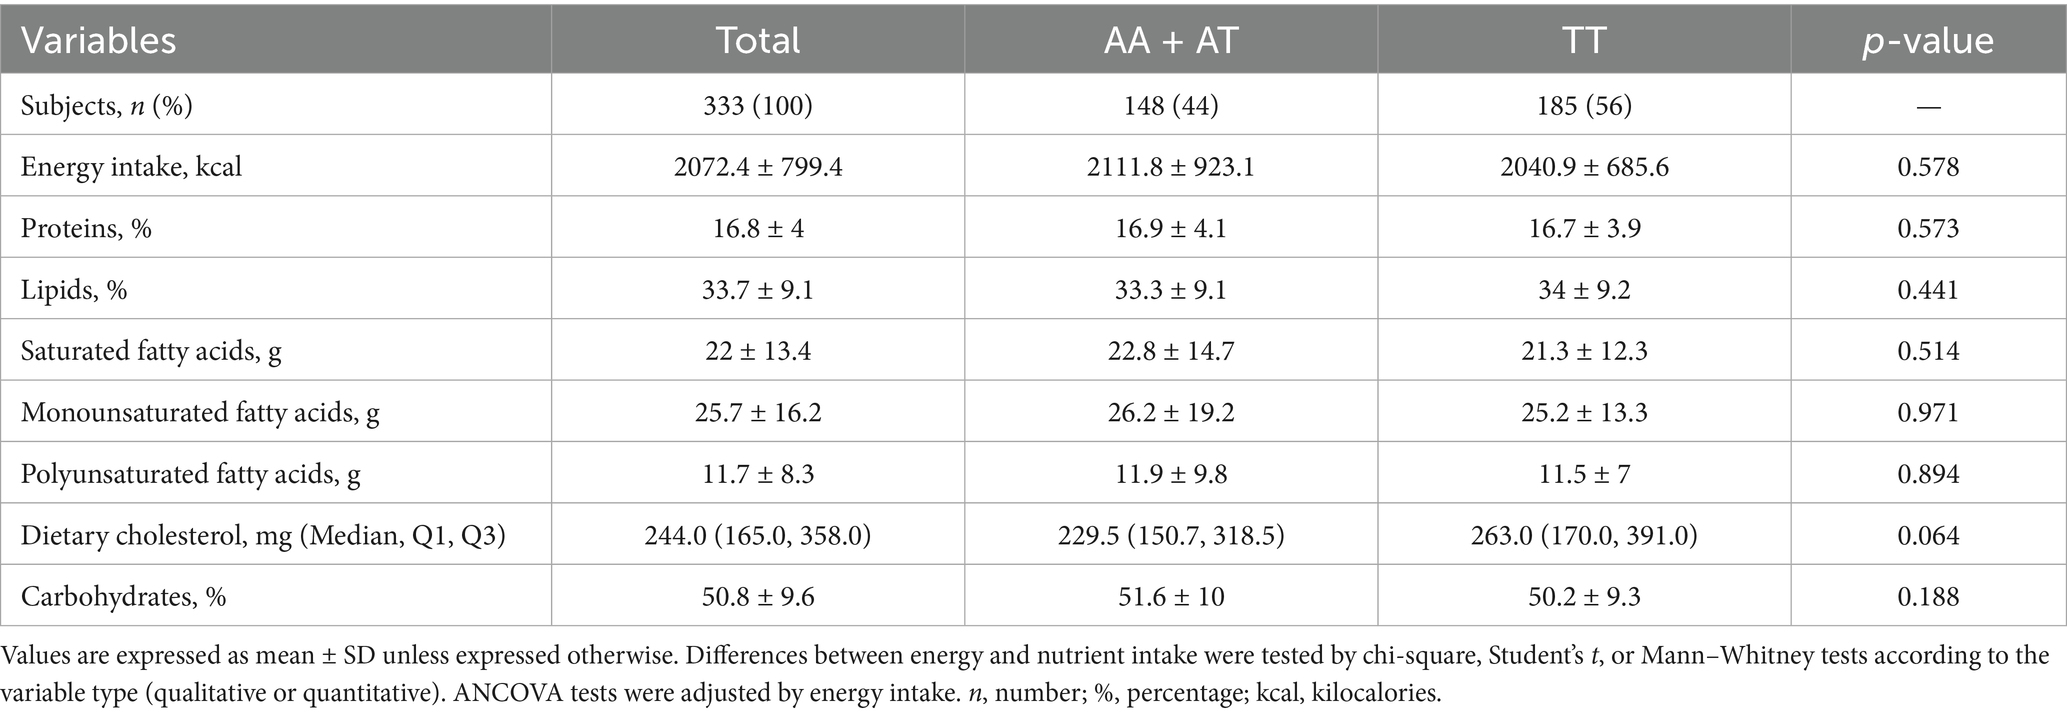
Table 3. Dietary intake adjusted by FTO rs9939609 genotypes among the Mestizo-GDL group.
4 Discussion
This study reports the distribution of the FTO rs9939609 T>A polymorphism in West Mexican populations with different proportions of genetic ancestral components. A higher frequency of the wild-type or major T allele versus the A risk allele was found in Amerindian populations, particularly in the Wixárika (T = 0.94/A = 0.06), the highest frequency reported to date (47). These findings are consistent with earlier studies revealing a higher T vs. A allele frequency among Amerindians throughout Mexico. For example, the T/A allele proportion among the Yaquis and Seris of North Mexico ranges from 0.86/0.14 to 0.91/0.09, respectively (29, 48). Other Amerindian groups follow the same pattern, such as the Nahuas from Central Mexico (0.94/0.06) (31), Zapotecas in southwest Oaxaca (0.99/0.01) (29), and Mayas in southeast Mexico (0.88/0.12) (49). In this study, the Mestizo-GDL characterized by an intermediate proportion of Amerindian and European ancestries as shown by the PCA, revealed a T/A proportion of 0.74/0.26, similar to other studies in Mexican-Mestizo (48), followed by those with a higher European ancestry (Mestizo-Caucasians) with a T/A average ratio of 0.70/0.30. Furthermore, this latter subgroup formed a cluster diverging from the Mestizo-GDL and Amerindians, consistent with these groups’ genetic and demographic history as previously reported (50). These results reflect the overall gradient of the European–Amerindian ancestral components encountered among admixed Mexicans across the country (33, 35, 51).
Earlier studies in the Mexican population have reported an association of the A allele with the risk of class III obesity (29–32) and emotional undereating or food preferences (49, 52, 53). This study found no significant differences in BMI or body fat percentage among the genotype (AA + AT vs. TT) categories. Nonetheless, carriers of the TT genotype exhibited significantly higher WHtR values, a reliable indicator of central obesity and cardiometabolic risk (54). In addition, these subjects had higher insulin, TG, and VLDL-c levels compared to AA + AT carriers. Furthermore, the bivariate analysis revealed a significant association between the TT genotype and HGL, IR, and HTG.
On the other hand, the multivariable analysis revealed that TT genotype carriers were 2.5-fold more likely to have HGL than AA + AT carriers, irrespective of their BMI. This finding may be unexpected since the A allele has been associated with increased risk, particularly of obesity, in various populations worldwide (55). Notably, the T allele or TT genotype has been associated with a leaner phenotype and better performance in energy sports among elite athletes (56).
As reported previously, the pre-Hispanic, traditional Mexican diets were historically rich in fiber, including soluble and insoluble fiber. These diets primarily consisted of endemic fruits and vegetables, particularly those found in the “Milpa” system (beans, maize, chili, zucchini, tomato). They were also abundant in minerals, vitamins with antioxidant properties, and bioactive compounds while being high in monounsaturated and polyunsaturated fats and low in saturated fats (36). However, the recent shift towards a diet rich in saturated fats and sugars, as shown in the study group, has been related to an evolutionary mismatch (57, 58). Although in this study, no significant differences in diet composition between the AA + AT and TT genotypes were observed, their dietary profiles were unhealthy, with high intakes of total fat, saturated fat, and simple carbohydrates. This dietary pattern is consistent with the “hepatopathogenic and obesogenic” features previously described in the West Mexican population, regardless of BMI (12). Furthermore, the metabolic abnormalities found in Mestizo-GDL subjects, particularly in carriers of the TT genotype, are components of the metabolic syndrome, a significant risk factor for developing cardiovascular disease, T2D, and MASLD (59). Therefore, replacing the traditional diet with contemporary hepatopathogenic foods, coupled with the presence of risk alleles, including the FTO rs9939609 polymorphism, could contribute to the higher susceptibility for dyslipidemias, IR, and HGL among the Mexican population (58, 60, 61).
Conventionally, the minor A allele (rs99396009) is the most widely studied in Mexico and globally associated with the risk for excess weight, body fat, and extreme obesity, as mentioned before. However, less attention has been given to the major T allele and its impact on metabolic health in at-risk populations, which were highly prevalent in this study. The findings in this study could be explained by considering the molecular role of the FTO gene, particularly in lipid metabolism, adipocyte maturation (20–22), and the adipose tissue expandability hypothesis (62). When the adipose capacity is exceeded due to excess caloric intake, the excess energy is stored in non-adipose tissues, favoring lipotoxicity and metabolic disturbances such as dyslipidemia and IR (62–64). A lower expression of FTO in TT genotype carriers has been reported (29, 30), which could contribute to decreased adipogenesis and limited energy storage by adipocytes (65), compared to AA genotype carriers, in which elevated adipose storage or obesity is observed (15, 55). Subjects carrying the AA + AT compared to TT genotypes might have different adipose cell storage capacities in response to excess energy intake.
Therefore, based on the high frequency of the FTO (rs9939609) TT genotype among the Wixárika and Nahuas, we suggest that this genotype could contribute to the Amerindian phenotype, characterized by a leaner body, lower adipose capacity, and lower risk of obesity/metabolic disturbances in an ancestral healthy cultural-food environment (Figure 3). Nonetheless, under a modern Westernized lifestyle, with energy-dense diets and low physical activity, adipose capacity is exceeded, contributing to the risk of developing metabolic abnormalities and chronic diseases due to a mismatched gene–environment interaction (Figure 3). Recently, in a cross-sectional study among young university students, an association between the TT genotype and the appetite trait “emotional undereating” was reported, which may reflect an evolutionary homeostatic response to ambient stress (52). In contrast, AA + AT genotypes, which were more prevalent in the Mestizo-Caucasians subpopulations, may be more representative of the European/African population’s phenotype since they are characterized by higher white adipose tissue storage capacity related to different grades of obesity before developing metabolic disturbances (Figure 3). Further studies are warranted to decipher this ethnicity-based association between the FTO polymorphisms and environmental factors.
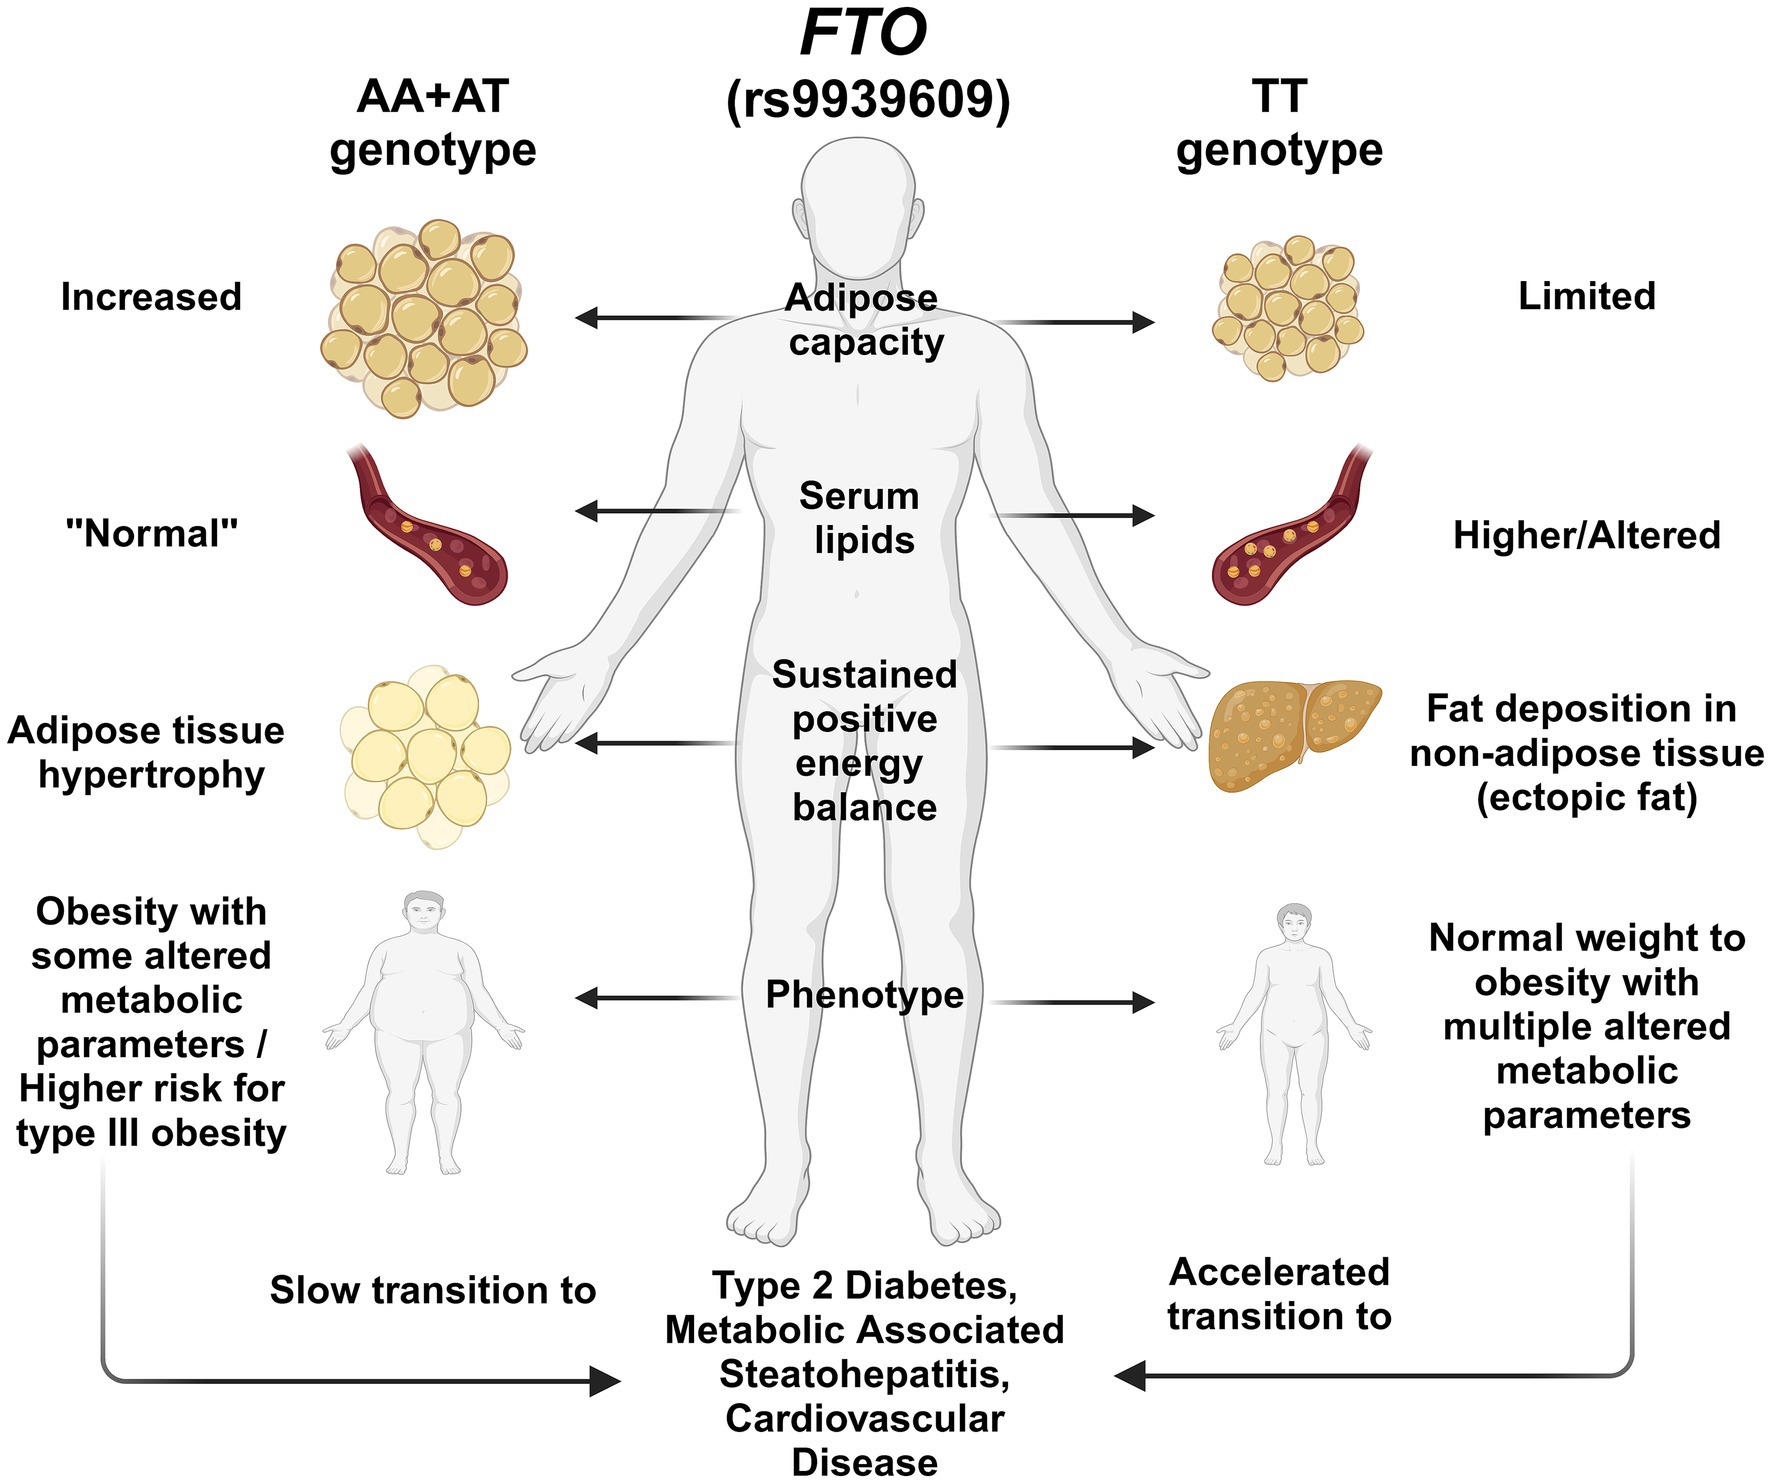
Figure 3. Illustration of the hypothesis of the effect of FTO rs9939609 polymorphism genotypes on body fat deposition and metabolic profile. T allele carriers may be at higher risk for metabolic abnormalities associated with T2D and MASLD, possibly due to reduced adipose storage capacity. In contrast, A allele carriers have better adipose storage capacity, which could make them less prone to metabolic disorders. Among the Mexican population, the T allele is predominant among the Amerindians and the admixed population of Guadalajara. In contrast, the A allele prevails more among the Mestizo-Caucasians. This feature could lead to a differential effect of the FTO polymorphism among the population.
Despite the novel insights, one of the main limitations of this study is its cross-sectional design, which restricts the ability to infer causality between FTO genotype and metabolic alteration. Although significant associations were observed, future studies need to consider potential confounding factors that may independently influence metabolic disturbances and interact with genetic susceptibility. These factors include physical activity, sleeping habits, and socioeconomic status, among others. Another discrepancy between our findings and previous studies associating the A allele and obesity is the differences in study design, statistical power, sample composition, and population characteristics that include more individuals with class III obesity (29, 30, 49, 66).
Nonetheless, this study revealed the varying range of the T allele frequency consistent with the ancestral components of the Mexicans and several metabolic abnormalities among the Mestizo-GDL that may be attributed to the Amerindian the T allele component combined with lifestyle factors. These results have significant implications for public health strategies in Mexico, suggesting tailored approaches involving personalized medicine and nutrition that consider genetic differences, lifestyle choices, and cultural preferences (50).
Although one single polymorphism cannot determine an entire phenotype, it can offer guidance for interpreting genetic variants within a specific population under specific environmental conditions from a personalized medicine perspective (33, 67). This is a breakpoint to consider how the mismatch of our ancestral genome to our modern environment could potentially enhance the prevalence of obesity and metabolic abnormalities, which contribute to the leading causes of mortality among the Mexican population. Further investigation into the underlying mechanisms and pathways influenced by the FTO (rs9939609) TT genotype can offer opportunities for personalized medicine and nutrition strategies aimed at mitigating and preventing the development of metabolic dysfunction-related diseases in Mexico.
5 Conclusion
The FTO T (rs9939609) allele was prominent among Amerindians, whereas the A allele prevailed among the Mestizo with higher European ancestry. Mestizo-GDL TT genotype carriers had higher odds of IR, HTG, and HGL, highlighting the genetic predisposition to T2D and MASLD in these populations exposed to obesogenic and hepatopathogenic environments.
Data availability statement
The original contributions presented in the study are included in the article/Supplementary material, further inquiries can be directed to the corresponding author.
Ethics statement
The studies involving humans were approved by Institutional Board Committee, University of Guadalajara. The studies were conducted in accordance with the local legislation and institutional requirements. The participants provided their written informed consent to participate in this study.
Author contributions
MS-V: Formal analysis, Investigation, Methodology, Writing – original draft, Writing – review & editing. AP: Conceptualization, Funding acquisition, Investigation, Methodology, Writing – review & editing, Visualization. LL-M: Formal analysis, Investigation, Methodology, Writing – review & editing. JC-B: Formal analysis, Investigation, Methodology, Validation, Writing – review & editing. CO-G: Formal analysis, Investigation, Methodology, Writing – review & editing. SR: Conceptualization, Funding acquisition, Investigation, Project administration, Supervision, Visualization, Writing – review & editing.
Funding
The author(s) declare that financial support was received for the research and/or publication of this article. This work was funded by the University of Guadalajara-Programa de Fortalecimiento a Institutos, Centros y Laboratorios 2018, awarded to AP, and the University of Guadalajara PROSNI 2018, awarded to SR. The publication of this work was supported by the APPAC-VII-CUCS 2025 fund.
Acknowledgments
LL-M and JC-B are recipients of CONAHCYT scholarships for their doctoral program in Molecular Biology in Medicine. The authors thank Ingrid Rivera-Iñiguez, PhD, Karina Gonzalez-Aldaco, PhD, and Alexis Jose-Abrego, PhD, for their critical feedback.
Conflict of interest
The authors declare that the research was conducted in the absence of any commercial or financial relationships that could be construed as a potential conflict of interest.
Generative AI statement
The authors declare that no Gen AI was used in the creation of this manuscript.
Any alternative text (alt text) provided alongside figures in this article has been generated by Frontiers with the support of artificial intelligence and reasonable efforts have been made to ensure accuracy, including review by the authors wherever possible. If you identify any issues, please contact us.
Publisher’s note
All claims expressed in this article are solely those of the authors and do not necessarily represent those of their affiliated organizations, or those of the publisher, the editors and the reviewers. Any product that may be evaluated in this article, or claim that may be made by its manufacturer, is not guaranteed or endorsed by the publisher.
Supplementary material
The Supplementary material for this article can be found online at: https://www.frontiersin.org/articles/10.3389/fnut.2025.1569342/full#supplementary-material
References
1. Rohm, TV, Meier, DT, Olefsky, JM, and Donath, MY. Inflammation in obesity, diabetes, and related disorders. Immunity. (2022) 55:31–55. doi: 10.1016/j.immuni.2021.12.013
2. Savari, F, and Mard, SA. Nonalcoholic steatohepatitis: a comprehensive updated review of risk factors, symptoms, and treatment. Heliyon. (2024) 10:e28468. doi: 10.1016/j.heliyon.2024.e28468
3. Wondmkun, YT. Obesity, insulin resistance, and type 2 diabetes: associations and therapeutic implications. Diabetes Metab Syndr Obes Targets Ther. (2020) 13:3611–6. doi: 10.2147/DMSO.S275898
4. The Lancet Gastroenterology & Hepatology. Redefining non-alcoholic fatty liver disease: what’s in a name? Lancet Gastroenterol Hepatol. (2020) 5:419. doi: 10.1016/S2468-1253(20)30091-1
5. NCD Risk Factor Collaboration (NCD-RisC). Worldwide trends in underweight and obesity from 1990 to 2022: a pooled analysis of 3663 population-representative studies with 222 million children, adolescents, and adults. Lancet Lond Engl. (2024) 403:1027–50. doi: 10.1016/S0140-6736(23)02750-2
6. GBD 2021 Diabetes Collaborators. Global, regional, and national burden of diabetes from 1990 to 2021, with projections of prevalence to 2050: a systematic analysis for the Global Burden of Disease Study 2021. Lancet. (2023) 402:203–34. doi: 10.1016/S0140-6736(23)01301-6
7. Blüher, M. Obesity: global epidemiology and pathogenesis. Nat Rev Endocrinol. (2019) 15:288–98. doi: 10.1038/s41574-019-0176-8
8. Schmidhuber, J, and Shetty, P. The nutrition transition to 2030. Why developing countries are likely to bear the major burden. Food Econ. (2005) 2:150–66. doi: 10.1080/16507540500534812
9. Younossi, ZM, Golabi, P, Paik, JM, Henry, A, Van Dongen, C, and Henry, L. The global epidemiology of nonalcoholic fatty liver disease (NAFLD) and nonalcoholic steatohepatitis (NASH): a systematic review. Hepatology. (2023) 77:1335–47. doi: 10.1097/HEP.0000000000000004
10. Campos-Nonato, I, Galván-Valencia, Ó, Hernández-Barrera, L, Oviedo-Solís, C, and Barquera, S. Prevalencia de obesidad y factores de riesgo asociados en adultos mexicanos: resultados de la Ensanut 2022. Salud Publica Mex. (2023) 65:s238–47. doi: 10.21149/14809
11. Basto-Abreu, A, Barrientos-Gutiérrez, T, Rojas-Martínez, R, Aguilar-Salinas, CA, López-Olmedo, N, De La Cruz-Góngora, V, et al. Prevalencia de diabetes y descontrol glucémico en México: resultados de la Ensanut 2016. Salud Pública México. (2019) 62:50. doi: 10.21149/10752
12. Sepulveda-Villegas, M, Roman, S, Rivera-Iñiguez, I, Ojeda-Granados, C, Gonzalez-Aldaco, K, Torres-Reyes, LA, et al. High prevalence of nonalcoholic steatohepatitis and abnormal liver stiffness in a young and obese Mexican population. PLoS One. (2019) 14:e0208926. doi: 10.1371/journal.pone.0208926
13. Palacio-Mejía, LS, Hernández-Ávila, JE, Hernández-Ávila, M, Dyer-Leal, D, Barranco, A, Quezada-Sánchez, AD, et al. Leading causes of excess mortality in Mexico during the COVID-19 pandemic 2020–2021: a death certificates study in a middle-income country. Lancet Reg Health Am. (2022) 13:100303. doi: 10.1016/j.lana.2022.100303
14. Fischer, J, Emmerling, C, and Ruther, U. On the history of FTO. Obes Facts. (2008) 1:43–4. doi: 10.1159/000113466
15. Frayling, TM, Timpson, NJ, Weedon, MN, Zeggini, E, Freathy, RM, Lindgren, CM, et al. A common variant in the FTO gene is associated with body mass index and predisposes to childhood and adult obesity. Science. (2007) 316:889–94. doi: 10.1126/science.1141634
16. Dina, C, Meyre, D, Gallina, S, Durand, E, Körner, A, Jacobson, P, et al. Variation in FTO contributes to childhood obesity and severe adult obesity. Nat Genet. (2007) 39:724–6. doi: 10.1038/ng2048
17. Wei, J, Liu, F, Lu, Z, Fei, Q, Ai, Y, He, PC, et al. Differential m6A, m6Am, and m1A demethylation mediated by FTO in the cell nucleus and cytoplasm. Mol Cell. (2018) 71:973–985.e5. doi: 10.1016/j.molcel.2018.08.011
18. Li, Y-L, Li, L, Liu, Y-H, Hu, L-K, and Yan, Y-X. Identification of metabolism-related proteins as biomarkers of insulin resistance and potential mechanisms of m6A modification. Nutrients. (2023) 15:1839. doi: 10.3390/nu15081839
19. Fredriksson, R, Hägglund, M, Olszewski, PK, Stephansson, O, Jacobsson, JA, Olszewska, AM, et al. The obesity gene, FTO, is of ancient origin, up-regulated during food deprivation and expressed in neurons of feeding-related nuclei of the brain. Endocrinology. (2008) 149:2062–71. doi: 10.1210/en.2007-1457
20. Wang, P, Yang, F-J, Du, H, Guan, Y-F, Xu, T-Y, Xu, X-W, et al. Involvement of leptin receptor long isoform (LepRb)-STAT3 signaling pathway in brain fat mass- and obesity-associated (FTO) downregulation during energy restriction. Mol Med. (2011) 17:523–32. doi: 10.2119/molmed.2010.00134
21. Karra, E, O’Daly, OG, Choudhury, AI, Yousseif, A, Millership, S, Neary, MT, et al. A link between FTO, ghrelin, and impaired brain food-cue responsivity. J Clin Invest. (2013) 123:3539–51. doi: 10.1172/JCI44403
22. Zhang, M, Zhang, Y, Ma, J, Guo, F, Cao, Q, Zhang, Y, et al. The demethylase activity of FTO (fat mass and obesity associated protein) is required for preadipocyte differentiation. PLoS One. (2015) 10:e0133788. doi: 10.1371/journal.pone.0133788
23. Martin Carli, JF, LeDuc, CA, Zhang, Y, Stratigopoulos, G, and Leibel, RL. FTO mediates cell-autonomous effects on adipogenesis and adipocyte lipid content by regulating gene expression via 6mA DNA modifications. J Lipid Res. (2018) 59:1446–60. doi: 10.1194/jlr.M085555
24. Yang, Z, Yu, G, Zhu, X, Peng, T, and Lv, Y. Critical roles of FTO-mediated mRNA m6A demethylation in regulating adipogenesis and lipid metabolism: implications in lipid metabolic disorders. Genes Dis. (2021) 9:51–61. doi: 10.1016/j.gendis.2021.01.005
25. Karczewski, KJ, Francioli, LC, Tiao, G, Cummings, BB, Alföldi, J, Wang, Q, et al. The mutational constraint spectrum quantified from variation in 141,456 humans. Nature. (2020) 581:434–43. doi: 10.1038/s41586-020-2308-7
26. Claussnitzer, M, Hui, C-C, and Kellis, M. FTO obesity variant and adipocyte browning in humans. N Engl J Med. (2016) 374:192–3. doi: 10.1056/NEJMc1513316
27. Tanofsky-Kraff, M, Han, JC, Anandalingam, K, Shomaker, LB, Columbo, KM, Wolkoff, LE, et al. The FTO gene rs9939609 obesity-risk allele and loss of control over eating. Am J Clin Nutr. (2009) 90:1483–8. doi: 10.3945/ajcn.2009.28439
28. Brunkwall, L, Ericson, U, Hellstrand, S, Gullberg, B, Orho-Melander, M, and Sonestedt, E. Genetic variation in the fat mass and obesity-associated gene (FTO) in association with food preferences in healthy adults. Food Nutr Res. (2013) 57:3–4. doi: 10.3402/fnr.v57i0.20028
29. Villalobos-Comparán, M, Flores-Dorantes, MT, Villarreal-Molina, MT, Rodríguez-Cruz, M, García-Ulloa, AC, Robles, L, et al. The FTO gene is associated with adulthood obesity in the Mexican population. Obesity. (2008) 16:2296–301. doi: 10.1038/oby.2008.367
30. Villalobos-Comparán, M, Antuna-Puente, B, Villarreal-Molina, MT, Canizales-Quinteros, S, Velázquez-Cruz, R, León-Mimila, P, et al. Interaction between FTO rs9939609 and the Native American-origin ABCA1 rs9282541 affects BMI in the admixed Mexican population. BMC Med Genet. (2017) 18:46. doi: 10.1186/s12881-017-0410-y
31. León-Mimila, P, Villamil-Ramírez, H, Villalobos-Comparán, M, Villarreal-Molina, T, Romero-Hidalgo, S, López-Contreras, B, et al. Contribution of common genetic variants to obesity and obesity-related traits in mexican children and adults. PLoS One. (2013) 8:e70640. doi: 10.1371/journal.pone.0070640
32. Martínez-López, E, Perez-Robles, M, Torres-Vanegas, J, Godinez-Mora, S, Llamas-Covarrubias, IM, and Campos-Perez, W. FTO rs9939609: T>A variant and physical inactivity as important risk factors for class III obesity: a cross-sectional study. Healthcare. (2024) 12:787. doi: 10.3390/healthcare12070787
33. Sohail, M, Palma-Martínez, MJ, Chong, AY, Quinto-Cortés, CD, Barberena-Jonas, C, Medina-Muñoz, SG, et al. Mexican Biobank advances population and medical genomics of diverse ancestries. Nature. (2023) 622:775–83. doi: 10.1038/s41586-023-06560-0
34. Moreno-Estrada, A, Gignoux, CR, Fernández-López, JC, Zakharia, F, Sikora, M, Contreras, AV, et al. Human genetics. The genetics of Mexico recapitulates Native American substructure and affects biomedical traits. Science. (2014) 344:1280–5. doi: 10.1126/science.1251688
35. García-Ortiz, H, Barajas-Olmos, F, Contreras-Cubas, C, Cid-Soto, MÁ, Córdova, EJ, Centeno-Cruz, F, et al. The genomic landscape of Mexican Indigenous populations brings insights into the peopling of the Americas. Nat Commun. (2021) 12:5942. doi: 10.1038/s41467-021-26188-w
36. Ojeda-Granados, C, Panduro, A, Gonzalez-Aldaco, K, Sepulveda-Villegas, M, Rivera-Iñiguez, I, and Roman, S. Tailoring nutritional advice for Mexicans based on prevalence profiles of diet-related adaptive gene polymorphisms. J Pers Med. (2017) 7:16. doi: 10.3390/jpm7040016
37. Torres-Valadez, R, Roman, S, Jose-Abrego, A, Sepulveda-Villegas, M, Ojeda-Granados, C, Rivera-Iñiguez, I, et al. Early detection of liver damage in Mexican patients with chronic liver disease. J Transl Intern Med. (2017) 5:49–57. doi: 10.1515/jtim-2017-0003
38. Panduro, A, Ramos-Lopez, O, Campollo, O, Zepeda-Carrillo, EA, Gonzalez-Aldaco, K, Torres-Valadez, R, et al. High frequency of the DRD2/ANKK1 A1 allele in Mexican Native Amerindians and Mestizos and its association with alcohol consumption. Drug Alcohol Depend. (2017) 172:66–72. doi: 10.1016/j.drugalcdep.2016.12.006
39. Ojeda-Granados, C, Panduro, A, Rebello Pinho, JR, Ramos-Lopez, O, Gleyzer, K, de Mello Malta, F, et al. Association of lactase persistence genotypes with high intake of dairy saturated fat and high prevalence of lactase non-persistence among the Mexican population. J Nutr Nutr. (2016) 9:83–94. doi: 10.1159/000446241
40. Miller, SA, Dykes, DD, and Polesky, HF. A simple salting out procedure for extracting DNA from human nucleated cells. Nucleic Acids Res. (1988) 16:1215. doi: 10.1093/nar/16.3.1215
41. World Health Organization. (2024). Physical status: the use of and interpretation of anthropometry, report of a WHO expert committee. Available online at: https://www.who.int/publications/i/item/9241208546. (Accessed October 14, 2024)
42. Pérez Lizaur, AB, Palacios González, B, and Castro Becerra, AL. Sistema Mexicana de Alimentos y Equivalentes. 5th ed. Mexico: Fomento de Nutrición y Salud (2008).
43. Tremblay, AJ, Morrissette, H, Gagné, JM, Bergeron, J, Gagné, C, and Couture, P. Validation of the Friedewald formula for the determination of low-density lipoprotein cholesterol compared with beta-quantification in a large population. Clin Biochem. (2004) 37:785–90. doi: 10.1016/j.clinbiochem.2004.03.008
44. Matthews, DR, Hosker, JP, Rudenski, AS, Naylor, BA, Treacher, DF, and Turner, RC. Homeostasis model assessment: insulin resistance and beta-cell function from fasting plasma glucose and insulin concentrations in man. Diabetologia. (1985) 28:412–9. doi: 10.1007/BF00280883
45. National Cholesterol Education Program (NCEP) Expert Panel on Detection, Evaluation, and Treatment of High Blood Cholesterol in Adults (Adult Treatment Panel III). Third report of the National Cholesterol Education Program (NCEP) expert panel on detection, evaluation, and treatment of high blood cholesterol in adults (Adult Treatment Panel III) final report. Circulation. (2002) 106:3143–421. doi: 10.1161/circ.106.25.3143
46. Arrizabalaga, M, Larrarte, E, Margareto, J, Maldonado-Martín, S, Barrenechea, L, and Labayen, I. Preliminary findings on the influence of FTO rs9939609 and MC4R rs17782313 polymorphisms on resting energy expenditure, leptin and thyrotropin levels in obese non-morbid premenopausal women. J Physiol Biochem. (2014) 70:255–62. doi: 10.1007/s13105-013-0300-5
47. dbSNP. (2024). rs9939609 RefSNP report. Available online at: https://www.ncbi.nlm.nih.gov/snp/rs9939609#seq_hash. (Accessed October 10, 2024)
48. Costa-Urrutia, P, Abud, C, Franco-Trecu, V, Colistro, V, Rodríguez-Arellano, ME, Alvarez-Fariña, R, et al. Effect of 15 BMI-associated polymorphisms, reported for Europeans, across ethnicities and degrees of Amerindian ancestry in Mexican children. Int J Mol Sci. (2020) 21:374. doi: 10.3390/ijms21020374
49. Vázquez-Pérez, LA, Hattori-Hara, M, Arankowsky-Sandoval, G, Pérez-Mendoza, G, Rubi-Castellanos, R, Rangel-Méndez, JA, et al. Association between personality traits, eating behaviors, and the genetic polymorphisms FTO-rs9939609 and MAO-A 30 bp u-VNTR with obesity in Mexican Mayan children. Front Genet. (2024) 15:1421870. doi: 10.3389/fgene.2024.1421870
50. Panduro, A, Roman, S, Mariscal-Martinez, IM, Jose-Abrego, A, Gonzalez-Aldaco, K, Ojeda-Granados, C, et al. Personalized medicine and nutrition in hepatology for preventing chronic liver disease in Mexico. Front Nutr. 11:1379364. doi: 10.3389/fnut.2024.1379364
51. Norris, ET, Wang, L, Conley, AB, Rishishwar, L, Mariño-Ramírez, L, Valderrama-Aguirre, A, et al. Genetic ancestry, admixture and health determinants in Latin America. BMC Genomics. (2018) 19:861. doi: 10.1186/s12864-018-5195-7
52. Rivera-Iñiguez, I, Hunot-Alexander, C, Sepúlveda-Villegas, M, Campos-Medina, L, and Roman, S. Relationship between energy balance and reward system gene polymorphisms and appetitive traits in young Mexican subjects. Front Nutr. (2024) 11:1373578. doi: 10.3389/fnut.2024.1373578
53. Madrigal-Juarez, A, Martínez-López, E, Sanchez-Murguia, T, Magaña-de la Vega, L, Rodriguez-Echevarria, R, Sepulveda-Villegas, M, et al. FTO genotypes (rs9939609 T>A) are associated with increased added sugar intake in healthy young adults. Lifestyle Genom. (2023) 16:214–23. doi: 10.1159/000534741
54. Rangel-Baltazar, E, Cuevas-Nasu, L, Shamah-Levy, T, Rodríguez-Ramírez, S, Méndez-Gómez-Humarán, I, and Rivera, JA. Association between high waist-to-height ratio and cardiovascular risk among adults sampled by the 2016 half-way National Health and Nutrition Survey in Mexico (ENSANUT MC 2016). Nutrients. (2019) 11:1402. doi: 10.3390/nu11061402
55. Scuteri, A, Sanna, S, Chen, WM, Uda, M, Albai, G, Strait, J, et al. Genome-wide association scan shows genetic variants in the FTO gene are associated with obesity-related traits. PLoS Genet. (2007) 3:e115. doi: 10.1371/journal.pgen.0030115
56. Zmijewski, P, and Leońska-Duniec, A. Association between the FTO A/T polymorphism and elite athlete status in Caucasian swimmers. Genes. (2021) 12:715. doi: 10.3390/genes12050715
57. Roman, S. Genome-based nutritional strategies to prevent chronic liver disease. Ann Hepatol. (2019) 18:537–8. doi: 10.1016/j.aohep.2019.05.005
58. Roman, S, Campos-Medina, L, and Leal-Mercado, L. Personalized nutrition: the end of the one-diet-fits-all era. Front Nutr. (2024) 11:1370595. doi: 10.3389/fnut.2024.1370595
59. Kg, A, Eckel, RH, Grundy, SM, Zimmet, PZ, Cleeman, JI, Ka, D, et al. Harmonizing the metabolic syndrome: a joint interim statement of the International Diabetes Federation Task Force on Epidemiology and Prevention; National Heart, Lung, and Blood Institute; American Heart Association; World Heart Federation; International Atherosclerosis Society; and International Association for the Study of Obesity. Circulation. (2009) 120:1640–5. doi: 10.1161/CIRCULATIONAHA.109.192644
60. Aguilar-Salinas, CA, Tusie-Luna, T, and Pajukanta, P. Genetic and environmental determinants of the susceptibility of Amerindian derived populations for having hypertriglyceridemia. Metabolism. (2014) 63:887–94. doi: 10.1016/j.metabol.2014.03.012
61. Torres-Valadez, R, Roman, S, Ojeda-Granados, C, Gonzalez-Aldaco, K, and Panduro, A. Differential distribution of gene polymorphisms associated with hypercholesterolemia, hypertriglyceridemia, and hypoalphalipoproteinemia among Native American and Mestizo Mexicans. World J Hepatol. (2022) 14:1408–20. doi: 10.4254/wjh.v14.i7.1408
62. Virtue, S, and Vidal-Puig, A. Adipose tissue expandability, lipotoxicity and the metabolic syndrome—an allostatic perspective. Biochim Biophys Acta. (2010) 1801:338–49. doi: 10.1016/j.bbalip.2009.12.006
63. Gustafson, B, Hedjazifar, S, Gogg, S, Hammarstedt, A, and Smith, U. Insulin resistance and impaired adipogenesis. Trends Endocrinol Metab. (2015) 26:193–200. doi: 10.1016/j.tem.2015.01.006
64. Aslam, M, Aggarwal, S, Sharma, KK, Galav, V, and Madhu, SV. Postprandial hypertriglyceridemia predicts development of insulin resistance glucose intolerance and type 2 diabetes. PLoS One. (2016) 11:e0145730. doi: 10.1371/journal.pone.0145730
65. Blüher, M. Metabolically healthy obesity. Endocr Rev. (2020) 41:bnaa004. doi: 10.1210/endrev/bnaa004
66. Velazquez-Roman, J, Angulo-Zamudio, UA, León-Sicairos, N, Medina-Serrano, J, DeLira-Bustillos, N, Villamil-Ramírez, H, et al. Association of FTO, ABCA1, ADRB3, and PPARG variants with obesity, type 2 diabetes, and metabolic syndrome in a northwest Mexican adult population. J Diabetes Complicat. (2021) 35:108025. doi: 10.1016/j.jdiacomp.2021.108025
Keywords: FTO, Amerindian, type 2 diabetes, MASLD, metabolic syndrome, dyslipidemia, obesity, ancestry
Citation: Sepulveda-Villegas M, Panduro A, Leal-Mercado L, Cardenas-Benitez JP, Ojeda-Granados C and Roman S (2025) The fat-mass and obesity-associated gene rs9939609 T allele is prominent among the native Mexican population and is associated with risk for Type 2 diabetes and metabolic dysfunction-associated steatotic liver disease. Front. Nutr. 12:1569342. doi: 10.3389/fnut.2025.1569342
Edited by:
L. Joseph Su, University of Texas Southwestern Medical Center, United StatesReviewed by:
Jerzy Beltowski, Medical University of Lublin, PolandHerald Midzi, Family Health International 360, Zimbabwe
Copyright © 2025 Sepulveda-Villegas, Panduro, Leal-Mercado, Cardenas-Benitez, Ojeda-Granados and Roman. This is an open-access article distributed under the terms of the Creative Commons Attribution License (CC BY). The use, distribution or reproduction in other forums is permitted, provided the original author(s) and the copyright owner(s) are credited and that the original publication in this journal is cited, in accordance with accepted academic practice. No use, distribution or reproduction is permitted which does not comply with these terms.
*Correspondence: Sonia Roman, c29uaWEucm9tYW5AYWNhZGVtaWNvcy51ZGcubXg=
†Present address: Claudia Ojeda-Granados, Department of Medical and Surgical Sciences and Advanced Technologies “GF Ingrassia”, University of Catania, Catania, Italy