 Piao Chen
 Jin Wang
 Ling Liu
 Xiaoling Liu
- Department of Tuberculosis, The Second Hospital of Nanjing, Nanjing, China
Background: Current research predominantly emphasizes the impact of diet on sleep, while overlooking the role of oxidative effects influenced by lifestyle factors. The Oxidative Balance Score (OBS) provides a comprehensive measure of individual overall oxidative stress exposure, integrating 16 dietary nutrients and 4 lifestyle factors that affect oxidative processes.
Methods: To explore the relationship between OBS and sleep-related problems, data from the National Health and Nutrition Examination Survey (NHANES) conducted between 2005 and 2008 were utilized for cross-sectional analyses. OBS was calculated following previously validated methods. Sleep-related problems were assessed based on self-reported data, including sleep duration, sleep-onset latency, obstructive sleep apnea (OSA), sleep problems and day sleepiness. Weighted logistic regression was applied to estimate OR and 95% CI. To examine potential nonlinear relationships between OBS and the risk of sleep-related problems, generalized additive models and two-part linear regression models were employed. Additionally, these models were used to identify points of inflection.
Results: Logistic regression analysis revealed an inverse association between OBS and the risk of insufficient sleep hours (OR = 0.98, 95% CI, 0.96 -0.99, p < 0.01). Generalized additive models and two-part linear regression models identified a nonlinear relationship between OBS and the risk of developing OSA and excessive sleep onset latency, with inflection points of 17.5 score and 10.5 score, respectively.
Conclusion: Our study showed an inverse linear relationship between OBS and the risk of insufficient sleep hours, alongside a nonlinear relationship between OBS and the risks of developing OSA and excessive sleep onset latency.
1 Introduction
Sleep quality is a crucial determinant of an individual’s quality of life (1), as it is intricately linked to the prevalence of numerous diseases and indirectly affects economic costs through its effects on human safety and productivity (2). Research indicates that approximately 45% of adults in the United States suffer from insufficient sleep (3). Research estimates that the economic costs associated with sleep deprivation in the United States range from $288–$411 billion, accounting for 2.28% of the United States’ GDP, and this figure is projected to rise to $318–$456 billion by 2030 (3). Given these substantial costs, addressing and studying sleep-related issues is essential for both individuals and society.
Some studies have identified a direct relationship between the balance of antioxidants and pro-oxidants and sleep quality, suggesting that an appropriate daily intake of these compounds may enhance sleep (4, 5). However, most existing research primarily focuses on the effects of overall dietary patterns or specific nutrient, such as vitamin D (6), omega-3 polyunsaturated fatty acids (7), while overlooking the influence of oxidative stress related to lifestyle factors. The Oxidative Balance Score (OBS) offers a comprehensive measure of overall oxidative stress exposure within a population by calculating a total score based on an individual’s smoking habits, alcohol consumption, physical activity and dietary intake of pro-oxidants and antioxidants (8). OBS has been shown to correlate significantly with various biomarkers of oxidative stress, including 8-hydroxydeoxyguanosine (9), superoxide dismutase (10), glutathione peroxidase (10) and C-reactive protein (11). Nevertheless, most studies exploring the relationship between OBS and sleep have been limited to specific populations, and the sleep indicators involved have not been consistent (12–14).
Therefore, to fill the knowledge gap on the relationship between OBS and sleep disorders, we utilized public data from National Health and Nutrition Examination Survey (NHANES) to assess the impact of OBS on various sleep disorders, including sleep duration, sleep-onset latency, obstructive sleep apnea (OSA), sleep problems and day sleepiness.
2 Subjects and methods
2.1 Data and sample sources
The NHANES is a periodic national program conducted by the National Center for Health Statistics (NCHS) to assess the nutritional and health status of adults in the United States (15). This program employs a series of multi-stage stratified sample designs to ensure comprehensive and representative data collection. At the time of recruitment, the NCHS obtains informed consent from each participant through a standardized consent form (15). For more detailed information regarding the survey design, codebook, and methodologies employed in NHANES, interested individuals can visit the official NHANES website at https://www.cdc.gov/nchs/nhanes/index.htm.
This investigation utilized data from the NHANES cycles of 2005–2006 and 2007–2008, which included a total of 20,497 participants. To ensure the integrity and completeness of the dataset, several exclusions were made. Specifically, we excluded 9,429 participants due to missing sleep data and 4,713 participants due to missing OBS data. Additionally, 31 participants aged 85 years or older were excluded (because NHANES categorizes all individuals ≥ 85 years old as 85 years old), along with 331 participants missing marital status information, 638 participants missing education level data, 266 participants missing poverty income ratio (PIR) data, 237 participants missing depression data and 61 participants missing blood pressure data. After applying these exclusions, the final analysis included data from 4,791 participants. Further details can be found in Figure 1.
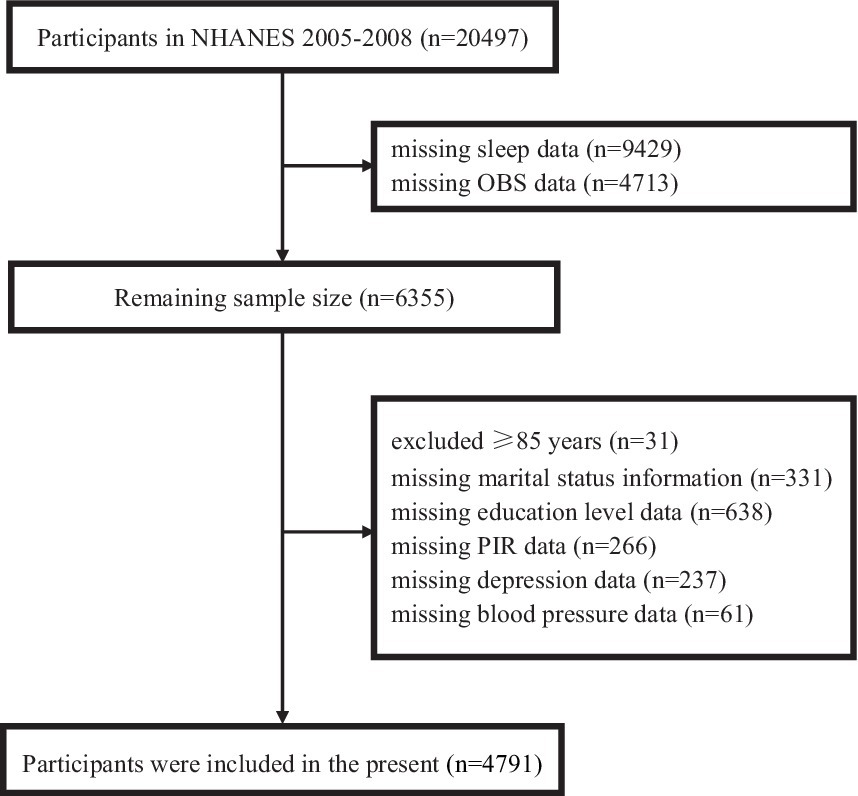
Figure 1. Flow chart for study participants selection.
2.2 Assessment of sleep-related outcomes
The NHANES 2005–2008 released a comprehensive set of sleep questionnaires aligned with the Sleep Heart Health Study. In our study, we utilized the National Sleep Foundation guidelines (16) and the Healthy People 2020 (17) definition of sleep-related problems and selected the following self-reported outcomes related to sleep quality:
Sleep duration: categorized as sleep deprivation (<6 h/night), normal (7–8 h/night), or excessive (≥9 h/night) (16);
Sleep onset latency: categorized as normal (6–30 min/night), prolonged (> 30 min/night), or short (≤ 5 min/night) (18);
OSA: considered to be OSA when any of the following conditions are met: physician-diagnosed sleep apnea; snoring ≥ 3 nights per week; or snoring, gasping or stopping breathing ≥ 3 nights per week; or even though sleeping ≥ 7 h per night on weekdays and on work nights, but still feel very sleepy during the day 16–30 times per month (17);
Sleep problems: sleep problems were considered frequent if participants responded “yes,” “often” or self-reported ≥ 5 times per month in response to any of the following questions from the NHANES Sleep Questionnaire. “Have you ever told a doctor or other health professional that you have trouble sleeping?,” “In the past month, how often did you have trouble falling asleep?,” “In the past month, how often did you wake up during the night and had trouble getting back to sleep?” or “In the past month, how often did you wake up too early in the morning and were unable to get back to sleep?” (17);
Day sleepiness: Day sleepiness was considered frequent if participants answered “yes,” “often” or self-reported ≥ 5 times per month in response to any of the following questions from the NHANES Sleep Questionnaire. “In the past month, how often did you feel unrested during the day, no matter how many hours of sleep you had?” or “In the past month, how often did you feel excessively or overly sleepy during the day?” (17).
2.3 Assessment of OBS
OBS was calculated based on 16 dietary factors and 4 lifestyle factors that influence oxidative processes (19). The 16 dietary factors include dietary fiber, carotene, riboflavin, niacin, vitamin B6, total folate, vitamin B12, vitamin C, vitamin E, calcium, magnesium, zinc, copper, selenium, total fat and iron. The 4 lifestyle factors consist of physical activity, alcoholic consumption, body mass index (BMI) and cotinine. Among these factors, total fat, iron, BMI, alcohol consumption and smoking were classified as pro-oxidants while the remaining factors were classified as antioxidants. Variables were categorically scored from 0 to 2 based on the sex-specific tertiles of each component, and the point assignment for antioxidants and pro-oxidants was inverse (19). The scoring method for each component is detailed in Supplementary Table 1. Both antioxidants and pro-oxidants were rated on a scale from 0 to 2 points. Antioxidants received scores of 0, 1 and 2 in ascending order, while pro-oxidants were scored 0, 1 and 2 in descending order. The total OBS is the sum of the scores of the 20 constituents, with a possible range from 0 to 40 score (20). A higher score indicates a greater proportion of antioxidant exposure relative to pro-oxidant exposure.
In NHANES, participants’ dietary data were collected through two 24-h dietary recall interviews (24HR). The first 24HR was collected in the Mobile Examination Center, and the second was collected by telephone 3 to 10 days later. The dietary intake of OBS in this study was calculated as the mean of these two recalls.
The lifestyle components of OBS include alcoholic consumption, smoking, BMI and physical activity. Serum cotinine, as a major nicotine metabolite and its long half-life, has been used to assess active smoking and environmental tobacco exposure, serum cotinine levels were used to assess participants’ smoking status. Detailed descriptions of serum cotinine measurement are available on the NHANES website. BMI was from NHANES body measures collected by trained health technicians. Alcohol consumption was collected from the Alcohol Use Questionnaire, the average amount (drinks) of alcoholic beverages on those days when alcohol was consumed in the past 12 months was treated as sex-specific tertiles and subsequently assigned points (19). The metabolic equivalent (MET) scores, which were calculated from data collected by the Physical Activity Questionnaire (PAQ), were assigned for physical activity. MET serves to quantify the relative energy expenditure associated with various activities. Within the PAQ survey, the MET values corresponding to distinct categories of activities, encompassing vigorous work-related takes, moderate work-related takes, walking or bicycling for transportation, vigorous leisure-time physical activities and moderate leisure-time physical activities, were meticulously documented. Moreover, the quantification of physical activity was ascertained through the computation of the product derived by multiplying the MET value by the weekly frequency and duration of each specific physical activity (21).
2.4 Covariates
We included covariates based on previous studies (13, 14), including sex (male/female), age (years), race (Mexican American/other Hispanic/non-Hispanic white/non-Hispanic black/other race), PIR, education level (<high school/high school/> high school), marital status (married/divorced, widowed or separated/unmarried or cohabiting), hyperlipidemia (yes/no), diabetes mellitus (yes/no), hypertension (yes/no) and depression status.
According to previous literature (22–25), the diagnostic criteria for hyperlipidemia include total cholesterol ≥ 200 mg/dL, triglycerides ≥ 150 mg/dL, LDL ≥ 130 mg/dL, HDL < 40 mg/dL for men and < 50 mg/dL for women, or the use of lipid-lowering drugs (22). The diagnostic criteria for diabetes mellitus include self-report of having been diagnosed as diabetes mellitus by a physician, HbA1c ≥ 6.5%, use of insulin or antidiabetic medication, fasting glucose ≥ 7.0 mmol/L, random glucose ≥ 11.1 mmol/L, or 2 h glucose (from oral glucose tolerance test) ≥ 11.1 mmol/L (23). The diagnostic criteria for hypertension include self-report of having been diagnosed as high blood pressure by a physician, systolic blood pressure ≥ 140 mmHg or diastolic blood pressure ≥ 90 mmHg, or the use of antihypertensive medication (24). Depression status was assessed using the PHQ-9 questionnaire, with a score of ≥ 10 considered to be depressed (25).
2.5 Statistical analysis
In this study, all statistical tests were two-sided and differences were considered statistically significant at p < 0.050. We excluded all missing values and used R3.4.3 version1 and Empower software (X&Y solutions Inc., Boston, MA)2 for data analysis.
Given the complexity of the NHANES sampling design, we incorporated 2 years of sample weights in our analyses, following the guidelines provided in the official NHANES tutorial. Continuous variables were expressed as mean (SE) and categorical variables as percentage (SE). To compare differences in participants’ baseline characteristics, we used weighted linear regression for continuous variables and weighted chi-square tests for categorical variables. To estimate the linear relationship between the OBS and sleep-related problems, we constructed logistic regression models, adjusting for a range of confounders. Confounders were selected on the basis that their correlation with the outcome or effect estimate varied by more than 10% (26). Model 1 was an unadjusted model. Model 2 was adjusted for age, gender and race. Model 3 was further adjusted for blood pressure, PIR, depression, diabetes, hyperlipidemia, education and marital status, based on Model 2. To explore the nonlinear relationship between OBS and the risk of developing sleep-related problems, generalized additive models was employed. Upon identifying a nonlinear correlation, we applied segmented regression (also known as piece-wise regression) that uses a separate line segment to fit each interval. A log-likelihood ratio test was performed to compare the one-line (non-segmented) model with segmented regression model, in order to determine whether a threshold exists. Then the K value of the fitted model with the maximum likelihood was identified using a two-step recursive method, which serves as the inflection point connecting the segmented intervals (27). We also treated OBS as a continuous variable in these logistic models to perform trend tests between OBS and sleep-related problems. Finally, subgroup analyses and interaction tests were conducted to identify potential interactions across different population settings and demographics. Additionally, we explored the potential for unmeasured confounding between sleep-related outcomes and OBS by calculating E-values (28). The E-value quantifies the required magnitude of an unmeasured confounder that could negate the observed association between sleep-related outcomes and OBS.
3 Results
3.1 Baseline characteristics of participants
A total of 4,791 participants were included in this study, with a mean age of 45.23 ± 0.51 years. Among them, 2,503 (50.99%) were male, and 2,317 (49.01%) were female. Participants with insufficient sleep hours, excessive sleep onset latency, OSA, day sleepiness, sleep problems were 34.83, 15.29, 55.71, 29.84 and 40.38%, respectively. Significant differences (p < 0.05) in the OBS were observed across OBS quartiles with varying PIR, education levels, race, marital status, and the presence of diabetes, hypertension, hyperlipidemia, or depression. The specific characteristics of the participants are detailed in Table 1.
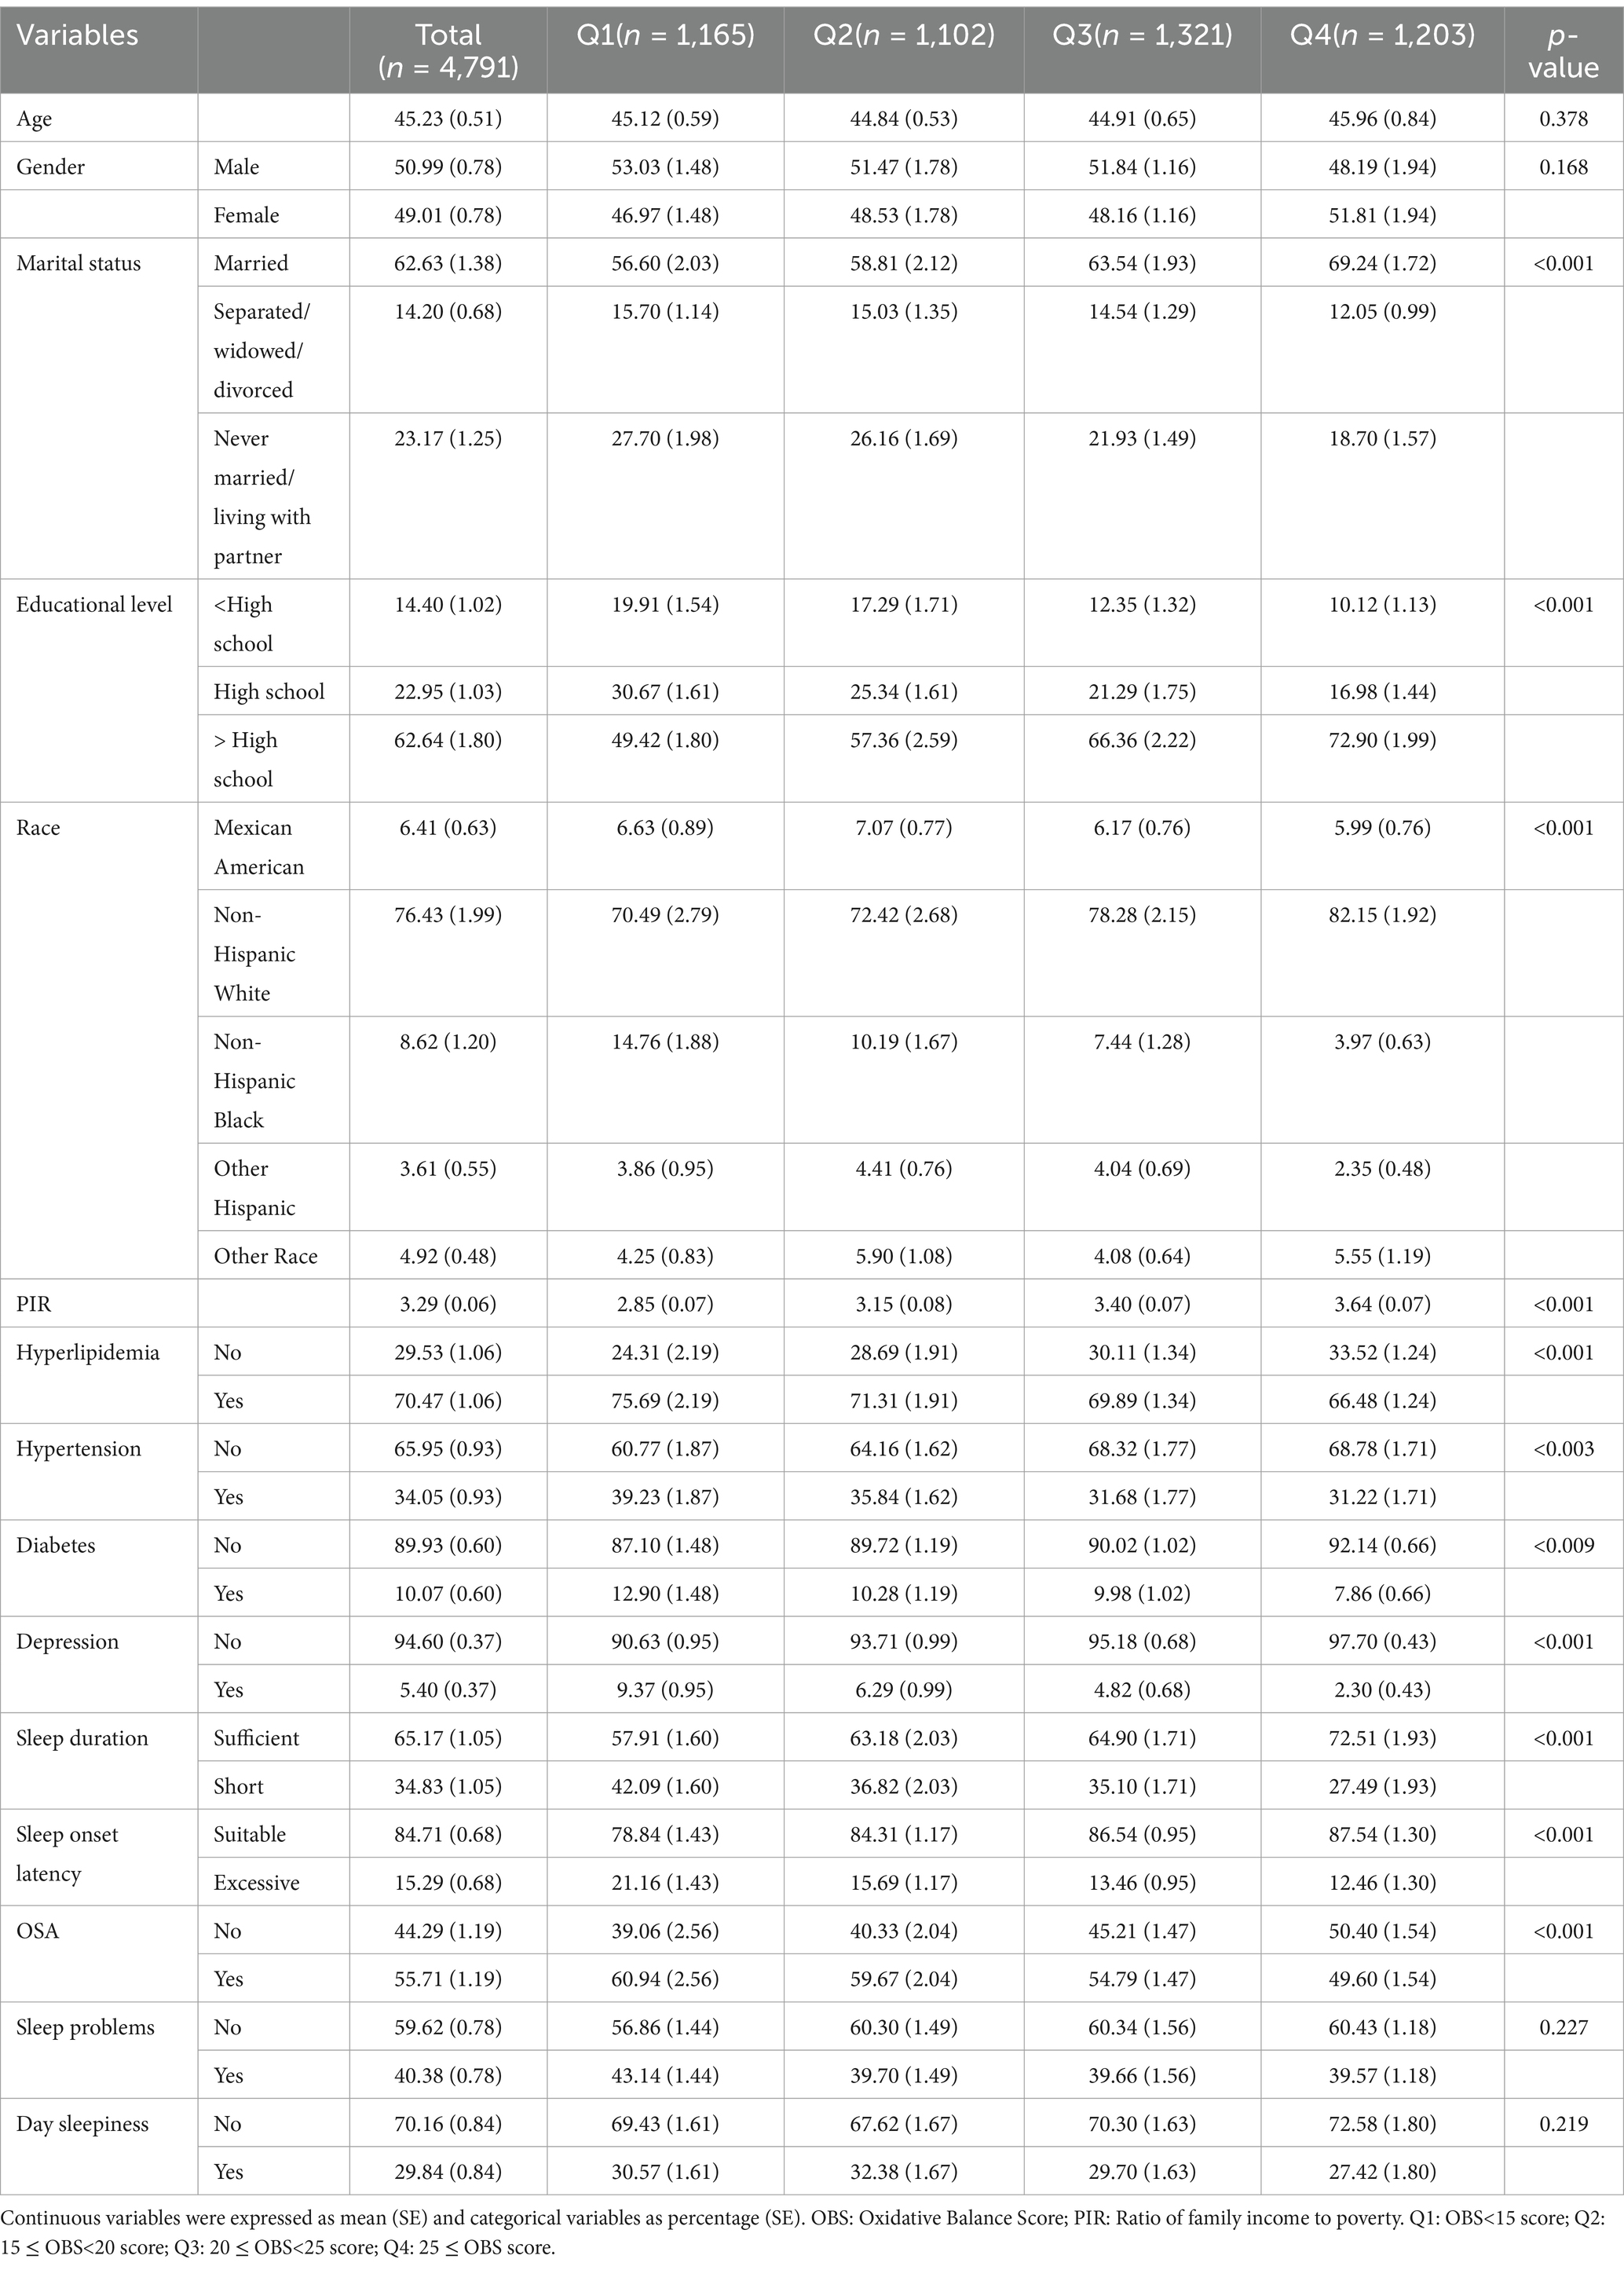
Table 1. General analysis of the study population.
3.2 Relationship between OBS and sleep-related outcomes
3.2.1 Logistic analysis of OBS and sleep-related outcomes
Our findings indicate that participants with low OBS were at a greater risk of experiencing insufficient sleep hours and developing OSA. The association between OBS and insufficient sleep hours was significantly correlated in the original model (OR = 0.96, 95% CI 0.95–0.97, p < 0.001) and the minimum-adjusted model (OR = 0.97, 95% CI 0.95–0.98, p < 0.001). In the fully adjusted model, this association remained stable (OR = 0.98, 95% CI 0.96–0.99, p = 0.004). Similarly, a significant association was observed between OBS and the risk of developing OSA. In the original model (OR = 0.97, 95% CI 0.96–0.98, p < 0.001) and in the minimum-adjusted model (OR = 0.97, 95% CI 0.95–0.98, p < 0.001). This relationship also remained consistent in the fully adjusted model (OR = 0.97, 95% CI 0.96–0.99, p = 0.003). Further details are presented in Table 2.
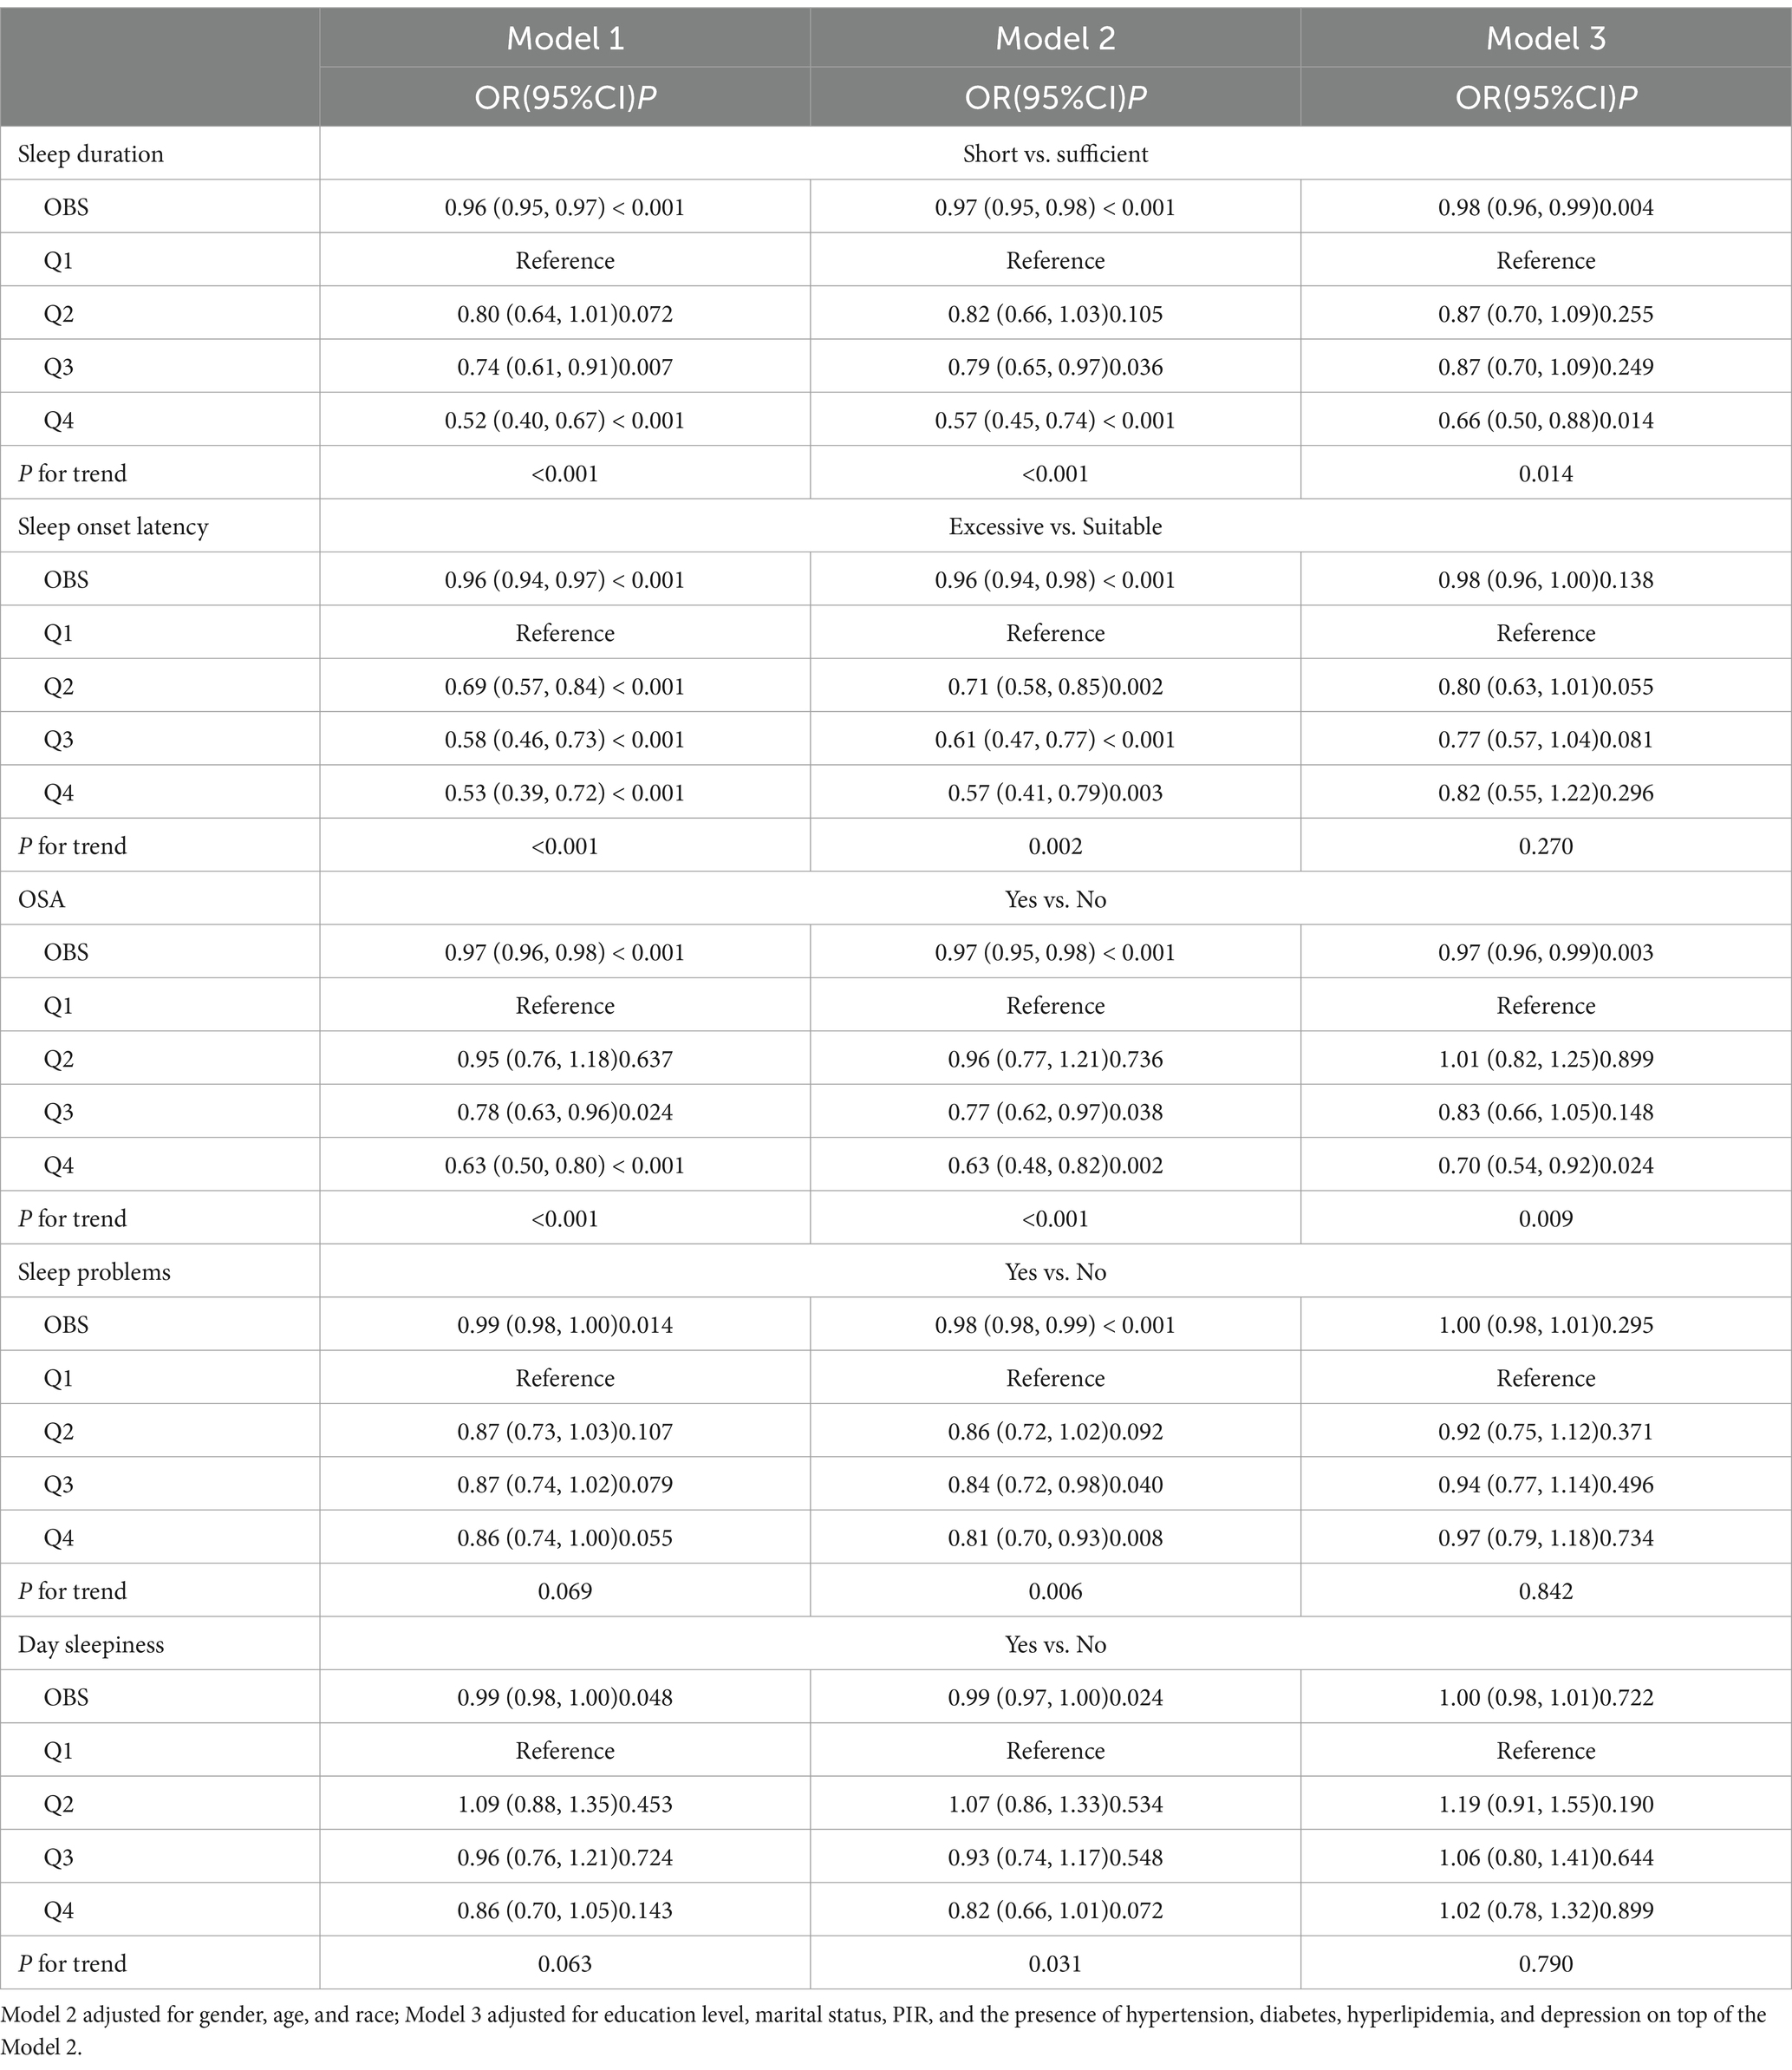
Table 2. Logistic and trend analysis of OBS and sleep-related outcomes.
3.2.2 Trend analysis of OBS and sleep-related outcomes
To further perform sensitivity analyses, we transformed the continuous variable OBS into a categorical variable. Regarding the risk of developing OSA, the highest quartile demonstrated a statistically significant 30% reduction in risk compared to the lowest quartile (OR = 0.70, 95% CI 0.54–0.92, p = 0.024). In contrast, the Q2 group showed 1% reduction in risk and the Q3 group showed 17% reduction in the risk of developing OSA compared to the lowest quartile. However, these associations were not statistically significant. Further details are presented in Table 2.
3.2.3 The analyses of non-linear relationship
A nonlinear relationship was observed between OBS and the risk of developing OSA as well as excessive sleep onset latency. Utilizing a two-part linear regression model, we calculated that the inflection point between OBS and the risk of developing OSA was 17.5 score, when OBS < 17.5 score, the effect value was 1.01 (95% CI 0.98–1.04, p = 0.443), when OBS > 17.5, the effect value was 0.96 (95% CI 0.95–0.98, p < 0.001). 10.5 score was the inflection point between OBS and the risk of excessive sleep onset latency, when OBS < 10.5 score, the effect value was 0.84 (95% CI 0.73–0.96, p = 0.009), when OBS > 10.5 score, the effect value was 0.99 (95% CI 0.97–1.00, p = 0.111). Further details can be found in Table 3 and Figure 2.

Table 3. Analysis of non-linear relationships between OBS and sleep-related outcomes.
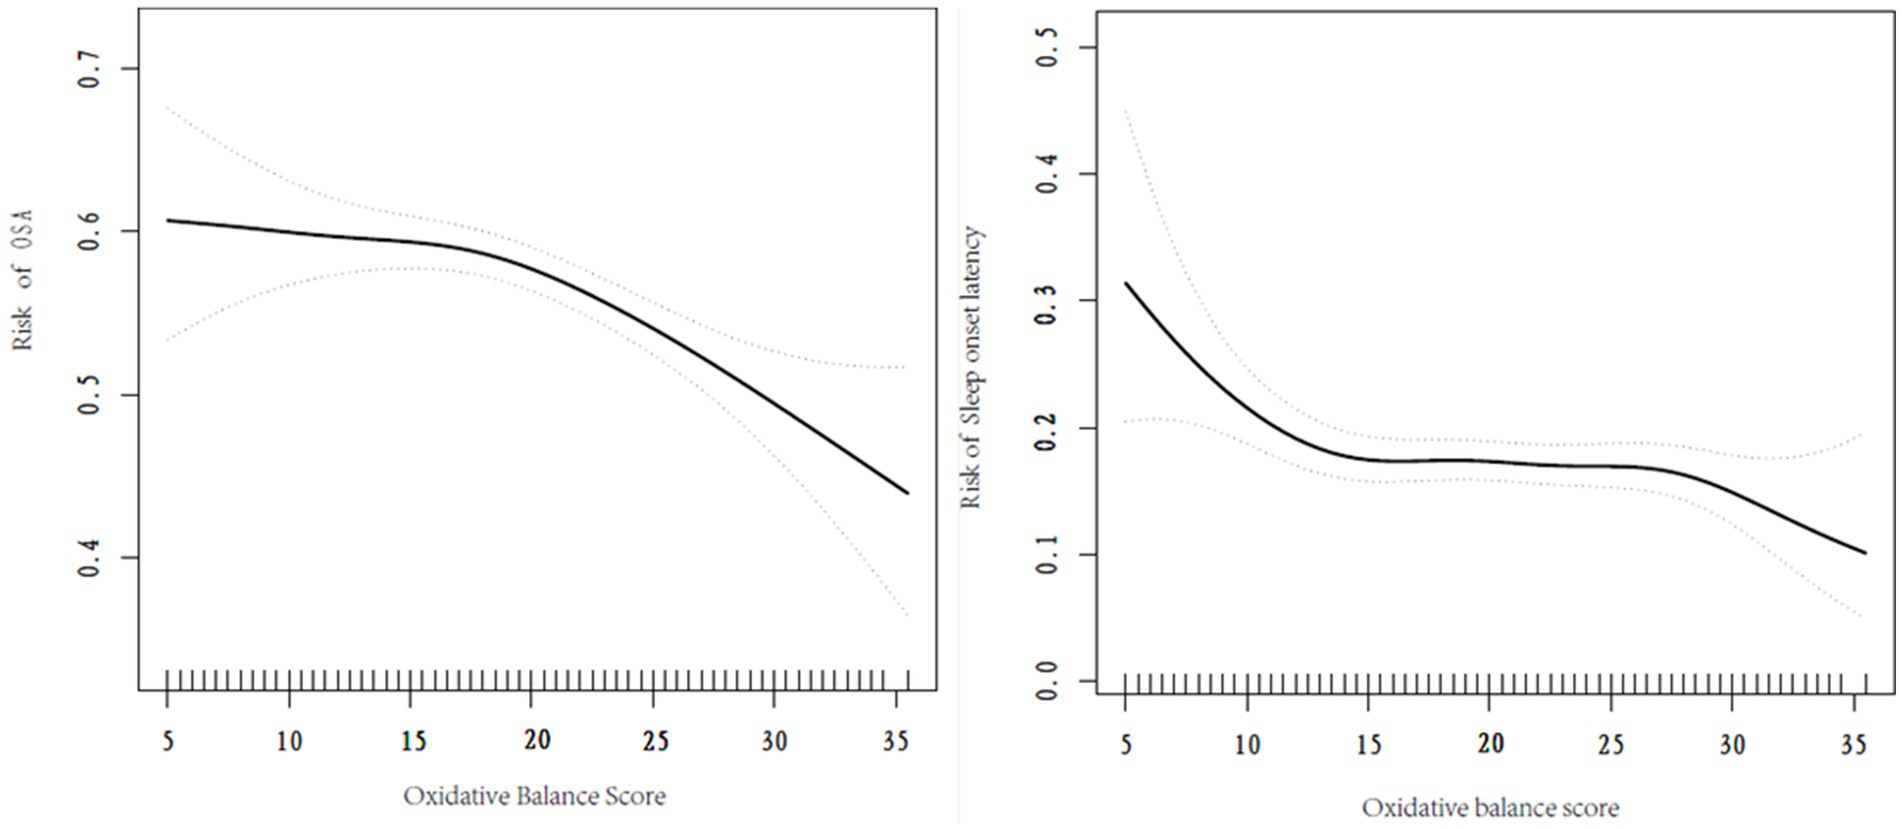
Figure 2. Smoothed curve fitting plot.
3.2.4 Subgroup analysis and E-value
The results of the subgroup analyses are presented in Table 4. After adjusting for confounders, the negative associations between OBS and insufficient sleep hours as well as the risk of developing OSA, remained stable. Furthermore, the interaction test revealed that the correlation between OBS and sleep-related problems did not significantly differ across various strata (all interaction p > 0.05). This indicates that the relationship between OBS and sleep-related problems is consistent and unaffected by age, gender, race, etc. For more detailed information, please refer to Table 4. Additionally, we calculated E values to evaluate the sensitivity of our findings to potential unmeasured confounding factors. As demonstrated in Table 5, the E values suggested that our results are robust, provided that there are no unmeasured confounders with odds ratio exceed the E values associated with sleep-related outcomes.
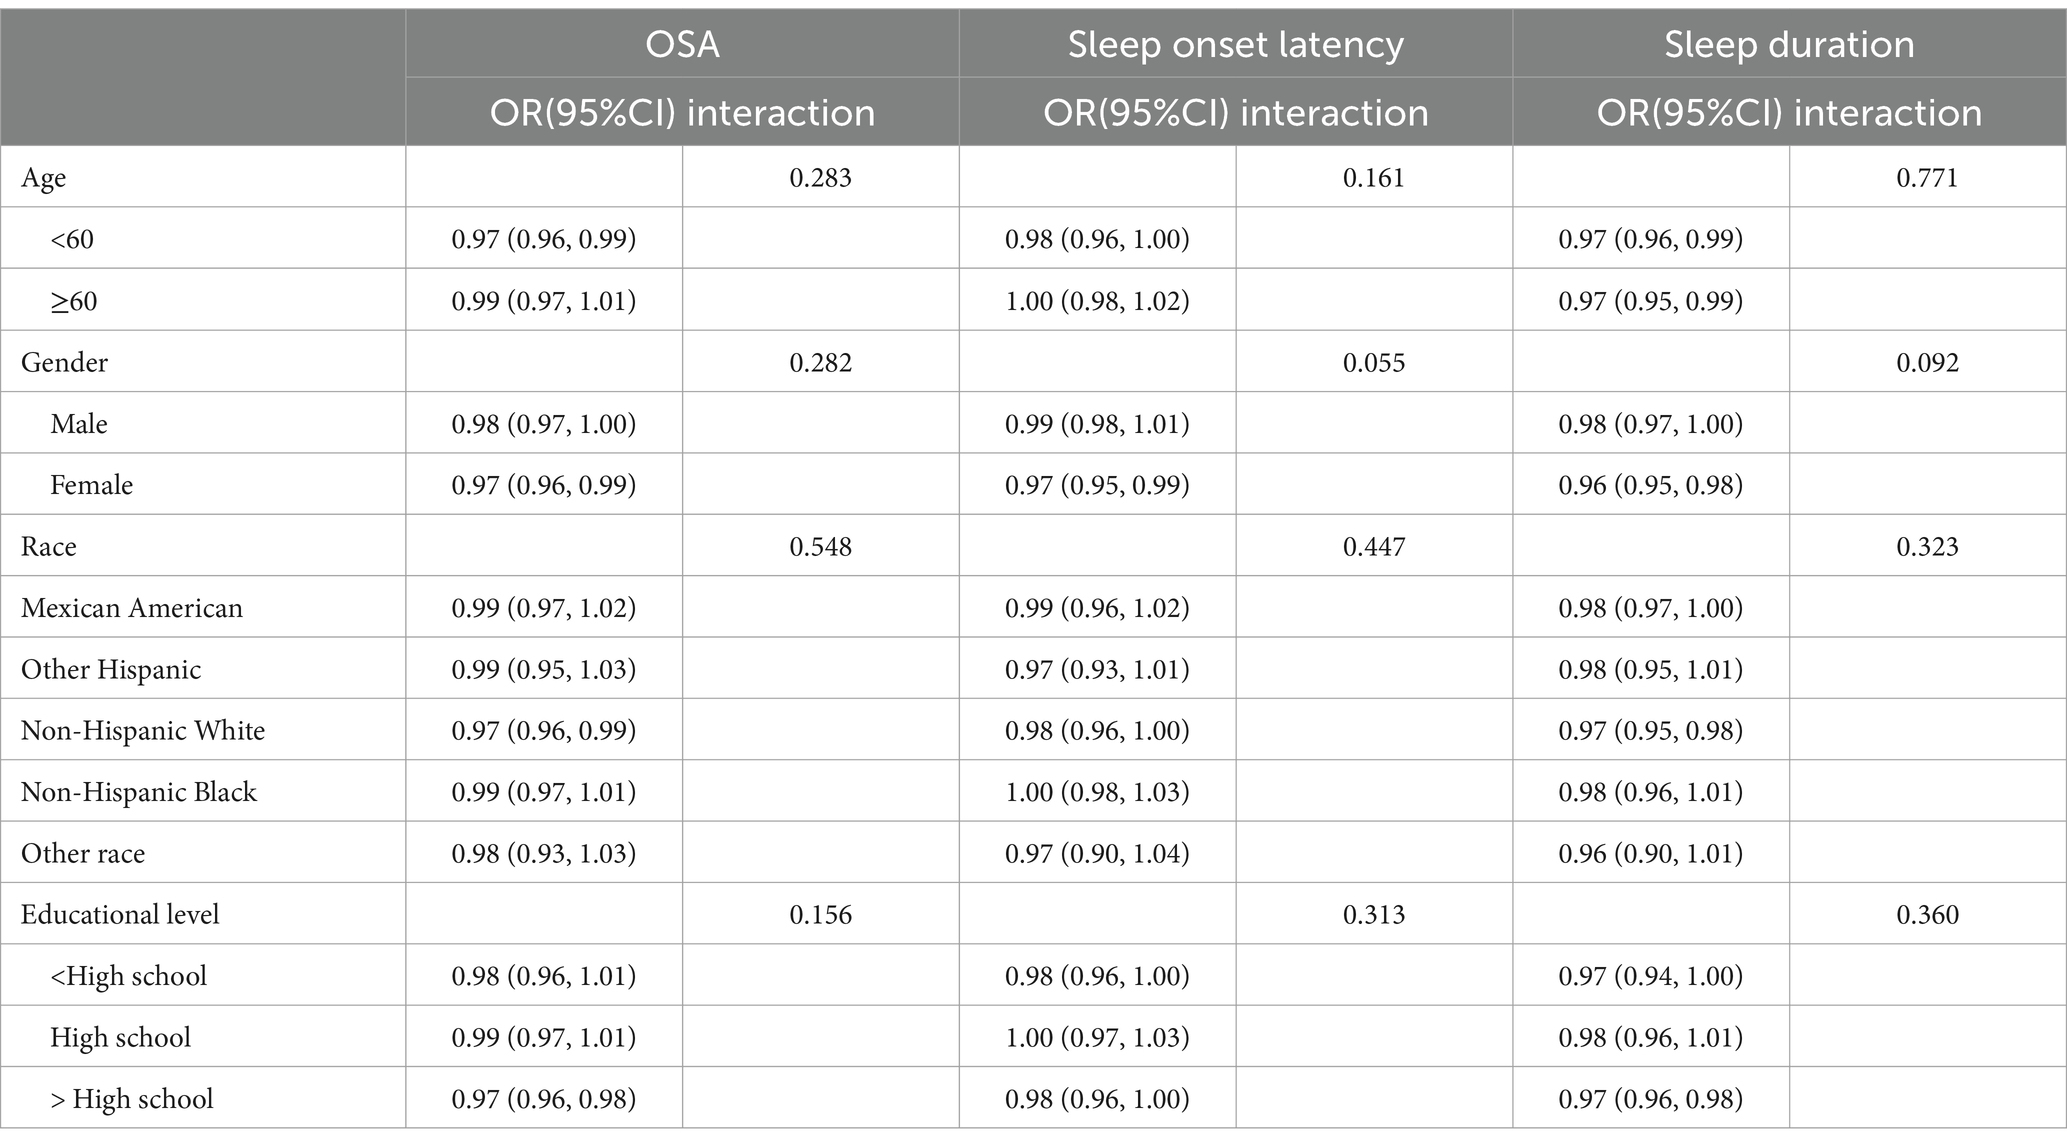
Table 4. Subgroup analysis.
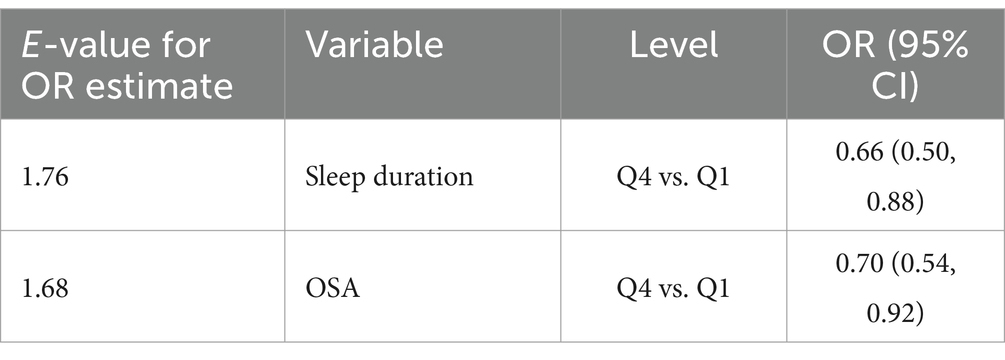
Table 5. E-values in the fully adjusted model.
4 Discussion
In this study, we identified a negative association between OBS and the risk of insufficient sleep hours, indicating that participants with lower OBS are at a higher risk of experiencing insufficient sleep hours. We observed a nonlinear relationship between OBS and both the risk of developing OSA and having excessive sleep onset latency, with differing characteristics on either side of the turning point. Specifically, the association between OBS and the risk of developing OSA was not significant on the left side of the turning point. However, it became significant on the right side, where higher OBS corresponded to a reduced risk of developing OSA. Conversely, the relationship between OBS and the risk of having excessive sleep onset latency was significant on the left side of the turning point (indicating that higher OBS is associated with a lower risk), but this relationship lost significance on the right side. Meanwhile, our subgroup analyses and interaction tests further confirmed that these relationships remained stable across various population settings. Our findings demonstrate the impact of oxidative homeostasis on sleep and provide evidence supporting increased intake of antioxidant-rich foods and an antioxidant lifestyle.
Notably, our study found that OBS was negatively correlated with the risk of insufficient sleep (OR = 0.98, p < 0.05). This aligns with findings from Lei X and colleagues (13), who identified a significant association between OBS and sleep duration (MD = 0.26, p < 0.05) using a different research design. Additionally, research by Zhang Q and colleagues (29) revealed a positive dose–response relationship between OBS and sleep duration, indicating that higher OBS is associated with longer sleep duration (β = 0.009, p < 0.05). Despite methodological differences among the three studies, they consistently confirm the robustness of the negative association between OBS and the risk of insufficient sleep duration. Moreover, our study reveals for the first time a nonlinear relationship between OBS and the risk of developing OSA and excessive sleep onset latency, our results are similar to the result of Xiong B and colleagues (30) who found a nonlinear relationship between the composite dietary antioxidant index (CDAI) and OSA. CDAI is a composite index like OBS, and there are many commonalities in the components contained. Our study explored the relationship between OBS and sleep-related problems and the results were generally reasonable. Although the underlying biological mechanisms linking OBS and sleep-related problems are currently unknown, we propose several explanations based on existing knowledge:
First, a good diet and lifestyle influence the oxidative stress of the organism. Among lifestyle factors, for example, smoking inhibits the body’s antioxidant defense mechanisms and promotes the production of endogenous free radicals (31). Studies have shown that smokers have significantly lower serum enzymes with antioxidant effects (superoxide dismutase (32)), plasma antioxidant molecules [melatonin and β-carotene (33, 34)], and significantly higher levels of oxidative stress markers [plasma malondialdehyde (32)]. Oxidative stress, in turn, impacts sleep quality through neurobiological mechanisms associated with oxidative processes. For example, brain tissue is particularly vulnerable to oxidative stress due to its high metabolic demand and low levels of endogenous antioxidants. The numerous reactive oxygen radicals produced during oxidative stress contributes to impaired sleep quality through a variety of mechanisms, including damage to endothelial cells and reduction of neurotransmitter concentrations (35). The OBS is calculated based on the level of oxidative exposure of an individual based on 16 dietary and 4 lifestyle factors that influence oxidative processes, with higher scores reflecting better antioxidant exposure. Therefore, it is reasonable to conclude that individuals with higher OBS are at lower risk of developing sleep-related problems.
Second, a balanced diet and healthy lifestyle are crucial in reducing systemic inflammation. Inflammatory factors involved in the immune response and inflammatory reaction, and it plays a significant role in the neuro-endocrine-immune network, participating in the regulation of sleep–wake rhythms. When inflammatory factors TNF-α, IL-1β, and IL-6 are moderately increased, the body can compensate for sleep by increasing slow-wave sleep (36). However, when the levels of these inflammatory markers are significantly elevated, excessive inflammatory factors not only do not promote sleep, but also induce the production of neurotoxic substances in the central nervous system to aggravate insomnia (37, 38). Therefore, managing the levels of inflammatory factors is essential for maintaining sleep quality. Research indicates that a nutritious diet and regular physical activity can reduce pro-inflammatory factors (39, 40), inversely smoking and alcohol consumption can increase their production (41, 42). Previous researches reported that dietary zinc and selenium had both properties of antioxidant and pro-oxidant, which could cause oxidative stress and lose antioxidant capacity when they were out of certain range (43, 44). These findings offer insight into the paradox between OBS and OSA and prolonged sleep onset from various perspectives. More investigations are needed in the future to understand the biological mechanisms between these relationships.
Our study has some strengths. Firstly, the research data were sourced from the NHANES database, which is known for its large scale and national representativeness. This ensuring the reliability of our findings. Secondly, we employed OBS, a comprehensive index that considers both dietary and lifestyle factors influencing oxidative stress. However, our study also has limitations. Primarily, the cross-sectional design meant that all measurements were taken only at baseline, without dynamic follow-up, necessitating further prospective studies to establish causality. Additionally, sleep-related problems were assessed based on self-reports of participants during interviews, lacking objective measures, which may introduce information bias. Lastly, although numerous covariates were adjusted, the influence of other confounding factors cannot be entirely excluded. We used the E-value sensitivity analysis to quantify the potential implications of unmeasured confounders and found that an unmeasured confounder was unlikely to explain the entirety of the related-sleep outcomes.
5 Conclusion
The findings of the present study reveal an inverse linear relationship between OBS and the risk of insufficient sleep hours, alongside a nonlinear relationship between OBS and the risks of developing OSA and excessive sleep onset latency. These results suggest that optimizing the body’s oxidative balance may enhance sleep quality in the population.
Data availability statement
Publicly available datasets were analyzed in this study. This data can be found here: https://www.cdc.gov/nchs/nhanes/.
Ethics statement
The studies involving humans were approved by the National Center for Health Statistics (NCHS) Ethics Review Board (ERB). The studies were conducted in accordance with the local legislation and institutional requirements. The participants provided their written informed consent to participate in this study.
Author contributions
PC: Writing – original draft, Writing – review & editing, Conceptualization, Data curation, Software. JW: Software, Supervision, Data curation, Writing – review & editing. LL: Formal Analysis, Methodology, Writing – review & editing. XL: Validation, Visualization, Project administration, Resources, Writing – review & editing.
Funding
The author(s) declare that no financial support was received for the research and/or publication of this article.
Acknowledgments
We thank the NHANES database for providing their platform and contributors for uploaders of their meaningful data sets. We thank all participants who participated in our study.
Conflict of interest
The authors declare that the research was conducted in the absence of any commercial or financial relationships that could be construed as a potential conflict of interest.
Generative AI statement
The authors declare that no Gen AI was used in the creation of this manuscript.
Publisher’s note
All claims expressed in this article are solely those of the authors and do not necessarily represent those of their affiliated organizations, or those of the publisher, the editors and the reviewers. Any product that may be evaluated in this article, or claim that may be made by its manufacturer, is not guaranteed or endorsed by the publisher.
Supplementary material
The Supplementary material for this article can befound online at: https://www.frontiersin.org/articles/10.3389/fnut.2025.1571971/full#supplementary-material
Footnotes
References
1. Facco, FL, Grobman, WA, Reid, KJ, Parker, CB, Hunter, SM, Silver, RM, et al. Objectively measured short sleep duration and later sleep midpoint in pregnancy are associated with a higher risk of gestational diabetes. Am J Obstet Gynecol. (2017) 217:447.e1-.e13. doi: 10.1016/j.ajog.2017.05.066
2. Lim, DC, Najafi, A, Afifi, L, Bassetti, C, Buysse, DJ, Han, F, et al. The need to promote sleep health in public health agendas across the globe. Lancet Public Health. (2023) 8:e820–6. doi: 10.1016/S2468-2667(23)00182-2
3. Hafner, M, Stepanek, M, Taylor, J, Troxel, WM, and van Stolk, C. Why sleep matters-the economic costs of insufficient sleep: a cross-country comparative analysis. Rand Health Q. (2017) 6:11.
4. Darroudi, S, Eslamiyeh, M, Jaber Al-Fayyadh, KK, Zamiri Bidary, M, Danesteh, S, Hassanzadeh Gouji, A, et al. Prognostic factors associated with sleep duration: serum pro-oxidant/antioxidant balance and superoxide dismutase 1 as oxidative stress markers and anxiety/depression. Int J Public Health. (2023) 68:1606014. doi: 10.3389/ijph.2023.1606014
5. Zheng, Y, Zhang, L, Bonfili, L, de Vivo, L, Eleuteri, AM, and Bellesi, M. Probiotics supplementation attenuates inflammation and oxidative stress induced by chronic sleep restriction. Nutrients. (2023) 15:10.3390/nu15061518. doi: 10.3390/nu15061518
6. Abboud, M, and Vitamin, D. Supplementation and sleep: a systematic review and meta-analysis of intervention studies. Nutrients. (2022) 14:1076. doi: 10.3390/nu14051076
7. Lavialle, M, Champeil-Potokar, G, Alessandri, JM, Balasse, L, Guesnet, P, Papillon, C, et al. An (n-3) polyunsaturated fatty acid-deficient diet disturbs daily locomotor activity, melatonin rhythm, and striatal dopamine in Syrian hamsters. J Nutr. (2008) 138:1719–24. doi: 10.1093/jn/138.9.1719
8. Goodman, M, Bostick, RM, Gross, M, Thyagarajan, B, Dash, C, and Flanders, WD. Combined measure of pro- and anti-oxidant exposures in relation to prostate cancer and colorectal adenoma risk: an update. Ann Epidemiol. (2010) 20:955–7. doi: 10.1016/j.annepidem.2010.08.011
9. Nanri, H, Hara, M, Nishida, Y, Shimanoe, C, Li, YS, Kasai, H, et al. The association between oxidative balance score and urinary levels of 8-Hydroxydeoxyguanosine among Japanese adults. Nutrients. (2023) 15:4533. doi: 10.3390/nu15214533
10. Cheng, X, Cheng, L, He, J, Wang, Y, Lin, X, and Xia, S. The mediating role of oxidative stress on the association between oxidative balance score and Cancer-related cognitive impairment in lung Cancer patients: a cross-sectional study. Nutrients. (2024) 16:4090. doi: 10.3390/nu16234090
11. Kong, SY, Bostick, RM, Flanders, WD, McClellan, WM, Thyagarajan, B, Gross, MD, et al. Oxidative balance score, colorectal adenoma, and markers of oxidative stress and inflammation. Cancer Epidemiol Biomarkers Prev. (2014) 23:545–54. doi: 10.1158/1055-9965.EPI-13-0619
12. Chen, X, Wang, C, Dong, Z, Luo, H, Ye, C, Li, L, et al. Interplay of sleep patterns and oxidative balance score on total cardiovascular disease risk: insights from the National Health and nutrition examination survey 2005-2018. J Glob Health. (2023) 13:04170. doi: 10.7189/jogh.13.04170
13. Lei, X, Xu, Z, and Chen, W. Association of oxidative balance score with sleep quality: NHANES 2007-2014. J Affect Disord. (2023) 339:435–42. doi: 10.1016/j.jad.2023.07.040
14. Liu, J, Wang, W, and Wen, Y. Association of dietary oxidative balance score and sleep duration with the risk of mortality: prospective study in a representative US population. Public Health Nutr. (2023) 26:2066–75. doi: 10.1017/S1368980023001155
15. Zipf, G, Chiappa, M, Porter, KS, Ostchega, Y, Lewis, BG, and Dostal, J. National health and nutrition examination survey: plan and operations, 1999-2010. Vital Health Stat. (2013):1–37.
16. Hirshkowitz, M, Whiton, K, Albert, SM, Alessi, C, Bruni, O, Don Carlos, L, et al. National Sleep Foundation's sleep time duration recommendations: methodology and results summary. Sleep Health. (2015) 1:40–3. doi: 10.1016/j.sleh.2014.12.010
17. Scinicariello, F, Buser, MC, Feroe, AG, and Attanasio, R. Antimony and sleep-related disorders: NHANES 2005-2008. Environ Res. (2017) 156:247–52. doi: 10.1016/j.envres.2017.03.036
18. Xi, Y, Deng, YQ, Chen, SM, Kong, YG, Xu, Y, Li, F, et al. Allergy-related outcomes and sleep-related disorders in adults: a cross-sectional study based on NHANES 2005-2006. Allergy Asthma Clin Immunol. (2022) 18:27. doi: 10.1186/s13223-022-00669-z
19. Xu, Z, Lei, X, Chu, W, Weng, L, Chen, C, and Ye, R. Oxidative balance score was negatively associated with the risk of metabolic syndrome, metabolic syndrome severity, and all-cause mortality of patients with metabolic syndrome. Front Endocrinol. (2023) 14:1233145. doi: 10.3389/fendo.2023.1233145
20. Zhang, W, Peng, SF, Chen, L, Chen, HM, Cheng, XE, and Tang, YH. Association between the oxidative balance score and telomere length from the National Health and nutrition examination survey 1999-2002. Oxidative Med Cell Longev. (2022) 2022:1345071–11. doi: 10.1155/2022/1345071
21. Tian, X, Xue, B, Wang, B, Lei, R, Shan, X, Niu, J, et al. Physical activity reduces the role of blood cadmium on depression: a cross-sectional analysis with NHANES data. Environ Pollut. (2022) 304:119211. doi: 10.1016/j.envpol.2022.119211. Epub 2022 Mar 24
22. Mahemuti, N, Jing, X, Zhang, N, Liu, C, Li, C, Cui, Z, et al. Association between systemic immunity-inflammation index and hyperlipidemia: a population-based study from the NHANES (2015-2020). Nutrients. (2023) 15:1177. doi: 10.3390/nu15051177
23. Xu, F, Earp, JE, Adami, A, Weidauer, L, and Greene, GW. The relationship of physical activity and dietary quality and diabetes prevalence in US adults: findings from NHANES 2011-2018. Nutrients. (2022) 14:3324. doi: 10.3390/nu14163324
24. Wu, M, Si, J, Liu, Y, Kang, L, and Xu, B. Association between composite dietary antioxidant index and hypertension: insights from NHANES. Clin Exp Hypertens. (2023) 45:2233712. doi: 10.1080/10641963.2023.2233712
25. Chen, S, Cui, K, Luo, J, and Zhang, D. Association of Urinary Iodine Concentration with depressive symptoms among adults: NHANES 2007-2018. Nutrients. (2022) 14:4165. doi: 10.3390/nu14194165
26. Jaddoe, VW, de Jonge, LL, Hofman, A, Franco, OH, Steegers, EA, and Gaillard, R. First trimester fetal growth restriction and cardiovascular risk factors in school age children: population based cohort study. BMJ. (2014) 348:g14. doi: 10.1136/bmj.g14
27. Liu, Y, Zhao, P, Cheng, M, Yu, L, Cheng, Z, Fan, L, et al. AST to ALT ratio and arterial stiffness in non-fatty liver Japanese population: a secondary analysis based on a cross-sectional study. Lipids Health Dis. (2018) 17:275. doi: 10.1186/s12944-018-0920-4
28. Haneuse, S, Vander Weele, TJ, and Arterburn, D. Using the E-value to assess the potential effect of unmeasured confounding in observational studies. JAMA. (2019) 321:602–3. doi: 10.1001/jama.2018.21554
29. Zhang, Q, Yi, J, and Wu, Y. Oxidative stress and inflammation mediate the association between elevated oxidative balance scores and improved sleep quality: evidence from NHANES. Front Nutr. (2024) 11:1469779. doi: 10.3389/fnut.2024.1469779
30. Xiong, B, Wang, J, He, R, and Qu, G. Composite dietary antioxidant index and sleep health: a new insight from cross-sectional study. BMC Public Health. (2024) 24:609. doi: 10.1186/s12889-024-18047-2
31. Isik, B, Ceylan, A, and Isik, R. Oxidative stress in smokers and non-smokers. Inhal Toxicol. (2007) 19:767–9. doi: 10.1080/08958370701401418
32. Liu, YX, Zhao, JR, Sun, Y, and Peng, YX. Effects of acute smoking on high-sensitivity C-reactive protein and oxidative stress in healthy men. Chin J Gerontol. (2011) 31:3700–1. doi: 10.3969/j.issn.1005-9202.2011.19.019
33. Kim, SH, Kim, JS, Shin, HS, and Keen, CL. Influence of smoking on markers of oxidative stress and serum mineral concentrations in teenage girls in Korea. Nutrition. (2003) 19:240–3. doi: 10.1016/s0899-9007(02)01002-x
34. Ozguner, F, Koyu, A, and Cesur, G. Active smoking causes oxidative stress and decreases blood melatonin levels. Toxicol Ind Health. (2005) 21:21–6. doi: 10.1191/0748233705th211oa
35. Bai, T, Yu, S, and Feng, J. Advances in the role of endothelial cells in cerebral small vessel disease. Front Neurol. (2022) 13:861714. doi: 10.3389/fneur.2022.861714
36. Zhao, FY, Zhao, YX, Lou, SJ, Bao, YM, Yan, HX, Hu, Y, et al. Neurobiological mechanisms of anti-insomnia and regulation of sleep-wake cycle by exercise training. J Wuhan Instit Phys Educ. (2016) 50:75–82. doi: 10.3969/j.issn.1000-520X.2016.02.013
37. Pepin, JL, Borel, AL, Tamisier, R, Baguet, JP, Levy, P, and Dauvilliers, Y. Hypertension and sleep: overview of a tight relationship. Sleep Med Rev. (2014) 18:509–19. doi: 10.1016/j.smrv.2014.03.003
38. Wright, KP Jr, Drake, AL, Frey, DJ, Fleshner, M, Desouza, CA, Gronfier, C, et al. Influence of sleep deprivation and circadian misalignment on cortisol, inflammatory markers, and cytokine balance. Brain Behav Immun. (2015) 47:24–34. doi: 10.1016/j.bbi.2015.01.004
39. Qu, J, Lin, XJ, Wang, YL, and Wang, XH. 4-week aerobic exercise combined with dietary control reduces serum inflammatory factor chemerin levels in obese youth and its application value. China Sports Sci Technol. (2022) 58:76–82. doi: 10.16470/j.csst.2020139
40. Zhao, CL, Ouyang, SY, Chen, LL, Su, J, and Li, AL. Effects of aerobic exercise on sleep quality, sleep structure and inflammatory factors in patients with primary insomnia. Nurs Res. (2022) 36:154–7. doi: 10.12102/j.issn.1009-6493.2022.01.030
41. Chen, T, Ma, Z, Lee, SR, Chen, B, Tao, T, Chu, Y, et al. Serum inflammatory chemokines in patients with atrial fibrillation with blood stasis in coronary heart disease. Chin J Evid Based Cardiovasc Med. (2024) 16:822–5. doi: 10.3969/j.issn.1674-4055.2024.07.14
42. Lv, HL, Li, HT, Zhang, TT, Chen, KR, Tan, SF, and Song, YB. Effects of cigarette smoking on oxidative stress and inflammatory factors in serum of patients with mild COPD. Chin J Pulm Dis. (2017) 10:681–5. doi: 10.3877/cma.j.issn.1674-6902.2017.06.010
43. Lee, KH, and Jeong, D. Bimodal actions of selenium essential for antioxidant and toxic pro-oxidant activities: the selenium paradox (review). Mol Med Rep. (2012) 5:299–304. doi: 10.3892/mmr.2011.651
Keywords: oxidative stress, sleep duration, obstructive sleep apnea, diet, NHANES
Citation: Chen P, Wang J, Liu L and Liu X (2025) Relationship between oxidative balance score and risk of sleep-related problems. Front. Nutr. 12:1571971. doi: 10.3389/fnut.2025.1571971
Edited by:
Bahareh Sarmadi, Putra Malaysia University, MalaysiaReviewed by:
Nicolas Padilla-Raygoza, Institute of Public Health of the State of Guanajuato (ISAPEG), MexicoChen Zhang, Duke University, United States
Dajun Yang, Sichuan Provincial Primary Health Service Development Research Center, China
Copyright © 2025 Chen, Wang, Liu and Liu. This is an open-access article distributed under the terms of the Creative Commons Attribution License (CC BY). The use, distribution or reproduction in other forums is permitted, provided the original author(s) and the copyright owner(s) are credited and that the original publication in this journal is cited, in accordance with accepted academic practice. No use, distribution or reproduction is permitted which does not comply with these terms.
*Correspondence: Xiaoling Liu, MTM5NDA1MjQyNzFAMTYzLmNvbQ==