 Xuehe Zhang1†
 Long Yang2†
 Zhong Wang1Hanxiao Wang1Shiyu Nie1
 Chunxiu Zhao1Shengnan Kang1Chuan Zhang1*
 Chuanliang Pan1*
- 1Department of Intensive Care Unit, The Third People’s Hospital of Chengdu, Chengdu, China
- 2Pediatric Cardiothoracic Surgery, First Affiliated Hospital of Xinjiang Medical University, Urumqi, China
Background: The Controlling Nutritional Status (CONUT) score is used to assess nutritional status. Given that malnutrition increases the risk of cognitive impairment, this study aimed to clarify the relationship between the CONUT score and cognitive impairment in older adults.
Methods: Older adults aged 60–80 years in the National Health and Nutrition Examination Survey (NHANES) cycles were included in this study. Cognitive impairment was identified according to three different cognitive assessment methods. The degree of malnutrition was assessed by calculating the CONUT score and categorized into normal nutrition (CONUT 0–1) and malnutrition (CONUT 2–12) groups based on the score. Independent associations between the CONUT score and cognitive impairment were examined using logistic regression, while non-linear associations between the CONUT score and cognitive impairment were investigated using restricted cubic splines (RCS).
Results: The mean participant age was 69.19 years, and approximately 1478 participants (53.6%) had cognitive impairment. According to the CONUT score, the incidence of cognitive impairment was significantly greater in the malnutrition group. According to the adjusted logistic regression analysis, the CONUT score was associated with cognitive impairment (OR: 1.133, 95% CI: 1.052, 1.221; P = 0.002). Cognitive impairment was also associated with the malnutrition group (OR: 1.259, 95% CI: 1.039, 1.524; P = 0.021). RCS analysis revealed L-shaped associations between the CONUT score and cognitive impairment (non-linear p < 0.001).
Conclusion: Elevated CONUT scores are associated with an increased prevalence of cognitive impairment in older adults, potentially aiding in identifying individuals at risk of cognitive decline.
1 Introduction
As the world’s population ages, cognitive impairment has become more prevalent (1). As a growing public health problem, cognitive impairment now poses a significant challenge to health care systems. Studies have shown that even mild cognitive impairment results in dementia in 18.4%–32.3% of those individuals (2, 3). Research suggests that cognitive decline is associated with functional decline among older adults (4) and that cognitive impairment may increase the risk of disability (5). While acetylcholinesterase inhibitors and NMDA receptor antagonists have been approved for the treatment of Alzheimer’s disease dementia, their effects on age-related cognitive decline remain limited and primarily focus on symptomatic relief. Current disease research highlights the urgent need to shift focus toward preventive strategies targeting modifiable risk factors through non-pharmacological interventions (6). It has been shown that a healthy lifestyle can slow cognitive decline (7). Cognitive decline is the result of multiple factors, and the combination of advanced age and other risk factors is associated with multifaceted interactions that occur during the process of cognitive decline (8). Older adults face a variety of health problems, among which malnutrition is very common (9). Nutrition is a relevant healthy lifestyle factor that slows cognitive decline. Studies show that a progressive increase is observed in nutritional risk among older adults as opposed to younger adults (10). Aging-related changes in metabolism and body composition can lead to decreased appetite and food intake, which further increases fat and muscle tissue loss and causes malnutrition (11, 12). Studies have shown that cognitive decline and worsening nutritional status are closely related and that the majority of patients with cognitive impairment are at risk for malnutrition (13, 14). Multiple screening tools have been developed to identify nutritional risks, but no gold standard is available for the assessment of malnutrition. Nutritional Risk Screening 2002 (NRS 2002) considers nutritional assessment, disease severity, and the patient’s age and is recommended for the evaluation of hospitalized patients (15). Some older adults have difficulty completing structured questionnaires or accurately describing weight loss in the absence of caregivers. The Mini Nutritional Assessment Short Form (MNA-SF) has been more widely used in older adults, and in addition to nutritional risk, the MNA score has been associated with functional decline (16). However, this scale may not be sufficiently accurate for patients with unrecognized dementia or depression. Despite the multitude of tools available for nutritional assessment, these tools still have some limitations, and subjective assessments are inevitable. Both subjective and objective data should be collected for a comprehensive nutritional assessment.
Objective nutritional assessment tools quantify malnutrition risk by integrating biochemical markers (e.g., serum albumin, lymphocyte count) and anthropometric parameters (e.g., BMI, weight loss). Commonly used tools include the Controlling Nutritional Status (CONUT), Geriatric Nutritional Risk Index (GNRI), Prognostic Nutritional Index (PNI), and Nutritional Risk Index (NRI). Studies by Wang et al. (17) utilizing NHANES data demonstrated a significant correlation between GNRI levels and cognitive function in older adults. Similarly, Lee et al. (18) reported that GNRI independently predicts post-stroke cognitive impairment (PSCI) risk. Wang et al. (19) found that reduced PNI levels were associated with PSCI incidence, though no intergroup differences in GNRI were observed among stroke survivors. The utility of the CONUT score in cognitive-impaired populations remains underexplored. Previous studies linked CONUT to prognoses in colorectal cancer, heart failure, and hypertension patients (20–22). Liu et al. (23) identified high CONUT scores as the strongest predictors of in-hospital mortality among hospitalized older adults compared to four other nutritional assessment tools. The CONUT score is assessed via objective laboratory indices, which reduces inaccuracies in nutritional assessment due to patient recall bias. Therefore, the purpose of this study was to clarify the relationship between the CONUT score and cognitive function in an older population.
2 Materials and methods
2.1 Study subjects and sample sources
This cross-sectional study utilized data from the National Health and Nutrition Examination Survey (NHANES) 2011–2014 cycles. NHANES, designed by the National Center for Health Statistics (NCHS) under the Centers for Disease Control and Prevention (CDC), employs a stratified, multistage probability sampling design to assess the health status of non-institutionalized United States civilians. Since 1999, the survey has been conducted biennially with comprehensive physical examinations. During the 2011–2014 cycles, NHANES implemented cognitive function assessments specifically targeting older adults aged 60–80 years. From 3472 participants who completed cognitive questionnaires across both cycles, we excluded those with missing CONUT scores. The original NHANES protocol received ethical approval from the NCHS Research Ethics Review Board (Protocol #2011–17 and Continuation of Protocol #2011–17), with all participants providing written informed consent. As this investigation constitutes a secondary analysis of publicly available de-identified data, no additional institutional review board approval was required.
2.2 Data collection
This study utilized data from the NHANES database, where trained professionals collected demographic characteristics, laboratory measurements, and questionnaire responses through standardized protocols. All data are publicly accessible via the NHANES website1. Demographic variables included age, gender, race, marital status, annual household income, and educational attainment. Laboratory analyses encompassed lymphocyte/neutrophil counts, total cholesterol (TC), and other biochemical parameters. Dietary nutrient intake – including energy, protein, total saturated fatty acid, carbohydrate, and fiber – was assessed through 24-h dietary recall interviews. Cardiovascular disease (CVD) status was determined by self-reported physician diagnosis. Hypertension was defined as either (1) self-reported antihypertensive medication use, (2) systolic/diastolic blood pressure ≥ 140/90 mmHg (≥ 130/80 mmHg for diabetic patients), or (3) physician-diagnosed hypertension. Diabetes mellitus diagnosis required meeting at least one criterion: hemoglobin A1c (HbA1c) ≥ 6.5%, fasting glucose ≥ 126 mg/dL, random glucose ≥ 200 mg/dL, 2-h oral glucose tolerance test (OGTT) ≥ 200 mg/dL, or current use of glucose-lowering agents. NHANES classified medications by analyzing brand names or active ingredients and reclassified them into therapeutic categories. We specifically extracted medications potentially influencing CONUT scores, including lipid-lowering agents, corticosteroids, and immunosuppressants.
2.3 Diagnostic assessment of cognitive impairment
Three distinct methodologies were employed for the cognitive assessment of older adults aged 60 years or older within the NHANES. These methodologies included the Consortium to Establish a Registry for Alzheimer’s disease (CERAD) Word Learning (WL) subtest (24), the Animal Fluency Test (AFT) (25), and the Digit Symbol Substitution Test (DSST) (26). These tests comprehensively evaluate various cognitive functions, including working memory, language skills, processing speed, and executive function.
The CERAD test comprises three successive learning trials (CERAD-WL) and a delayed recall phase (CERAD-DR), which collectively measure the immediate and delayed acquisition of novel linguistic information. In the CERAD-WL task, participants vocalized 10 unrelated words individually, with the order shuffled across the three learning trials. Approximately 10 min after the initiation of the CERAD-WL task, the CERAD-DR task commenced, during which participants were asked to recall as many words as possible.
The AFT, a widely employed tool for evaluating language fluency in clinical contexts, taps into memory and language capabilities (including facets such as naming, comprehension, and semantic knowledge). Within a 1-min timeframe, participants were asked to name as many different types of animals as they could, earning one point for each animal that was correctly named.
Serving as a component of the Wechsler Adult Intelligence Scale (WAIS-III), the DSST focuses on processing speed, sustained attention, and working memory. The participants received a test sheet containing 9 numbers alongside corresponding symbols and a subsequent set of 133 numbers beneath the key. Their challenge was to quickly pair the accurate symbol with each number within a 2-min window.
The cutoff point for identifying cognitive impairment was determined by selecting the CERAD-WL, CERAD-DR, AFT, and DSST scores in the lowest quartile. This approach aligns with established methods in the literature for diagnosing cognitive impairment (26). Individuals with scores equal to or below this cutoff point were classified as having cognitive impairment. In this particular study, the cutoff values were as follows: 17 points for the CERAD-WL subtest, 5 points for the CERAD-DR subtest, 14 points for the AFT, and 33 points for the DSST.
2.4 Nutritional assessment
This study employed the CONUT score to evaluate participants’ nutritional status. The CONUT score was calculated based on serum TC levels, lymphocyte counts, and serum albumin concentrations (Supplementary Table 1). Scores range from 0 to 12 according to the predefined algorithm, with higher values indicating poorer nutritional status. Given the limited number of participants classified as moderate or severe malnutrition (CONUT ≥ 5), we dichotomized participants into two groups for analytical purposes: normal nutrition (CONUT 0–1) and malnutrition (CONUT 2–12).
2.5 Statistical analysis
All statistical analyses were conducted using R software (version 4.3.1) with appropriate weighting procedures through the “survey” package, in accordance with NHANES analytical guidelines. Participants were stratified into normal nutrition (CONUT 0–1) and malnutrition (CONUT 2–12) groups for baseline characteristic comparisons. Categorical variables were compared using Rao-Scott’s χ2 tests and reported as frequencies with weighted percentages, while continuous variables were analyzed via weighted t-tests and presented as weighted means ± standard deviations. The associations between nutritional status (both categorical groups and continuous CONUT scores) and cognitive function were evaluated using univariable and multivariable logistic regression models. Dose-response relationships between CONUT scores and cognitive impairment were visualized through restricted cubic spline (RCS) analysis with three knots. Missing covariates with < 20% missingness were retained in analyses, and missing values were imputed using multiple imputation by chained equations (MICE package in R). A two-sided P-value < 0.05 defined statistical significance for all analyses.
3 Results
3.1 Baseline characteristics of the participants
The initial study cohort comprised 3,472 older adults who completed cognitive questionnaires. After excluding 538 participants with incomplete cognitive assessments, 107 lacking lymphocyte count data, and 72 with missing albumin or TC measurements, the final analytical sample included 2,755 participants aged 60–80 years (Figure 1). Applying sample weights, this cohort represents approximately 50,801,593 older United States adults. The CONUT score distribution histogram (Figure 2) revealed that 74.3% of participants maintained good nutritional control (scores 0–1), while 24.9% exhibited moderate malnutrition (scores 2–4), and 0.8% demonstrated severe malnutrition (scores ≥ 5). Table 1 presents baseline characteristics stratified by nutritional status. The weighted mean age was 69.19 ± 0.19 years, with 1,352 participants (49.1%) being male. Cognitive impairment was identified in 1,478 participants (53.6%), showing a higher prevalence in the malnutrition group (P < 0.05). The malnutrition group also demonstrated significantly greater proportions of older individuals, males, CVD patients, and diabetics (all P < 0.05). No significant between-group differences (P > 0.05) were observed for body mass index (BMI), race, marital status, annual household income, educational attainment, hypertension status, dietary nutrient intake, or neutrophil counts. Medication analysis revealed higher usage rates of immunosuppressants and lipid-lowering agents in the malnutrition group (P < 0.05).
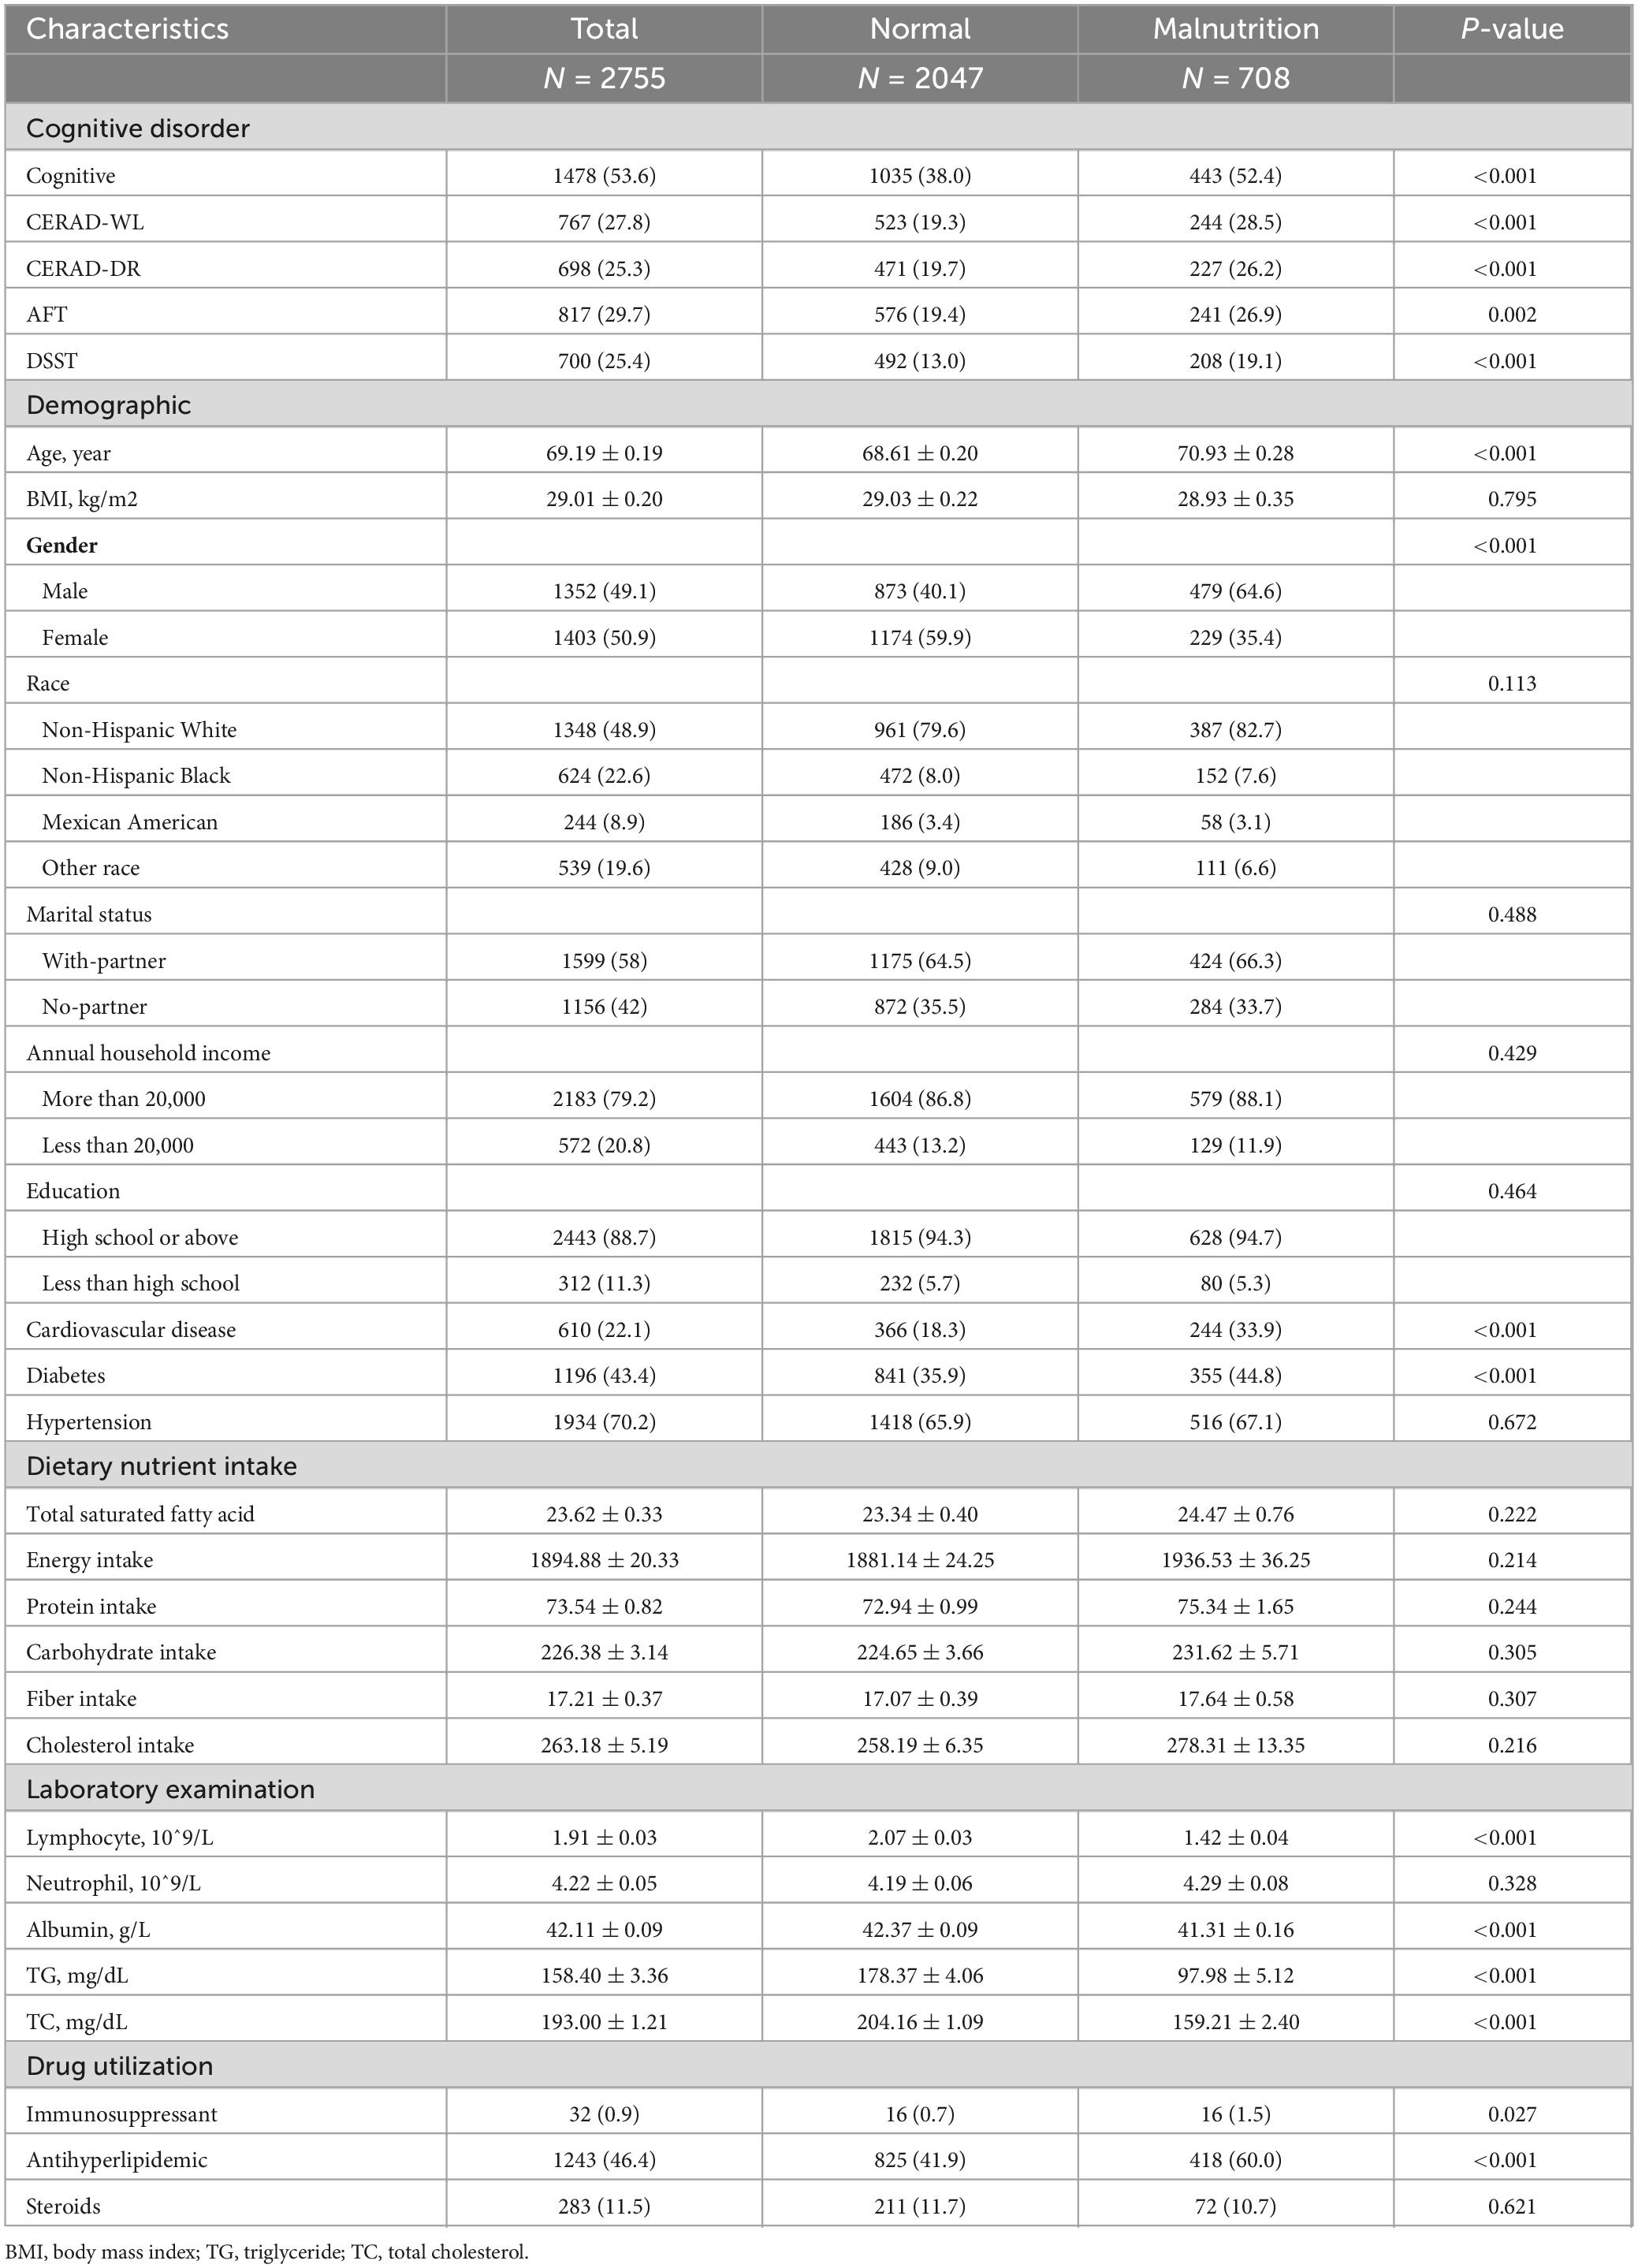
Table 1. Baseline characteristics of the study population by CONUT grouping.
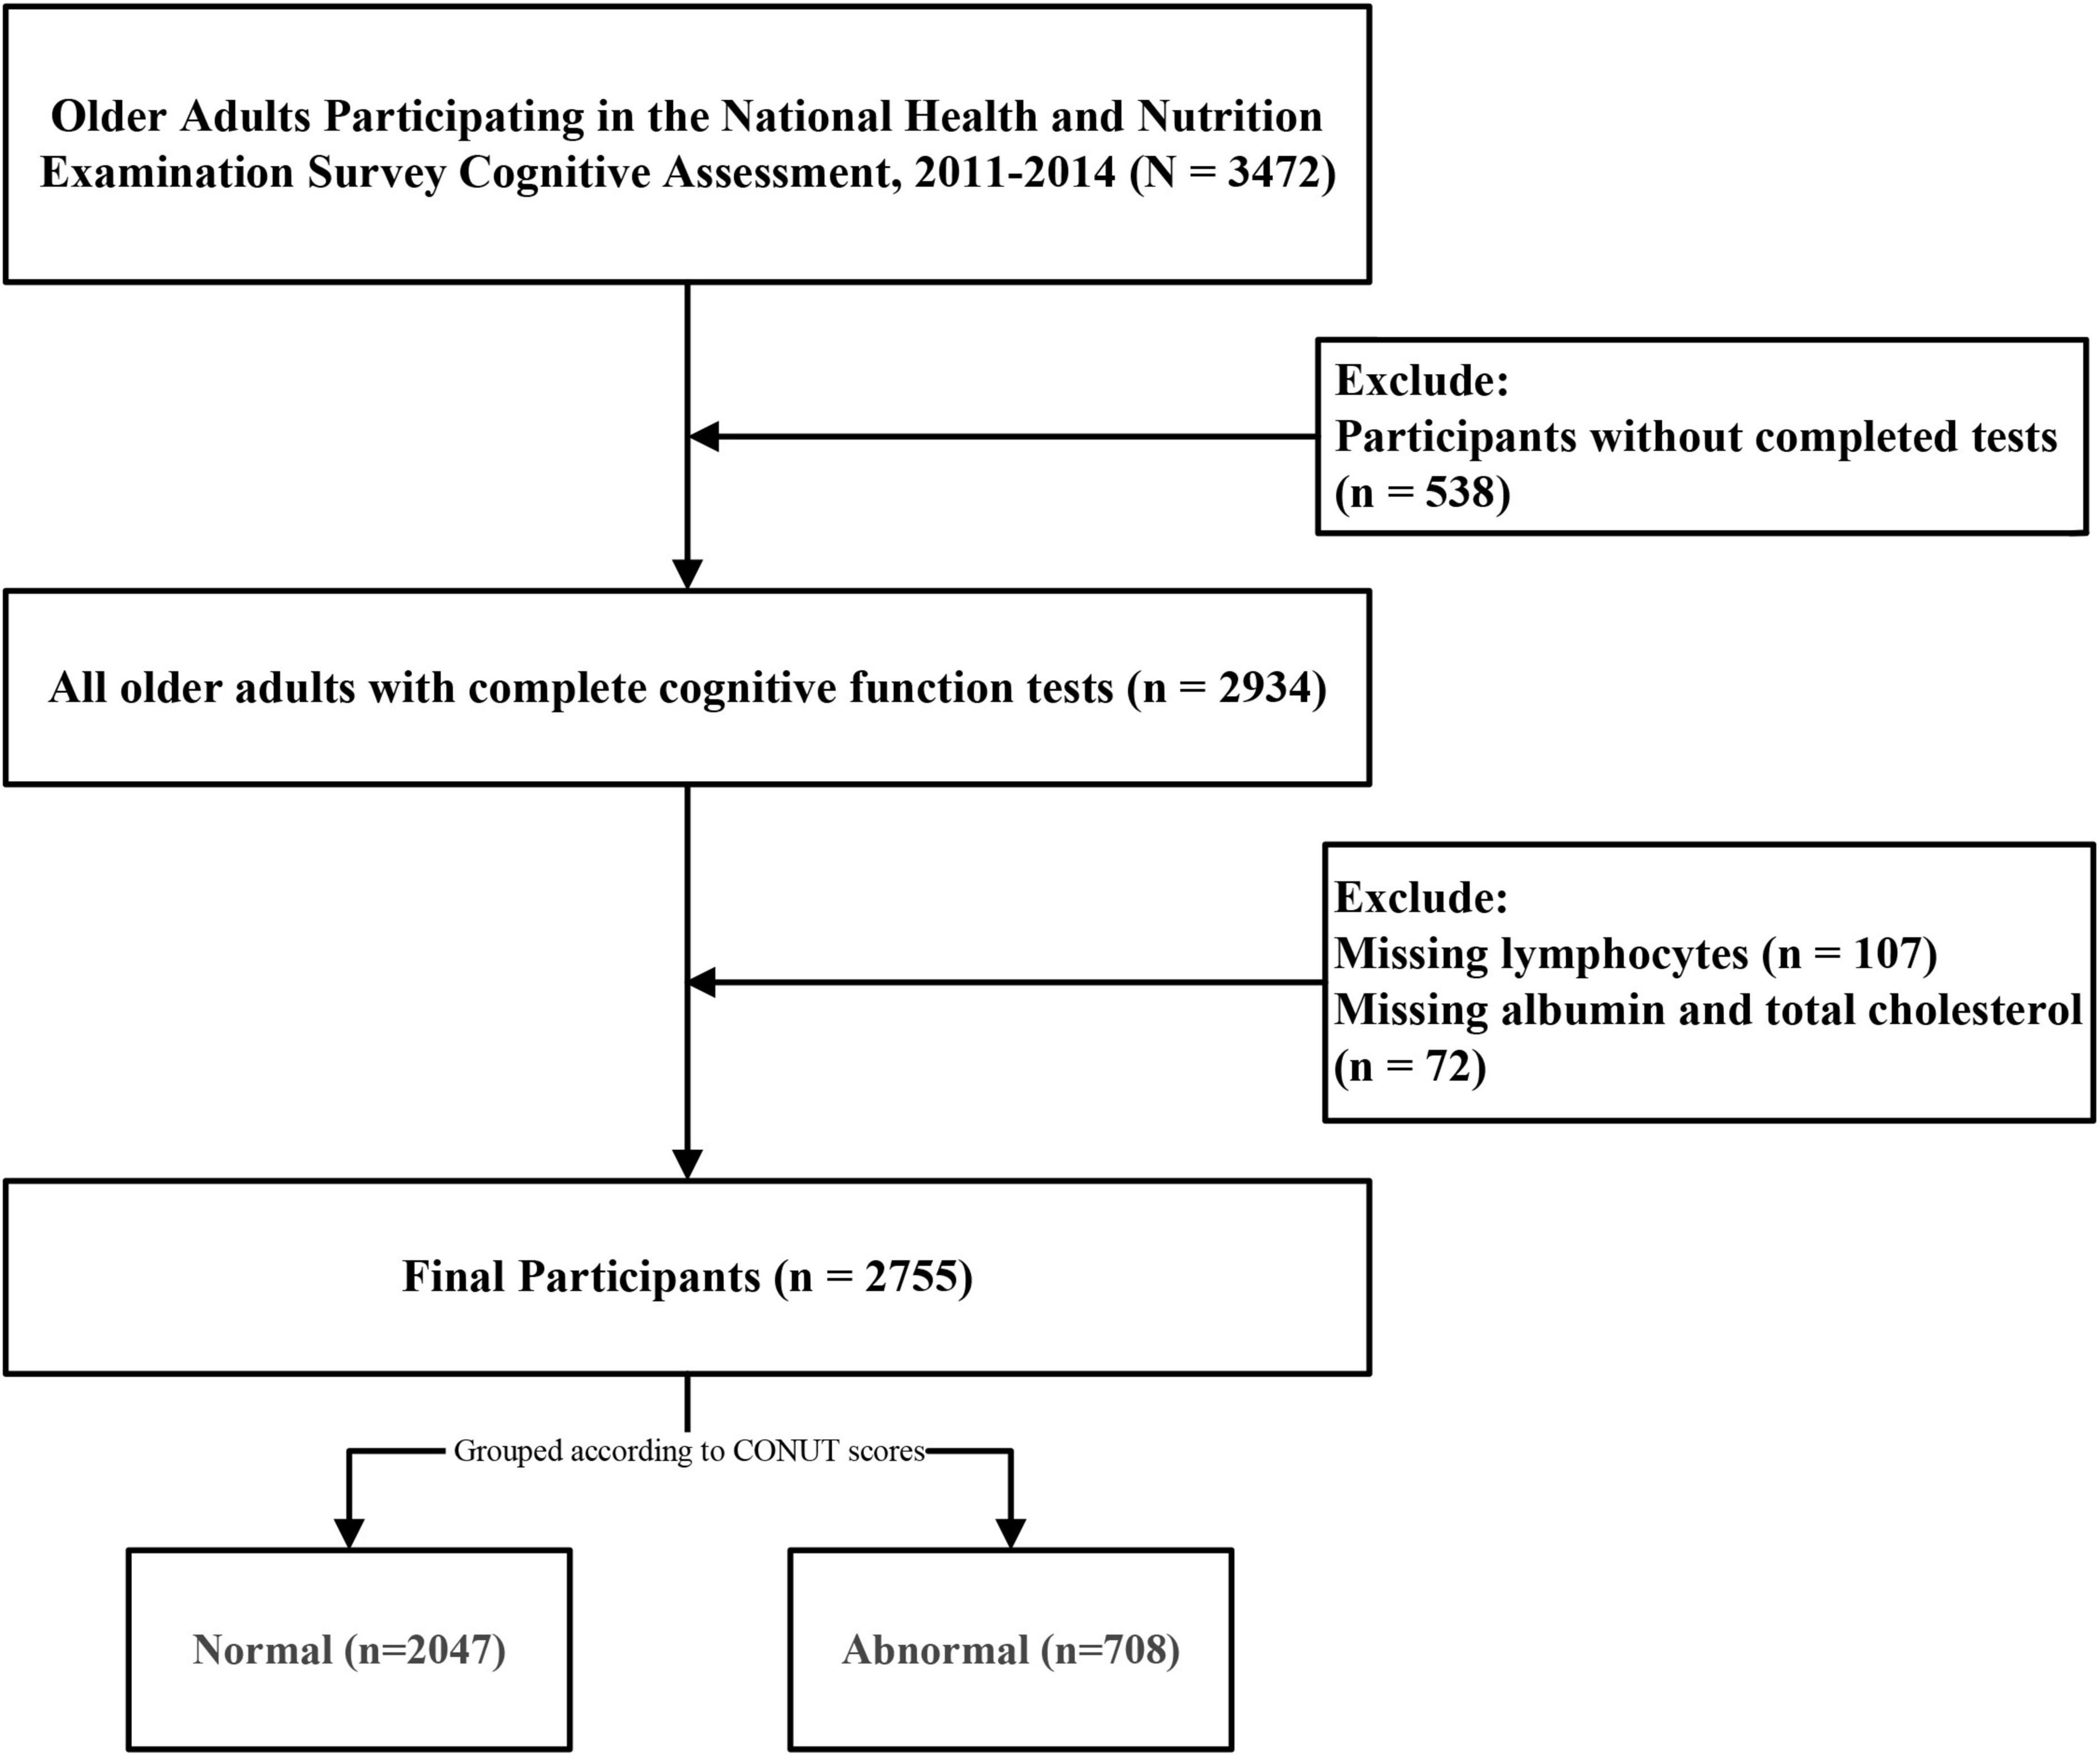
Figure 1. Flowchart of the study design.
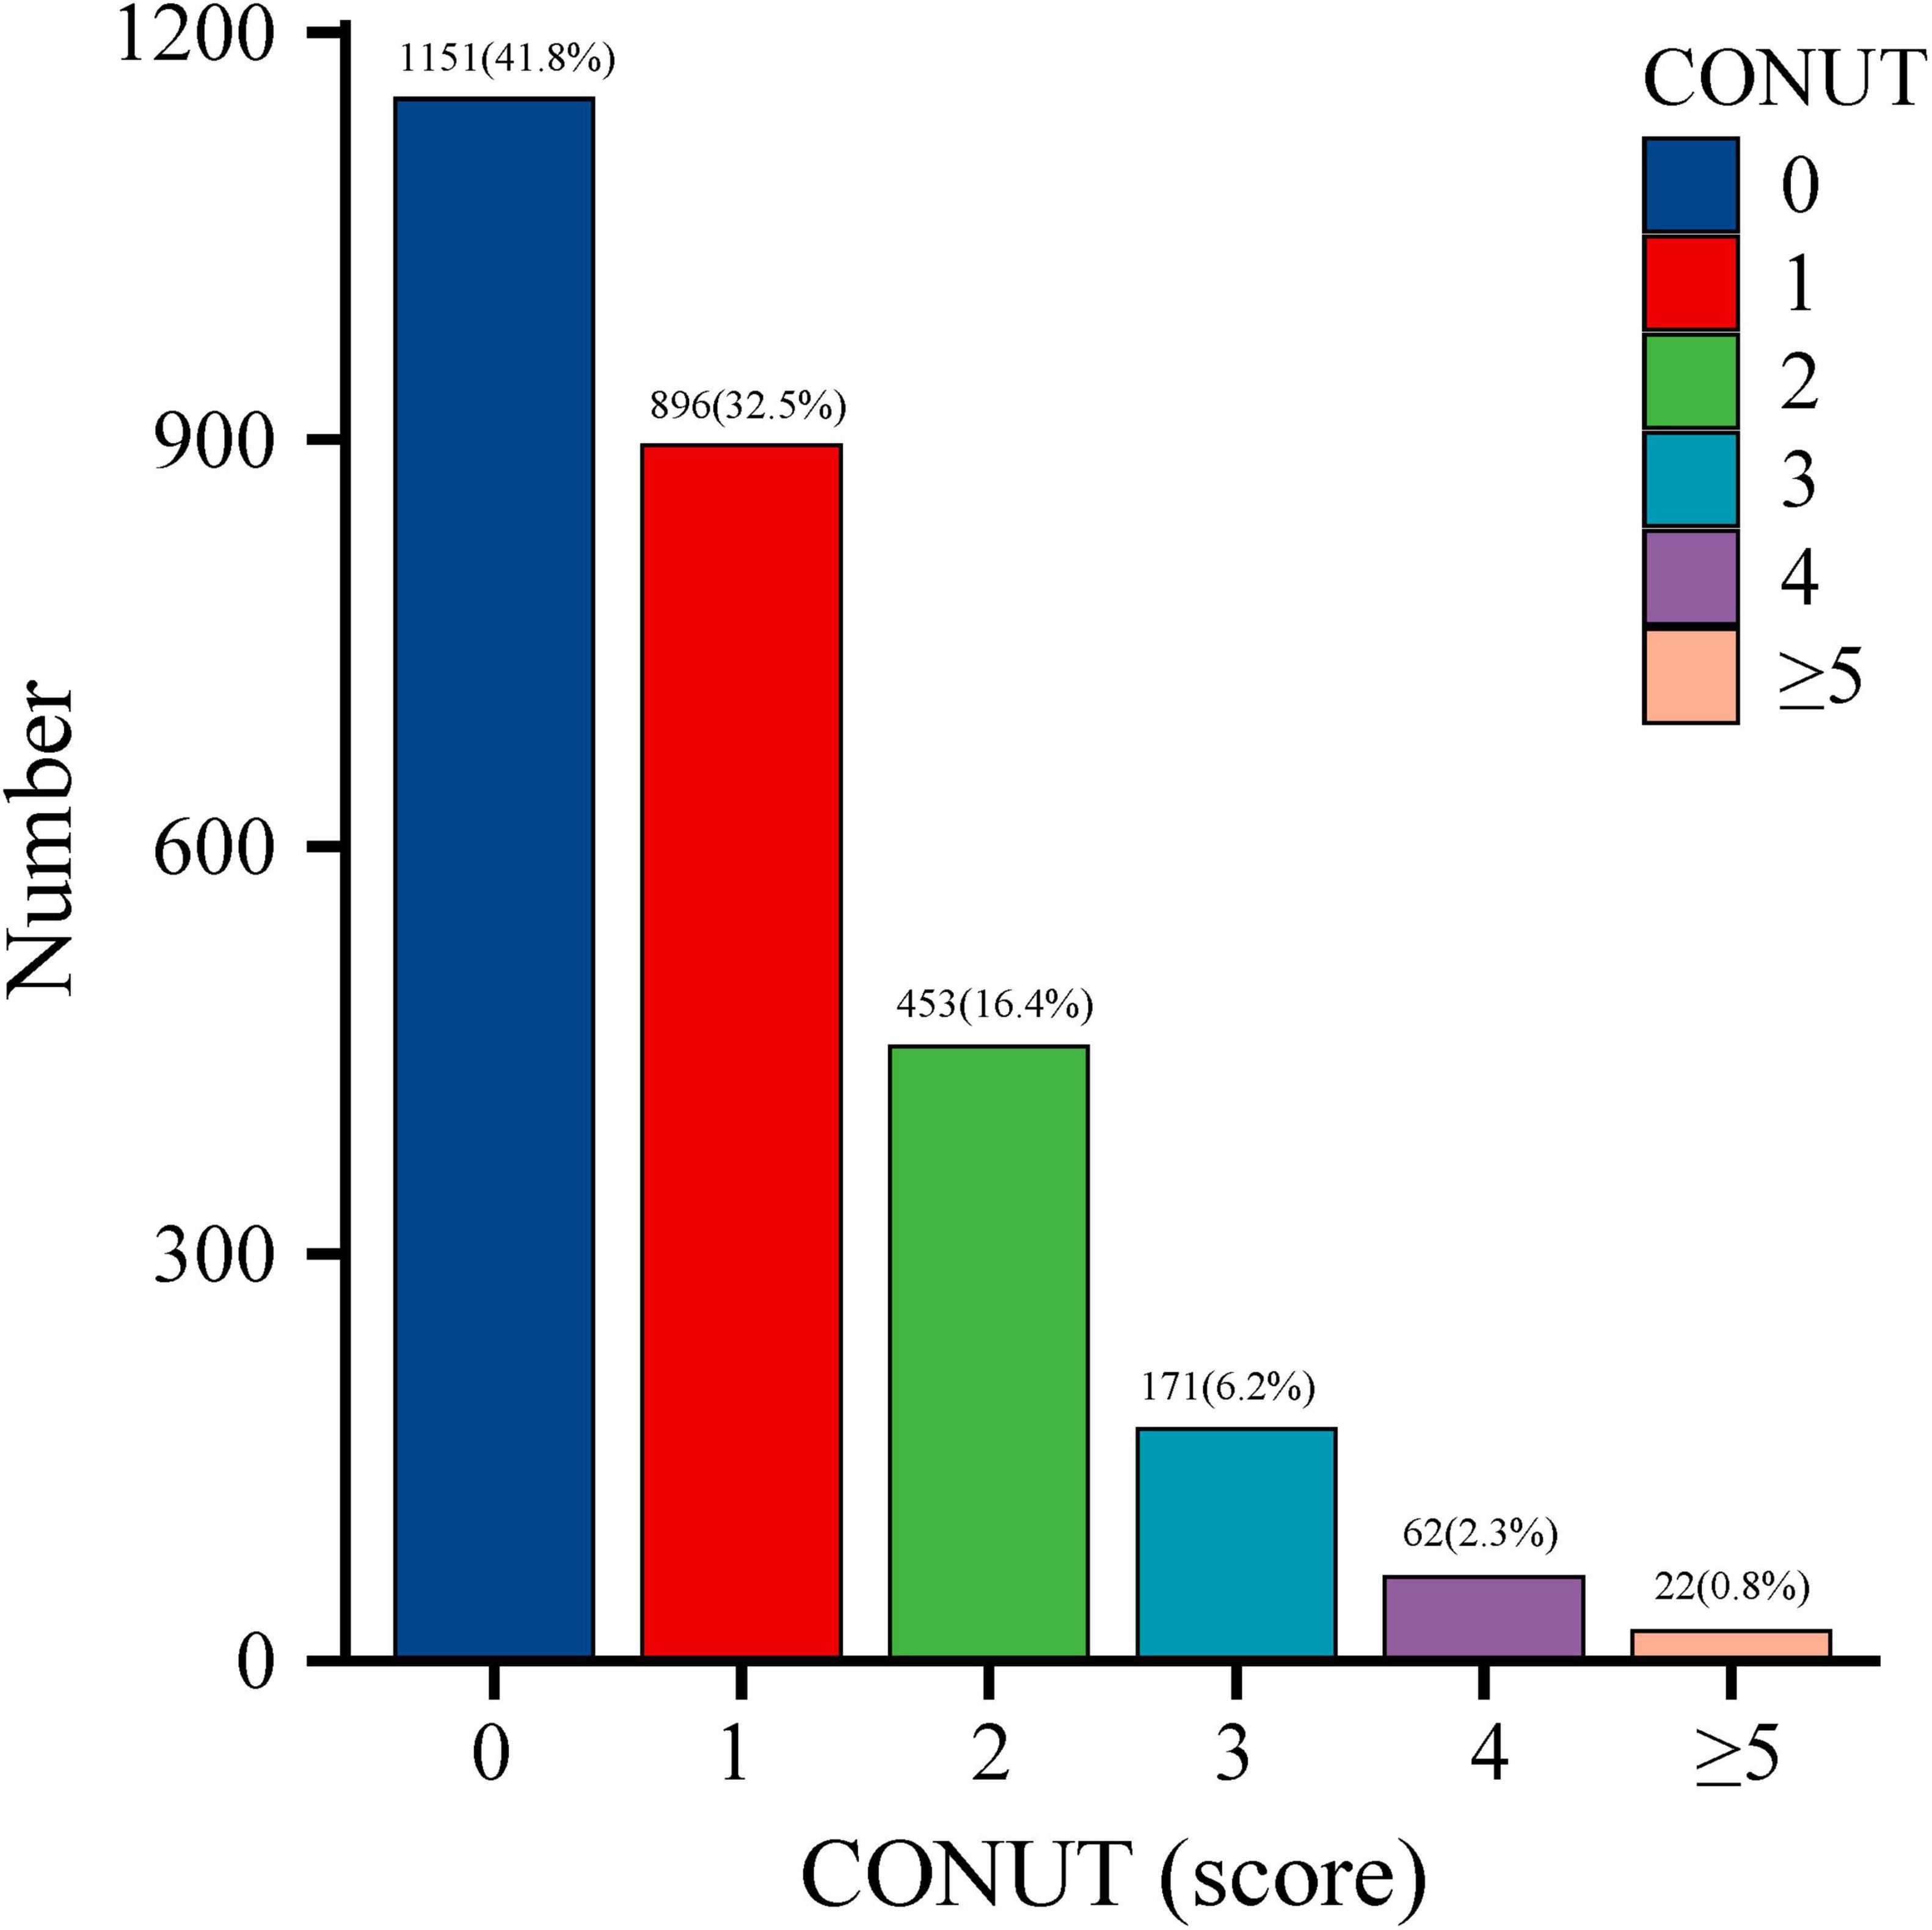
Figure 2. Distribution of Controlling Nutritional Status (CONUT) scores in the older adult population.
3.2 Logistic regression analysis of the CONUT score and cognitive impairment in older adults
Logistic regression analysis demonstrated a significant positive association between CONUT scores and cognitive impairment (Table 2). In the crude model, elevated CONUT scores were linked to increased odds of cognitive impairment (OR: 1.345 [95% CI, 1.254–1.442]). Similarly, direct correlations were observed between CONUT scores and CERAD-WL, CERAD-DR, AFT, and DSST performance. Model 1 adjusted for age, BMI, and gender; Model 2 further incorporated comorbidities (diabetes mellitus, cardiovascular disease, hypertension); Model 3 additionally adjusted for medications influencing CONUT components. After comprehensive adjustment for confounders, CONUT scores retained a statistically significant association with cognitive impairment (OR: 1.133 [95% CI, 1.052–1.221]), alongside AFT (OR: 1.180 [95% CI, 1.036–1.344]) and DSST (OR: 1.126 [95% CI, 1.017–1.247]). Analyses grouped by nutritional level by CONUT showed that cognitive impairment was associated with malnutrition (OR: 1.783 [95% CI, 1.505–2.111]), which remained associated with malnutrition after adjustment for covariates (OR: 1.259 [95% CI, 1.039–1.524]).
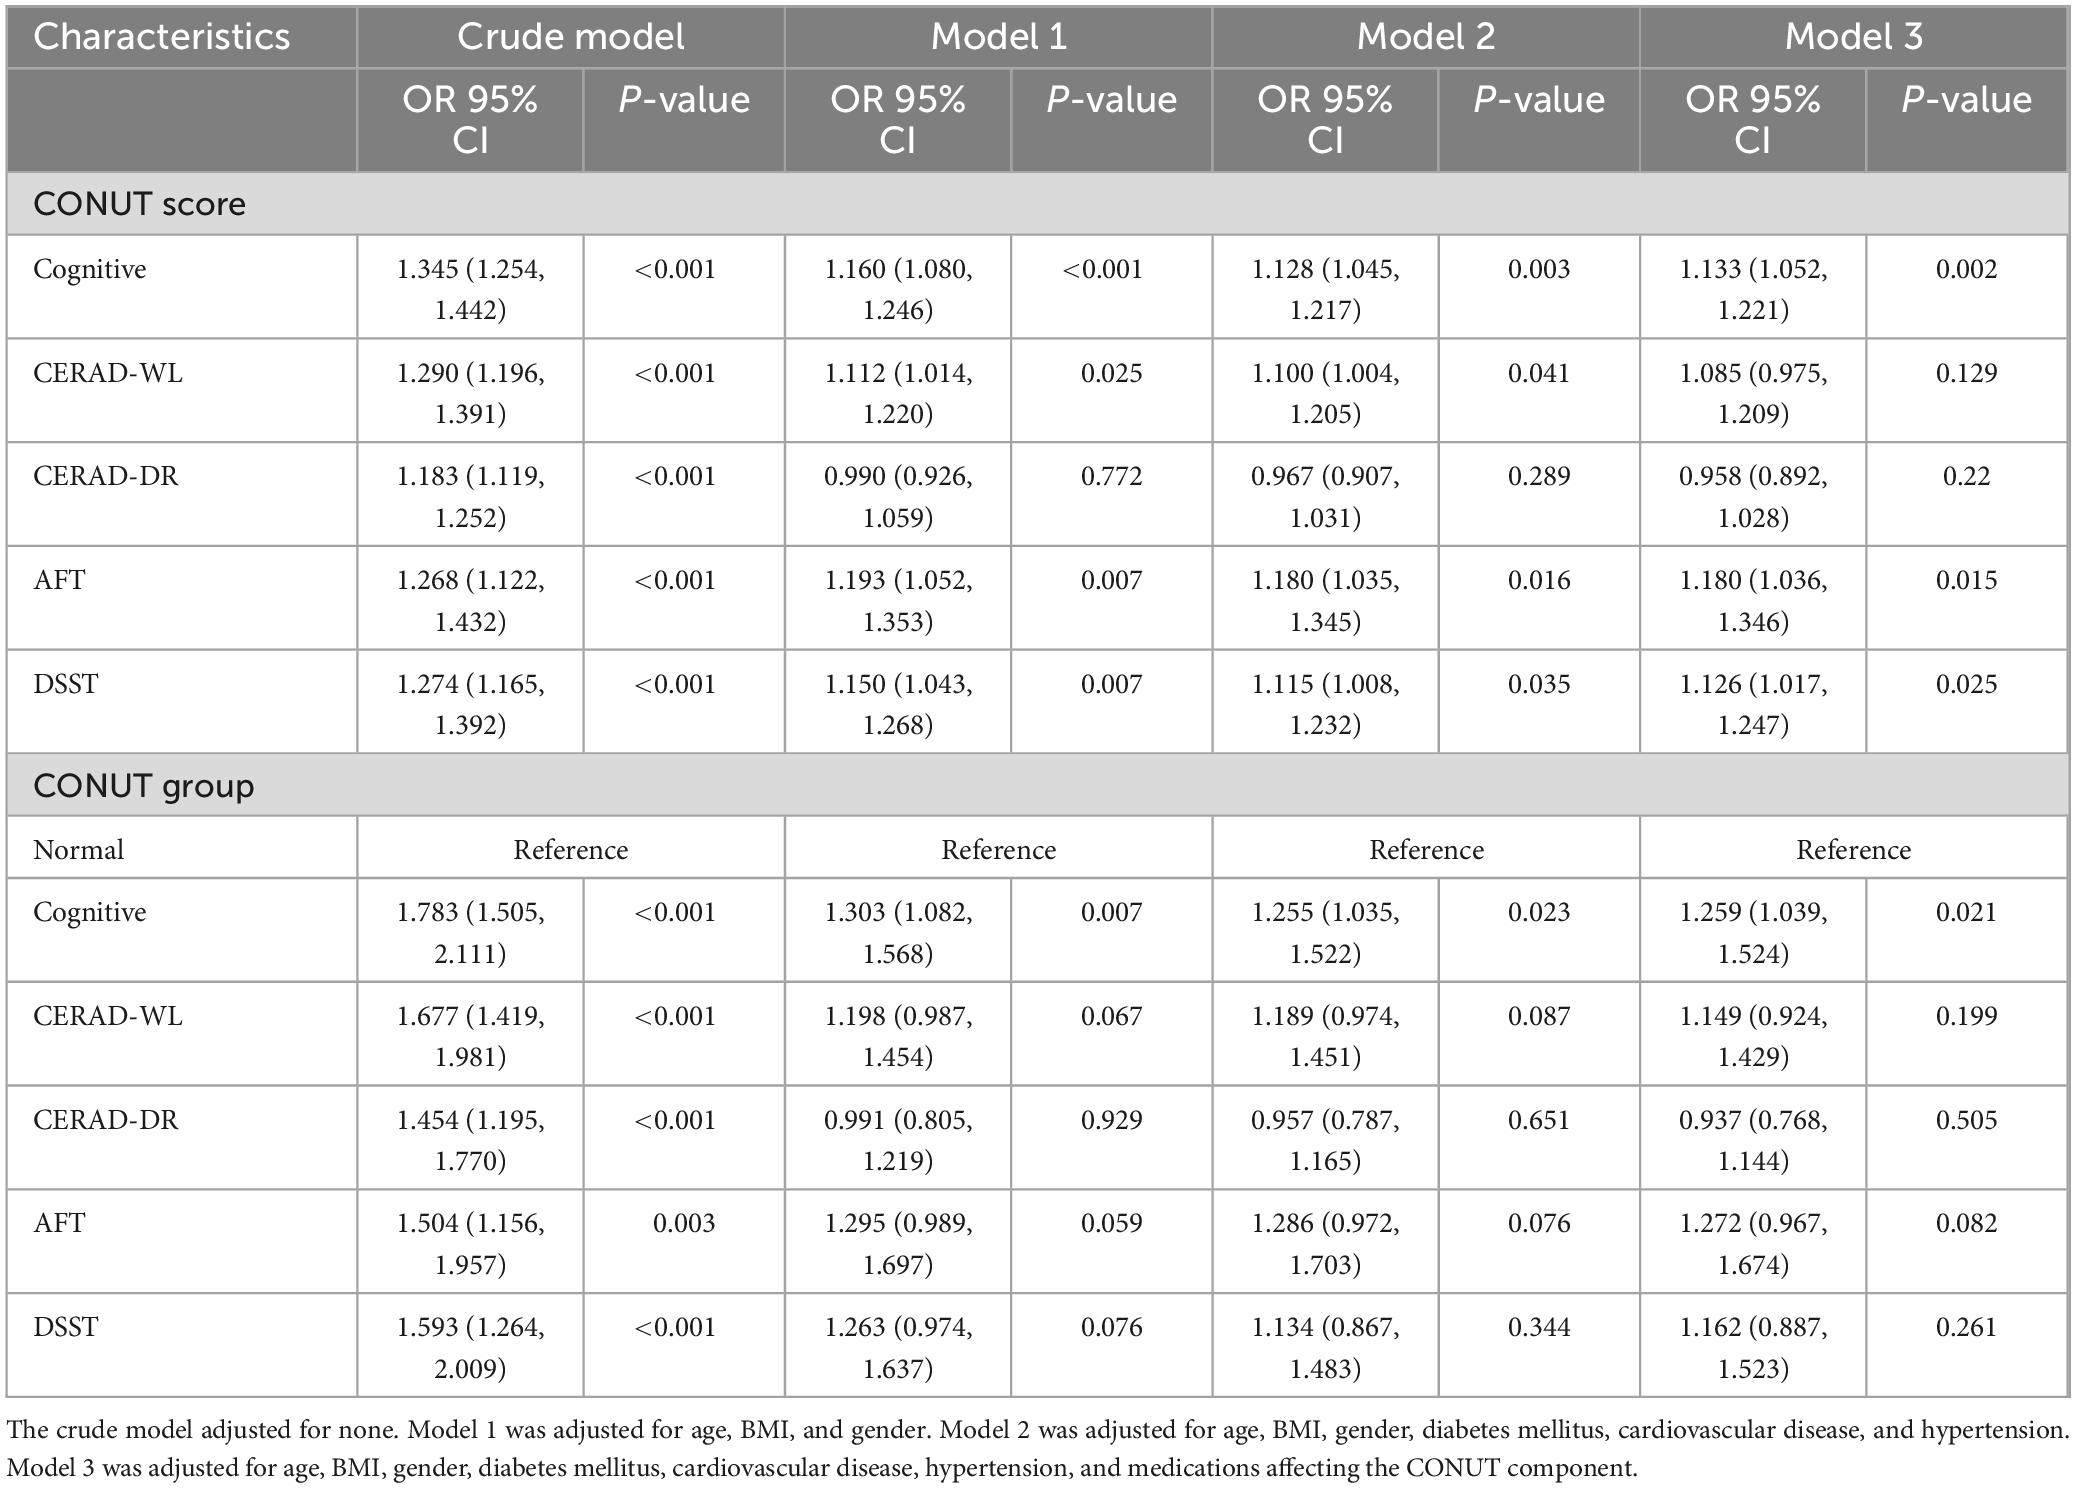
Table 2. Logistic regression between CONUT and cognitive impairment and composition.
3.3 Dose-response relationships between the CONUT score and cognitive impairment and its components
Restricted cubic spline analyses revealed a significant L-shaped association between CONUT scores and cognitive impairment (Figure 3). Specifically, an increasing risk of cognitive impairment was observed with elevated CONUT scores, demonstrating a statistically significant non-linear relationship (P for non-linearity < 0.001). A similar L-shaped pattern was identified between CONUT and AFT (P for non-linearity = 0.044). Moreover, a linear relationship was found between CONUT and DSST (P for non-linearity = 0.373). In contrast, no significant associations were detected between CONUT and CERAD-WL or CERAD-DR (P overall > 0.05).
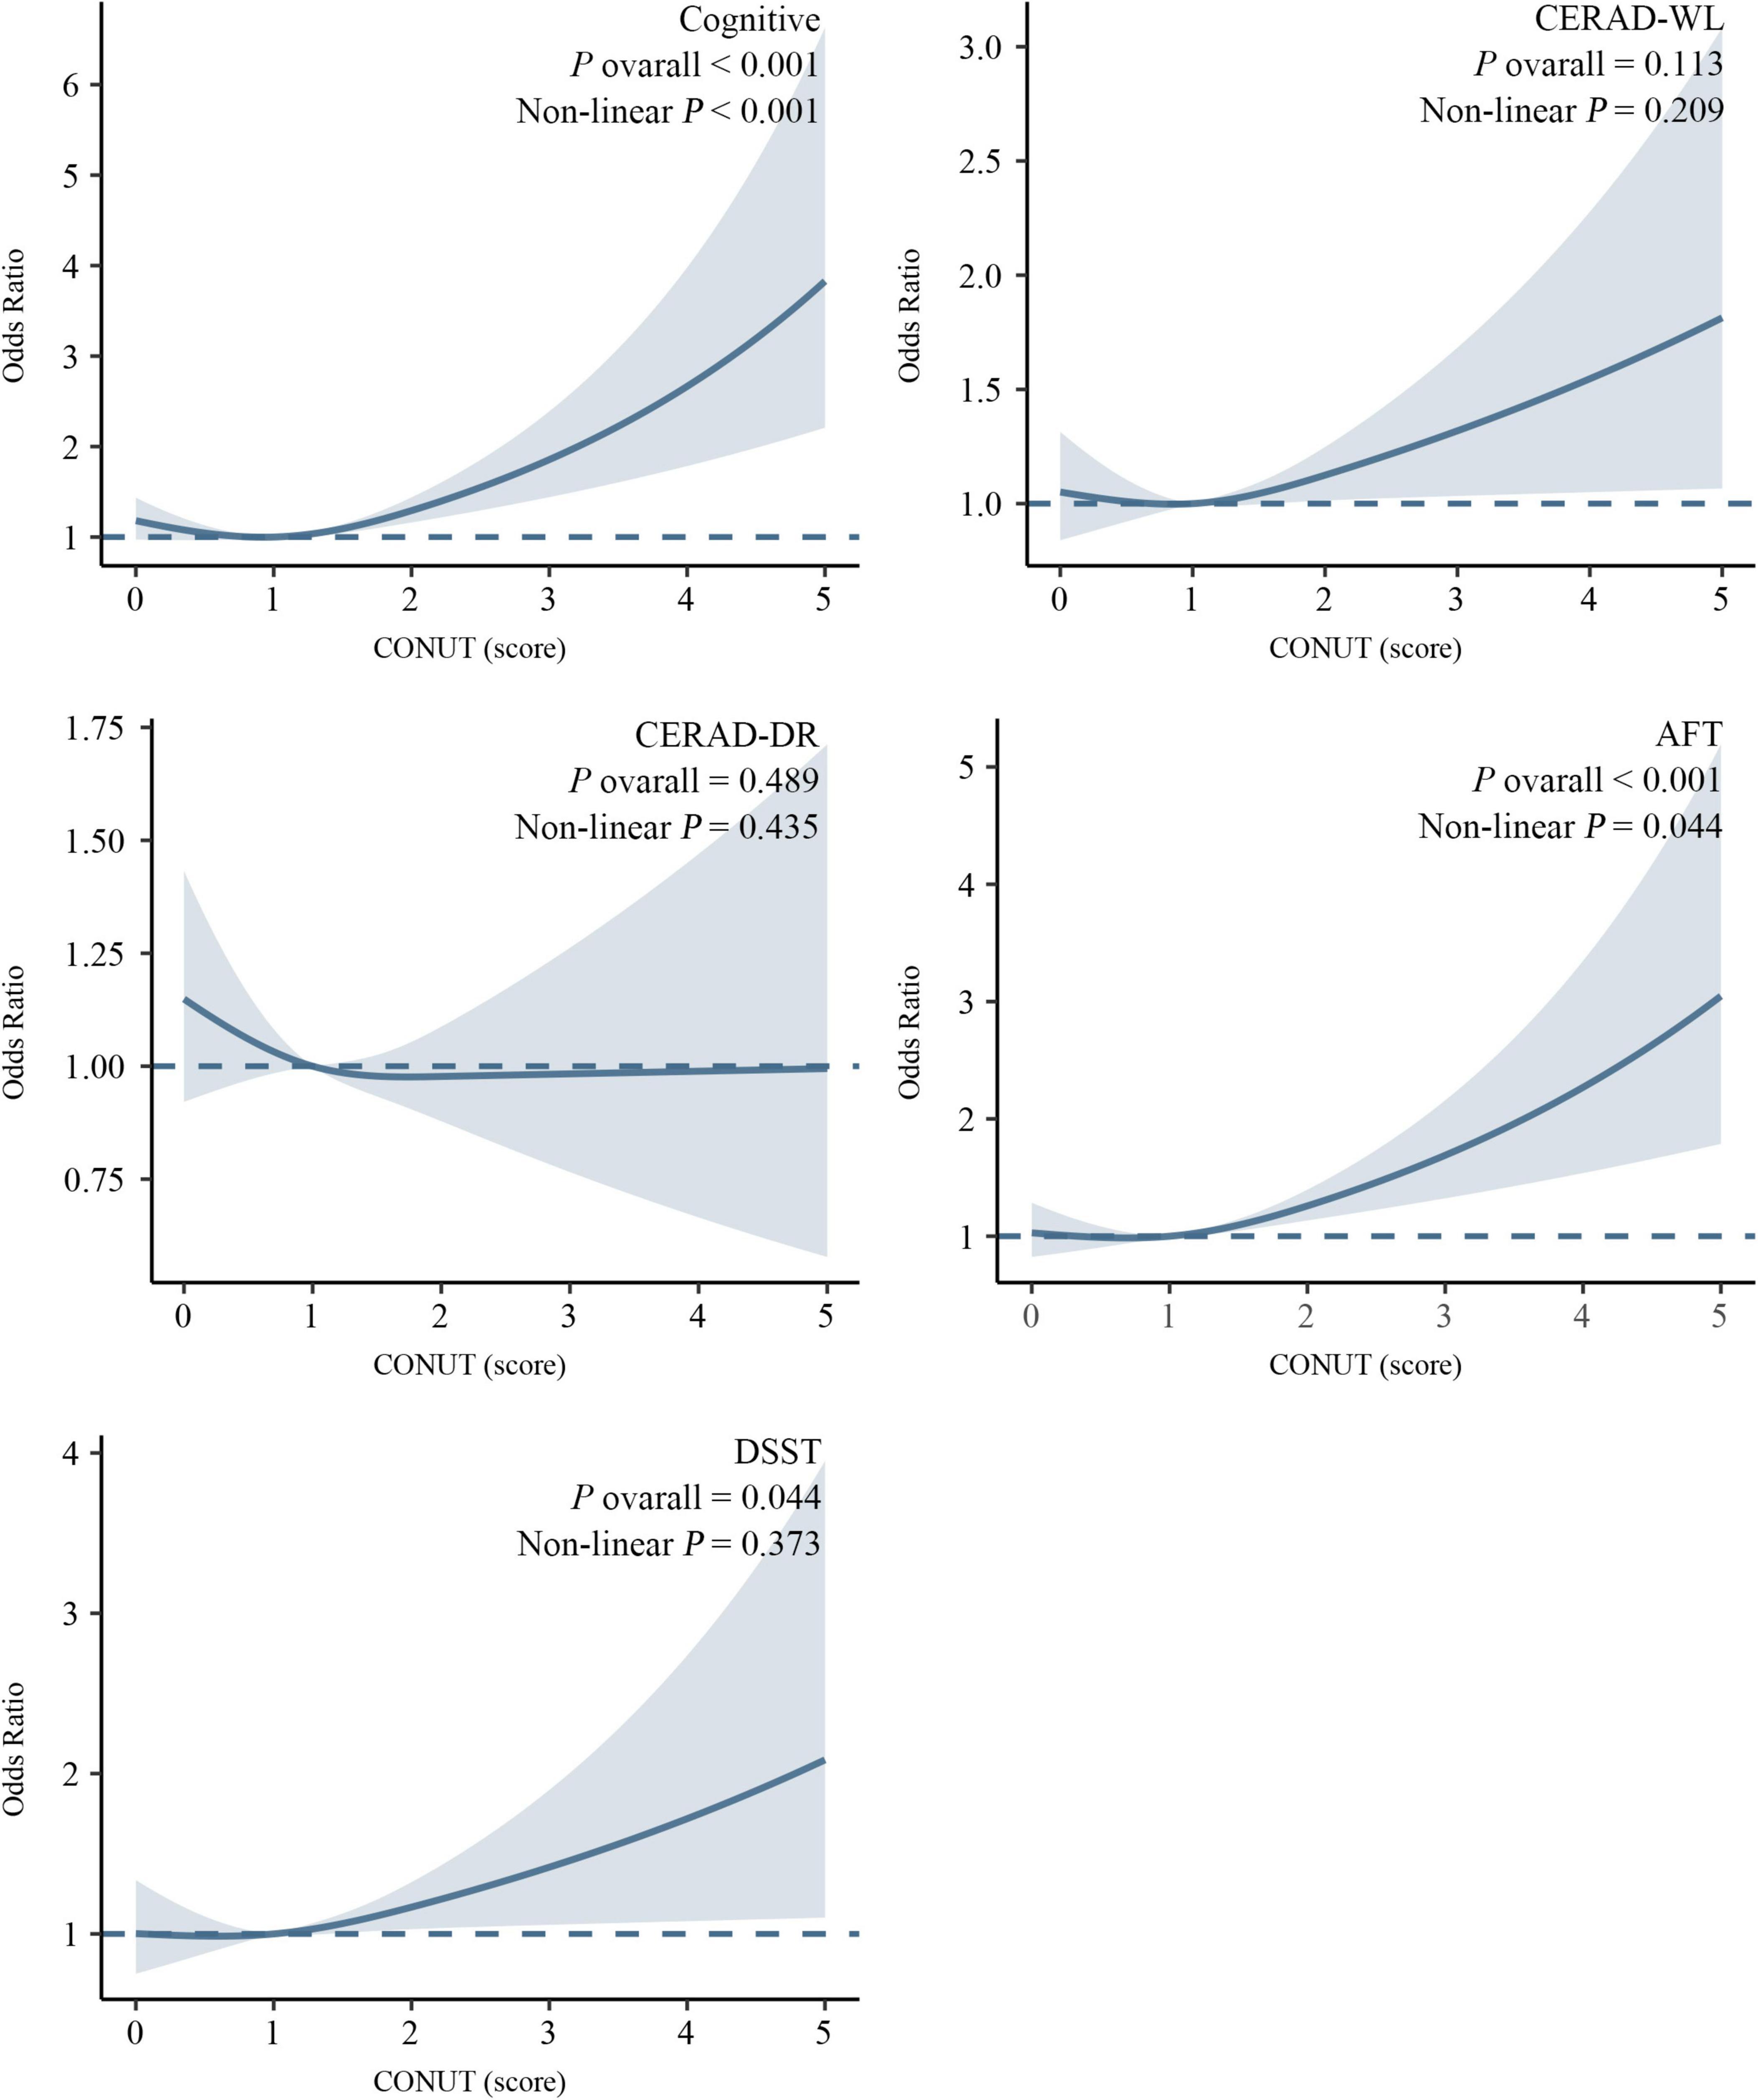
Figure 3. Association between the CONUT score and cognitive impairment revealed by restricted cubic spline (RCS) analysis. Adjusted for age, BMI, gender, diabetes mellitus, cardiovascular disease, hypertension, and medications affecting the CONUT component.
4 Discussion
Our NHANES-based study provides robust epidemiological evidence for the association between nutritional status (assessed via CONUT score) and cognitive impairment in older adults. The findings demonstrate that elevated CONUT scores maintain an independent and dose-dependent association with cognitive impairment, even after rigorous adjustment for clinical baseline characteristics and pharmacological confounders.
With increasing age, the structure of the human brain changes. Age-related diseases often lead to cognitive decline in older adult individuals. Pathological changes in the brain appear to precede clinical manifestations, which provides a considerable amount of time for the effective implementation of preventive strategies. A wide range of factors, such as dysphagia, speech disorders, depression and medication side effects, affect nutritional status. Clinical consequences of malnutrition include functional decline, impairment in performing daily activities, and increased mortality (27, 28). Older adults with cognitive impairment also have higher rates of malnutrition, and weight loss and dietary changes occur prior to impairment (13, 29). Given the specific energy metabolism pattern of the brain, cognitive decline depends not only on the deterioration of brain structure and function, but also on adequate nutrient intake and nutritional status, which play important roles in maintaining cognitive function (28). There is a close relationship between nutrition and the brain, which needs adequate nutrition to maintain cognitive function (28).
The role of nutritional interventions in mitigating cognitive decline has been substantiated through diverse dietary patterns and nutrient supplementation strategies (30). Malnutrition disrupts cognitive function, promotes muscle and bone loss, causes immunosuppression and increases mortality. Evidence indicates that unhealthy dietary habits and poor nutritional status are associated with the progression of cognitive impairment risk (31). Among post-stroke patients with cognitive impairment, malnutrition is prevalent, with nutritional risk demonstrating prognostic relevance to cognitive outcomes (32). Older adults constitute a high-risk population for malnutrition. Community-dwelling older adults in China exhibiting nutritional risk show elevated susceptibility to cognitive impairment (33). Findings from the Singapore Longitudinal Ageing Studies reveal that individuals aged ≥ 55 years with increased nutritional risk exhibit higher vulnerability to cognitive impairment (34). Similarly, malnutrition in Greek older adults demonstrates significant associations with both cognitive decline and depressive symptoms (35).
Therefore, nutritional interventions are critical to prevent cognitive decline. Systematic screening for malnutrition risk to determine the presence and severity of malnutrition contributes to an improved prognosis as well as to the successful management of malnutrition-related complications. The ultimate manifestation of malnutrition results from multifactorial determinants, yet standardized screening instruments remain lacking for identifying these contributing factors. Concurrently, substantial heterogeneity across studies due to the multiplicity of screening tools complicates inter-study comparability (15). Given these challenges, distinct screening instruments are required for nutritional risk assessment in diverse patient populations, with particular considerations for individuals with cognitive impairment. The MNA-SF, while widely utilized in geriatric populations, relies on subjective self-reporting and fails to evaluate feeding abnormalities secondary to cognitive or psychiatric symptoms, rendering it suboptimal for assessing cognitively impaired individuals. Similarly, the Simplified Nutritional Appetite Questionnaire (SNAQ) necessitates patient-reported information, potentially introducing bias when relying on caregiver proxies. The NRS 2002 and Malnutrition Universal Screening Tool (MUST) share analogous limitations, being primarily designed for acute nutritional risk evaluation rather than chronic cumulative nutritional deficits prevalent in cognitive impairment populations. The study showed that the agreement of malnutrition classification between the MNA-SF and Global Leadership Initiative on Malnutrition (GLIM) criteria was low among community-dwelling older adults, with less than 25% of participants receiving consistent classification results (36). Objective laboratory biomarkers reflecting nutritional alterations may prove more applicable. However, even the objective nutritional assessment tools exhibit specific limitations in older adult populations. Anthropometric parameters are not routinely monitored in older adults, and abrupt weight changes may be confounded by edema, dehydration, or acute illnesses rather than true nutritional status. Standardized measurements of weight and height are often challenging to obtain. For individuals with cognitive impairment, weight-based metrics in the NRI are more susceptible to assessment bias. Among these tools, the CONUT score shares components with the PNI-except for TC levels-but differs in methodology. Unlike the PNI, which requires continuous numerical calculations, the CONUT score employs categorical thresholds, making it more practical for rapid clinical classification. Notably, components of the CONUT score may be influenced by medications. To address this potential confounding, our study explicitly adjusted for medication use in the analytical framework. To our knowledge, research investigating CONUT in relation to cognitive impairment remains scarce compared to other nutritional scores or questionnaires. Previous studies in schizophrenia patients comparing three nutritional assessments, including CONUT, demonstrated non-significant correlations between CONUT and cognitive impairment (37). Our findings reveal a significantly elevated prevalence of cognitive impairment in populations with CONUT-quantified malnutrition. Further analysis establishes that elevated CONUT scores independently associate with cognitive impairment risk in older adults, aligning with prior studies linking nutritional deficiencies to cognitive decline.
Within the CONUT components, hypoalbuminemia not only indicates malnutrition but also reflects systemic inflammation (38). It has been found that people who experience cognitive impairment have lower serum albumin levels. Kim et al further clarified the relationship between low serum albumin levels and neurodegenerative diseases (39). Wang et al. (40) showed that low serum albumin levels increased the risk of cognitive impairment even in subjects with normal cognitive function. A study by Llewellyn et al. (41) also suggested that low serum albumin levels are associated with cognitive impairment in individuals older than 65 years. The aging process is accompanied by a decline in function and the accumulation of oxidative damage; this is paralleled by an increase in the brain’s susceptibility to damage and deterioration in structure and function, which leads to regression in cognitive behavior (42). Owing to the height of lipid content and oxidative metabolism in neurons, the brain is susceptible to oxidative stress, especially during aging and age-related cognitive impairment (43). Serum albumin, the primary antioxidant in plasma, plays a key role in oxidative damage. As part of the immune response, lymphocytes play an important role. Inadequate nutritional intake may lead to decreased lymphocyte counts and leads to functional alterations in cellular and humoral responses (44, 45). Some studies have reported a decrease in lymphocyte count in progressive malnutrition (46, 47). Low lymphocyte counts have also been reported in animals with cognitive impairment (48). Cholesterol levels decrease with age due to reasons that may be related to chronic disease, poor health, and metabolic and hormonal changes. Solomon et al. (49) showed that the relationship between TC and cognitive impairment varies by age. The decline in TC levels in later life increases the risk of cognitive impairment and is associated with the progressive course of cognitive decline. Aine et al. (50) found that participants with high TC levels had more accurate verbal memory and that the two were positively correlated. Thus, some researchers believe that low TC levels in older adults may impair brain structure/function and cognition.
Previous studies indicate that nutritional interventions yield greater benefits in specific populations with baseline cognitive impairment, particularly demonstrating improvements in attention, processing speed, and memory among older adults (51). The CERAD cognitive battery includes tasks assessing episodic memory capacity and facilitates early detection of cognitive decline. The AFT evaluates semantic fluency, while the DSST exhibits high sensitivity to cognitive changes, particularly processing speed. Our study revealed differential associations between CONUT scores and domain-specific cognitive functions. A stronger association was observed between CONUT and AFT performance, suggesting malnutrition may particularly affect cognitive processes dependent on prefrontal and temporal regions. However, the ceiling effect in certain CERAD memory tasks may obscure nutritional influences on cognitive performance, necessitating cautious interpretation.
The relationship between malnutrition and cognitive impairment is well established, and while many screening tools for malnutrition exist, most of them require detailed training by health care professionals and that participants have normal cognitive function. The CONUT score is simply calculated via objective indicators. This score is not only used for malnutrition grading, but also closely related to the occurrence of cognitive impairment in patients. The CONUT score considers a patient’s immune status, as well as protein and lipid storage, and reductions in each of these elements are associated with a poorer nutritional status. Our study suggests that the CONUT score can serve as a tool for identifying cognitive impairment in older adults, with demonstrated significant associations between CONUT and the risk of cognitive impairment in aging populations. However, this study has several limitations. The cross-sectional design precludes definitive conclusions regarding the temporal sequence and causal relationship between CONUT scores and cognitive impairment. Notably, cognitive impairment may itself contribute to malnutrition through mechanisms such as reduced dietary intake or impaired self-care, yet the cross-sectional framework cannot establish the directionality of this association. Although adjustments were made for demographic characteristics, comorbidities, and medication use, residual confounding from unmeasured variables (e.g., inflammatory biomarkers, genetic predisposition) may persist. The identification of cognitive impairment relied on psychometric test thresholds rather than clinically validated diagnostic criteria. This approach risks misclassifying individuals with normal cognitive function or failing to detect mild cognitive impairment, thereby limiting the external validity of findings. Additionally, the limited proportion of participants with severe malnutrition (CONUT score ≥ 5) restricted robust evaluation of the relationship between extreme nutritional deficits and cognitive outcomes.
5 Conclusion
This study found a greater prevalence of cognitive impairment among the participants in the malnutrition group. Even after adjusting for potential confounders, cognitive impairment was independently associated with the CONUT score. Given the important role of malnutrition in cognitive impairment, this study’s findings suggest that the CONUT score can help in the identification of older adult individuals with cognitive impairment.
Data availability statement
Publicly available datasets were analyzed in this study. This data can be found here: https://www.cdc.gov/nchs/nhanes/.
Ethics statement
The studies involving humans were approved by National Center for Health Statistics Research Ethics Review Board, with ethics approval number Protocol #2011–17. The studies were conducted in accordance with the local legislation and institutional requirements. Written informed consent for participation was not required from the participants or the participants’ legal guardians/next of kin in accordance with the national legislation and institutional requirements.
Author contributions
XZ: Conceptualization, Data curation, Formal Analysis, Investigation, Methodology, Software, Writing – original draft, Writing – review and editing. LY: Conceptualization, Data curation, Formal Analysis, Investigation, Methodology, Software, Writing – original draft, Writing – review and editing. ZW: Conceptualization, Data curation, Formal Analysis, Investigation, Methodology, Software, Visualization, Writing – original draft. HW: Writing – original draft, Conceptualization, Data curation, Formal Analysis, Investigation, Methodology, Software, Visualization. SN: Writing – original draft, Conceptualization, Data curation, Formal Analysis, Investigation, Methodology, Software, Visualization. CxZ: Writing – original draft, Conceptualization, Data curation, Investigation, Methodology, Software, Visualization. SK: Writing – original draft, Conceptualization, Data curation, Formal Analysis, Investigation, Methodology, Software, Visualization. CZ: Formal Analysis, Funding acquisition, Project administration, Resources, Supervision, Validation, Writing – review and editing. CP: Formal Analysis, Funding acquisition, Project administration, Resources, Supervision, Validation, Writing – review and editing.
Funding
The author(s) declare that financial support was received for the research and/or publication of this article. This study was supported by a Grant from the Natural Science Foundation of Sichuan Province (Grant No. 24NSFSC2348).
Acknowledgments
We thank all the NHANES staff and participants.
Conflict of interest
The authors state that the study was carried out without any existing commercial or financial affiliations that might be interpreted as potential conflicts of interest.
Generative AI statement
The authors declare that no Generative AI was used in the creation of this manuscript.
Publisher’s note
All claims expressed in this article are solely those of the authors and do not necessarily represent those of their affiliated organizations, or those of the publisher, the editors and the reviewers. Any product that may be evaluated in this article, or claim that may be made by its manufacturer, is not guaranteed or endorsed by the publisher.
Supplementary material
The Supplementary Material for this article can be found online at: https://www.frontiersin.org/articles/10.3389/fnut.2025.1571990/full#supplementary-material
Footnotes
References
1. Beard J, Officer A, de Carvalho I, Sadana R, Pot A, Michel J, et al. The World report on ageing and health: A policy framework for healthy ageing. Lancet. (2016) 387:2145–54. doi: 10.1016/S0140-6736(15)00516-4
2. Baird K, Baillon S, Lau L, Storey M, Lindesay J, Velayudhan L. Predictive factors for conversion to dementia in individuals with early-onset mild cognitive impairment. Dement Geriatr Cogn Disord. (2021) 50:548–53. doi: 10.1159/000520882
3. Thaipisuttikul P, Jaikla K, Satthong S, Wisajun P. Rate of conversion from mild cognitive impairment to dementia in a Thai hospital-based population: A retrospective cohort. Alzheimers Dement (N Y). (2022) 8:e12272. doi: 10.1002/trc2.12272
4. Chen S, Bhattacharya J, Pershing S. Association of vision loss with cognition in older adults. JAMA Ophthalmol. (2017) 135:963–70. doi: 10.1001/jamaophthalmol.2017.2838
5. Shimada H, Makizako H, Doi T, Tsutsumimoto K, Lee S, Suzuki T. Cognitive impairment and disability in older japanese adults. PLoS One. (2016) 11:e0158720. doi: 10.1371/journal.pone.0158720
6. Livingston G, Huntley J, Sommerlad A, Ames D, Ballard C, Banerjee S, et al. Dementia prevention, intervention, and care: 2020 report of the Lancet commission. Lancet. (2020) 396:413–46. doi: 10.1016/S0140-6736(20)30367-6
7. Kivipelto M, Mangialasche F, Ngandu T. Lifestyle interventions to prevent cognitive impairment, dementia and Alzheimer disease. Nat Rev Neurol. (2018) 14:653–66. doi: 10.1038/s41582-018-0070-3
8. Yaffe K, Vittinghoff E, Hoang T, Matthews K, Golden S, Zeki Al, et al. Cardiovascular risk factors across the life course and cognitive decline: A pooled cohort study. Neurology. (2021) 96:e2212–9. doi: 10.1212/WNL.0000000000011747
9. Dent E, Wright O, Woo J, Hoogendijk E. Malnutrition in older adults. Lancet. (2023) 401:951–66. doi: 10.1016/S0140-6736(22)02612-5
10. Shpata V, Ohri I, Nurka T, Prendushi X. The prevalence and consequences of malnutrition risk in elderly Albanian intensive care unit patients. Clin Interv Aging. (2015) 10:481–6. doi: 10.2147/CIA.S77042
11. Hickson M. Malnutrition and ageing. Postgrad Med J. (2006) 82:2–8. doi: 10.1136/pgmj.2005.037564
12. Lo Buglio A, Bellanti F, Capurso C, Paglia A, Vendemiale G. Adherence to mediterranean diet, malnutrition, length of stay and mortality in elderly patients hospitalized in internal medicine wards. Nutrients. (2019) 11:790. doi: 10.3390/nu11040790
13. Malara A, Sgrò G, Caruso C, Ceravolo F, Curinga G, Renda G, et al. Relationship between cognitive impairment and nutritional assessment on functional status in Calabrian long-term-care. Clin Interv Aging. (2014) 9:105–10. doi: 10.2147/CIA.S54611
14. Fagerström C, Palmqvist R, Carlsson J, Hellström Y. Malnutrition and cognitive impairment among people 60 years of age and above living in regular housing and in special housing in Sweden: A population-based cohort study. Int J Nurs Stud. (2011) 48:863–71. doi: 10.1016/j.ijnurstu.2011.01.007
15. Serón-Arbeloa C, Labarta-Monzón L, Puzo-Foncillas J, Mallor-Bonet T, Lafita-López A, Bueno-Vidales N, et al. Malnutrition screening and assessment. Nutrients. (2022) 14:2392. doi: 10.3390/nu14122392
16. Salvi F, Giorgi R, Grilli A, Morichi V, Espinosa E, Spazzafumo L, et al. Mini nutritional assessment (short form) and functional decline in older patients admitted to an acute medical ward. Aging Clin Exp Res. (2008) 20:322–8. doi: 10.1007/BF03324863
17. Wang S, Zhang J, Zhuang J, Wang Y, Xu D, Wu Y. Association between geriatric nutritional risk index and cognitive function in older adults with/without chronic kidney disease. Brain Behav. (2024) 14:e70015. doi: 10.1002/brb3.70015
18. Lee M, Lim J, Kim Y, Lee J, Kim C, Lee S, et al. Association between geriatric nutritional risk index and post-stroke cognitive outcomes. Nutrients. (2021) 13:1776. doi: 10.3390/nu13061776
19. Wang Y, Zhang G, Shen Y, Zhao P, Sun H, Ji Y, et al. Relationship between prognostic nutritional index and post-stroke cognitive impairment. Nutr Neurosci. (2024) 27:1330–40. doi: 10.1080/1028415X.2024.2330786
20. Hayama T, Ozawa T, Okada Y, Tsukamoto M, Fukushima Y, Shimada R, et al. The pretreatment controlling nutritional status (CONUT) score is an independent prognostic factor in patients undergoing resection for colorectal cancer. Sci Rep. (2020) 10:13239. doi: 10.1038/s41598-020-70252-2
21. Kato T, Yaku H, Morimoto T, Inuzuka Y, Tamaki Y, Yamamoto E, et al. Association with controlling nutritional status (CONUT) score and in-hospital mortality and infection in acute heart failure. Sci Rep. (2020) 10:3320. doi: 10.1038/s41598-020-60404-9
22. Sun X, Luo L, Zhao X, Ye P. Controlling nutritional status (CONUT) score as a predictor of all-cause mortality in elderly hypertensive patients: A prospective follow-up study. BMJ Open. (2017) 7:e015649. doi: 10.1136/bmjopen-2016-015649
23. Liu C, Zhu M, Yang X, Cui H, Li Z, Wei J. Controlling nutritional status score as a predictive marker of in-hospital mortality in older adult patients. Front Nutr. (2021) 8:738045. doi: 10.3389/fnut.2021.738045
24. Fillenbaum G, van Belle G, Morris J, Mohs R, Mirra S, Davis P, et al. Consortium to establish a registry for Alzheimer’s disease (CERAD): The first twenty years. Alzheimers Dement. (2008) 4:96–109. doi: 10.1016/j.jalz.2007.08.005
25. Balzano J, Chiaravalloti N, Lengenfelder J, Moore N, DeLuca J. Does the scoring of late responses affect the outcome of the paced auditory serial addition task (PASAT)? Arch Clin Neuropsychol. (2006) 21:819–25. doi: 10.1016/j.acn.2006.09.002
26. Jaeger J. Digit symbol substitution test: The case for sensitivity over specificity in neuropsychological testing. J Clin Psychopharmacol. (2018) 38:513–9. doi: 10.1097/JCP.0000000000000941
27. Hanson L, Ersek M, Lin F, Carey T. Outcomes of feeding problems in advanced dementia in a nursing home population. J Am Geriatr Soc. (2013) 61:1692–7. doi: 10.1111/jgs.12448
28. Otsuka R. Diet, nutrition, and cognitive function: A narrative review of Japanese longitudinal studies. Geriatr Gerontol Int. (2022) 22:825–31. doi: 10.1111/ggi.14463
29. Cereda E, Pedrolli C, Klersy C, Bonardi C, Quarleri L, Cappello S, et al. Nutritional status in older persons according to healthcare setting: A systematic review and meta-analysis of prevalence data using MNA®. Clin Nutr. (2016) 35:1282–90. doi: 10.1016/j.clnu.2016.03.008
30. Dominguez L, Veronese N, Vernuccio L, Catanese G, Inzerillo F, Salemi G, et al. Nutrition, physical activity, and other lifestyle factors in the prevention of cognitive decline and dementia. Nutrients. (2021) 13:4080. doi: 10.3390/nu13114080
31. Doorduijn A, de van der Schueren MAE, van de Rest O, de Leeuw FA, Hendriksen HMA, Teunissen CE, et al. Nutritional status is associated with clinical progression in Alzheimer’s disease: The NUDAD project. J Am Med Dir Assoc. (2023) 24: 638–44.e1. doi: 10.1016/j.jamda.2020.10.020.
32. Tsutsumiuchi K, Wakabayashi H, Maeda K, Shamoto H. Impact of malnutrition on post-stroke cognitive impairment in convalescent rehabilitation ward inpatients. Eur Geriatr Med. (2021) 12:167–74. doi: 10.1007/s41999-020-00393-0
33. Wang L, Hu Z, Chen H, Zhou C, Hu X. Prevalence of mild cognitive impairment and its association with malnutrition in older Chinese adults in the community. Front Public Health. (2024) 12:1407694. doi: 10.3389/fpubh.2024.1407694
34. Lu Y, Gwee X, Chua D, Lee T, Lim W, Chong M, et al. Nutritional status and risks of cognitive decline and incident neurocognitive disorders: Singapore longitudinal ageing studies. J Nutr Health Aging. (2021) 25:660–7. doi: 10.1007/s12603-021-1603-9
35. Mantzorou M, Vadikolias K, Pavlidou E, Serdari A, Vasios G, Tryfonos C, et al. Nutritional status is associated with the degree of cognitive impairment and depressive symptoms in a Greek elderly population. Nutr Neurosci. (2020) 23:201–9. doi: 10.1080/1028415X.2018.1486940
36. Kaluźniak-Szymanowska A, Krzymińska-Siemaszko R, Lewandowicz M, Deskur-Śmielecka E, Stachnik K, Wieczorowska-Tobis K. Diagnostic performance and accuracy of the MNA-SF against GLIM criteria in community-dwelling older adults from Poland. Nutrients. (2021) 13:2183. doi: 10.3390/nu13072183
37. Wang B, Zhou Y, Yu H, Jiang T, Liu K, Pu J, et al. Correlations between nutritional indicators and cognitive function in patients with stable schizophrenia in a hospital setting. PLoS One. (2024) 19:e0312227. doi: 10.1371/journal.pone.0312227
38. Sun H, Hu P, Shen H, Dong W, Zhang T, Liu Q, et al. Albumin and neutrophil combined prognostic grade as a new prognostic factor in non-small cell lung cancer: Results from a large consecutive cohort. PLoS One. (2015) 10:e0144663. doi: 10.1371/journal.pone.0144663
39. Kim J, Byun M, Lee J, Yi D, Jeon S, Sohn B, et al. Serum albumin and beta-amyloid deposition in the human brain. Neurology. (2020) 95:e815–26. doi: 10.1212/WNL.0000000000010005
40. Wang L, Wang F, Liu J, Zhang Q, Lei P. Inverse relationship between baseline serum albumin levels and risk of mild cognitive impairment in elderly: A seven-year retrospective cohort study. Tohoku J Exp Med. (2018) 246:51–7. doi: 10.1620/tjem.246.51
41. Llewellyn D, Langa K, Friedland R, Lang I. Serum albumin concentration and cognitive impairment. Curr Alzheimer Res. (2010) 7:91–6. doi: 10.2174/156720510790274392
42. Campos P, Paulsen B, Rehen S. Accelerating neuronal aging in in vitro model brain disorders: A focus on reactive oxygen species. Front Aging Neurosci. (2014) 6:292. doi: 10.3389/fnagi.2014.00292
43. Castelli V, Benedetti E, Antonosante A, Catanesi M, Pitari G, Ippoliti R, et al. Neuronal cells rearrangement during aging and neurodegenerative disease: Metabolism, oxidative stress and organelles dynamic. Front Mol Neurosci. (2019) 12:132. doi: 10.3389/fnmol.2019.00132
44. Chandra R. Nutrition and the immune system from birth to old age. Eur J Clin Nutr. (2002) 56:S73–6. doi: 10.1038/sj.ejcn.1601492
46. Omran M, Morley J. Assessment of protein energy malnutrition in older persons, Part II: Laboratory evaluation. Nutrition. (2000) 16:131–40. doi: 10.1016/s0899-9007(99)00251-8
47. Bistrian B, Blackburn G, Scrimshaw N, Flatt J. Cellular immunity in semistarved states in hospitalized adults. Am J Clin Nutr. (1975) 28:1148–55. doi: 10.1093/ajcn/28.10.1148
48. Mongillo P, Bertotto D, Pitteri E, Stefani A, Marinelli L, Gabai G. Peripheral leukocyte populations and oxidative stress biomarkers in aged dogs showing impaired cognitive abilities. Age (Dordr). (2015) 37:9778. doi: 10.1007/s11357-015-9778-9
49. Solomon A, Kåreholt I, Ngandu T, Winblad B, Nissinen A, Tuomilehto J, et al. Serum cholesterol changes after midlife and late-life cognition: Twenty-one-year follow-up study. Neurology. (2007) 68:751–6. doi: 10.1212/01.wnl.0000256368.57375.b7
50. Aine C, Sanfratello L, Adair J, Knoefel J, Qualls C, Lundy S, et al. Characterization of a normal control group: Are they healthy? Neuroimage. (2014) 84:796–809. doi: 10.1016/j.neuroimage.2013.09.025
51. McGrattan A, van Aller C, Narytnyk A, Reidpath D, Keage H, Mohan D, et al. Nutritional interventions for the prevention of cognitive impairment and dementia in developing economies in East-Asia: A systematic review and meta-analysis. Crit Rev Food Sci Nutr. (2022) 62:1838–55. doi: 10.1080/10408398.2020.1848785
Keywords: Controlling Nutritional Status, cognitive, older adults, NHANES, cross-sectional study
Citation: Zhang X, Yang L, Wang Z, Wang H, Nie S, Zhao C, Kang S, Zhang C and Pan C (2025) Associations between nutritional status and cognitive impairment in older adults: results from the NHANES 2011–2014 cycles. Front. Nutr. 12:1571990. doi: 10.3389/fnut.2025.1571990
Received: 14 February 2025; Accepted: 26 May 2025;
Published: 03 July 2025.
Edited by:
Sedat Arslan, Bandırma Onyedi Eylül University, TürkiyeReviewed by:
Emre Çiydem, Bandırma Onyedi Eylül University, TürkiyeHacı Ömer Yılmaz, Bandırma Onyedi Eylül University, Türkiye
Copyright © 2025 Zhang, Yang, Wang, Wang, Nie, Zhao, Kang, Zhang and Pan. This is an open-access article distributed under the terms of the Creative Commons Attribution License (CC BY). The use, distribution or reproduction in other forums is permitted, provided the original author(s) and the copyright owner(s) are credited and that the original publication in this journal is cited, in accordance with accepted academic practice. No use, distribution or reproduction is permitted which does not comply with these terms.
*Correspondence: Chuan Zhang, emhhbmdjaHVhbjA5MDVAc2luYS5jb20=; Chuanliang Pan, Y2wucGFuQGZveG1haWwuY29t
†These authors have contributed equally to this work