 Martina Bituh
 Ana Ilić
 Petra Škorvaga1
 Irena Colić Barić
 Ivana Rumbak
- 1Department of Food Quality Control, Faculty of Food Technology and Biotechnology, University of Zagreb, Zagreb, Croatia
- 2Department of Marketing, Faculty of Economics and Business, University of Zagreb, Zagreb, Croatia
Background: The consumption of phytochemicals is known for its positive effects on human health. However, there are no established recommendations for daily intake in European or international guidelines. Given the different dietary patterns in different countries and the changes in dietary trends over time, it is crucial to assess the intake of phytochemicals, especially in children, as inadequate consumption may increase the risk of chronic non-communicable diseases. To address this gap, the present study aims to estimate the daily intake of the four major classes of phytochemicals among schoolchildren in urban areas and to identify the main dietary sources and subclasses that contribute most to their intake.
Methods: Daily intake of the four main classes of phytochemicals and their main dietary sources was assessed in school children from an urban setting (N = 195; 8.9 ± 0.4 years). Intake of phytochemicals was estimated from 3-day dietary records analyzed with available composition tables and databases.
Results: The median intake of polyphenols in children was 125.7 mg/day, of carotenoids 3.9 mg/day, of phytosterols 126.1 mg/day and of glucosinolates 2.3 mg/day, with girls having a significantly higher intake of polyphenols. Although fruit and vegetables are the most common sources of phytochemicals in the diet, an increased contribution of sweets and cakes and mixed dishes was observed. Food groups rich in phytochemicals (fruits, vegetables, legumes, nuts and seeds) contributed less than 10% of the daily energy intake.
Conclusion: Although there are no official recommendations for the intake of phytochemicals, the study suggests that children have a low intake of all four main classes of phytochemicals compared to existing data for both children and adults. To improve the intake of phytochemicals, it is necessary to promote the consumption of foods rich in phytochemicals and increase dietary diversity both at home and at school.
Introduction
In the context of nutrition and human health, the intake of phytochemicals has been recognized for their beneficial effects (1–3). However, there is no recommended daily intake for phytochemicals in the European food standards, the guidelines of the World Health Organization or the guidelines of non-European countries (4–7). The problem of defining recommendations for the intake of phytochemicals is challenging due to their wide chemical diversity, the lack of evidence linking their health effects to the consumption of whole foods rather than isolated compounds and lack of clearly defined biological functions or deficiency syndromes (8). Furthermore, it is difficult to accurately estimate the actual intake of phytochemicals, that may 1 day be linked to health outcomes in epidemiological studies, as there is still a lack of comprehensive and standardized food composition databases containing values for the broad spectrum of phytochemicals. Only a few existing food databases contain the amount of polyphenols in food, such as the USDA Food Database, which contains information on 38 different phytochemicals from the group of carotenoids, phytosterols and polyphenols (9, 10). Even fewer databases contain the content of phytochemicals together with the associated retention factors, one such database is Phenol Explorer (11). Therefore, the evaluation of the intake of phytochemicals is usually limited to an assessment based on the data of individual scientific studies. Furthermore, the bioavailability and accessibility of phytochemicals are strongly influenced by food processing, food matrix and metabolism (1, 12, 13). There is also a lack of epidemiological studies evaluating the intake of phytochemicals and linking it to health outcomes in different life stages, especially in children. To the authors’ knowledge, there are only a few studies that have estimated the intake of phytochemicals, with polyphenols being the most frequently observed main class of phytochemicals (14–22).
Due to different dietary patterns among countries and dietary trends in intake over time (23) it seems important to collect such data, especially in children as low consumption could be a risk of development of chronic non communicable diseases.
To fill this knowledge gap, the present study aims to estimate the daily intake of the four main classes of phytochemicals and to determine which subclasses of each main class of phytochemicals contribute most to their daily intake in schoolchildren from urban settings. In addition, this study aims to evaluate which subclasses of each main class of phytochemicals contribute most to their daily intake. In addition, the present study aims to identify the major dietary contributors to the daily intake of four main classes of phytochemicals.
Subjects and methods
Study population and design
This study uses a cross-sectional approach based on data collected as part of a previously conducted prospective longitudinal intervention study carried out over a three-year period (school year 2018/2019 to 2020/2021) in elementary school in Zagreb, Croatia, participating in the “Pilot Project: School Meals and Fruit and Vegetable Intake in Schools With and Without a Garden” (24). For this study, data was extracted from the baseline of the prospective longitudinal intervention study. This study involved school-age children (8.9 ± 0.4 years) from 14 elementary school in the city of Zagreb. The present study was carried on 195 schoolchildren (28.6% of total study population included in the project) which 3-day dietary records were collected. The minimum number of 184 children, 92 per gender, was estimated to detect a group difference with 95% power at a significance of α = 0.05 significance (version 3.1.9.2; Heinrich Heine University Dusseldorf, Dusseldorf, Germany). Before the study was conducted, the parents/caregivers gave their written consent for each child to participate in the study.
Phytochemical data analysis
Phytochemical data were analyzed using dietary food records from three non-consecutive days. Parents/caregivers completed the dietary records accompanied by their children to minimize the bias that may occur when eating outside the home (e.g., at school, playground, friends’ houses, etc.). All food and drink consumed was weighted or given as a household measure if weighting was not possible. For the school meals consumed, the type of meal and the percentage of the portion consumed were recorded so that the quantity of food and drink could be calculated using the meal recipes (given by schools to the research team). After data collection, all recipes and mixed dishes were divided into the individual foods contained in the dish, where possible. Mixed dishes that could not be itemized included, for example, fish sticks, pizza slices, purchased desserts, baked goods, cheese-filled tortellini, etc. and were considered food per se. In addition, all household units were converted to gram/milliliter units. All foods and beverages were categorized into 15 different food groups based on the dietary guidelines for school children and modified to better determine their association with the intake of selected phytochemicals (25). Daily energy intake (kcal) and the relative contribution of different food groups to the daily energy intake were analyzed using software Prehrana (Infosistem, d.d, Zagreb, Croatia). The software contained national composition tables (26) and was supplemented with the nutritional information from the food labels of the foods or the complexed dishes (e.g., pizza from bakery).
The Phenol-Explorer database was used to estimate daily polyphenol intake - total flavonoids, total phenolic acids, stilbenes, lignans and other polyphenols (11). The total daily intake of polyphenols was calculated as the sum of the estimated subclasses of polyphenols. Data were corrected with retention factors when different heat treatment methods were involved (27).
The total daily intake of carotenoids includes the assessment of the daily intake of lutein and zeaxanthin, β-carotene and lycopene. Data for β-carotene were taken from the national composition tables (26). For the foods for which no amount of carotene was given in the Croatian tables, the values were taken from the US Department of Agriculture database (10). The US Department of Agriculture database was also used to calculate the other subclasses of carotenoids. Data for all subclasses of carotenoids were corrected with retention factors when different methods of thermal processing were used (28).
Data from the study conducted by Witkowska et al. (29) were used to estimate the intake of stigmasterol, campesterol and β-sitosterol and data from the USDA databases were used for the intake of brassicasterol, ergosterol and other phytosterols (10). The daily intake of phytosterols was calculated as the sum of the estimated subclassis. Data were corrected using retention factors when different methods of thermal processing were involved (29).
The glucosionlate intake was assessed using data from Steinbrecher and Linseisen (30). Data were corrected using retention factors when different methods of thermal processing were involved (31–33). The uptake of the individual glucosinolates (glucoibervirin, glucoerucin, dehydroerucin, glucoberteroin, glucoiberin, glucoraphanin, glucoraphenin, glucoalyssin, glucoheirolin, glucoerysoline, glucocochlearin, sinigrin, gluconapin, glucobrassicanapin, progoitrin, epiprogoitrin, napoleiferin, glucotropaeolin, gluconasturtiin, sinalbin, glucobarbarin, glucobrassicin, 4-hydroxyglucobrassicin, neoglucobrassicin, 4-methoxyglucobrassicin) was summarized as the intake of aliphatic glucosinolates, indolylglucosinolates and aromatic glucosinolates. The total daily intake of glucosinolates corresponds to the sum of the three glucosinolate subclasses.
Anthropometric measurements
The anthropometric measurements, body height and body weight, were performed in accordance with the World Health Organization guidelines by trained person from the research team during physical education and health classes while children were wearing light athletic clothing. Both were measured to the nearest 0.1 cm and 0.1 kg using a combined medical digital scale and stadiometer (Seca, type 877–217, Vogel & Halke Gmbh & Co., Hamburg, Germany). Weight status were assessed using the World Health Organization cut-off for the sex-and age-standardized z-score for body mass index (kg/m2) (34, 35).
Statistical analysis
Observed individual means method was used to present daily energy and macronutrient intake (36). The normality of the data distribution was estimated using the Shapiro–Wilk test. Continuous variables (age, energy intake and polyphenol intake) were presented as mean and standard deviation or median and interquartile range, while categorical variables were presented as percentages. The relative contribution of phytochemical subclass to daily intake of four main classes of phytochemical, of food groups to daily intake of energy and four main classes of phytochemical, and of food items to daily intake of four main phytochemical classes were expressed as mean percentage. Differences between boys and girls were test using Students t-test for two independent variables or Mann-U-Whitney test. The statistical analysis was performed using IBM SPSS Statistics v. 23.0, released 2015 (IBM SPSS Statistics for Windows, Version 23.0. Armonk, NY, United States: IBM Corp.), with significance set at p < 0.05 for all analyzes.
Results
The study sample consisted of 195 children attending elementary school, of whom 52.3% were boys and 47.7% girls aged 8.9 ± 0.4 years. The majority of the children (75.9%) had a normal weight status according to the World Health Organization cut-offs for body mass index. The overall prevalence of overweight and obesity was 12.6 and 9.9%, respectively. No significant differences in weight status were found between boys and girls.
Intake of phytochemicals, divided by subclasses are shown in Table 1. No differences were found between boys and girls in the intake of carotenoids, phytosterols and glucosinolates. However, girls had a higher intake of total polyphenols (158.3 mg/day, [81.5–241.5] vs. 114.1 mg/day, [64.9–172.3]; p = 0.009), total flavonoids (93.6 mg/day, [51.0–155.1] vs. 66.7, [36.3–112.8]; p = 0.012) and total phenolic acids (42.7 mg/day, [24.6–84.7] vs. 33.5, [18.2–58.9]; p = 0.034) than the boys. Neither boys nor girls consumed stilbenes, lignans and brasicasterols. Furthermore, there were no differences between the sexes in the relative contribution of the phytochemical subclasses to the daily intake of main phytochemical classes (Figure 1).
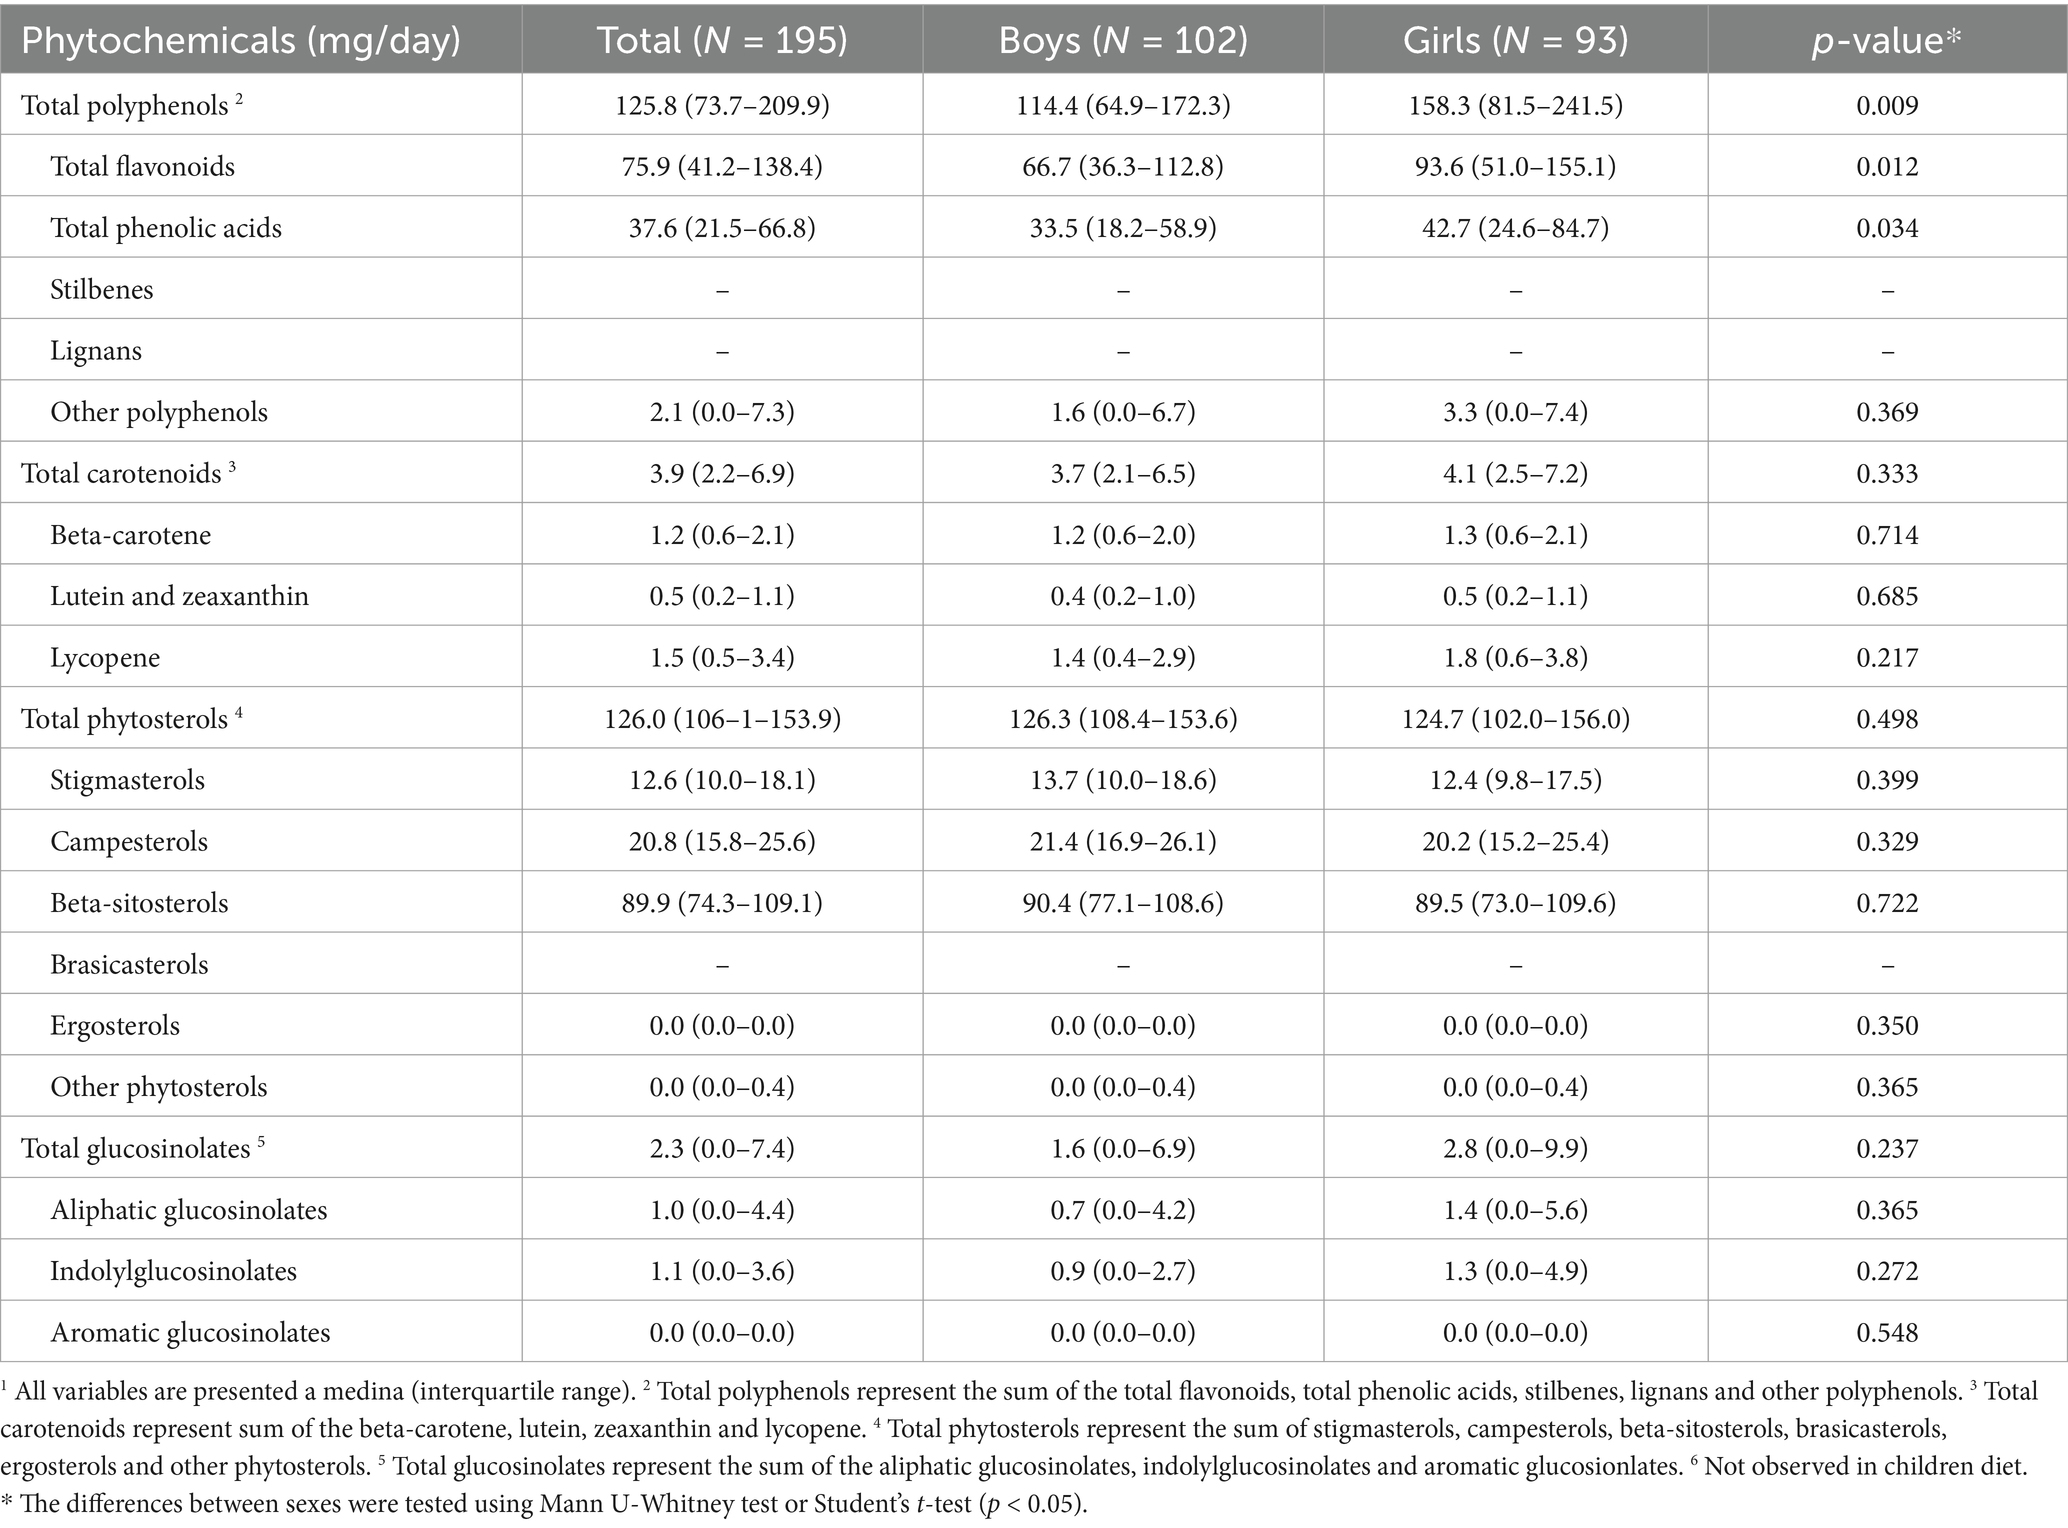
Table 1. Differences in average daily intake of phytochemicals classes and subclasses between boys and girls.1
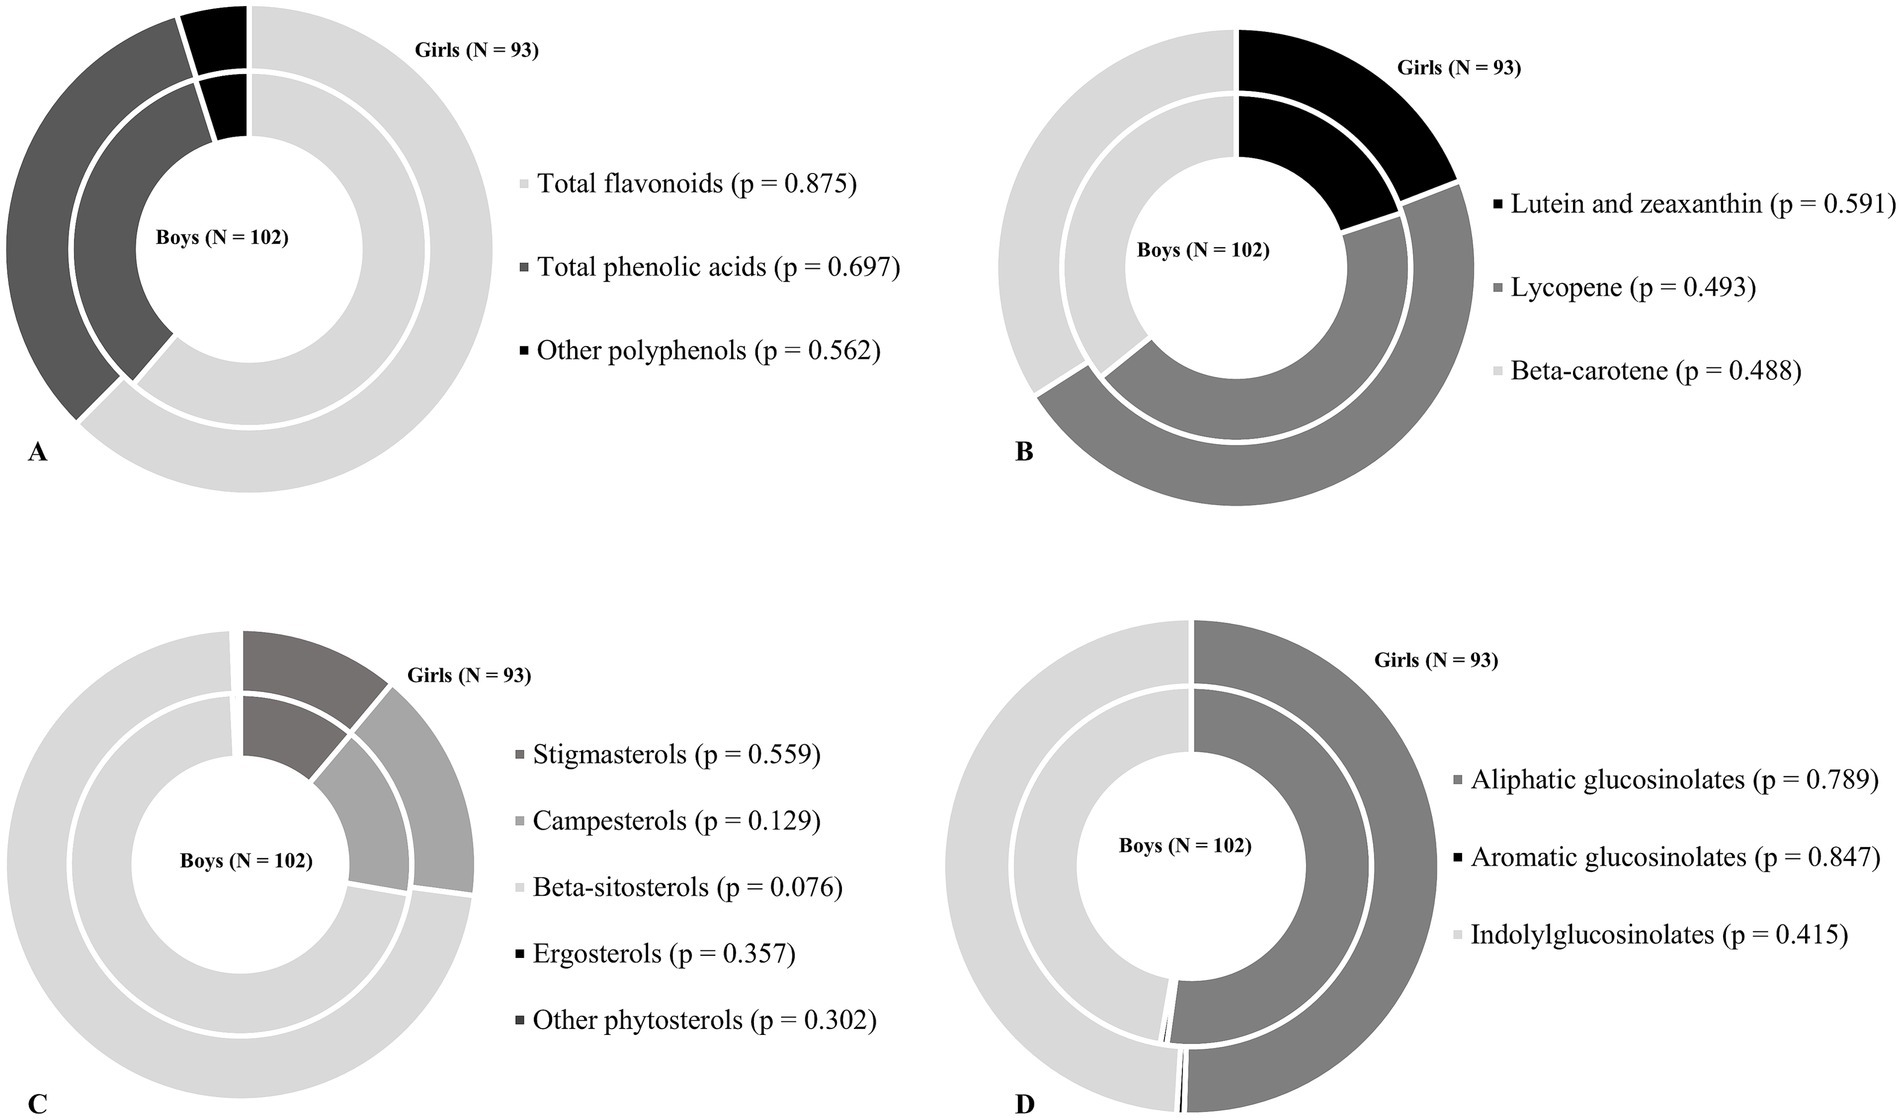
Figure 1. The relative contribution of the phytochemical subclasses to the total intake of selected phytochemicals among boys and girls. (A) Contribution to the total polyphenol intake. (B) Contribution to the total carotenoid intake. (C) Contribution to the total phytosterols intake. (D) Contribution to the total glucosinolates intake. The inner circle represents the proportion of phytocemical subclasses in the total of phytocemical in boys, while the outer circle represents the proportion of phytocemical subclasses in the total of phytocemical in girls. The differences between sexes were tested using Mann U-Whitney test or Student’s t-test (p < 0.05).
The contribution of certain food groups to the daily intake of main phytochemical classes is shown in Figure 2. As expected, for both boys and girls, more than 70% of the daily intake of polyphenols came from the consumption of fruit, followed by vegetables. Among fruit, the polyphenols came mainly from various berries, especially cherries, apples and fruit juices (100% orange juice and apple juice), while among vegetables from onions and potatoes. Vegetables (79% of total carotenoids in boy and 71% in girls) and mixed dishes (11% of total carotenoids in boys and 10% in girls) contribute the most to the daily intake of carotenoids in both sexes. It has been shown that tomatoes and tomato products as well as pizza from the mixed food group are a good source of carotenoids for children. In addition, grains, grain products, potatoes and tubers (29% of total phytosterols in boys and 26% in girls) contribute to the daily intake of phytoestrogens, followed by fats (22% of total phytosterols in boys and 24% in girls), sweets and cakes (20% of total phytosterols in boys and 19% in girls), and fruit (15% of total phytosterols in boys and 17% in girls). The most dominant food source of phytoestrogens was sunflower oil, followed by various types of wheat and wholemeal breads and rolls and chocolate products. Finally, only the vegetable group, Brassica vegetables, was found to be a source of daily intake of glucosinolates in both sexes.
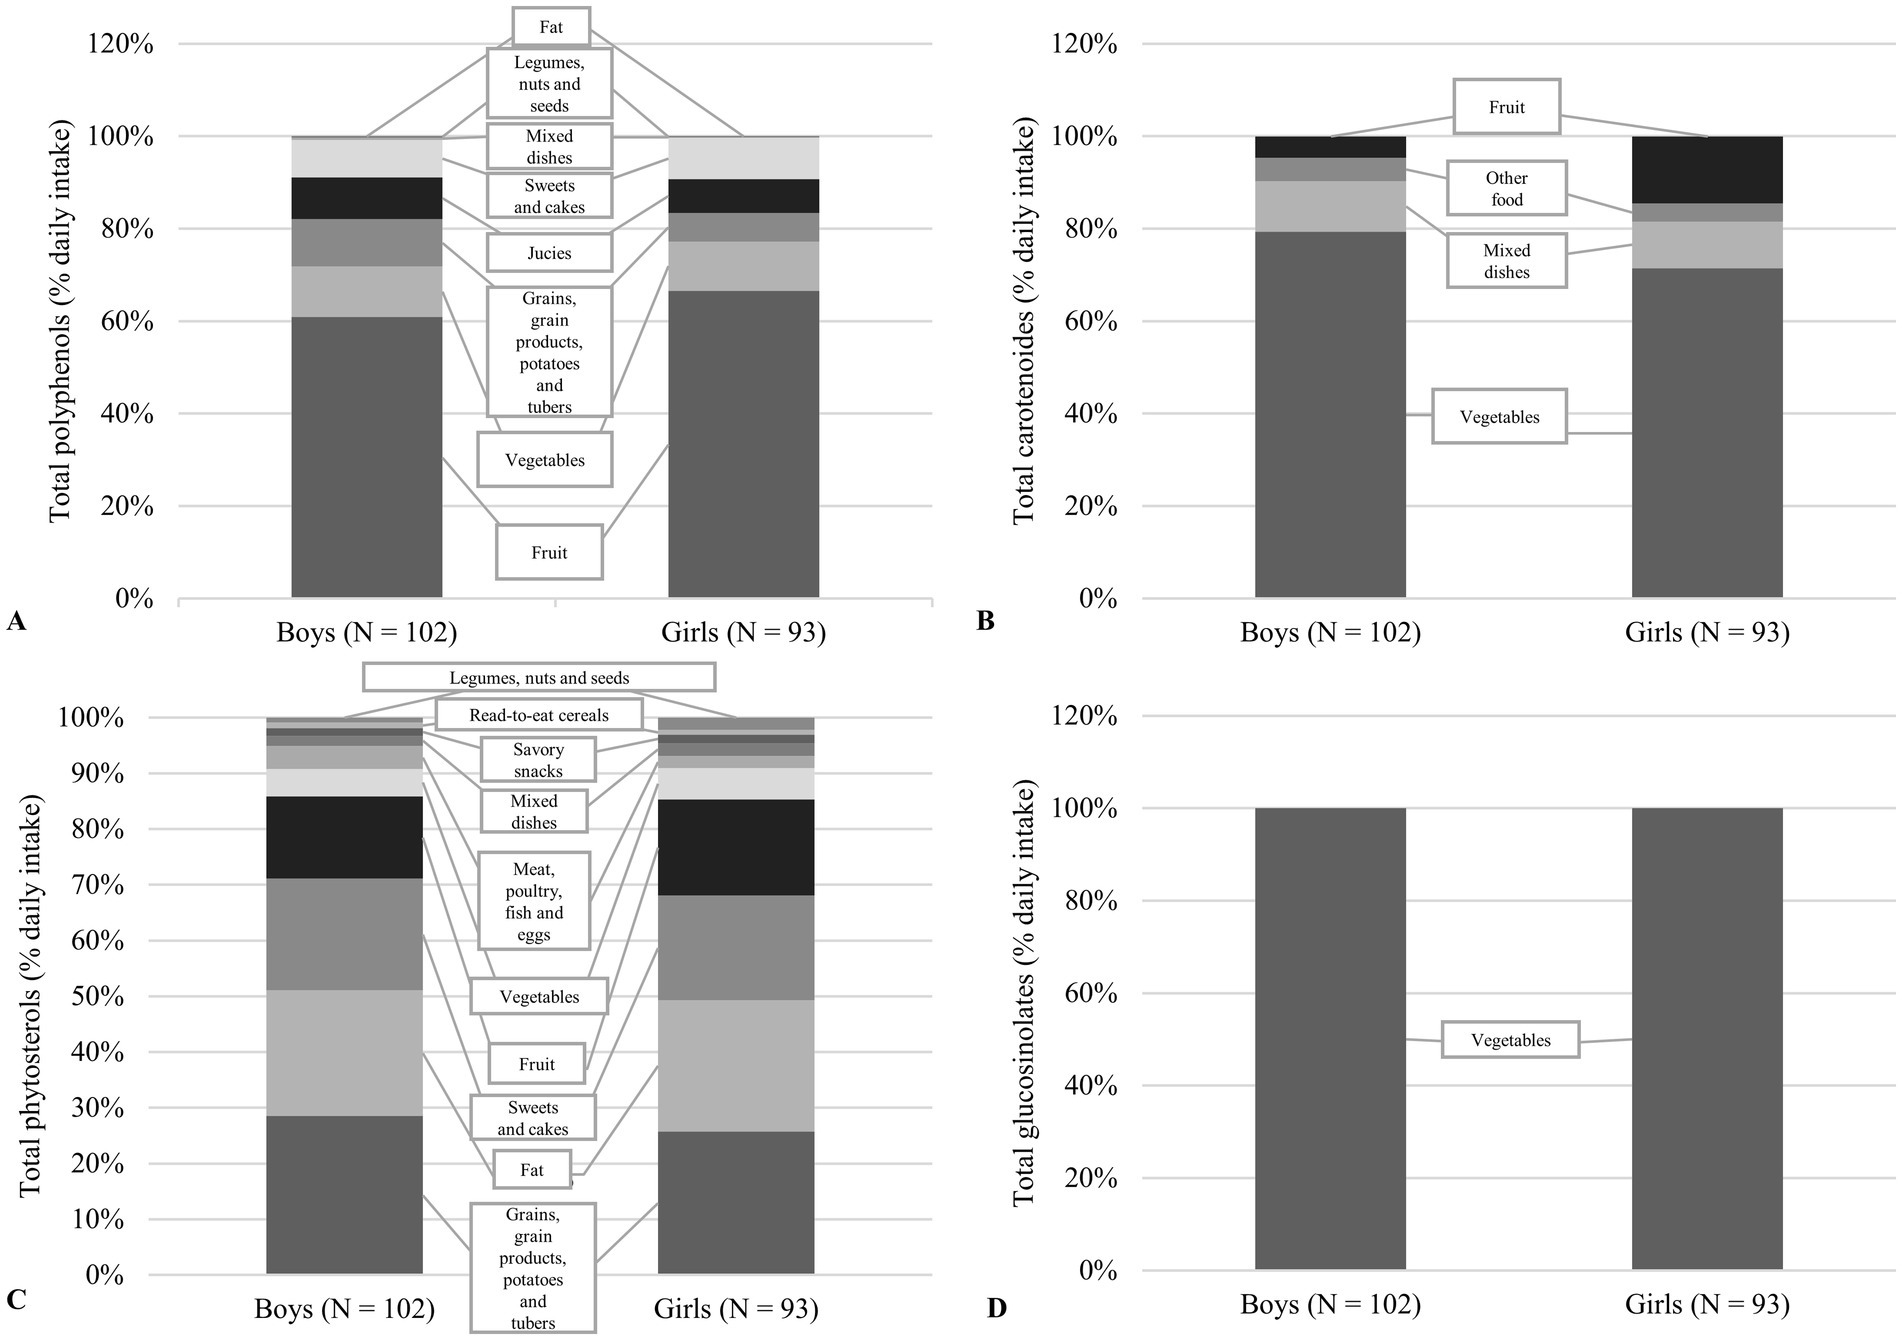
Figure 2. The relative contribution of the food groups to total intake of selected phytochemicals among boys and girls. (A) Contribution to the total polyphenol intake. (B) Contribution to the total carotenoid intake. (C) Contribution to the total phytosterols intake. (D) Contribution to the total glucosinolates intake.
Discussion
The results of the present study provide an overview of the intake of phytochemicals, i.e., the intake of polyphenols, carotenoids, phytosterols and glucosinolates in children living in the urban settings. This study provides valuable results as the intake of phytochemicals in children is rarely observed, especially the intake of phytochemicals other than polyphenols (14–22).
The intake of polyphenols is one of the most extensively studied phytochemical intake in children (14, 15, 18–20, 22). The median daily intake was 125.8 mg/day and thus below the values determined in studies from Italy (226.3 mg/day in winter; 192.3 mg/day in spring), Argentina (412 mg/day), Canada (734.1 mg/day) and Great Britain (boys: 390.1 mg/day; girls: 387.3 mg/day) (14, 19, 20, 22). Among the five polyphenol subclasses, flavonoids accounted for the largest proportion of daily intake (61%), followed by phenolic acids (33%). The relative contribution of the polyphenol subclasses varied from study to study, probably due to differences in age groups, food preferences and regional dietary patterns. For example, flavonoids accounted for up to 80% of polyphenol intake in Italian and British children, while phenolic acids dominated in Argentinian children (77%) and Canadian children had almost equal intakes of flavonoids and phenolic acids (14, 19, 20, 22). These differences may also reflect the primary food sources. In this study, fruits (especially berries and apples) and vegetables contributed the most, while intake of cocoa products was limited and tea or decaffeinated coffee was not consumed. In contrast, other studies have identified cocoa products, tea and mate as important sources of polyphenols (14, 20). In addition, the girls in this study consumed more total polyphenols, flavonoids and phenolic acids than the boys, although their overall dietary habits were similar. This could be due to food preferences, such as the higher consumption of blueberries and cocoa in girls. Similar gender differences in polyphenol intake have also been observed in other populations, often influenced by both energy intake and food choices (22). The intake of stilbenes and lignans was not assessed in the present study, similar to other studies in which their contribution to the total daily intake of polyphenols was either negligible (less than 1%) or not reported at all (14, 19, 20, 22).
Carotenoids are the most researched phytochemicals after polyphenols, as they are considered reliable biomarkers (serum and skin) for fruit and vegetable intake (37, 38), which is one of the biggest challenges for children’s nutrition in this decade (39–42). However, information on the intake of carotenoids in the population of children is lacking (18, 38, 43–46). The median daily intake of carotenoids was 3.9 mg, which consisted of β-carotene (1.2 mg), lycopene (1.5 mg), lutein and zeaxanthin (0.5 mg). In comparison, a study conducted in the USA reported higher intake of carotenoids (3.6–8.2 mg/day) in 9–12 year olds (38), while a study conducted in Spain found a lower intake of β-carotene (0.9 mg), a higher intake of lycopene (2.7 mg) and a similar intake of lutein and zeaxanthin (0.6 mg) in 7–9 year olds (47). The methods and databases used varied from study to study, which may explain the differences observed. For example, our study used dietary records for three non-consecutive days, whereas other studies used FFQ or 24-h recall (38, 47). Studies using three 24-h recall have shown significantly lower intake values compared to studies using food frequency questionnaires (44, 47). In addition, the observed differences may also be attributed to the use of different national food composition tables, although both studies included the USDA food database in addition to their national databases and other national published sources. National published sources are very important. For example, fresh tomatoes grown in three different regions of Croatia were shown to have widely varying levels of lycopene (from 1.82 to 11.19 mg/100 g) (48). Lycopene accounted for 44.7% of the total carotenoid intake. The main sources were tomato-based foods, especially school meals (e.g., stews, tomato sauces), which could explain the high lycopene intake. This is consistent with seasonal availability, as the study was conducted in late spring/summer when fresh tomatoes are more commonly consumed.
Pyhtosterols or plant sterols are structurally similar to cholesterol and intake of 1–3 g per day can lower cholesterol levels in adults and children (49, 50). However, a typical Western diet can provide between 150 and 400 mg of sterols per day (49). Dietary sources of sterols include seeds, vegetable fats and oils and nuts. As, plant sterols have a low bioavailability, a higher intake of plant sterols can be achieved by consuming fortified products or supplements (50, 51). The median daily intake was 126.0 mg, slightly lower than in the Flemish preschool children (46). The Flemish preschool children consumed an average of 175–188 mg of plant sterols per day, with the boys having a higher intake (46). In contrast to a study conducted among Flemish preschool children, which found that 21% of participants consumed plant sterol fortified foods resulting in an average intake of 0.70 g/day and a maximum intake of 2.10 g/day, none of the children in our study consumed plant sterol-fortified foods as part of their regular diet. β-sitosterols accounted for the largest proportion (>70%) of the total intake of plant sterols, primarily due to their presence in sunflower and olive oil—the main sources of fat in the children’s diet. The food groups contributing most to the total daily intake of plant sterols were cereals, cereal products, potatoes and tubers, fats and sweets and cakes. This is consistent with an earlier study of Belgian children in which similar food groups contributed the most to phytosterol intake (46).
An additional contribution of this study is the estimation of glucosinolate intake, which has not yet been investigated in children. The median daily intake of glucosinolates was 2.3 mg. In comparison, the median intake in adults in Spain was also 2.32 mg/day, but in Germany it was significantly higher (14 mg/day) (30, 52). It is noteworthy that 38.9% of children did not consume cruciferous vegetables, which are the main source of glucosinalate in our diet, during the study period. Similar observations were made in the adult population, where 20% of adults did not consume cruciferous vegetables (52). White cabbage was the main dietary source of glucosinolates and was often served in school meals as salad or stew. Other cruciferous vegetables (kale, broccoli, cauliflower and Brussels sprouts) were also consumed more frequently at school than at home. This confirms previous findings that school meals can increase the intake of dark green vegetables (53). While in adults the main sources of glucosinolates come from broccoli, cabbage, Brussels sprouts and cauliflower (30, 52), children may avoid these vegetables because of their bitter and pungent taste (54, 55). However, children’s food preferences can be modified by education, repeated exposure and preparation methods (56–61). Aliphatic glucosinolates (51.3%) and indolyl glucosinolates (48.2%) accounted for half of the total intake of glucosinaolates in the present study, whereas aromatic glucosinolates were hardly present in the diet (0.5%). The quantitatively most important glucosinolates in children were glucobrasincin, sinergin and glucoiberin.
Although there are no specific reference values for phytochemicals in the diet, the national dietary guidelines (25) aims to ensure an adequate intake of different food groups and consequently important nutrients, including phytochemicals. Despite a slightly lower energy intake compared to the recommendations, the children in this study followed a similar dietary pattern compared to other studies. The increased consumption of sweets and snacks and the lower consumption of fruit and vegetables was striking. It was found that the food groups rich in phytochemicals (fruit, vegetables, pulses, nuts and seeds) contributed less than 10% to the daily energy intake (Supplementary Figure 1).
Strengths and limitations
Although the study provides valuable results on the intake of phytochemicals in school-age children, the results should be interpreted with caution. The results of the study should not be generalized to the Croatian child population, as it included only a sample of children from urban settings. Measuring food and beverage consumption in school-aged children can be challenging as they may eat multiple meals outside the home. However, in the present study, food and beverage consumption was estimated using 3-day dietary records kept jointly by parents and children to minimize potential bias and represent strength of this study. In addition, the research team was familiar with the recipes of the school meals. The study was conducted in late spring/summer, which may affect the availability of fruits and vegetables, which can consequently affect the amount and type of phytochemicals and their dietary sources. As there is no comprehensive database for estimating the different classes of phytochemicals, with the exception of polyphenols, different sources of data on the amount of phytochemicals in food were used to ensure the accuracy and completeness of the data and the intake of phytochemicals in children. The intake of phytochemicals could also be underestimated, as no data for phytochemicals is available for some types of processed food which contribute on average 38.1% of their daily energy intake from ultra-processed foods and 15.3% from processed foods (53).
Conclusion
This study provides new insights into the quality of children’s diets with regard to the intake of phytochemicals. In addition to the intake of polyphenols, it also evaluates the intake of carotenoids, phytosterols and glucosinolates, for which there is few or no research on children’s diets. Although there is no recommendation for the intake of phytochemicals, the results of the study indicate that children have a low intake of all four classes of phytochemicals compared to existing studies on children and adults. The results suggest that the consumption of foods that are good sources of phytochemicals needs to be increased in children. In addition, it would be beneficial to increase the variety of foods available for meal preparation, both at home and at school, to achieve greater diversity in the intake of phytonutrients subclasses. Future studies in this area should focus on linking phytonutrient intake to children’s health status. They should also address the motivations that can influence increased intake, including food preferences and changes in children’s environments.
Data availability statement
The raw data supporting the conclusions of this article will be made available by the authors, without undue reservation.
Ethics statement
The studies involving humans were approved by Ethics Committee of the School of Medicine, University of Zagreb (380–59–10,106-19-11/307). In addition, Approvals for the implementation of the pilot project in primary schools were obtained from the Ethics Committee of the Institute for Medical Research and Occupational Health (no. 100–21/16–8) and the Croatian Ministry of Science and Education and the Education and Teacher Training Agency (no. 602–01/16–01/00388). The studies were conducted in accordance with the local legislation and institutional requirements. Written informed consent for participation in this study was provided by the participants’ legal guardians/next of kin.
Author contributions
MB: Conceptualization, Investigation, Methodology, Writing – original draft, Writing – review & editing. AI: Conceptualization, Data curation, Investigation, Methodology, Visualization, Writing – original draft, Writing – review & editing. PŠ: Formal analysis, Investigation, Methodology, Writing – original draft. RB: Conceptualization, Methodology, Project administration, Supervision, Writing – original draft. IC: Conceptualization, Methodology, Supervision, Writing – original draft. IR: Writing – original draft, Writing – review & editing.
Funding
The author(s) declare that financial support was received for the research and/or publication of this article. This study was supported by the European Commission-Horizon 2020 under the research project “Strengthening European Food Chain Sustainability by Quality and Procurement Policy” (Proposal Number: 678024–2 9). The work of doctoral student A.I. was supported by the Croatian Science Foundation through the project “Young researchers’ career development project-training of doctoral students” (DOK-01-2018), funded by the European Social Fund.
Acknowledgments
We gratefully acknowledge all the children and their parents for their participation in the study. We would also like to thank the teachers and school staff for their help with the data collection. In addition, we would like to thank volunteers Lucija Marić, MSc of Nutrition, and Tea Knezović, PhD student in Nutrition at the University of Zagreb Faculty of Food Technology and Biotechnology, for their help with data collection.
Conflict of interest
The authors declare that the research was conducted in the absence of any commercial or financial relationships that could be construed as a potential conflict of interest.
Generative AI statement
The authors declare that no Gen AI was used in the creation of this manuscript.
Publisher’s note
All claims expressed in this article are solely those of the authors and do not necessarily represent those of their affiliated organizations, or those of the publisher, the editors and the reviewers. Any product that may be evaluated in this article, or claim that may be made by its manufacturer, is not guaranteed or endorsed by the publisher.
Supplementary material
The Supplementary material for this article can be found online at: https://www.frontiersin.org/articles/10.3389/fnut.2025.1576803/full#supplementary-material
SUPPLEMENTARY FIGURE 1 | The relative contribution of the food groups to daily energy intake among boys and girls. The differences between sexes were tested using Mann U-Whitney test or Student t-test (p < 0.05).
References
1. Leitzmann, C. Characteristics and health benefits of phytochemicals. Complement Med Res. (2016) 23:69–74. doi: 10.1159/000444063
2. Liu, RH. Potential synergy of phytochemicals in cancer prevention: mechanism of action. J Nutr. (2004) 134:3479S–85S. doi: 10.1093/jn/134.12.3479S
3. Monjotin, N, Amiot, MJ, Fleurentin, J, Morel, JM, and Raynal, S. Clinical evidence of the benefits of phytonutrients in human healthcare. Nutrients. (2022) 14:1712. doi: 10.3390/nu14091712
4. European Food Safety Authority. Nutrient recommendations (2019). Available onloine at: https://efsa.gitlab.io/multimedia/drvs/index.htm
5. National Health and Medical Research Council. Nutrient reference values. (2017). Available at: https://www.eatforhealth.gov.au/nutrient-reference-values
6. U.S. Department of Health and Human Services. Dietary reference intakes. (2023). Available online at: https://health.gov/our-work/nutrition-physical-activity/dietary-guidelines/dietary-reference-intakes
7. World Health Organization. Diet, nutrition and the prevention of chronic diseases: report of joint WHO/FAO expert consultation. Geneva: World Health Organization (2003).
8. Dreosti, IE. Recommended dietary intake levels for phytochemicals: feasible or fanciful? Asia Pac J Clin Nutr. (2000) 9:8–11. doi: 10.1046/j.1440-6047.2000.00167.x
9. Li, Z, Forester, S, Jennings-Dobbs, E, and Heber, D. Perspective: a comprehensive evaluation of data quality in nutrient databases. Adv Nutr. (2023) 14:379–91. doi: 10.1016/j.advnut.2023.02.005
10. U.S. Department of Agriculture. FoodData Central. (2024). Available online at: https://fdc.nal.usda.gov/fdc-app.html#/?component=0
11. Neveu, V, Perez-Jimenez, J, Vos, F, Crespy, V, du Chaffaut, L, Mennen, L, et al. Phenol-explorer: an online comprehensive database on polyphenol contents in foods. Database. (2010) 2010:bap024–bap024. doi: 10.1093/database/bap024
12. Bohn, T, McDougall, GJ, Alegría, A, Alminger, M, Arrigoni, E, Aura, A, et al. Mind the gap—deficits in our knowledge of aspects impacting the bioavailability of phytochemicals and their metabolites—a position paper focusing on carotenoids and polyphenols. Mol Nutr Food Res. (2015) 59:1307–23. doi: 10.1002/mnfr.201400745
13. Liu, RH. Health-promoting components of fruits and vegetables in the diet. Adv Nutr. (2013) 4:384S–92S. doi: 10.3945/an.112.003517
14. Biancaniello, EC, Tiessen, S, Hartman, B, and Battram, DS. Dietary polyphenol intake in the Canadian population: findings from the 2015 Canadian community health survey–nutrition. Can J Public Heal. (2024) 115:315–31. doi: 10.17269/s41997-023-00845-7
15. Carnauba, RA, Hassimotto, NMA, and Lajolo, FM. Estimated dietary polyphenol intake and major food sources of the Brazilian population. Br J Nutr. (2021) 126:441–8. doi: 10.1017/S0007114520004237
16. Drossard, C, Bolzenius, K, Kunz, C, and Kersting, M. Anthocyanins in the diet of children and adolescents: intake, sources and trends. Eur J Nutr. (2013) 52:667–76. doi: 10.1007/s00394-012-0371-z
17. Johannot, L, and Somerset, SM. Age-related variations in flavonoid intake and sources in the Australian population. Public Health Nutr. (2006) 9:1045–54. doi: 10.1017/PHN2006971
18. Kopeć, A, Cieślik, E, Leszczyńska, T, Filipiak-Florkiewicz, A, Wielgos, B, Piątkowska, E, et al. Assessment of polyphenols, beta-carotene, and vitamin C intake with daily diets by primary school children. Ecol Food Nutr. (2013) 52:21–33. doi: 10.1080/03670244.2012.705766
19. Rosi, A, Mena, P, Castello, F, Del Rio, D, and Scazzina, F. Comprehensive dietary evaluation of Italian primary school children: food consumption and intake of energy, nutrients and phenolic compounds. Int J Food Sci Nutr. (2021) 72:70–81. doi: 10.1080/09637486.2020.1754768
20. Rossi, MC, Bassett, MN, and Sammán, NC. Dietary nutritional profile and phenolic compounds consumption in school children of highlands of argentine northwest. Food Chem. (2018) 238:111–6. doi: 10.1016/j.foodchem.2016.12.065
21. Wisnuwardani, RW, De Henauw, S, Androutsos, O, Forsner, M, Gottrand, F, Huybrechts, I, et al. Estimated dietary intake of polyphenols in European adolescents: the HELENA study. Eur J Nutr. (2019) 58:2345–63. doi: 10.1007/s00394-018-1787-x
22. Ziauddeen, N, Rosi, A, Del Rio, D, Amoutzopoulos, B, Nicholson, S, Page, P, et al. Dietary intake of (poly) phenols in children and adults: cross-sectional analysis of UK National Diet and nutrition survey rolling Programme (2008–2014). Eur J Nutr. (2019) 58:3183–98. doi: 10.1007/s00394-018-1862-3
23. Kim, K, Madore, MP, and Chun, OK. Changes in intake and major food sources of carotenoids among U.S. adults between 2009–2018. Meta. (2023) 14:13. doi: 10.3390/metabo14010013
24. Ilić, A, Rumbak, I, Brečić, R, Barić, IC, and Bituh, M. Increasing fruit and vegetable intake of primary school children in a quasi-randomized trial: evaluation of the three-year school-based multicomponent intervention. Nutrients. (2022) 14:4197. doi: 10.3390/nu14194197
25. Capak, K, Colić Barić, I, Musić Milanović, S, Petrović, G, Pucarin-Cvetković, J, Jureša, V, et al. Nacionalne smjernice za prehranu učenika u osnovnim školama. Zagreb: Ministarstvo zdravlja Republike Hrvatske (2013).
26. Kaić-Rak, A, and Antonić, K. Tablice o sastavu namirnica i pića. Zagreb: Zavod za zaštitu zdravlja SR Hrvatske (1990).
27. Rothwell, JA, Perez-Jimenez, J, Neveu, V, Medina-Remon, A, M’Hiri, N, Garcia-Lobato, P, et al. Phenol-explorer 3.0: a major update of the phenol-explorer database to incorporate data on the effects of food processing on polyphenol content. Database. (2013) 2013:bat070–09. doi: 10.1093/database/bat070
28. U.S. Department of Agriculture. Table of nutrient retention factors (releas 6). U.S. Department of Agriculture (2007). Available onilne at: https://www.ars.usda.gov/ARSUserFiles/80400530/pdf/retn06.pdf
29. Witkowska, AM, Waśkiewicz, A, Zujko, ME, Mirończuk-Chodakowska, I, Cicha-Mikołajczyk, A, and Drygas, W. Assessment of plant sterols in the diet of adult polish population with the use of a newly developed database. Nutrients. (2021) 13:2722. doi: 10.3390/nu1308272224
30. Steinbrecher, A, and Linseisen, J. Dietary intake of individual glucosinolates in participants of the EPIC-Heidelberg cohort study. Ann Nutr Metab. (2009) 54:87–96. doi: 10.1159/000209266
31. Baenas, N, Marhuenda, J, García-Viguera, C, Zafrilla, P, and Moreno, D. Influence of cooking methods on glucosinolates and isothiocyanates content in novel cruciferous foods. Food Secur. (2019) 8:257. doi: 10.3390/foods8070257
32. Korus, A, Słupski, J, Gębczyński, P, and Banaś, A. Effect of preliminary processing and method of preservation on the content of glucosinolates in kale (Brassica oleracea L. var. acephala) leaves. LWT-food. Sci Technol. (2014) 59:1003–8. doi: 10.1016/j.lwt.2014.06.030
33. Possenti, M, Baima, S, Raffo, A, Durazzo, A, Giusti, AM, and Natella, F. “Glucosinolates in food” In: K. Mérillon and JM. Ramawat, editors. Reference series in phytochemistry. Springer, Cham. (2017). 87–132. doi: 10.1007/978-3-319-25462-3_4
34. Blössner, M, Siyam, A, Borghi, E, Onyago, A, and de Onis, M. WHO Anthro plus for personal computers manual: software for assessing growth of the world’s children and adolescents. Geneva, Switzerland: World Health Organization (2009).
35. World Health Organization. WHO child growth standards: length/height-for-age, weight-for-age, weight-for-length, weight-for-height and body mass index-for-age: Methods and development. Geneva: World Health Organization (2006). Availabler online at: https://www.who.int/publications/i/item/924154693x
36. van Klaveren, JD, Goedhart, PW, Wapperom, D, and van der Voet, H. A European tool for usual intake distribution estimation in relation to data collection by EFSA. EFSA Support Publ. (2012) 9:EN-300, 42 pp. doi: 10.2903/sp.efsa.2012.EN-300
37. Aguilar, SS, Wengreen, HJ, Lefevre, M, Madden, GJ, and Gast, J. Skin carotenoids: a biomarker of fruit and vegetable intake in children. J Acad Nutr Diet. (2014) 114:1174–80. doi: 10.1016/j.jand.2014.04.026
38. Nguyen, LM, Scherr, RE, Linnell, JD, Ermakov, IV, Gellermann, W, Jahns, L, et al. Evaluating the relationship between plasma and skin carotenoids and reported dietary intake in elementary school children to assess fruit and vegetable intake. Arch Biochem Biophys. (2015) 572:73–80. doi: 10.1016/j.abb.2015.02.015
39. Al-Jawaldeh, A, Taktouk, M, and Nasreddine, L. Food consumption patterns and nutrient intakes of children and adolescents in the eastern Mediterranean region: a call for policy action. Nutrients. (2020) 12:3345. doi: 10.3390/nu12113345
40. Mihrshahi, S, Myton, R, Partridge, SR, Esdaile, E, Hardy, LL, and Gale, J. Sustained low consumption of fruit and vegetables in Australian children: findings from the Australian National Health Surveys. Heal Promot J Aust. (2019) 30:83–7. doi: 10.1002/hpja.201
41. Wambogo, EA, Ansai, N, Ahluwalia, N, and Ogden, CL. Fruit and vegetable consumption among children and adolescents in the United States, 2015–2018. (2020). Available online at: https://www.cdc.gov/nchs/data/databriefs/db391-H.pdf
42. World Health Organization. WHO European childhood obesity surveillance initiative: overweight and obesity among 6-9-year-old children. Report of the thir round of data collection 2012–2013. Copenhagen: WHO Regional Office for Europe (2018).
43. Medin, AC, Carlsen, MH, and Andersen, LF. Associations between reported intakes of carotenoid-rich foods and concentrations of carotenoids in plasma: a validation study of a web-based food recall for children and adolescents. Public Health Nutr. (2016) 19:3265–75. doi: 10.1017/S1368980016001622
44. Mulder, KA, Innis, SM, Rasmussen, BF, Wu, BT, Richardson, KJ, and Hasman, D. Plasma lutein concentrations are related to dietary intake, but unrelated to dietary saturated fat or cognition in young children. J Nutr Sci. (2014) 3:e11. doi: 10.1017/jns.2014.10
45. Prasad, M, Takkinen, H-M, Uusitalo, L, Tapanainen, H, Ovaskainen, M-L, Alfthan, G, et al. Carotenoid intake and serum concentration in young Finnish children and their relation with fruit and vegetable consumption. Nutrients. (2018) 10:1533. doi: 10.3390/nu10101533
46. Sioen, I, Matthys, C, Huybrechts, I, Van Camp, J, and De Henauw, S. Consumption of plant sterols in Belgium: estimated intakes and sources of naturally occurring plant sterols and β-carotene. Br J Nutr. (2011) 105:960–6. doi: 10.1017/S0007114510004587
47. Vioque, J, Garcia-de-la-Hera, M, Gonzalez-Palacios, S, Torres-Collado, L, Notario-Barandiaran, L, Oncina-Canovas, A, et al. Reproducibility and validity of a short food frequency questionnaire for dietary assessment in children aged 7–9 years in Spain. Nutrients. (2019) 11:933. doi: 10.3390/nu11040933
48. Marković, K, Hruškar, M, and Vahčić, N. Lycopene content of tomato products and their contribution to the lycopene intake of Croatians. Nutr Res. (2006) 26:556–60. doi: 10.1016/j.nutres.2006.09.010
49. European Food Safety Authority. Consumption of Food and Beverage with Added Plant Sterols in the Europian Union. The EFSA Journal. (2008) 133, 1–21. doi: 10.2903/j.efsa.2008.133r
50. Pederiva, C, Biasucci, G, Banderali, G, and Capra, ME. Plant sterols and stanols for pediatric patients with increased cardiovascular risk. Children. (2024) 11:129. doi: 10.3390/children11010129
51. Scolaro, B, Andrade, LFS, and Castro, IA. Cardiovascular disease prevention: the earlier the better? A review of plant sterol metabolism and implications of childhood supplementation. Int J Mol Sci. (2019) 21:128. doi: 10.3390/ijms21010128
52. Agudo, A, Ibáñez, R, Amiano, P, Ardanaz, E, Barricarte, A, Berenguer, A, et al. Consumption of cruciferous vegetables and glucosinolates in a Spanish adult population. Eur J Clin Nutr. (2008) 62:324–31. doi: 10.1038/sj.ejcn.1602750
53. Ilić, A, Rumbak, I, Marić, L, Karlović, T, Brečić, R, Colić Barić, I, et al. The proportion of differently processed foods in the diet of Croatian school-aged children and its impact on daily energy and nutrient intake. Croat J food Sci Technol. (2022) 14:129–40. doi: 10.17508/CJFST.2022.14.1.15
54. Estay, K, Pan, S, Zhong, F, Capitaine, C, and Guinard, J-X. A cross-cultural analysis of children’s vegetable preferences. Appetite. (2019) 142:104346. doi: 10.1016/j.appet.2019.104346
55. Zeinstra, GG, Koelen, MA, Kok, FJ, and de Graaf, C. Cognitive development and children’s perceptions of fruit and vegetables; a qualitative study. Int J Behav Nutr Phys Act. (2007) 4:30. doi: 10.1186/1479-5868-4-30
56. Askelson, NM, Brady, P, Ryan, G, Scheidel, C, Delger, P, Nguyen, P, et al. Implementation and outcome evaluation of a team nutrition intervention: increasing knowledge, attitudes, and preferences. Health Educ Res. (2021) 36:75–86. doi: 10.1093/her/cyaa036
57. Ehrenberg, S, Leone, LA, Sharpe, B, Reardon, K, and Anzman-Frasca, S. Using repeated exposure through hands-on cooking to increase children’s preferences for fruits and vegetables. Appetite. (2019) 142:104347. doi: 10.1016/j.appet.2019.104347
58. Ilić, A, Rumbak, I, Brečić, R, Colić Barić, I, and Bituh, M. Three-year school-based multicomponent intervention may change fruit and vegetable preferences in primary school children—a quasi-randomized trial. Nutrients. (2023) 15:3505. doi: 10.3390/nu15163505
59. Melnick, EM, Bergling, E, Pendleton, D, Scarbro, S, Atwood, J, and Puma, JE. Outcomes of a multi-component school-based nutrition program. J Sch Health. (2022) 92:167–76. doi: 10.1111/josh.13117
60. Saha, S, Dawson, J, Murimi, M, Dodd, S, and Oldewage-Theron, W. Effects of a nutrition education intervention on fruit and vegetable consumption-related dietary behavioural factors among elementary school children. Health Educ J. (2020) 79:963–73. doi: 10.1177/0017896920944421
Keywords: carotenoids, childhood, glucosinolates, phytonutrients, phytosterols, polyphenols
Citation: Bituh M, Ilić A, Škorvaga P, Brečić R, Colić Barić I and Rumbak I (2025) Sex-related differences in dietary phytochemical intake in the population of primary school children in urban setting. Front. Nutr. 12:1576803. doi: 10.3389/fnut.2025.1576803
Edited by:
Linyi Li, Capital Medical University, ChinaReviewed by:
Surendra S. Agrawal, Datta Meghe Institute of Higher Education and Research, IndiaWeichunbai Zhang, China National Center for Food Safety Risk Assessment, China
Copyright © 2025 Bituh, Ilić, Škorvaga, Brečić, Colić Barić and Rumbak. This is an open-access article distributed under the terms of the Creative Commons Attribution License (CC BY). The use, distribution or reproduction in other forums is permitted, provided the original author(s) and the copyright owner(s) are credited and that the original publication in this journal is cited, in accordance with accepted academic practice. No use, distribution or reproduction is permitted which does not comply with these terms.
*Correspondence: Ana Ilić, YW5hLmlsaWNAcGJmLnVuaXpnLmhy