 Xin Cai
 Shaoqin Zhang1†
 Jiajun Liu
 Qingwan Yang
- 1The First People's Hospital of Guiyang, Guiyang, China
- 2The Second Clinical Medical College of Guizhou University of Traditional Chinese Medicine, Guiyang, China
Background: Hyperuricemia (HUA) is a common metabolic disorder, yet the impact of diet and gut microbiota on uric acid metabolism remains insufficiently understood. This study aims to investigate the relationship between the dietary index for gut microbiota (DI-GM) and HUA using data from the National Health and Nutrition Examination Survey (NHANES).
Methods: This study employed NHANES data gathered from 2007 to 2020, encompassing 25,899 adults aged 18 years and older. The DI-GM, which spans from 0 to 14, was calculated based on dietary recall information. The diagnosis of HUA was established through laboratory findings. To examine the relationship between DI-GM and HUA, multivariable logistic regression was utilized, accounting for pertinent confounding variables.
Results: Upon adjusting for possible confounding variables, an elevated DI-GM score demonstrated a notable correlation with a reduced likelihood of HUA [odds ratio (OR) = 0.968, 95% confidence interval (CI) = 0.949–0.987, p = 0.005]. Subjects exhibiting a DI-GM score of ≥6 demonstrated a markedly reduced risk of HUA in contrast to those scoring between 0 and 3 (OR = 0.897, 95% CI = 0.821–0.980, p = 0.016).
Conclusion: A higher DI-GM score is inversely related to the risk of HUA.
1 Introduction
Hyperuricemia (HUA) is a metabolic disorder that manifests through disruptions in purine metabolism, leading to increased serum uric acid (UA) concentrations. The worldwide occurrence of HUA has been on the rise, primarily influenced by shifts in lifestyle and dietary habits. From 1990 to 2021, the global incidence of gout escalated from 93.097 to 109.075 per 100,000 individuals, respectively (1). In China, the prevalence of HUA among males is noted to be 21.5% (2). HUA is not only the principal factor contributing to gout but is also linked to chronic kidney disease (CKD) (3), cardiovascular adverse events (4), and metabolic syndrome (5), highlighting its significance as a public health issue on a global scale.
Growing evidence highlights the important role of diet in the development and management of HUA (6). Meta-analyses and population-based studies have demonstrated that high consumption of red meat, seafood, alcohol, and fructose is positively associated with elevated serum UA levels and an increased risk of HUA (7–9). In contrast, intake of dairy products, soy foods, vegetables, and coffee has been linked to lower UA concentrations (7). Additionally, recent studies have reported that pro-inflammatory diets and ultra-processed food consumption may adversely affect UA metabolism (10, 11), whereas healthier dietary patterns, such as the Dietary Approaches to Stop Hypertension and Mediterranean diets, are associated with reduced serum UA levels and a lower likelihood of HUA (12–14). These findings support a shift from nutrient-specific evaluations toward holistic assessments of overall dietary patterns. Moreover, emerging evidence suggests that some of the health effects of diet may be mediated through its influence on the gut microbiota (15), underscoring the potential value of incorporating microbiota-related dietary indices into future HUA research.
Recent advances in nutritional science have increasingly highlighted the gut microbiota as a key mediator of dietary effects on human health (16). Accumulating evidence suggests that long-term dietary patterns play a critical role in shaping the structure and function of the gut microbiome (17). Diets rich in fiber, polyphenols, and unsaturated fats are associated with greater microbial diversity and increased abundance of beneficial taxa, whereas high-fat, high-sugar, and ultra-processed diets are linked to dysbiosis and metabolic disturbances (15, 18). Emerging research also indicates that alterations in gut microbiota may influence UA metabolism through pathways involving purine degradation, microbial metabolite production, and UA excretion (19–22). In this context, the dietary index for gut microbiota (DI-GM) has been developed to assess the microbiota-related quality of diet by incorporating components known to affect gut microbial composition (23). DI-GM has shown consistent inverse associations with several chronic conditions, including stroke, diabetes, and fatty liver disease (24–26). However, its association with HUA has not yet been investigated. Given the increasing interest in microbiota-oriented dietary strategies, exploring this relationship may offer epidemiological insights into the dietary determinants of HUA.
This study aimed to investigate whether the DI-GM is independently associated with HUA, based on data from the National Health and Nutrition Examination Survey (NHANES). The findings may help clarify the potential role of microbiota-related dietary patterns in the development or management of HUA.
2 Methods
2.1 Data source
The NHANES dataset, which spans 2007–2020 and is accessible to the public, was the source of the data in this investigation. The NHANES is a cross-sectional study that uses a multi-stage probability sampling method to evaluate the nutritional and health status of the American people. A participants gave their written informed consent.
The research concentrated on individuals who are 18 years of age and above. Individuals who fulfilled any of the subsequent criteria were omitted from the study: (1) persons younger than 18 years of age (n = 26,722); (2) participants with incomplete DI-GM data (n = 4,789); (3) individuals with missing UA levels (n = 2,002); and (4) those without covariate data (n = 6,736). The process for selecting participants is depicted in Figure 1.
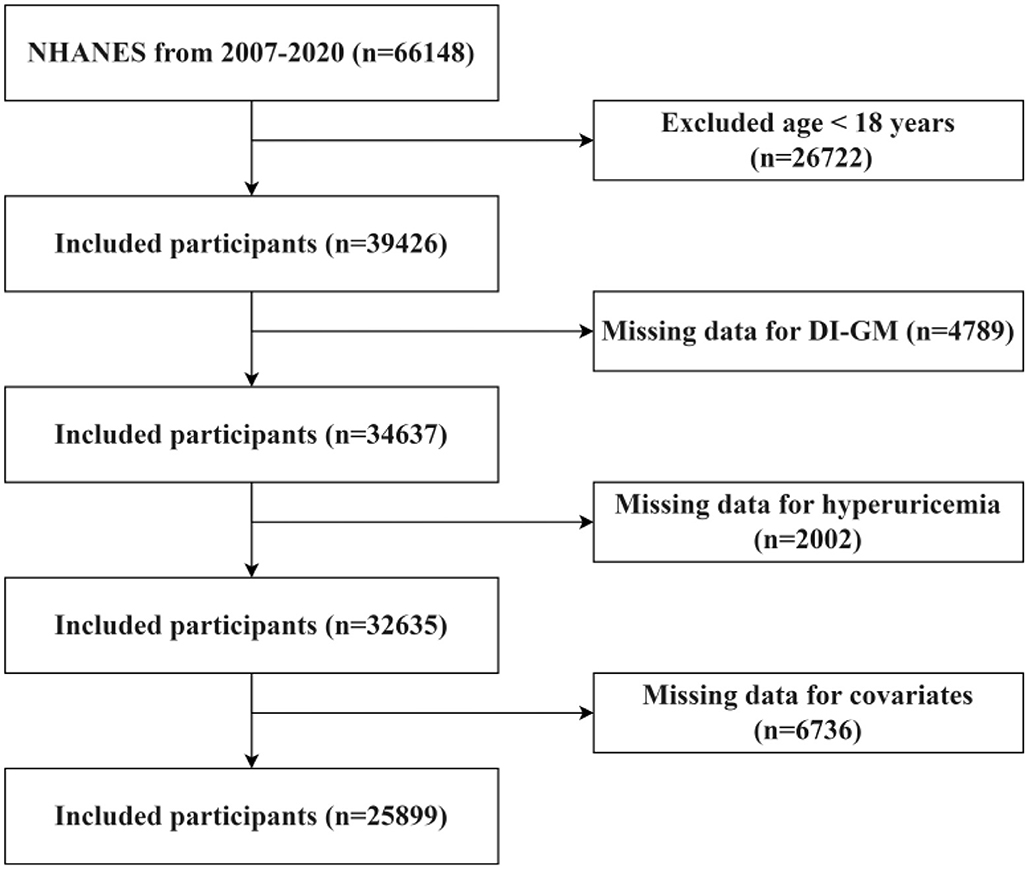
Figure 1. Flowchart of participant screening in NHANES from 2007 to 2020.
2.2 Study subjects
The study subjects were adults aged 18 years or older who had completed dietary surveys and UA tests. Exclusion criteria were individuals with missing or incomplete data.
2.3 DI-GM scoring criteria
Based on the DI-GM scoring criteria (23), the impact of 14 foods or nutrients on the GM was evaluated, including dietary fiber, polyphenols, high-fat foods, and processed meats. A score of 1 was assigned for positively scored foods if the daily intake exceeded the recommended amount, and a score of 0 was assigned otherwise. The total DI-GM score ranged from 0 to 14, with higher scores indicating a more beneficial impact of the diet on the GM.
2.4 Definition of HUA
HUA was diagnosed in males as a fasting serum UA level >7.0 mg/dl (420 μmol/L) and in females as >6.0 mg/dl (360 μmol/L) (27, 28).
2.5 Covariates
Covariates considered in this study, based on existing literature, included: (1) demographic factors such as age and poverty-income ratio (PIR); (2) lifestyle factors like smoking, alcohol consumption, and BMI; and (3) comorbid conditions, including hypertension, diabetes, hyperlipidemia, and CKD.
2.6 Statistical analysis
Participants were classified into four distinct quartiles according to their DI-GM scores: Q1 (0–3), Q2 (4), Q3 (5), and Q4 (≥6). Data were expressed as means ± standard deviations (SD). Comparative analyses of quartiles were performed utilizing analysis of variance (ANOVA) or the Kruskal-Wallis test for continuous variables, alongside the chi-square test for categorical variables. Logistic regression analysis was utilized to evaluate the relationship between DI-GM and HUA, employing odds ratio (OR) and 95% CI to quantify the association. Three distinct models underwent evaluation: Model 1, which remained unadjusted; Model 2, which incorporated adjustments for age, gender, race, education level, marital status, and poverty income ratio (PIR); and Model 3, which included adjustments for smoking, alcohol consumption, body mass index, hypertension, diabetes, hyperlipidemia, and CKD, alongside the variables accounted for in Model 2. The sensitivity analyses encompassed subgroup analysis, interaction tests, and restricted cubic spline (RCS) analysis. All statistical analyses were conducted utilizing R version 4.3.3, establishing a significance threshold at p < 0.05.
3 Results
3.1 Basic characteristics of the study population
A total of 66,148 participants were initially registered between 2007 and 2010, with 25,899 individuals matching the inclusion criteria for the final study sample. Participants were sorted into four DI-GM score quartiles. Significant differences were seen in age, gender, education level, marital status, PIR, smoking, alcohol intake, BMI, and diabetes across the quartiles. The baseline characteristics of the individuals are summarized in Table 1.
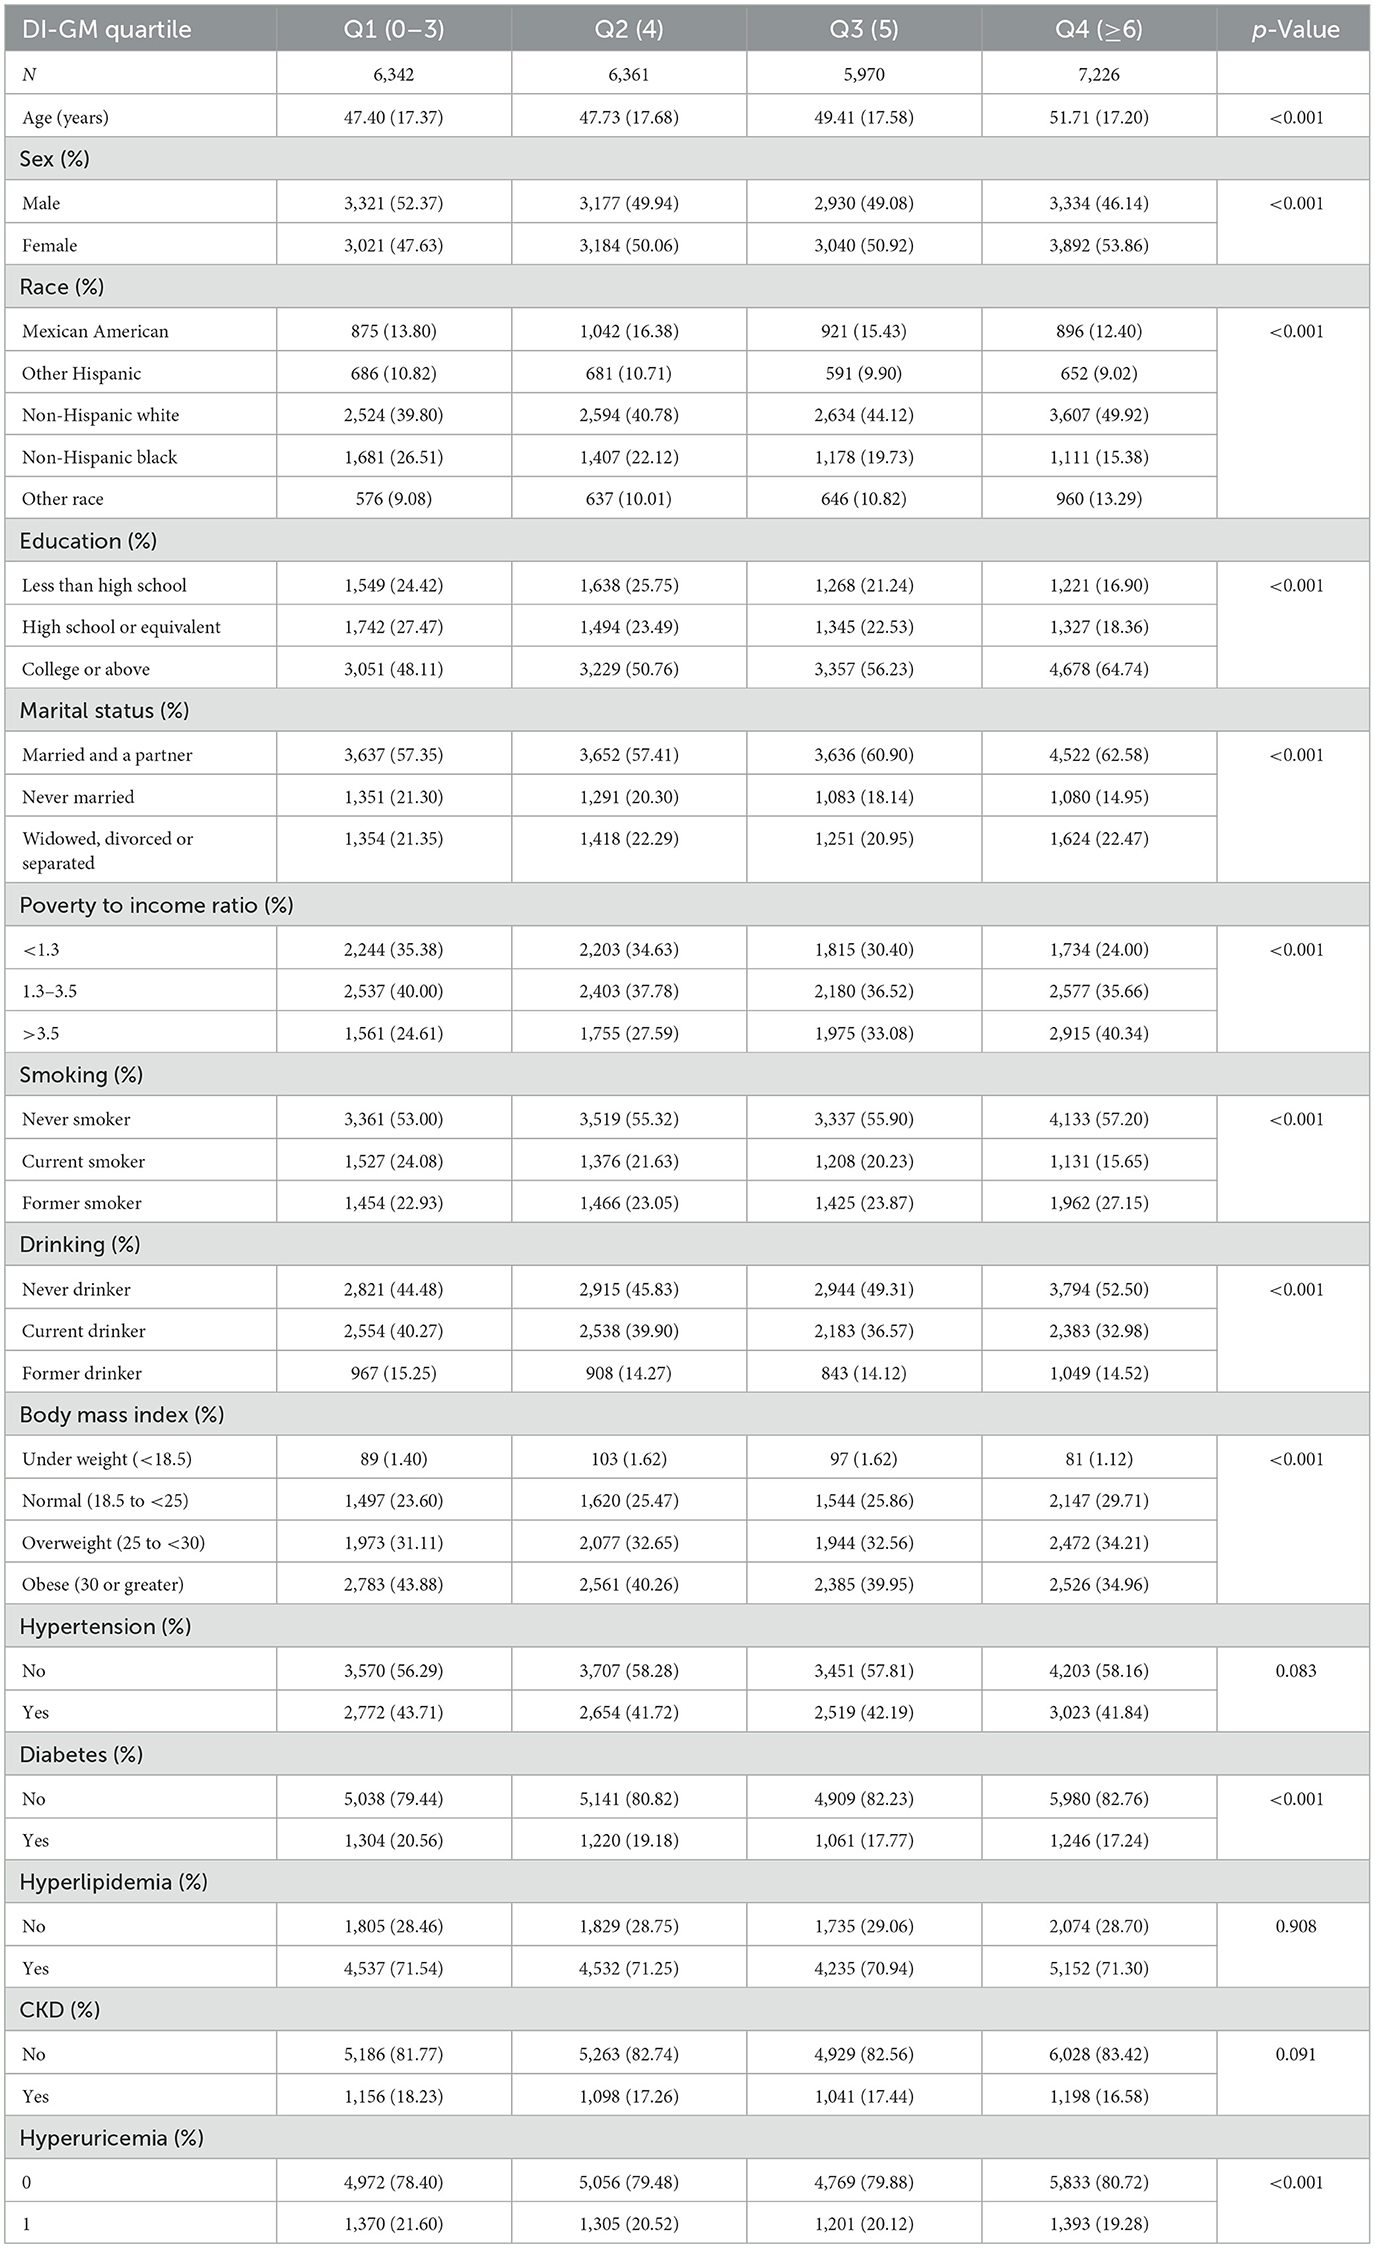
Table 1. Basic characteristics of the participants.
3.2 Relationship between DI-GM scores and UA levels
As shown in Table 2, multivariate logistic regression analysis revealed a significant inverse association between higher DI-GM scores and the likelihood of HUA. In the unadjusted model, each unit increase in the DI-GM score corresponded to a 3.9% reduction in the risk of HUA (OR = 0.961, 95% CI = 0.943–0.979, p < 0.001). The association strengthened further in Model I, which adjusted for confounding variables (OR = 0.954, 95% CI = 0.935–0.972, p < 0.001). In Model II, the negative correlation remained consistent (OR = 0.968, 95% CI = 0.949–0.987, p = 0.005). Notably, the risk of HUA was lower in the Q4 group (OR = 0.897, 95% CI = 0.821–0.980, p = 0.016). RCS analysis (Figure 2) further illustrated a linear negative relationship between DI-GM scores and HUA risk.
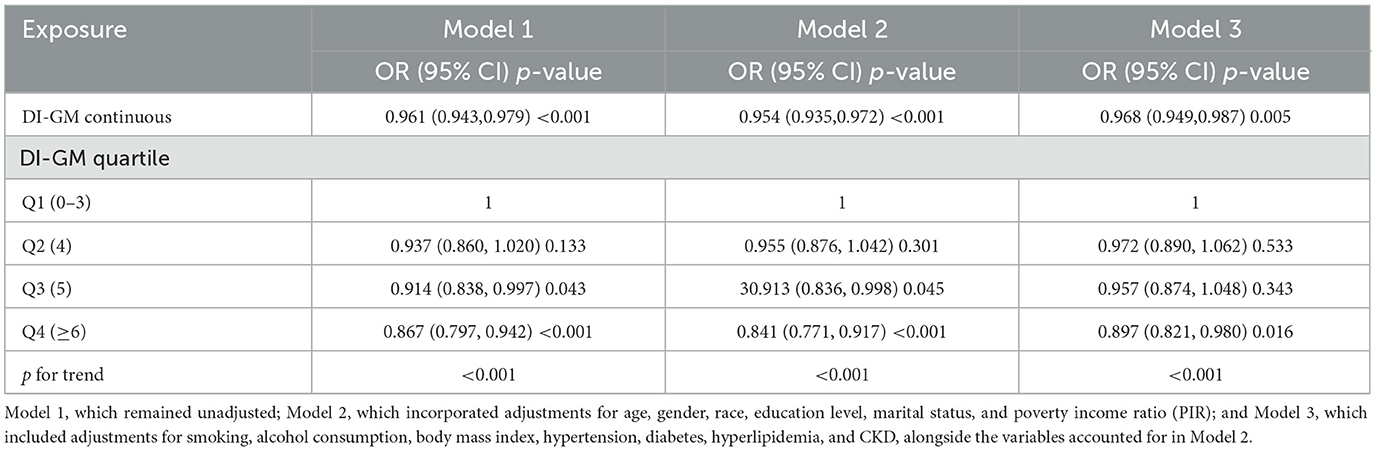
Table 2. Association between DI-GM and HUA by logistic regression.
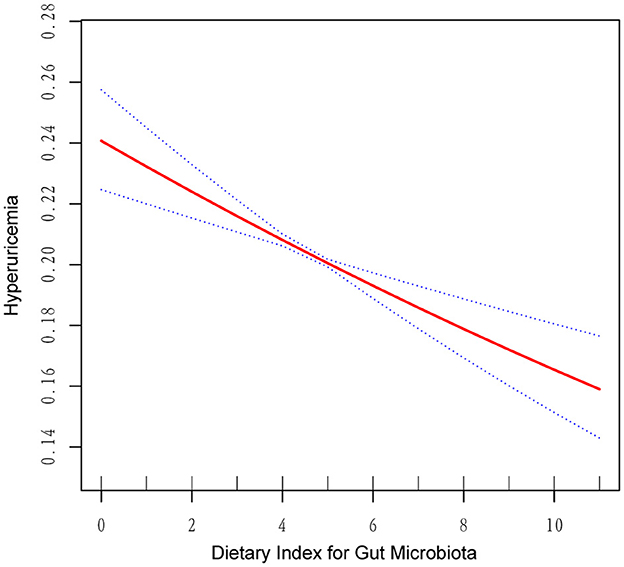
Figure 2. RCS plot of the association between DI-GM and HUA.
In the fully adjusted model (Table 3), several components categorized as beneficial to gut microbiota demonstrated statistically significant inverse associations with hyperuricemia. Specifically, higher intakes of fiber (OR = 0.751, 95% CI = 0.705–0.801), whole grains (OR = 0.827, 95% CI = 0.770–0.889), fermented dairy (OR = 0.900, 95% CI = 0.843–0.961), avocado (OR = 0.786, 95% CI = 0.640–0.965), cranberry (OR = 0.838, 95% CI = 0.728–0.964), chickpea (OR = 0.611, 95% CI = 0.425–0.877), and coffee (OR = 0.920, 95% CI = 0.857–0.988) were all associated with a lower risk of hyperuricemia. Conversely, no significant associations were observed for soybean, broccoli, or green tea, nor for any components classified as unfavorable to gut microbiota.
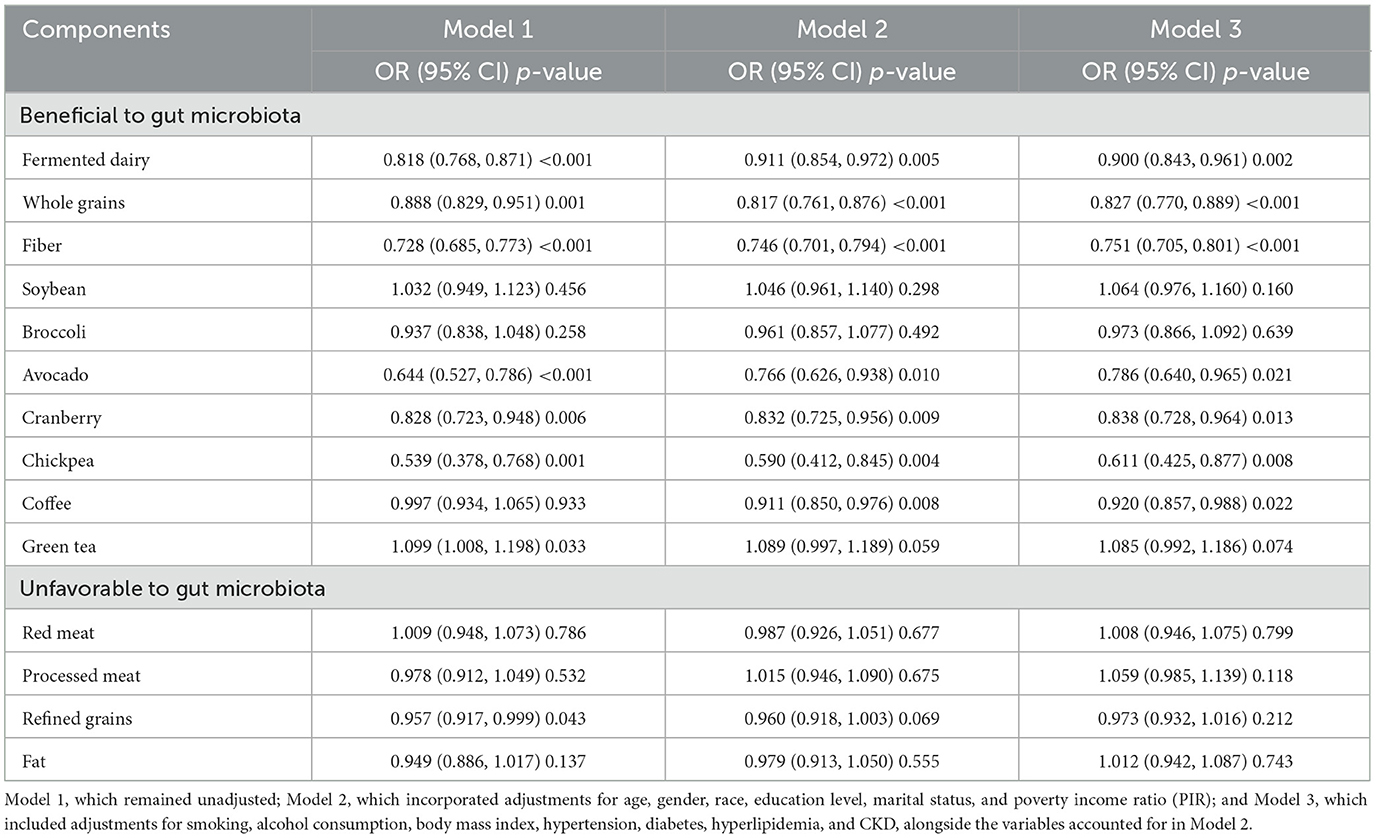
Table 3. Relationship between DI-GM components and HUA.
3.3 Subgroup analysis and interaction test between DI-GM and HUA
Participants were stratified by various characteristics. As shown in Table 4, the relationship between DI-GM and HUA differed significantly across categories, indicating that factors such as age (excluding 40–59 years), education level (college or above), marital status (excluding Never married), PIR (excluding < 1.3), and CKD all significantly influenced the negative correlation. The interaction test showed that the effect of DI-GM on HUA varied by smoking history and the presence of diabetes (interaction p < 0.05).
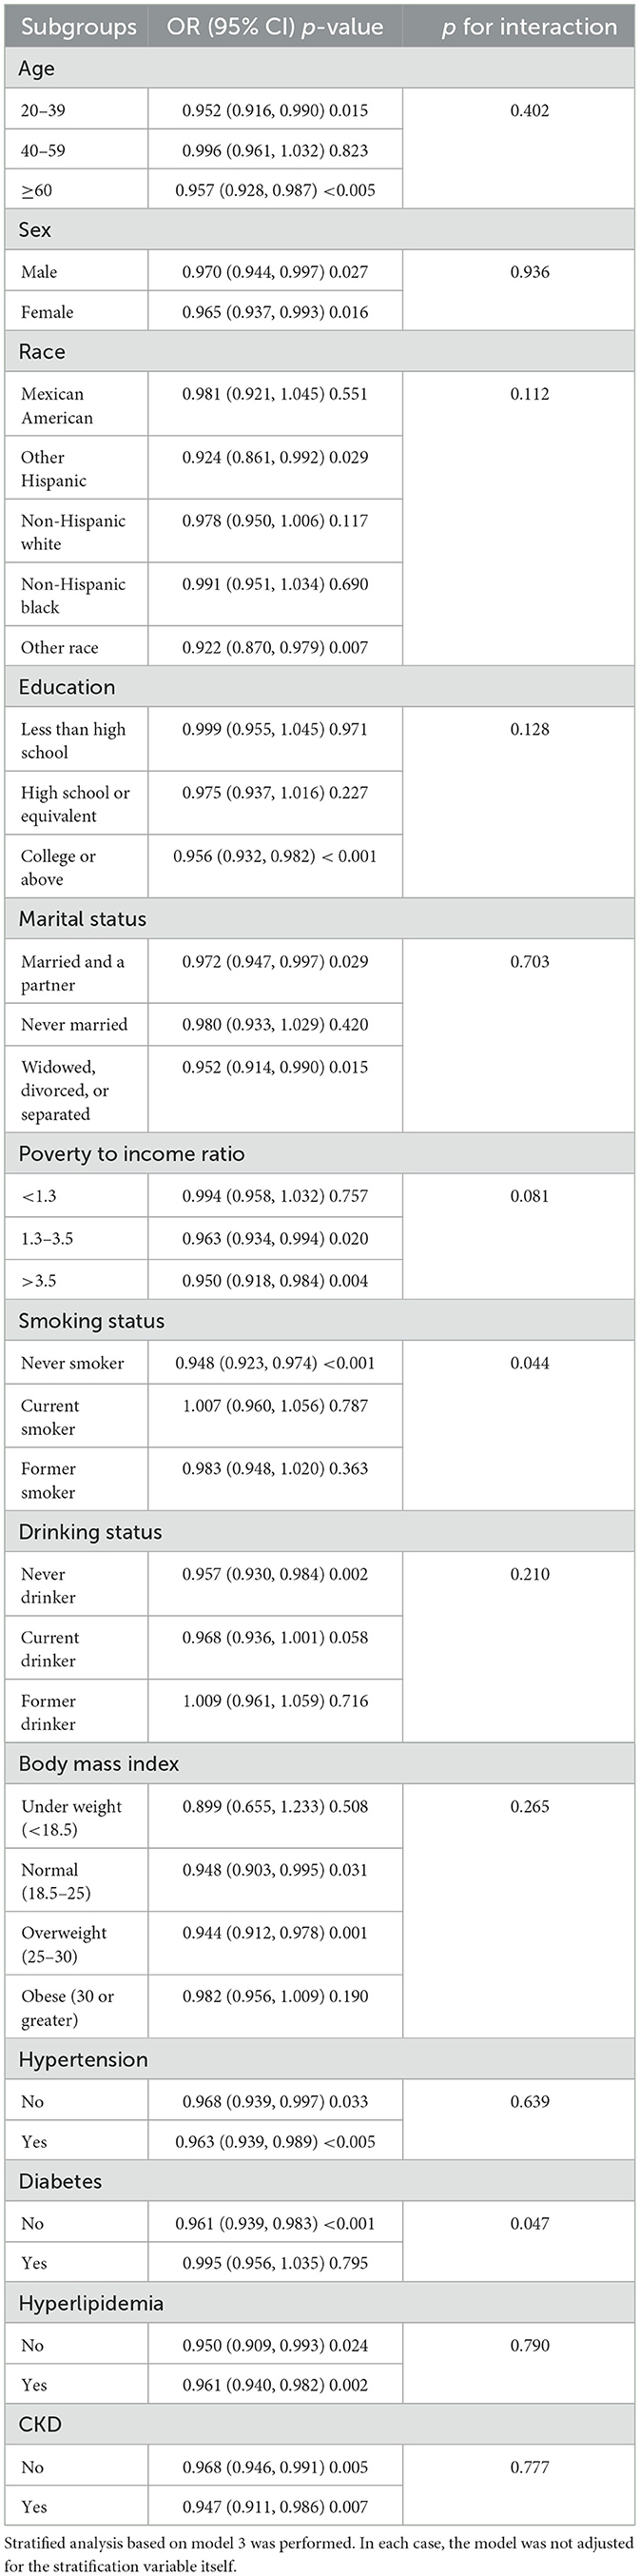
Table 4. Subgroup analysis of the association between DI-GM and HUA.
The RCS subgroup analysis showed that the DI-GM score had a consistent linear negative correlation with the risk of HUA in both genders (Figure 3A) and in individuals over 40 years old (Figure 3B). In the 20–39 age group, a non-linear relationship was observed (Figure 3B). When DI-GM < 4, there was no significant difference in the risk of HUA (OR = 1.016, 95% CI = 0.934–1.105, p = 0.709). However, when DI-GM ≥4, the risk of HUA decreased (OR = 0.897, 95% CI = 0.844–0.954, p < 0.005). The log-likelihood ratio test was 0.043.
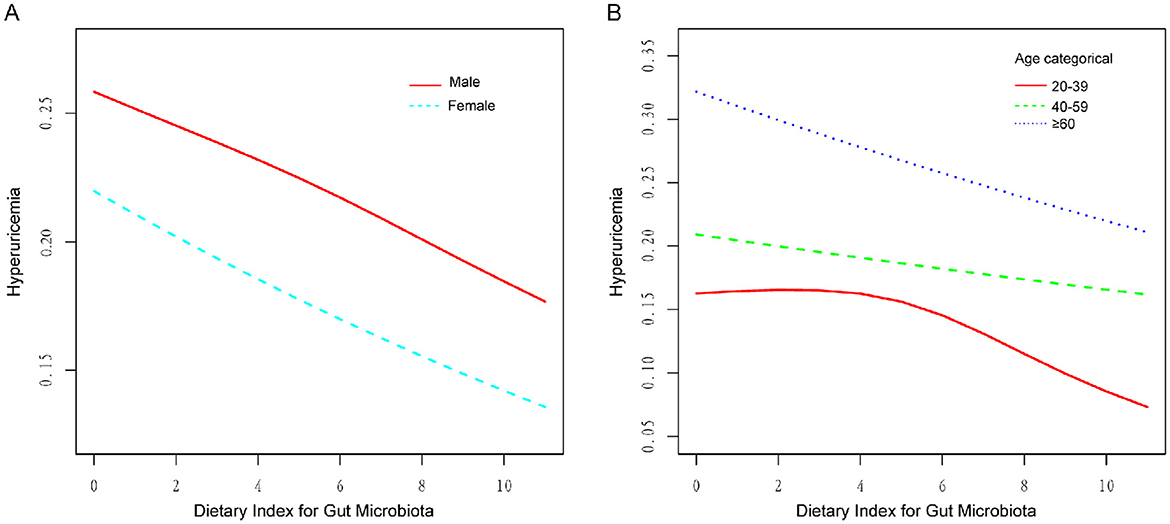
Figure 3. RCS of the association between DI-GM and HUA in different genders and ages. (A) RCS subgroup analysis by gender, showing a negative linear correlation in both groups. (B) RCS subgroup analysis by age, revealing a non-linear relationship in the 20–39 age group.
4 Discussion
This research represents the initial exploration of the correlation between DI-GM scores and HUA, utilizing data from NHANES. The results indicate a notable inverse linear correlation between DI-GM scores and serum UA levels, implying that more favorable dietary habits could potentially lower the risk of HUA through the modulation of the GM. The findings are consistent with earlier studies that highlight the essential function of dietary composition in the regulation of UA metabolism (29). This study extends the application of DI-GM to hyperuricemia, reinforcing its utility in assessing diet quality in metabolic research. Notably, DI-GM scores showed a consistent linear negative correlation with the risk of HUA in both genders and in individuals over 40. In contrast, a non-linear relationship was observed in the 20–39 age group, with a negative association at DI-GM scores ≥4.
Dietary components are closely linked to the synthesis and excretion of UA. Numerous studies have shown that this relationship is mediated by the regulation of the GM (22, 30, 31). For instance, beneficial components in DI-GM, such as dietary fiber (32), fermented dairy products (33), coffee, and green tea (34), can alleviate HUA. On the other hand, unfavorable dietary components such as red meat and high-fat foods have been linked to elevated UA levels (8, 35). Dietary fiber, an essential part of a balanced diet, plays a crucial role in regulating the GM. Numerous studies have shown that fiber intake helps manage serum UA levels (13, 36). Research suggests (37, 38) that dietary fiber fosters the growth of beneficial bacteria, which, in turn, reduce UA synthesis by inhibiting key enzymes like xanthine oxidase in the liver (39, 40). Additionally, dietary fiber enhances intestinal motility, reducing purine absorption, which further supports its beneficial effects on HUA (41).
Short-chain fatty acids (SCFAs) are the main metabolites generated through the fermentation of dietary fiber by the GM. Short-chain fatty acids serve as a source of energy for the intestinal epithelial cells, aiding in the excretion of UA and lowering the risk of HUA (42). Tea and its bioactive compounds, especially polyphenols, contribute to the management of HUA. Polyphenols inhibit xanthine oxidase and regulate UA transporters, indicating that these compounds could act as molecular targets for the anti-hyperuricemia effects of tea (43). Polyphenols, found in high concentrations in various plant-based foods such as tea (44), have demonstrated the ability to enhance the population of beneficial bacteria including Bifidobacterium, Lactobacillus, Bacteroides, and Prevotella. Concurrently, they reduce the relative abundance of Proteobacteria and alter the Firmicutes-to-Bacteroides ratio, thereby acting as oral prebiotics (45).
Conversely, specific detrimental elements of the DI-GM, are significant characteristics of the Western dietary pattern, which has been linked to a heightened risk of HUA (46). Earlier research indicates that the negative consequences of these dietary elements on hyperuricemia are influenced by their interaction with the GM (21). For example, Lactobacillus plantarum has demonstrated the ability to mitigate the increase in UA levels prompted by high-fat diets (47). In a 10-week observational crossover study, 20 healthy adults participated in the consumption of two isocaloric diets: one abundant in whole grains and fiber, and the other predominantly consisting of red meat. The consumption of red meat induced notable alterations in the gut microbiota, especially regarding the prevalence of Firmicutes, and was associated with elevated serum levels of UA and creatinine (48).
The stratified analysis conducted in this study indicated that the association between DI-GM scores and HUA differed across age groups. In individuals over the age of 40, a steady negative linear correlation was noted between DI-GM scores and the risk of HUA. Conversely, in those aged 20–39, the relationship between DI-GM scores and HUA exhibited a non-linear pattern. Low DI-GM scores did not significantly affect UA levels, which may be due to age-related metabolic changes, such as decreased glomerular density and reduced UA excretion capacity (49). A healthy dietary pattern may play a more significant protective role in this population by improving GM and enhancing metabolic function.
Given that increasing DI-GM scores can reduce the risk of HUA, we suggest that dietary patterns should be modified to increase DI-GM scores rather than simply restricting high-purine foods. This approach may help prevent HUA. For instance, seaweed, dried laver, squid, and other marine-based foods, previously considered rich in purines and should be consumed cautiously by individuals with HUA, may be included in the diet as part of an overall healthy dietary pattern. Other studies have found negative correlations between DI-GM scores and the prevalence of stroke (24), diabetes (25), and metabolic dysfunction-associated fatty liver disease (26).
Although the DI-GM was originally developed to evaluate the microbiota-related quality of diet, the findings of this study suggest that it may also be useful in guiding dietary strategies for the prevention of HUA. Unlike traditional dietary recommendations that emphasize purine restriction, the DI-GM captures a wider range of dietary components, including fiber, polyphenols, and fermented foods, which are known to influence gut microbiota composition and UA metabolism. The inverse association observed between DI-GM and HUA supports its potential role in identifying dietary patterns associated with lower risk. While the cross-sectional design of this study limits causal interpretation, the results highlight the importance of incorporating microbiota-related dietary quality into future research and nutritional approaches targeting HUA.
This study thoroughly examines the interplay between DI-GM and the occurrence of HUA, providing fresh insights into the intricate relationships among nutrition, microbial communities, and UA metabolism. In light of these observations, it is important to acknowledge the various constraints present. First, the cross-sectional design of this study precludes causal inference, as it does not allow for the assessment of temporal sequence or directionality between DI-GM scores and hyperuricemia. Future longitudinal cohort studies and randomized controlled trials are warranted to verify whether improvements in DI-GM can directly reduce the risk or progression of HUA. Second, although the DI-GM was constructed based on established literature linking dietary components to gut microbiota characteristics, it has not yet been directly validated against microbial composition or functional profiles derived from sequencing data. Existing associations between DI-GM and microbiota-related diseases provide only indirect support for its construct validity. Further microbiome-based validation is needed to enhance the credibility of this index. Third, the study data is derived from the U.S. population, which may limit the generalizability of the findings to other populations.
While causal inferences cannot be drawn due to the cross-sectional design, our findings suggest that the DI-GM serves as an exploratory tool to characterize gut microbiota-related dietary patterns associated with UA metabolism. The score is derived from standard 24-h dietary recall data, making it applicable in large-scale nutritional epidemiology. The observed age-related differences, including a stable inverse association in adults aged 40 years and older and a non-linear trend among younger adults, highlight the importance of considering population heterogeneity in diet–microbiota–host interactions. These patterns provide a basis for refining stratification strategies in future observational studies. To further support the present findings, future studies should aim to replicate these associations in independent, population-based datasets with comparable dietary and biochemical measures. Such validation would help assess the external validity of the DI-GM across diverse demographic and nutritional contexts. Additionally, applying the DI-GM in clinically relevant subgroups, such as individuals with obesity, insulin resistance, or impaired renal function, may help determine whether its association with hyperuricemia differs by metabolic condition. Although direct microbiome data were not available in this study, linking the DI-GM to validated microbiota-related biomarkers or evaluating it in datasets that include both dietary and microbial data could provide additional insight into its biological relevance.
5 Conclusion
The present study identified a significant inverse association between DI-GM scores and hyperuricemia. These findings suggest a potential relationship between microbiota-related dietary patterns and uric acid metabolism that warrants further investigation.
Data availability statement
The original contributions presented in the study are included in the article/supplementary material, further inquiries can be directed to the corresponding author.
Author contributions
XC: Methodology, Writing – original draft, Writing – review & editing. SZ: Methodology, Writing – original draft. TL: Investigation, Writing – review & editing. ZJin: Data curation, Writing – review & editing. JL: Investigation, Writing – review & editing. ZJia: Data curation, Writing – review & editing. QY: Supervision, Writing – review & editing.
Funding
The author(s) declare that no financial support was received for the research and/or publication of this article.
Conflict of interest
The authors declare that the research was conducted in the absence of any commercial or financial relationships that could be construed as a potential conflict of interest.
Generative AI statement
The author(s) declare that no Gen AI was used in the creation of this manuscript.
Publisher's note
All claims expressed in this article are solely those of the authors and do not necessarily represent those of their affiliated organizations, or those of the publisher, the editors and the reviewers. Any product that may be evaluated in this article, or claim that may be made by its manufacturer, is not guaranteed or endorsed by the publisher.
References
1. Xie S, Xiao H, Xu L, Li G, Zhang F, Luo M, et al. Comprehensive analysis of trends in the burden of gout in China and globally from 1990 to 2021. Sci Rep. (2025) 5:3310. doi: 10.1038/s41598-025-86090-z
2. Li Y, Shen Z, Zhu B, Zhang H, Zhang X, Ding X. Demographic, regional and temporal trends of hyperuricemia epidemics in mainland China from 2000 to 2019: a systematic review and meta-analysis. Glob Health Action. (2021) 14:1874652. doi: 10.1080/16549716.2021.1874652
3. Yang H, Ying J, Zu T, Meng XM, Jin J. Insights into renal damage in hyperuricemia: focus on renal protection (review). Mol Med Rep. (2025) 31:59. doi: 10.3892/mmr.2024.13424
4. Li Y, Sang T, Lv N, Liu J, Gu Y, Han X, et al. The impact of uric acid on acute coronary syndrome prognosis in elderly patients. Ann Med. (2025) 57:2445200. doi: 10.1080/07853890.2024.2445200
5. Copur S, Demiray A, Kanbay M. Uric acid in metabolic syndrome: does uric acid have a definitive role? Eur J Intern Med. (2022) 103:4–12. doi: 10.1016/j.ejim.2022.04.022
6. Danve A, Sehra ST, Neogi T. Role of diet in hyperuricemia and gout. Best Pract Res Clin Rheumatol. (2021) 35:101723. doi: 10.1016/j.berh.2021.101723
7. Li R, Yu K, Li C. Dietary factors and risk of gout and hyperuricemia: a meta-analysis and systematic review. Asia Pac J Clin Nutr. (2018) 27:1344. doi: 10.6133/apjcn.201811_27(6).0022
8. Chi X, Cen Y, Yang B, Zhang H, Pu Z, Feng J, et al. Effects of dietary factors on hyperuricaemia and gout: a systematic review and meta-analysis of observational studies. Int J Food Sci Nutr. (2024) 75:753–73. doi: 10.1080/09637486.2024.2400489
9. Chen H, Yang G, Chen L, Zhao Y, Yao P, Li Y, et al. Dietary polyunsaturated fatty acids intake is negatively associated with hyperuricemia: the National Health and Nutrition Examination Survey 2003-2015. Nutr Metab Cardiovasc Dis. (2024) 34:2203–16. doi: 10.1016/j.numecd.2024.05.026
10. Liu X, Chen TY, Gao TY, Shi KQ, Yin FQ, Yu YX, et al. Pro-inflammatory diets promote the formation of hyperuricemia. Front Endocrinol. (2024) 15:1398917. doi: 10.3389/fendo.2024.1398917
11. Zhang T, Gan S, Ye M, Meng G, Zhang Q, Liu L, et al. Association between consumption of ultra-processed foods and hyperuricemia: TCLSIH prospective cohort study. Nutr Metab Cardiovasc Dis. (2021) 31:1993–2003. doi: 10.1016/j.numecd.2021.04.001
12. Juraschek SP, Yokose C, McCormick N, Miller ER 3rd, Appel LJ, Choi HK. Effects of dietary patterns on serum urate: results from a randomized trial of the effects of diet on hypertension. Arthritis Rheumatol. (2021) 73:1014–20. doi: 10.1002/art.41614
13. Zhu Q, Yu L, Li Y, Man Q, Jia S, Liu B, et al. Association between dietary approaches to stop hypertension (DASH) diet and hyperuricemia among Chinese adults: findings from a nationwide representative study. Nutr J. (2023) 22:21. doi: 10.1186/s12937-023-00845-w
14. Gao Y, Cui LF, Sun YY, Yang WH, Wang JR, Wu SL, et al. Adherence to the dietary approaches to stop hypertension diet and hyperuricemia: a cross-sectional study. Arthritis Care Res. (2021) 73:603–11. doi: 10.1002/acr.24150
15. Gentile CL, Weir TL. The gut microbiota at the intersection of diet and human health. Science. (2018) 362:776–80. doi: 10.1126/science.aau5812
16. Beam A, Clinger E, Hao L. Effect of diet and dietary components on the composition of the gut microbiota. Nutrients. (2021) 13:2795. doi: 10.3390/nu13082795
17. Makki K, Deehan EC, Walter J, Bäckhed F. The impact of dietary fiber on gut microbiota in host health and disease. Cell Host Microbe. (2018) 23:705–15. doi: 10.1016/j.chom.2018.05.012
18. Perler BK, Friedman ES, Wu GD. The role of the gut microbiota in the relationship between diet and human health. Annu Rev Physiol. (2023) 85:449–68. doi: 10.1146/annurev-physiol-031522-092054
19. Sun L, Zhang M, Zhao J, Chen W, Wang G. The human gut microbiota and uric acid metabolism: genes, metabolites, and diet. Crit Rev Food Sci. (2025) 1:21. doi: 10.1080/10408398.2025.2475238
20. Liu X, Lv Q, Ren H, Gao L, Zhao P, Yang X, et al. The altered gut microbiota of high-purine-induced hyperuricemia rats and its correlation with hyperuricemia. PeerJ. (2020) 8:e8664. doi: 10.7717/peerj.8664
21. Zhang N, Zhou J, Zhao L, Zhao Z, Wang S, Zhang L, et al. Ferulic acid supplementation alleviates hyperuricemia in high-fructose/fat diet-fed rats via promoting uric acid excretion and mediating the gut microbiota. Food Funct. (2023) 14:1710–25. doi: 10.1039/D2FO03332A
22. Zhuo LB, Yang Y, Xiao C, Li F, Lin L, Xi Y, et al. Gut microbiota-bile acid axis mediated the beneficial associations between dietary lignans and hyperuricemia: a prospective study. Food Funct. (2024) 15:6438–49. doi: 10.1039/D4FO00961D
23. Kase BE, Liese AD, Zhang J, Murphy EA, Zhao L, Steck SE. The development and evaluation of a literature-based dietary index for gut microbiota. Nutrients. (2024) 16:1045. doi: 10.3390/nu16071045
24. Liu J, Huang S. Dietary index for gut microbiota is associated with stroke among US adults. Food Funct. (2025) 16:1458–68. doi: 10.1039/D4FO04649H
25. Huang Y, Liu X, Lin C, Chen X, Li Y, Huang Y, et al. Association between the dietary index for gut microbiota and diabetes: the mediating role of phenotypic age and body mass index. Front Nutr. (2025) 12:1519346. doi: 10.3389/fnut.2025.1519346
26. Zheng Y, Hou J, Guo S, Song J. The association between the dietary index for gut microbiota and metabolic dysfunction-associated fatty liver disease: a cross-sectional study. Diabetol Metab Syndr. (2025) 17:17. doi: 10.1186/s13098-025-01589-9
27. Bardin T, Richette P. Definition of hyperuricemia and gouty conditions. Curr Opin Rheumatol. (2014) 26:186–91. doi: 10.1097/BOR.0000000000000028
28. Maloberti A, Tognola C, Garofani I, Algeri M, Shkodra A, Bellantonio V, et al. Uric acid and metabolic syndrome: importance of hyperuricemia cut-off. Int J Cardiol. (2024) 417:132527. doi: 10.1016/j.ijcard.2024.132527
29. Cheng S, Shan L, You Z, Xia Y, Zhao Y, Zhang H, et al. Dietary patterns, uric acid levels, and hyperuricemia: a systematic review and meta-analysis. Food Funct. (2023) 14:7853–68. doi: 10.1039/D3FO02004E
30. Feng ZP, Wang XY, Xin HY, Huang SL, Huang HY, Xin Q, et al. Gut microbiota plays a significant role in gout. J Med Microbiol. (2024) 73:10. doi: 10.1099/jmm.0.001824
31. Sun L, Ni C, Zhao J, Wang G, Chen W. Probiotics, bioactive compounds and dietary patterns for the effective management of hyperuricemia: a review. Crit Rev Food Sci. (2024) 64:2016–31. doi: 10.1080/10408398.2022.2119934
32. Kim J, Jung DY, Lee JH, Kim MK, Kwon HS, Yim HW, et al. Association between serum uric acid levels and dietary fiber intake in adults: the Korea national health and nutrition examination survey (KNHANES VII, 2016-2018). Nutr Metab. (2024) 21:33. doi: 10.1186/s12986-024-00809-9
33. Zhao S, Feng P, Hu X, Cao W, Liu P, Han H, et al. Probiotic limos lactobacillus fermentum GR-3 ameliorates human hyperuricemia via degrading and promoting excretion of uric acid. Iscience. (2022) 25:105198. doi: 10.1016/j.isci.2022.105198
34. Guo H, Wang S, Peng H, Wang M, Li L, Huang J, et al. Dose-response relationships of tea and coffee consumption with gout: a prospective cohort study in the UK Biobank. Rheumatology. (2023) 62:3043–50. doi: 10.1093/rheumatology/kead019
35. Jia X, Chen Q, Wu H, Liu H, Jing C, Gong A, et al. Exploring a novel therapeutic strategy: the interplay between gut microbiota and high-fat diet in the pathogenesis of metabolic disorders. Front Nutr. (2023) 10:1291853. doi: 10.3389/fnut.2023.1291853
36. Sun Y, Sun J, Zhang P, Zhong F, Cai J, Ma A. Association of dietary fiber intake with hyperuricemia in U. S adults. Food Funct. (2019) 10:4932–40. doi: 10.1039/C8FO01917G
37. Wang Y, Miao F, Wang J, Zheng M, Yu F, Yi Y. The ameliorative and neuroprotective effects of dietary fibre on hyperuricaemia mice: a perspective from microbiome and metabolome. Brit J Nutr. (2024) 132:275–88. doi: 10.1017/S0007114524001211
38. Shi F, Zhou F, Zheng X, Lv J, Yu X, Zhou Y, et al. Effects of dietary fiber compounds on characteristic human flora and metabolites mediated by the longevity dietary pattern analyzed by in vitro fermentation. Nutrients. (2022) 14:5037. doi: 10.3390/nu14235037
39. Li M, Wu X, Guo Z, Gao R, Ni Z, Cui H, et al. Lactiplantibacillus plantarum enables blood urate control in mice through degradation of nucleosides in gastrointestinal tract. Microbiome. (2023) 11:153. doi: 10.1186/s40168-023-01605-y
40. Terkeltaub R, Dodd D. The gut microbiome in hyperuricemia and gout. Arthritis Rheumatol. (2025) 1:123–36. doi: 10.1002/art.43118
41. Zou F, Zhao X, Wang F. A review on the fruit components affecting uric acid level and their underlying mechanisms. J Food Biochem. (2021) 45:e13911. doi: 10.1111/jfbc.13911
42. Nieuwdorp M, Gilijamse PW, Pai N, Kaplan LM. Role of the microbiome in energy regulation and metabolism. Gastroenterology. (2014) 146:1525–33. doi: 10.1053/j.gastro.2014.02.008
43. Chen Y, Luo L, Hu S, Gan R, Zeng L. The chemistry, processing, and preclinical anti-hyperuricemia potential of tea: a comprehensive review. Crit Rev Food Sci. (2023) 63:7065–90. doi: 10.1080/10408398.2022.2040417
44. Lv W, Chen H, Zhou P, Du A, Lei Y. Mechanisms associated with renal injury in hyperuricemia and strategies for the development of natural active substances. Int J Rheum Dis. (2025) 28:e70096. doi: 10.1111/1756-185X.70096
45. Liu ZQ, Sun X, Liu ZB, Zhang T, Zhang LL, Wu CJ. Phytochemicals in traditional Chinese medicine can treat gout by regulating intestinal flora through inactivating NLRP3 and inhibiting XOD activity. J Pharm Pharmacol. (2022) 74:919–29. doi: 10.1093/jpp/rgac024
46. Rai SK, Fung TT, Lu N, Keller SF, Curhan GC, Choi HK. The dietary approaches to stop hypertension (DASH) diet, western diet, and risk of gout in men: prospective cohort study. BMJ. (2017) 357:j1794. doi: 10.1136/bmj.j1794
47. Hsu CL, Hou YH, Wang CS, Lin SW, Jhou BY, Chen CC, et al. Antiobesity and uric acid-lowering effect of lactobacillus plantarum GKM3 in high-fat-diet-induced obese rats. J Am Coll Nutr. (2019) 38:623–32. doi: 10.1080/07315724.2019.1571454
48. Foerster J, Maskarinec G, Reichardt N, Tett A, Narbad A, Blaut M, et al. The influence of whole grain products and red meat on intestinal microbiota composition in normal weight adults: a randomized crossover intervention trial. PLoS ONE. (2014) 9:e109606. doi: 10.1371/journal.pone.0109606
Keywords: hyperuricemia, dietary index for gut microbiota, diet index, nutritional epidemiology, NHANES
Citation: Cai X, Zhang S, Lan T, Jin Z, Liu J, Jiang Z and Yang Q (2025) The relationship between dietary index for gut microbiota and hyperuricemia: a cross-sectional study using NHANES data. Front. Nutr. 12:1580122. doi: 10.3389/fnut.2025.1580122
Received: 20 February 2025; Accepted: 07 May 2025;
Published: 26 May 2025.
Edited by:
William J. Massey, Lerner Research Institute, United StatesReviewed by:
Nanhai Zhang, Jiangxi University of Traditional Chinese Medicine, ChinaXiaofei Zhou, Shanghai Zhongqiao Vocational Technical College, China
Copyright © 2025 Cai, Zhang, Lan, Jin, Liu, Jiang and Yang. This is an open-access article distributed under the terms of the Creative Commons Attribution License (CC BY). The use, distribution or reproduction in other forums is permitted, provided the original author(s) and the copyright owner(s) are credited and that the original publication in this journal is cited, in accordance with accepted academic practice. No use, distribution or reproduction is permitted which does not comply with these terms.
*Correspondence: Qingwan Yang, eXF3MjB0c3lAeWVhaC5uZXQ=
†These authors have contributed equally to this work