 Adolfo Aramburu1,2*†
 Jackeline Lizet Chupica-Leon3†Beatriz Quispe-Quille1Julie Mariaca1Patricia Velarde-Delgado4
 Gilmer Solis-Sanchez4
 Bladimir Morales-Cahuancama2,4Fernando Bravo-Rebatta4María Elena Ugaz3Fredy Polo-Campos1
- 1Directorate of Health Promotion, Ministry of Health, Lima, Peru
- 2Faculty of Science Health, Peruvian University of Applied Sciences, Lima, Peru
- 3United Nations Children's Fund (UNICEF), Lima, Peru
- 4National Center for Food, Nutrition and Healthy Living, National Institute of Health, Lima, Peru
Introduction: The rising consumption of industrialized infant foods and breastmilk substitutes during early childhood has raised concerns due to their suboptimal nutritional composition, which may contribute to the development of risk factors for non-communicable diseases. This study aimed to assess and compare the nutritional profile of foods intended for children aged 0–3 years marketed in Lima, Peru, using national criteria and the nutrient profile model developed by the Pan American Health Organization (PAHO).
Methods: This cross-sectional, descriptive, and observational study analyzed products purchased from selected supermarkets and pharmacies in metropolitan Lima between September and October 2023. Nutritional labeling information was examined, and the nutritional profile was assessed using the nutrient profile models of Peru (Law No. 30021) and PAHO.
Results: A total of 64 products were analyzed, including 39 breastmilk substitutes, 13 infant cereals, and 12 pureed foods. According to the parameters established by Law No. 30021, 74.5, 1.6, and 37.3% of products were high in total sugars, sodium, and saturated fats, respectively. According to PAHO parameters, the proportion of products classified as high in added sugars, sodium, and saturated fats increased to 83, 6.3, and 41.3%, respectively. Breastmilk substitutes were the main contributors to excessive saturated fat and total sugar content. Additionally, the presence of added sugars was identified in the ingredient lists of 84% of the products, corresponding to 100% of breastmilk substitutes, 53.9% of infant cereals, and 66.7% of pureed foods.
Conclusion: The findings indicate that most breastmilk substitutes and foods marketed for children under three years old in metropolitan Lima have an unhealthy nutritional profile. Furthermore, the use of the technical parameters proposed by PAHO allowed for the identification of a higher number of products high in critical nutrients compared to the criteria established by Law No. 30021.
1 Introduction
Non-communicable diseases (NCDs) are the leading cause of death and disability globally, particularly affecting low- and middle-income countries (1, 2). Many of these diseases originate in early childhood, a stage during which inadequate diets can lead to childhood obesity, a critical determinant associated with a higher risk of developing NCDs throughout life, including cardiovascular diseases, type 2 diabetes, and certain cancers (3, 4).
Likewise, early childhood is a critical window for the development of taste preferences and the establishment of dietary patterns that often track into adulthood (5, 6). This formative period of flavor learning is highly susceptible to the surrounding food environment. It is precisely during this stage that the increasing availability and consumption of nutritionally suboptimal, ultra-processed foods (UPFs) can shape the palate toward unhealthy profiles (7). Therefore, ensuring the provision of diverse, safe, and nutritious foods is essential not only for meeting immediate nutritional requirements but also for actively fostering healthy eating patterns from the beginning of life (8, 9).
However, traditional infant feeding patterns centered on minimally processed foods are undergoing a continuous transition toward a higher consumption of processed and ultra-processed foods. According to the NOVA classification, UPFs are formulations made mostly from ingredients—some exclusively industrial—and additives, obtained through multiple industrial processes, and designed to be profitable, convenient, and hyper-palatable, and that tend to displace unprocessed or minimally processed foods in diet (10).
In Latin America, UPFs may account for up to 40% of children’s daily energy intake (11, 12). These foods often have high caloric density, added sugars, and excessive levels of sodium, total fats, and saturated fats (9, 13–15), which is why they have been associated with higher levels of adiposity, weight gain, increased blood pressure, and a less favorable lipid profile (9, 16–19). The mechanisms underlying these effects are multifactorial, involving lower satiety, higher glycemic responses, gut microbiota alterations, and exposure to chemical compounds formed during processing or released from packaging materials, which have been linked to endocrine disruption and increased risk for NCDs (9, 16, 20).
In Peru, over 60% of adults suffer from excess weight, as well as 10.8% of children under 5 years old (21), with this prevalence having doubled compared to what was observed in 2007 (22). Similarly, Peru experienced the highest per capita growth in the sale of ultra-processed foods in Latin America between 2009 and 2014 (23). In response to this issue, the Peruvian government enacted the Law to Promote Healthy Eating for Children and Adolescents (Law No. 30021), which includes a front-of-package nutrition labeling regulation that states that packaged foods and beverages that exceed specific thresholds of critical nutrients such as sugar, saturated fats, or sodium, or containing trans fats, must carry black octagonal warnings on the packaging and all forms of advertising. The thresholds for these critical nutrients were implemented gradually in two phases, with the first phase coming into effect in June 2019 and the second in September 2021.
Following the implementation of the first phase of Law No. 30021, a study identified that 31% of beverages and 62% of foods should carry an octagonal warning (24). However, that study excluded products specifically formulated for early childhood, such as breastmilk substitutes. Therefore, we conducted a study to assess and compare the nutritional profile of critical nutrients (sugars, saturated fats, sodium, and trans fats) in foods intended for children aged 0–3 years marketed in Metropolitan Lima, using national criteria and the PAHO model, as well as the presence and type of added sugars and non-caloric sweeteners. This study provides evidence that can inform policies, regulatory measures, and health promotion strategies aimed at improving the nutritional quality of foods consumed by infants and young children, a highly vulnerable group in which nutrition plays a critical role in health and long-term development.
2 Materials and methods
2.1 Study design
This was a cross-sectional, descriptive, and observational study. The study population included all breastmilk substitutes and foods intended for children aged 0–3 years marketed in Metropolitan Lima.
2.2 Selection of establishments
The 43 districts that comprise Metropolitan Lima were grouped into sectors based on the jurisdiction of the Integrated Health Networks of the Ministry of Health of Peru: Lima North, Lima Center, Lima East, and Lima South. Within each sector, supermarkets and hypermarkets from the eight chains with the largest market share in Peru (25) were identified, along with the hospital with the highest number of births in 2022, according to the National Unique Health Information Registry (REUNIS, in Spanish). In each sector, the following were selected: (a) one supermarket and one hypermarket (using convenience sampling); (b) all pharmacies around the hospital with the highest number of births; and (c) the online stores of the establishments listed in points (a) and (b).
2.3 Selection of products
The study included foods and beverages labeled for children under 36 months that did not require a medical prescription. For products available in different flavors, one flavor was randomly selected. The exclusion criteria comprised products without nutritional information and/or ingredient list; with damaged packaging that prevented proper reading of the labeling and/or nutritional composition; intended for infants who are premature, have low birth weight, or have specific medical conditions or disorders; and with inconsistent nutritional information (≥20% difference between the declared total energy and the energy calculated from the caloric content of carbohydrates, total fat, and proteins using the Atwater system).
2.4 Data collection
A snowball sampling technique was used for product collection until saturation was achieved. The first selected establishment was visited, and all products meeting the eligibility criteria were obtained. Subsequently, the second selected establishment was visited, and the remaining available products were acquired. This process was repeated at other establishments until all study products were collected.
Sample collection began with visits to all selected super- and hypermarkets, following this sequence: Lima Center, Lima North, Lima East, and Lima South. The process continued with the acquisition of products from the online stores of the selected establishments and concluded with the purchase of products from pharmacies near the selected hospitals in each sector. Once the products were acquired, they were photographed and stored according to the manufacturers’ instructions.
2.5 Data entry and processing
Nutritional composition and ingredient information from the labels of the products included in the study were entered into a spreadsheet designed in Microsoft Excel® by one researcher (JCH). To ensure integrity and consistency, the entered information was verified by a second researcher (AA) using a 15% random sample of the products, selected with the randomselect command in Stata/SE version 17.0 (StataCorp, College Station, TX, United States) from their unique identification codes.
2.6 Outcomes
The following outcomes were analyzed (operational definitions for each outcome are detailed in Supplementary Table S1):
• the content of energy, proteins, total fats, carbohydrates, sugar, saturated fats, trans fats, and sodium per 100 g or 100 mL of product;
• the percentage of products with high levels of sugar, saturated fats, and sodium according to the thresholds established by Law No. 30021 (26) and those proposed by the Pan American Health Organization (PAHO) in the context of the update to Law No. 30021 (27) (Table 1).
• the percentage of products containing trans fats (greater than 0 g per 100 g or milliliters of product, and greater than 2 g per 100 g or milliliters of fat content);
• the percentage of products containing added sugars, as well as the type of added sugars used
• the percentage of products containing non-caloric sweeteners, as well as the type of non-caloric sweetener used.
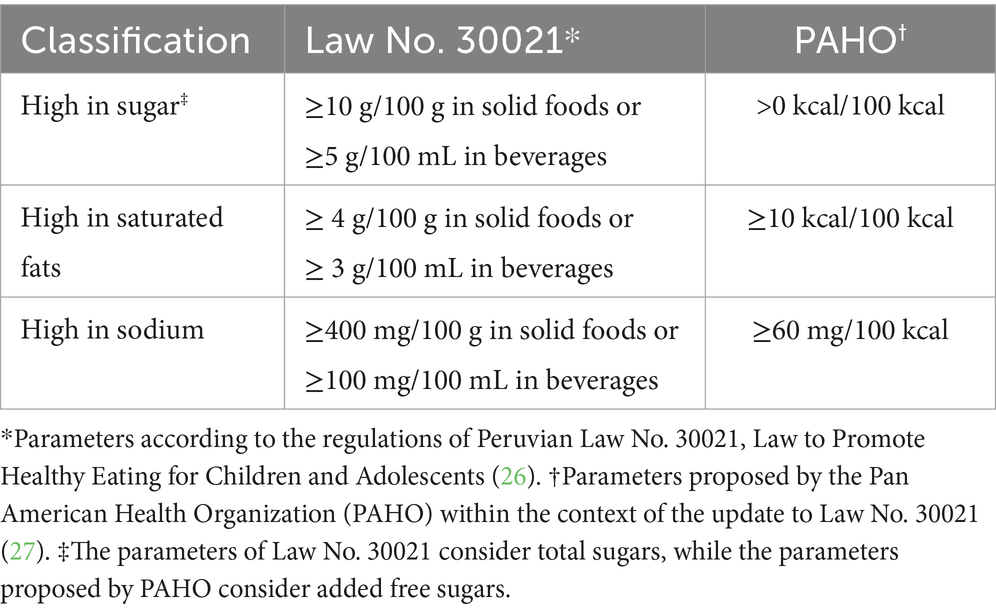
Table 1. Technical parameters for classifying foods as “high” in sugar, saturated fats, and sodium according to Law No. 30021 and PAHO.
2.7 Statistical analysis
Qualitative variables were summarized using absolute (count) and relative (percentage) frequency measures. Quantitative variables were described as medians with interquartile ranges. Study results were presented as totals and stratified by product type (breastmilk substitutes, infant cereals, and pureed foods). Breastmilk substitutes were further analyzed according to the intended age group (<6 months, 6–12 months, and >12–23 months). Analyses were conducted using Stata/SE version 17.0 (StataCorp, College Station, TX, United States).
2.8 Ethics statement
The study protocol was submitted to the Institutional Review Board of the Asociación Benéfica PRISMA and was exempted from review as it involved an analysis of information declared on product labels and did not pose any risk to human subjects (Letter #CE0426.23).
3 Results
A total of 64 products collected between September and October 2023 were included in the analysis. These consisted of 39 breastmilk substitutes (60.9%), 13 infant cereals (20.3%), and 12 pureed foods (18.8%). Among the breastmilk substitutes, 12 were intended for infants under 6 months, 11 for infants 6–12 months, and 16 for children over 12–35 months.
3.1 Content of energy and macronutrients
Per 100 grams or milliliters, the analyzed products contained a median of 435.4 kcal (IQR: 295.3–489), 56.1 g of carbohydrates (IQR: 47.1–59.6), 10.4 g of protein (IQR: 4.5–15.0), and 15.1 g of total fat (IQR: 1.7–22.8). Breastmilk substitutes, regardless of the intended age group, were the products with the highest content of energy, protein, and total fat, while infant cereals had the highest carbohydrate content. Similarly, pureed foods were the products with the lowest median values for energy and macronutrients (Table 2).
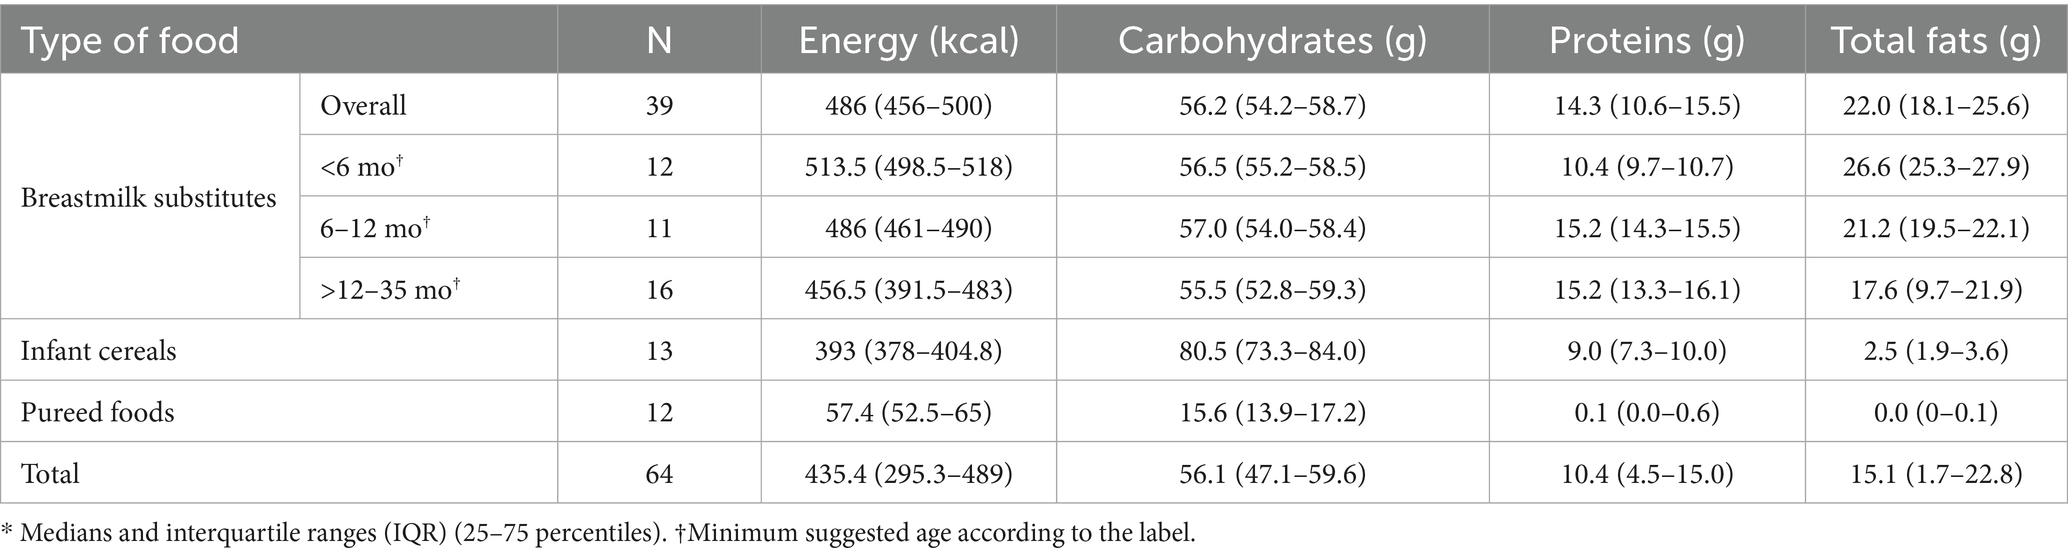
Table 2. Content * of energy and macronutrients per 100 g or 100 mL.
3.2 Profile of critical nutrients
According to the parameters of Law No. 30021, the proportion of products rated as high in total sugars, sodium, and saturated fats was 74.5, 1.6, and 37.3%, respectively. When using the parameters proposed by PAHO, these percentages increased to 83% (added sugars), 6.3, and 41.3%, respectively. For both parameters, breastmilk substitutes were the most frequently classified as “high in sugar” and “high in saturated fats.” It should be noted that 40% of the breastmilk substitutes included in the study did not report information on sugar and/or saturated fat content on their labeling, and therefore were not considered in the analysis for these two critical nutrients. Finally, infant cereals were the food group most frequently classified as “high in sodium” using the PAHO parameters (15.4%) (Table 3).
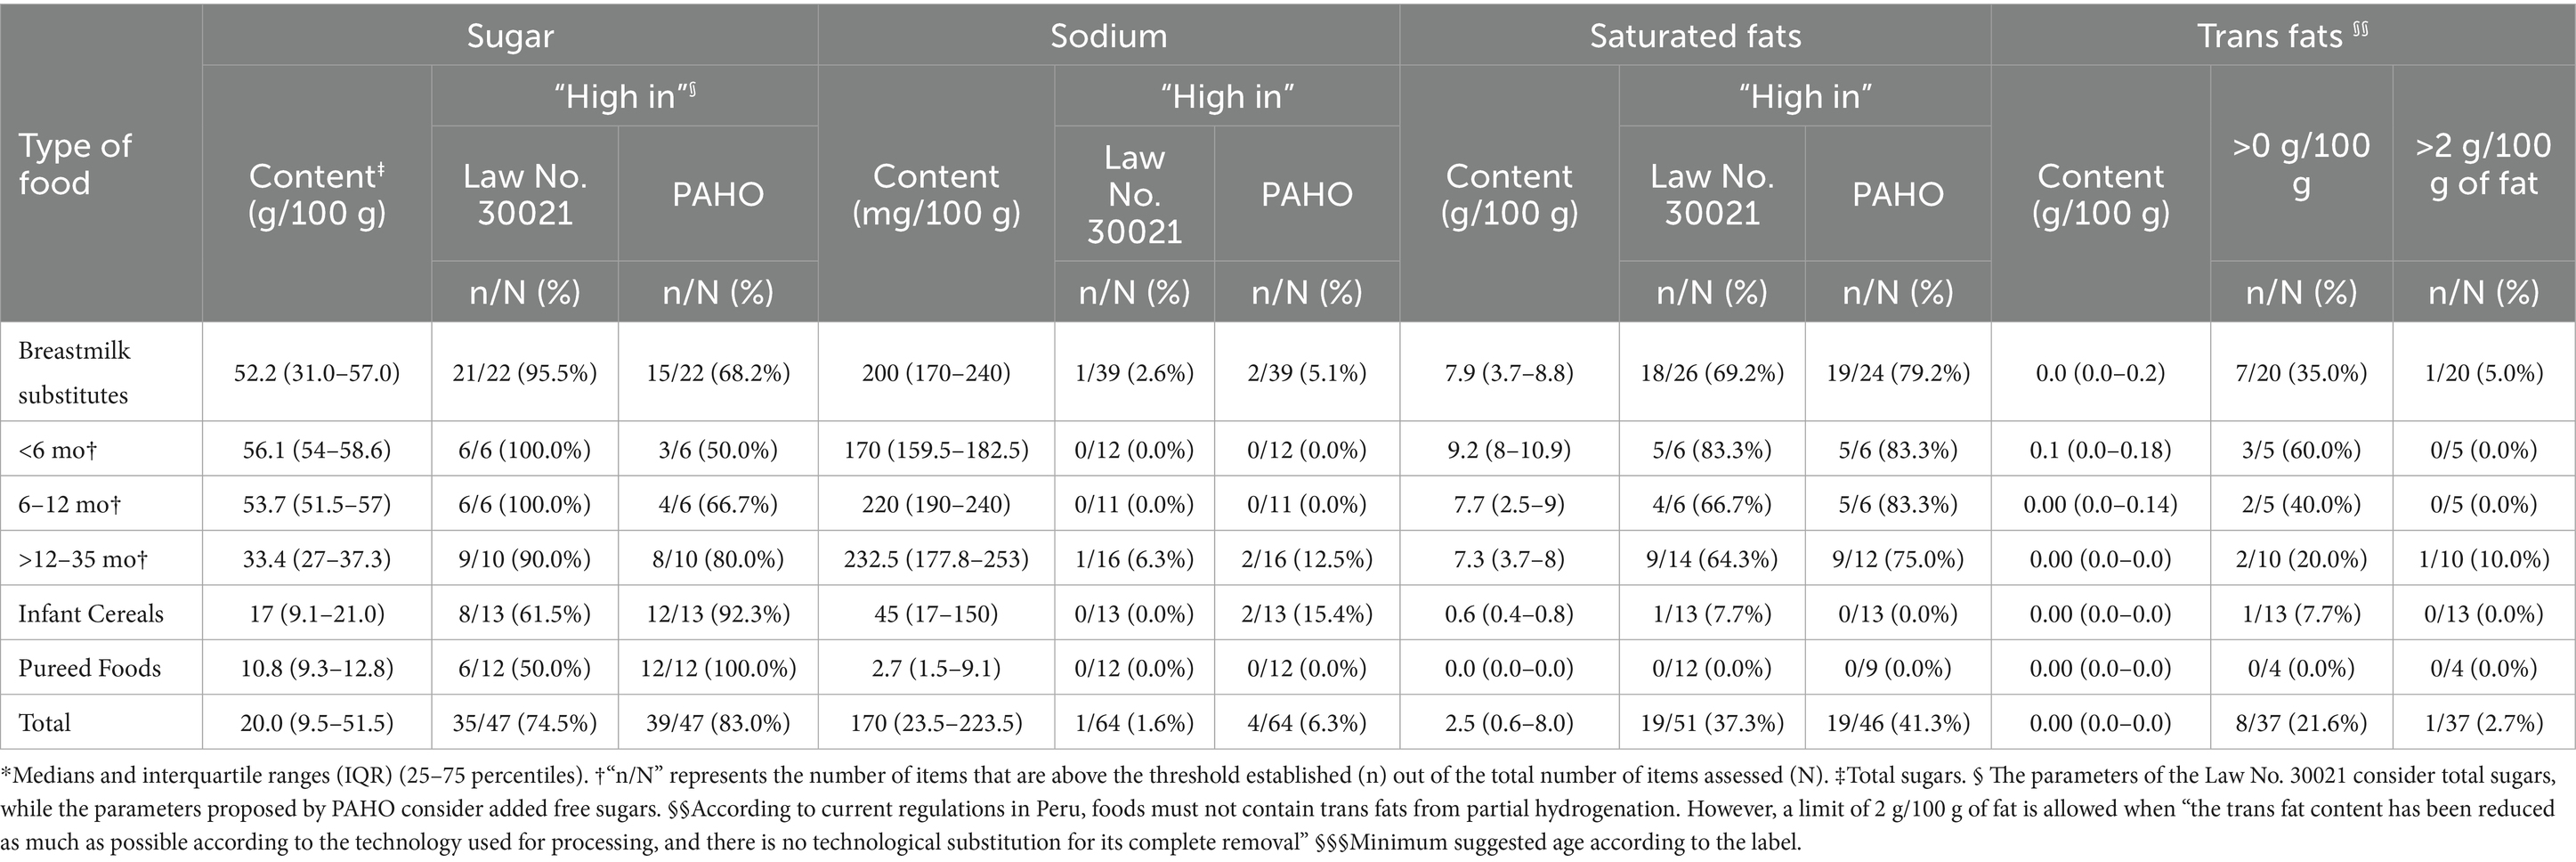
Table 3. Content* and profile of critical nutrients.†
When the PAHO parameters were used to identify products excessive in sugars, sodium or saturated fats, the proportion of products with no warning labels dropped to less than half compared to the current parameters of the Law No. 30021 (Table 4).
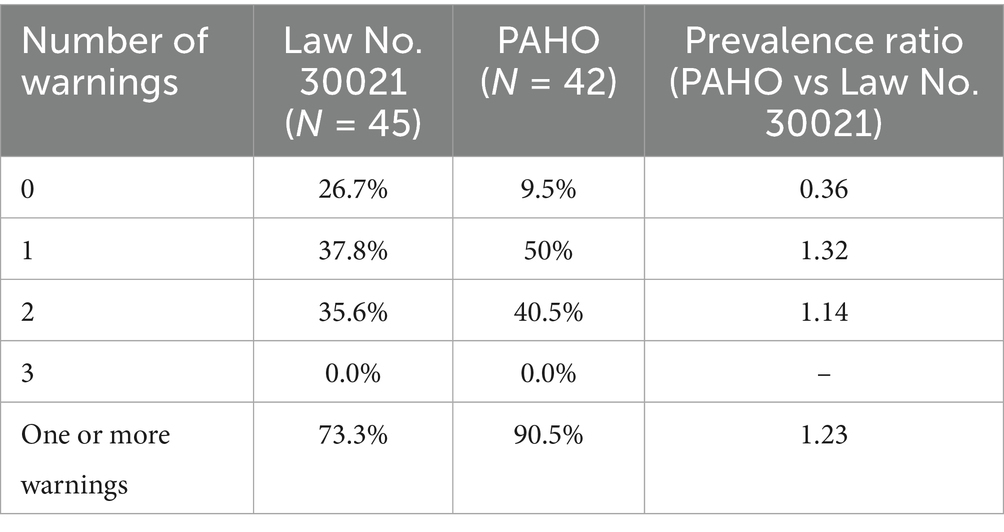
Table 4. Proportion of products requiring warning labels by PAHO and Law No. 30021 (phase 2).
3.3 Presence of trans fats
A total of 19 breastmilk substitutes (48.7%) and 8 pureed foods (66.7%) did not declare information on trans fat content on their labels. Among the remaining 37 products, 8 (21.6%) had a trans fats content greater than 0 g, and one of them exceeded 2 g of trans fats per 100 g/mL of fat content. The presence of trans fats was observed in seven breastmilk substitutes and one infant cereal (Table 3).
3.4 Presence and type of added sugars
100% of breastmilk substitutes, 53.9% of infant cereals, and 66.7% of pureed foods reported one or more added sugars in their ingredient lists. Among breastmilk substitutes, the most frequently added sugars were lactose (69.2%) and maltodextrin (41%). Lactose was particularly common in products intended for infants under 6 months (91.7%), while maltodextrin predominated in products aimed at the >12–35 months age group. Sugar or sucrose was the most commonly added sugar in infant cereals (30.8%) and pureed foods (66.7%), and it was present in 18.8% of breastmilk substitutes intended for the >12–35 months age group (Table 5).
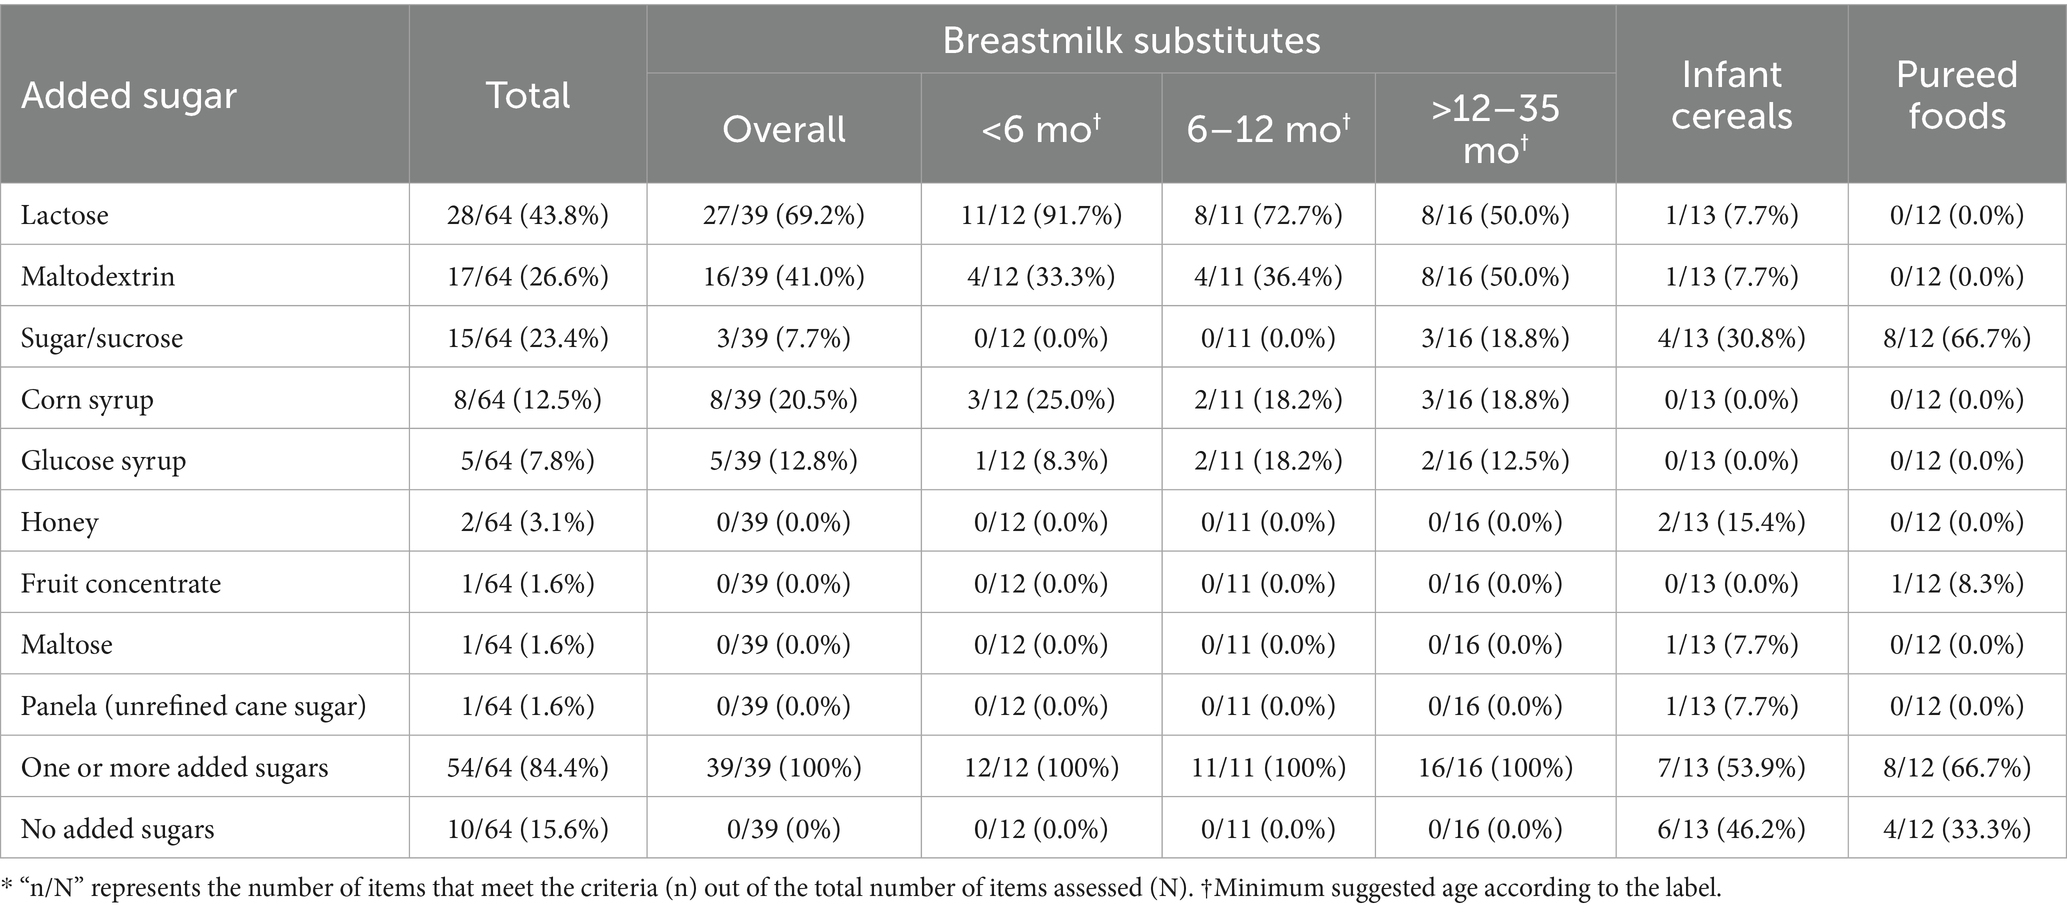
Table 5. Presence and type of added sugars [n/N (%)].*
3.5 Presence and type of non-caloric sweeteners
None of the infant cereals or pureed foods declared the presence of non-caloric sweeteners in their composition. Among the breastmilk substitutes, two products (3.1%) intended for children >12–35 months declared containing non-caloric sweeteners, specifically steviol glycosides (E960A) and sodium saccharin (E954).
4 Discussion
Our study aimed to assess and compare the nutritional profile of critical nutrients (sugar, saturated fats, sodium, and trans fats) in foods intended for children aged 0–3 years marketed in Metropolitan Lima, using the criteria established by Law No. 30021—which regulates front-of-package warning labels in Peru—and the nutrient profile model developed by PAHO. The purpose of this study was to provide key evidence to inform regulatory actions and health promotion strategies aimed at protecting the diets of infants and young children, a highly vulnerable group.
Overall, we observed a high proportion of foods with excessive content of sugar and saturated fats. When using the parameters established by Law No. 30021, 74.5% of products were classified as “high in sugars (totals)” and 37.3% as “high in saturated fats.” These percentages increased to 83% for “high in sugars (added)” and 41.3% for “high in saturated fats” when applying the PAHO parameters.
Studies in Latin America (14, 28–31) have reported varying percentages of infant foods with excessive content of critical nutrients. Regarding excessive sugar content, percentages have ranged from 37% in Brazil (14), to 91% in Uruguay (28), while the percentage of infant foods with excessive saturated fat content has varied from 11% in Chile (14) to 50% in Uruguay (30). This variability could be attributed to differences in regulation implementation periods across countries, the use of different definitions of infant foods, eligibility criteria, and sources of information, as well as by the application of various technical parameters to classify foods with excessive critical nutrient content.
Regarding this matter, Borges et al. (31) analyzed a sample of infant foods using six different technical parameters, demonstrating that the percentage of foods classified as “high in sodium” and “high in saturated fats” could be up to two or three times higher, and that the percentage of foods “high in sugar” could be up to 35% higher depending on the technical parameter used. Similarly, Karageuzián et al. (28) observed that the percentage of infant foods containing at least one critical nutrient increased from 74% using the parameters established by Uruguay’s national regulations to 96% when the parameters proposed by PAHO were used. Consistent with our study, both authors (28, 31) reported that using the technical parameters proposed by PAHO allowed for the identification of a greater number of foods with excessive levels of critical nutrients.
The choice of a specific technical parameter or nutrient profile model (NPM) is crucial for food policies, as it can affect the proportion of foods that should carry warning nutritional labeling and could be subject to advertising and marketing restrictions (31, 32). Consequently, a less stringent NPM might misinform consumers, encourage the consumption of less healthy foods, and impact food policies and the achievement of nutritional goals (31, 32). At the same time, the use of different NPMs among countries can lead to inconsistencies, confusion, and hinder comparability and tracking of progress (32, 33).
In this context, PAHO established evidence-based regional criteria in 2016, developed with the involvement of nutrition experts (34). This nutrient profile was designed based on the population intake targets proposed by WHO and FAO to prevent obesity and non-communicable chronic diseases, goals that were defined after a review of evidence on critical nutrients affecting public health (34).
However, most Latin American countries have developed their own models or modified the original criteria proposed by PAHO with input from various sectors, including the food industry (32, 35). On this matter, a recent systematic review (36) indicates that NPMs developed with participation from the food industry often have less stringent criteria compared to those involving independent academic experts.
In the case of Peru, a study documented multiple changes in the technical parameters during the formulation of the Healthy Eating Law and its regulations. These changes were related, among other factors, to the lack of political consensus and the active opposition of the food industry, which exerted pressure to delay implementation and to make the regulation more flexible. As a result, a more flexible approach was ultimately adopted, based on the technical parameters established in Chile (37).
By contrast, the thresholds defined by PAHO are stricter, as they set lower limits on the content of sugars, saturated fats, and sodium compared to other national regulations (31). This greater rigor aims to provide a higher level of health protection, especially during childhood, and to serve as a technical reference standard for designing policies that promote healthier food environments (34).
The use of warning nutritional labeling, as part of a comprehensive policy that includes restrictions on the advertising and marketing of foods high in critical nutrients, has shown a positive impact on purchasing decisions and the reformulation of the nutritional content of processed foods in Latin American countries (35). For example, 2 years after the implementation of the first phase of the national warning nutritional labeling policy in Peru, a study reported a decrease in sugar content in beverages, which in turn led to a reduction from 59 to 31% in the percentage of products that would require high-sugar labeling, compared to the phase before implementation. Similarly, a reduction in saturated fat content in foods was observed, decreasing the percentage of products high in saturated fats from 82 to 62% (24).
On the other hand, an important aspect in the context of implementing a warning nutrition labeling system concerns the criteria that determine which foods and beverages are subject to regulation (38). Often, infant formulas are considered “foods for special dietary uses (FSDU)” and are not included in the scope of warning nutrition labeling policies (38). However, these products were one of the main contributors to the high proportion of foods high in sugar and saturated fats observed in our study. Therefore, their exclusion could represent a limitation on consumers’ right to be adequately informed and discourage the food industry from reformulating their nutritional content (24).
Added sugars were present in all breastmilk substitutes, 67% of infant cereals, and 54% of pureed foods. Additionally, between 74.5 and 83% of the products included in our study had excessive sugar content. Excessive sugar content in infant foods has been widely reported by various studies around the world (15, 39–41), and is a cause for concern because these are calorically dense, non-nutritive elements, and repeated and excessive exposure can reinforce the innate preference for sweet taste in children, affect the overall diet quality, displace the consumption of more nutritionally valuable foods, promote excessive weight gain, and increase the risk of non-communicable diseases (42, 43). For this reason, various guidelines, such as the WHO complementary feeding guidelines and the U. S. Dietary Guidelines, now recommend that children under 2 years old avoid consuming foods high in sugar or with added sugars, and sweetened beverages (44, 45).
With respect to sodium content, less than 10% of the products included in our study were classified as high in sodium. These findings were consistent with those reported by Saavedra-Garcia et al. (24) in a study conducted in Peru to compare the impact of the first phase of the implementation of Law No. 30021 on the content of critical nutrients in foods and beverages. In that study, the researchers reported a low number of high-sodium products, even before the implementation of the Law. Interestingly, the authors suggest that this effect could be an indirect result of the prior implementation of regulations on sodium content in neighboring countries like Chile, which may have led to the reformulation of products also distributed by transnational companies in the Peruvian market (24).
Concerning saturated fat content, around 40% of the included products had excessive levels. However, there were significant differences within the groups. While excess saturated fat was present in less than 10% of cereals and in none of the pureed foods, between 70 and 80% of breastmilk substitutes had excessive levels of this critical nutrient. Additionally, the median saturated fat content in breastmilk substitutes was nearly 8 g (data not shown), which was even higher than the median observed for processed foods before the implementation of Law No. 30021 (24).
This situation is particularly concerning considering that, in Peru, the consumption of breastmilk substitutes among children under 3 years of age almost doubled, increasing from approximately 8% in 2010 to 14% in 2019 (46, 47). The increase was especially pronounced among infants under 6 months of age, where prevalence rose from 19.3 to 52.9% over the same period. Such trends may contribute to early and excessive intake of saturated fats, contradicting the WHO recommendation to reduce their consumption in children to less than 10% of total energy intake (48). The significant contribution of breastmilk substitutes to saturated fat intake has also been documented in countries such as the United States, where 90% of the saturated fats consumed by children under 1 year of age came from these types of products (49).
The growing consumption of ultra-processed foods observed in Peru (23) and the sustained increase in childhood overweight, which has doubled over the past 15 years to affect 10.8% of children under 5 years of age (21, 22), may reflect a food environment that promotes unhealthy dietary patterns from the earliest stages of life, contributing to the persistence of excess weight with significant health and economic consequences. In this regard, it is estimated that between 2025 and 2092, the total direct and indirect costs attributable to childhood and adolescent overweight and obesity in Peru will amount to 210.6 billion dollars (50), underscoring the urgency of implementing policies and strategies aimed at improving the nutritional quality of foods intended for this population.
Nonetheless, we must consider some potential limitations of our study. First, products were acquired from supermarkets and selected pharmacies. This may have limited the identification of products distributed through other channels, such as those marketed as part of social assistance programs, sold in bulk in low-income communities, or commercialized via e-commerce platforms. However, we believe that the stores selected in our study represent the locations with the highest sales volume of these products and thus reflect the infant foods with the greatest availability for the Peruvian population. Future studies could expand this scope by incorporating multi-channel sampling strategies and laboratory analyses to comprehensively assess the nutritional quality of breastmilk substitutes and foods across all socioeconomic contexts.
Secondly, our analysis was based on information declared on the product labels. In this regard, we found that 40% of breastmilk substitutes did not report sugar and/or saturated fat content, making it impossible to evaluate the nutritional profile for these two critical nutrients in those products. Additionally, some studies (51, 52) have reported discrepancies between the nutritional information declared on infant food labels and the analytical values derived from laboratory tests. Therefore, there is a need to update nutritional labeling regulations in Peru to mandatorily include reporting of critical nutrients such as sugar, trans fats, and saturated fats, and, at the same time, future studies are needed to confirm our findings through laboratory determinations.
Finally, we only selected one unit of each product, regardless of size or flavor. This could be a limitation considering that some labeling characteristics might change according to the packaging dimensions. Similarly, different flavors of the same product could vary in their nutritional composition, although we believe that this would not significantly alter the critical nutrients of interest for our study.
5 Conclusion
Our study identified that most foods marketed for children under 3 years old in Lima Metropolitan Area contain added sugars and excessive amounts of critical nutrients such as sugars (totals or added) and saturated fats. Breastmilk substitutes were among the main products that contributed to these results. Finally, the use of the technical parameters proposed by PAHO allowed for the identification of a higher number of products high in critical nutrients compared to the current parameters established by Law No. 30021.
Data availability statement
The datasets presented in this study can be found in online repositories. The names of the repository/repositories and accession number(s) can be found at: https://doi.org/10.6084/m9.figshare.29914136.v1.
Author contributions
AA: Data curation, Formal analysis, Investigation, Methodology, Visualization, Writing – original draft, Writing – review & editing. JC-L: Data curation, Formal analysis, Investigation, Visualization, Writing – original draft, Writing – review & editing. BQ-Q: Conceptualization, Methodology, Project administration, Supervision, Writing – original draft, Writing – review & editing. JM: Conceptualization, Methodology, Project administration, Supervision, Writing – original draft, Writing – review & editing. PV-D: Conceptualization, Methodology, Supervision, Writing – original draft, Writing – review & editing. GS-S: Methodology, Writing – original draft, Writing – review & editing. BM-C: Writing – original draft, Writing – review & editing. MU: Funding acquisition, Writing – original draft, Writing – review & editing. FP-C: Supervision, Writing – original draft, Writing – review & editing.
Funding
The author(s) declare that financial support was received for the research and/or publication of this article. This research was funded by the Directorate of Health Promotion of the Ministry of Health and the United Nations Children’s Fund (UNICEF) of Peru.
Conflict of interest
The authors declare that the research was conducted in the absence of any commercial or financial relationships that could be construed as a potential conflict of interest.
Generative AI statement
The authors declare that no Gen AI was used in the creation of this manuscript.
Any alternative text (alt text) provided alongside figures in this article has been generated by Frontiers with the support of artificial intelligence and reasonable efforts have been made to ensure accuracy, including review by the authors wherever possible. If you identify any issues, please contact us.
Publisher’s note
All claims expressed in this article are solely those of the authors and do not necessarily represent those of their affiliated organizations, or those of the publisher, the editors and the reviewers. Any product that may be evaluated in this article, or claim that may be made by its manufacturer, is not guaranteed or endorsed by the publisher.
Supplementary material
The Supplementary material for this article can be found online at: https://www.frontiersin.org/articles/10.3389/fnut.2025.1592172/full#supplementary-material
References
1. Bai, J, Cui, J, Shi, F, and Yu, C. Global epidemiological patterns in the burden of main non-communicable diseases, 1990-2019: relationships with socio-demographic index. Int J Public Health. (2023) 68:1605502. doi: 10.3389/ijph.2023.1605502
2. NCD Countdown 2030 Collaborators. NCD countdown 2030: worldwide trends in non-communicable disease mortality and progress towards sustainable development goal target 3.4. Lancet. (2018) 392:1072–88. doi: 10.1016/S0140-6736(18)31992-5
3. Barouki, R, Gluckman, PD, Grandjean, P, Hanson, M, and Heindel, JJ. Developmental origins of non-communicable disease: implications for research and public health. Environ Health. (2012) 11:42. doi: 10.1186/1476-069X-11-42
4. Brumana, L, Arroyo, A, Schwalbe, NR, Lehtimaki, S, and Hipgrave, DB. Maternal and child health services and an integrated, life-cycle approach to the prevention of non-communicable diseases. BMJ Glob Health. (2017) 2:e000295. doi: 10.1136/bmjgh-2017-000295
5. Lutter, CK, Grummer-Strawn, L, and Rogers, L. Complementary feeding of infants and young children 6 to 23 months of age. Nutr Rev. (2021) 79:825–46. doi: 10.1093/nutrit/nuaa143
6. Mahmood, L, Flores-Barrantes, P, Moreno, LA, Manios, Y, and Gonzalez-Gil, EM. The influence of parental dietary behaviors and practices on children’s eating habits. Nutrients. (2021) 13:1138. doi: 10.3390/nu13041138
7. Macaulay, EC, Donovan, EL, Leask, MP, Bloomfield, FH, Vickers, MH, Dearden, PK, et al. The importance of early life in childhood obesity and related diseases: a report from the 2014 gravida strategic summit. J Dev Orig Health Dis. (2014) 5:398–407. doi: 10.1017/S2040174414000488
8. World Health Organization. Infant and young child feeding: model chapter for textbooks for medical students and allied health professionals. Geneva: WHO (2009).
9. da Rocha, KF, de Araújo, CR, de Morais, IL, Padrão, P, Moreira, P, and Ribeiro, KD d S. Commercial foods for infants under the age of 36 months: an assessment of the availability and nutrient profile of ultra-processed foods. Public Health Nutr. (2021) 24:3179–86. doi: 10.1017/S1368980021001555
10. Monteiro, CA, Cannon, G, Levy, RB, Moubarac, J-C, Louzada, ML, Rauber, F, et al. Ultra-processed foods: what they are and how to identify them. Public Health Nutr. (2019) 22:936–41. doi: 10.1017/S1368980018003762
11. Dunford, EK, and Popkin, BM. Ultra-processed food for infants and toddlers; dynamics of supply and demand. Bull World Health Organ. (2023) 101:358–60. doi: 10.2471/BLT.22.289448
12. Baker, P, Santos, T, Neves, PA, Machado, P, Smith, J, Piwoz, E, et al. First-food systems transformations and the ultra-processing of infant and young child diets: the determinants, dynamics and consequences of the global rise in commercial milk formula consumption. Matern Child Nutr. (2021) 17:e13097. doi: 10.1111/mcn.13097
13. Bassetti, E, Zehner, E, Mayhew, SH, Nasser, N, Mulder, A, Badham, J, et al. Nutrient profiles of commercially produced complementary foods available in Cambodia, Indonesia and the Philippines. Public Health Nutr. (2022) 25:2720–30. doi: 10.1017/S1368980022001483
14. Bassetti, E, Khosravi, A, and Pries, AM. Prevalence of front-of-pack warning signs among commercial complementary foods in seven high and upper middle-income countries. Nutrients. (2023) 15:1629. doi: 10.3390/nu15071629
15. Khosravi, A, Bassetti, E, Yuen-Esco, K, Sy, NY, Kane, R, Sweet, L, et al. Nutrient profiles of commercially produced complementary foods available in Burkina Faso, Cameroon, Ghana, Nigeria and Senegal. Nutrients. (2023) 15:2279. doi: 10.3390/nu15102279
16. Louzada, ML da C, Costa, CDS, Souza, TN, Cruz, GLda, Levy, RB, and Monteiro, CA. Impact of the consumption of ultra-processed foods on children, adolescents and adults’ health: scope review. Cad Saude Publica (2022) 37:e00323020. doi: 10.1590/0102-311X00323020
17. Costa, CS, Del-Ponte, B, Assunção, MCF, and Santos, IS. Consumption of ultra-processed foods and body fat during childhood and adolescence: a systematic review. Public Health Nutr. (2018) 21:148–59. doi: 10.1017/S1368980017001331
18. Markey, O, Pradeilles, R, Goudet, S, Griffiths, PL, Boxer, B, Carroll, C, et al. Unhealthy food and beverage consumption during childhood and risk of cardiometabolic disease: a systematic review of prospective cohort studies. J Nutr. (2023) 153:176–89. doi: 10.1016/j.tjnut.2022.11.013
19. De Amicis, R, Mambrini, SP, Pellizzari, M, Foppiani, A, Bertoli, S, Battezzati, A, et al. Ultra-processed foods and obesity and adiposity parameters among children and adolescents: a systematic review. Eur J Nutr. (2022) 61:2297–311. doi: 10.1007/s00394-022-02873-4
20. Neri, D, Steele, EM, Khandpur, N, Cediel, G, Zapata, ME, Rauber, F, et al. Ultraprocessed food consumption and dietary nutrient profiles associated with obesity: a multicountry study of children and adolescents. Obes Rev. (2022) 23:e13387. doi: 10.1111/obr.13387
21. Huamani-Champi, W. Factores Asociados a Sobrepeso y Obesidad En Niños Menores de 5 Años Según ENDES 2020. Master’s thesis. Lima, Perú: Universidad Ricardo Palma (2022).
22. Tarqui-Mamani, C, Alvarez-Dongo, D, Espinoza-Oriundo, P, Sanchez-Abanto, J, Tarqui-Mamani, C, Alvarez-Dongo, D, et al. Análisis de la tendencia del sobrepeso y obesidad en la población peruana. Rev Esp Nutr Hum Diet. (2017) 21:137–47. doi: 10.14306/renhyd.21.2.312
23. Pan American Health Organization. Ultra-processed food and drink products in Latin America: sales, sources, nutrient profiles and policy implications. Washington, DC: PAHO (2019).
24. Saavedra-Garcia, L, Meza-Hernández, M, Diez-Canseco, F, and Taillie, LS. Reformulation of top-selling processed and ultra-processed foods and beverages in the Peruvian food supply after front-of-package warning label policy. Int J Environ Res Public Health. (2022) 20:424. doi: 10.3390/ijerph20010424
25. Del Alcazar-Bardales, AK, Rojas Benites, IK, and Tafur Gutiérrez, MN. Valorización de supermercados peruanos. Master’s Thesis. Lima, Perú: Universidad del Pacífico (2019).
26. Ministerio de Salud del Perú. Decreto Supremo que aprueba el Reglamento de la Ley No. 30021, Ley de Promoción de la Alimentación Saludable - Decreto Supremo No. 017-2017-SA. Lima, Perú: Ministerio de Salud del Perú. (2017). Available online at: https://busquedas.elperuano.pe/dispositivo/NL/1534348-4 (Accessed July 29, 2024)
27. Organización Panamericana de la Salud. Nota Técnico-Jurídica de la Organización Panamericana de la Salud / Organización Mundial de la Salud respecto a modificaciones al D.S. N° 017-2017-SA. Lima, Perú: Organización Panamericana de la Salud (2022).
28. Karageuzián, G, Vidal, L, de León, C, Girona, A, and Ares, G. Marketing of commercial foods for infant and young children in Uruguay: sugary products, health cues on packages and fun social products on Facebook. Public Health Nutr. (2021) 24:5963–75. doi: 10.1017/S1368980021002780
29. Torres-Schiaffino, D, and Saavedra-Garcia, L. Relationship between marketing to children on food labeling and critical nutrient content in processed and ultra-processed products sold in supermarkets in Lima, Peru. Nutrients. (2020) 12:3666. doi: 10.3390/nu12123666
30. Giménez, A, Saldamando, Lde, Curutchet, MR, and Ares, G Package design and nutritional profile of foods targeted at children in supermarkets in Montevideo, Uruguay Cad Saude Publica (2017) 33:e00032116 doi: 10.1590/0102-311X00032116
31. Borges, CA, Khandpur, N, Neri, D, and Duran, AC. Comparing Latin American nutrient profile models using data from packaged foods with child-directed marketing within the Brazilian food supply. Front Nutr. (2022) 9:920710. doi: 10.3389/fnut.2022.920710
32. Contreras-Manzano, A, Jáuregui, A, Velasco-Bernal, A, Vargas-Meza, J, Rivera, JA, Tolentino-Mayo, L, et al. Comparative analysis of the classification of food products in the Mexican market according to seven different nutrient profiling systems. Nutrients. (2018) 10:737. doi: 10.3390/nu10060737
33. Ares, G, Antúnez, L, Cabrera, M, and Thow, AM. Analysis of the policy process for the implementation of nutritional warning labels in Uruguay. Public Health Nutr. (2021) 24:5927–40. doi: 10.1017/S1368980021002469
34. Organización Panamericana de la Salud. Modelo de perfil de nutrientes de la Organización Panamericana de la Salud. Washington, DC: OPS (2016).
35. Crosbie, E, Gomes, FS, Olvera, J, Rincón-Gallardo Patiño, S, Hoeper, S, and Carriedo, A. A policy study on front-of-pack nutrition labeling in the Americas: emerging developments and outcomes. Lancet Reg Health Am. (2023) 18:100400. doi: 10.1016/j.lana.2022.100400
36. Martin, C, Turcotte, M, Cauchon, J, Lachance, A, Pomerleau, S, Provencher, V, et al. Systematic review of nutrient profile models developed for nutrition-related policies and regulations aimed at noncommunicable disease prevention -an update. Adv Nutr. (2023) 14:1499–522. doi: 10.1016/j.advnut.2023.08.013
37. Alvarez-Cano, J, Cavero, V, and Diez-Canseco, F. The comings and goings of the design of the healthy eating policy in Peru: a comparative analysis of its regulatory documents. Rev Peru Med Exp Salud Publica. (2022) 39:480–8. doi: 10.17843/rpmesp.2022.394.11896
38. Duran, AC, Ricardo, CZ, Mais, LA, and Bortoletto Martins, AP. Role of different nutrient profiling models in identifying targeted foods for front-of-package food labelling in Brazil. Public Health Nutr. (2021) 24:1514–25. doi: 10.1017/S1368980019005056
39. Maalouf, J, Cogswell, ME, Bates, M, Yuan, K, Scanlon, KS, Pehrsson, P, et al. Sodium, sugar, and fat content of complementary infant and toddler foods sold in the United States, 2015. Am J Clin Nutr. (2017) 105:1443–52. doi: 10.3945/ajcn.116.142653
40. Grammatikaki, E, Wollgast, J, and Caldeira, S. High levels of nutrients of concern in baby foods available in Europe that contain sugar-contributing ingredients or are ultra-processed. Nutrients. (2021) 13:3105. doi: 10.3390/nu13093105
41. Hutchinson, J, Rippin, H, Threapleton, D, Jewell, J, Kanamäe, H, Salupuu, K, et al. High sugar content of European commercial baby foods and proposed updates to existing recommendations. Matern Child Nutr. (2021) 17:e13020. doi: 10.1111/mcn.13020
42. Fidler Mis, N, Braegger, C, Bronsky, J, Campoy, C, Domellöf, M, Embleton, ND, et al. Sugar in infants, children and adolescents: a position paper of the European Society for Paediatric Gastroenterology, hepatology and nutrition committee on nutrition. J Pediatr Gastroenterol Nutr. (2017) 65:681–96. doi: 10.1097/MPG.0000000000001733
43. Murray, RD. Savoring Sweet: sugars in infant and toddler feeding. Ann Nutr Metab. (2017) 70:38–46. doi: 10.1159/000479246
44. U.S. Department of Agriculture, U.S. Department of Health and Human Services. Dietary guidelines for Americans, 2020–2025. Washington, DC: USDA/HHS (2020).
45. World Health Organization. WHO guideline for complementary feeding of infants and young children 6–23 months of age. Geneva: WHO (2023).
46. Instituto Nacional de Estadística e Informática. Perú: Encuesta Demográfica y de Salud Familiar 2010. Available online at: https://proyectos.inei.gob.pe/endes/2010/endes00/index.html (Accessed August 13, 2025)
47. Instituto Nacional de Salud. Estado nutricional y consumo de alimentos del niño menor de 3 años de la Encuesta Vigilancia Alimentaria y Nutricional por Etapas de Vida - VIANEV 2019. Available online at: https://cdn.www.gob.pe/uploads/document/file/4527287/Informe%20Tecnico%20%20VIANEV%20ni%C3%B1os%20menores%20de%205%20a%C3%B1os%202019AhJW9.pdf?v=1683566457 (Accessed August 13, 2025).
48. World Health Organization. Saturated fatty acid and trans-fatty acid intake for adults and children WHO guideline. Geneva: WHO (2023).
49. Wang, Y, Guglielmo, D, and Welsh, JA. Consumption of sugars, saturated fat, and sodium among US children from infancy through preschool age, NHANES 2009-2014. Am J Clin Nutr. (2018) 108:868–77. doi: 10.1093/ajcn/nqy168
50. Ugaz, ME, Meyer, CL, Jackson-Morris, AM, Wu, D, Jimenez, MM, Rojas-Davila, C, et al. The case for investment in nutritional interventions to prevent and reduce childhood and adolescent overweight and obesity in Peru: a modelling study. Int J Behav Nutr Phys Act. (2024) 21:127. doi: 10.1186/s12966-024-01677-5
51. Walker, RW, and Goran, MI. Laboratory determined sugar content and composition of commercial infant formulas, baby foods and common grocery items targeted to children. Nutrients. (2015) 7:5850–67. doi: 10.3390/nu7075254
Keywords: ultra-processed foods, infant food, breastmilk substitutes, infant formula, food labeling, legislation food, supermarkets
Citation: Aramburu A, Chupica-Leon JL, Quispe-Quille B, Mariaca J, Velarde-Delgado P, Solis-Sanchez G, Morales-Cahuancama B, Bravo-Rebatta F, Ugaz ME and Polo-Campos F (2025) Comparison between national and PAHO criteria for assessing the nutritional profile of foods intended for children aged 0–3 years marketed in Lima, Peru. Front. Nutr. 12:1592172. doi: 10.3389/fnut.2025.1592172
Edited by:
Thomai Karagiozoglou-Lampoudi, International Hellenic University, GreeceReviewed by:
Efstratia Daskalou, G. Gennimatas General Hospital, GreeceMaria Birman Cavalcanti, Rio de Janeiro State University, Brazil
Copyright © 2025 Aramburu, Chupica-Leon, Quispe-Quille, Mariaca, Velarde-Delgado, Solis-Sanchez, Morales-Cahuancama, Bravo-Rebatta, Ugaz and Polo-Campos. This is an open-access article distributed under the terms of the Creative Commons Attribution License (CC BY). The use, distribution or reproduction in other forums is permitted, provided the original author(s) and the copyright owner(s) are credited and that the original publication in this journal is cited, in accordance with accepted academic practice. No use, distribution or reproduction is permitted which does not comply with these terms.
*Correspondence: Adolfo Aramburu, YWQuYXJhbWJ1cnVAZ21haWwuY29t
†These authors have contributed equally to this work and share first authorship