 Bahareh Amirkalali1
 Mohammad Farahmand2
 Minoo Hasan Rashedi3
 Ali Gholami4,5Fateme Sheikholmolooki6Mohadeseh Sedighi1,7
 Azam Doustmohammadian1*†
- 1Gastrointestinal and Liver Diseases Research Center, Iran University of Medical Sciences, Tehran, Iran
- 2Pediatric Infectious Disease Research Center, Tehran University of Medical Sciences, Tehran, Iran
- 3Department of Nutrition, School of Public Health, Iran University of Medical Sciences, Tehran, Iran
- 4Noncommunicable Diseases Research Center, Neyshabur University of Medical Sciences, Neyshabur, Iran
- 5Workplace Health Research Center, Neyshabur University of Medical Sciences, Neyshabur, Iran
- 6Department of Nutrition, Health and Statistics Surveillance Research Center, Science and Research Branch, Islamic Azad University, Tehran, Iran
- 7Department of Internal Medicine, School of Medicine, Firoozgar General Hospital, Iran University of Medical Sciences, Tehran, Iran
Aim: Chronic inflammation plays a significant role in the progression of non-alcoholic fatty liver disease (NAFLD). Adopting an anti-inflammatory diet can help prevent or mitigate NAFLD and its associated complications. This meta-analysis builds on previous research by examining the association between the Dietary Inflammatory Index (DII) and NAFLD risk, incorporating additional studies and employing rigorous evidence assessment.
Methods: We systematically searched major databases (Cochrane Library, PubMed, Web of Science, and Scopus) from inception to June 2024 for English-language observational studies examining the association between DII and NAFLD prevalence. Pooled odds ratios (ORs) or hazard ratios (HRs) with 95% confidence intervals (CIs) were calculated using random-effects models for studies with significant heterogeneity; otherwise, fixed-effects models were applied. Subgroup analyses were conducted to explore heterogeneity based on body mass index (BMI), DII definition, sample size, geographical region, age, and NAFLD diagnostic criteria. Evidence certainty was assessed using the Grading of Recommendations, Assessment, Development, and Evaluation (GRADE) framework. The study was registered in PROSPERO (CRD42023430798).
Results: Eleven studies (9 cross-sectional with 14 effect sizes and 2 cohort with 2 effect sizes) were analyzed. Higher DII scores were significantly associated with increased NAFLD risk, with a pooled OR of 1.56 (95% CI: 1.24–1.95; p < 0.001) in cross-sectional studies and an HR of 0.21 (95% CI: 0.12–0.30; p < 0.0001) in cohort studies. Subgroup analyses confirmed consistency across BMI ≥ 25, energy-adjusted DII or DII, studies in Asia and Europe, and participants <46 years, with reduced heterogeneity (I2 < 50%) in these categories. GRADE rated the certainty of evidence as “very low.”
Conclusion: Anti-inflammatory diets can reduce NAFLD risk. However, high-quality studies are needed to confirm this association.
1 Introduction
Non-alcoholic fatty liver disease (NAFLD) is a major global health concern, affecting approximately 25% of adults worldwide and imposing a significant economic burden (1, 2). NAFLD is defined as excessive hepatic fat accumulation detected via imaging or biopsy after excluding causes such as excessive alcohol consumption, hepatotoxic medications, toxins, viral infections, or genetic liver disorders (3). The condition spans a spectrum from simple steatosis to non-alcoholic steatohepatitis (NASH), which can lead to fibrosis, cirrhosis, and hepatocellular carcinoma (4).
Chronic inflammation is a key driver of NAFLD pathogenesis and progression (5, 6). In NAFLD, hepatocytes, stressed by lipotoxicity, and immune cells, such as Kupffer cells, release pro-inflammatory cytokines, including tumor necrosis factor-alpha (TNF-α), interleukin-6 (IL-6), C-reactive protein (CRP), and interleukin-1β (IL-1β), which amplify hepatic inflammation (7, 8). These cytokines promote fibrogenesis, causing progression of NAFLD from steatosis to severe liver disease (7). Lifestyle modifications and targeted therapies that address inflammation offer promising strategies to prevent NAFLD progression (9, 10).
Diet plays a critical role in modulating inflammation and reducing NAFLD risk (11, 12). Diets rich in fruits, vegetables, whole grains, and fiber are inversely associated with inflammatory biomarkers, while diets high in refined grains, sweetened beverages, processed meats, and added fats are positively linked to inflammation (13–15). The Dietary Inflammatory Index (DII) was developed based on research linking dietary patterns to inflammatory biomarkers, including pro-inflammatory factors such as CRP, IL-1β, IL-6, and TNF-α, which exacerbate hepatic inflammation and promote NAFLD progression, as well as anti-inflammatory markers such as interleukin-4 (IL-4) and interleukin-10 (IL-10) (16, 17). This index quantifies the inflammatory potential of diets by assigning scores from −8.87 (highly anti-inflammatory) to +7.98 (highly pro-inflammatory) based on 45 food components (17). Anti-inflammatory foods (e.g., fatty fish, nuts, and fruits) receive lower scores, while pro-inflammatory foods (e.g., processed meats and sugary drinks) receive higher scores (17). Higher DII scores are associated with an increased risk of chronic diseases, including cardiovascular disease, diabetes, and NAFLD, underscoring the importance of dietary choices (16, 17).
Despite evidence linking DII to NAFLD (18–21), prior studies are limited by inconsistent designs, small sample sizes, and inadequate confounder adjustment, resulting in uncertain evidence. Qianwen Zhao’s meta-analysis (22) reported a positive association between higher DII scores and increased NAFLD risk but was limited by the exclusion of four high-quality observational studies (18, 20, 23, 24) and the lack of evidence certainty assessments. Our meta-analysis overcomes these limitations by including the four studies (18, 20, 23, 24) and applying the Grading of Recommendations, Assessment, Development, and Evaluation (GRADE) framework to evaluate evidence certainty, resulting in a more robust and precise understanding of the relationship between dietary inflammation and NAFLD risk in adults.
2 Methods
2.1 Search strategy
The meta-analysis was carried out in accordance with the Preferred Reporting Items for Systematic Reviews and Meta-Analyses (PRISMA) guidelines (Supplementary Table S1) (25), and the protocol was registered with PROSPERO (CRD42023430798, Available at: https://www.crd.york.ac.uk/PROSPERO/display_record.php?ID=CRD42023430798). We searched electronic databases, including the Cochrane Library, PubMed, Web of Science, and Scopus, for publications regarding DII and NAFLD, up to December 2024, with no time limit. The literature on DII and NAFLD was searched using the following keywords: dietary inflammatory index (DII), NAFLD, fatty liver, hepatic steatosis, liver steatosis, and steatohepatitis. The search strategy was created using Boolean operators, asterisks, quotation marks, and parentheses. The database-specific search strategies are detailed in Supplementary Table S3. Subsequently, all identified papers were uploaded to the reference management software (EndNote X20, Clarivate Analytics, United States) to coordinate the review process, remove duplicates, and manage citations. To identify relevant articles, three reviewers (AD, FS, and MS) independently evaluated the titles and abstracts of all papers, and further the full text of the eligible studies was appraised. The articles that met the inclusion criteria were kept for data extraction. Additionally, the reference lists of the included articles were reviewed to ensure the thoroughness of searches.
2.2 Study eligibility criteria
The inclusion of a study was guided by the Population, Intervention /Exposure, Comparator, Outcome, and Study (PICOS) framework. Eligible studies were required to meet all the following criteria:
a Study design: Observational studies (cross-sectional, case–control, or cohort) conducted in adults aged ≥18 years.
b Intervention/Exposure: Dietary inflammatory potential assessed using the DII score.
c Outcome: NAFLD, diagnosed via liver ultrasound, fatty liver index (FLI), controlled attenuation parameter (CAP), hepatic steatosis index (HSI), or magnetic resonance imaging (MRI).
d Effect estimates: Reported multivariable-adjusted odds ratios (ORs) or hazard ratios (HRs), with corresponding 95% confidence intervals (CIs), comparing the highest (pro-inflammatory) to the lowest (anti-inflammatory) DII categories.
e Language: Full-text articles published in English.
Studies were excluded if they:
a included participants with secondary hepatic steatosis (e.g., drug-induced), viral hepatitis, cirrhosis, or those receiving enteral or parenteral nutrition;
b were animal studies;
c were non-original research (e.g., reviews, editorials, and conference abstracts) or duplicate publications.
2.3 Data extraction
Three researchers (AD, FS, and BA) independently extracted the following information from the list of included eligible studies: first author’s last name, year of publication, geographic region, study design, sample size, gender distribution, mean age, the method used for NAFLD diagnosis, number of food parameters for DII calculation, DII score range, type of DII data and comparison level, adjusted total effect estimates and their corresponding 95% confidence intervals (CIs), and adjusted confounding factors.
Discrepancies, if any, were discussed and resolved by consensus and arbitration with the research team or experts in the field. If there was any confusion regarding the information, an email was sent to the corresponding author.
2.4 Quality and risk of bias assessment
The quality of eligible studies was evaluated using the Newcastle–Ottawa scale (NOS) (26). This scale consists of three categories: selection, comparability, and exposure. Each component in the selection and exposure categories can only receive one point, but the comparison can receive up to two points. A score of 7 or higher indicated high quality (27). The risk of bias assessment was conducted by using the Risk Of Bias In Non-randomized Studies of Interventions (ROBINS-I) tool in the observational literature (28). The ROBINS-I tool assesses bias based on seven domains, including:
a confounding
b selection of study participants
c classification of exposures
d departure from intended exposure
e missing data
f outcome measurement, and
g selection of reported results.
Studies were categorized as having a low, moderate, serious, or critical risk of bias under each domain. The quality and risk of bias of eligible studies were evaluated separately by two researchers (BA and FS), and the discrepancy, if any, was resolved after a discussion with the principal investigator.
2.5 Evaluating the certainty of the evidence
The level of certainty in the evidence for the main outcomes was evaluated by utilizing the Grading of Recommendations, Assessment, Development, and Evaluation (GRADE) tool (29). The assessment considered factors including risk of bias, inconsistency, indirectness, and imprecision (Table 1).
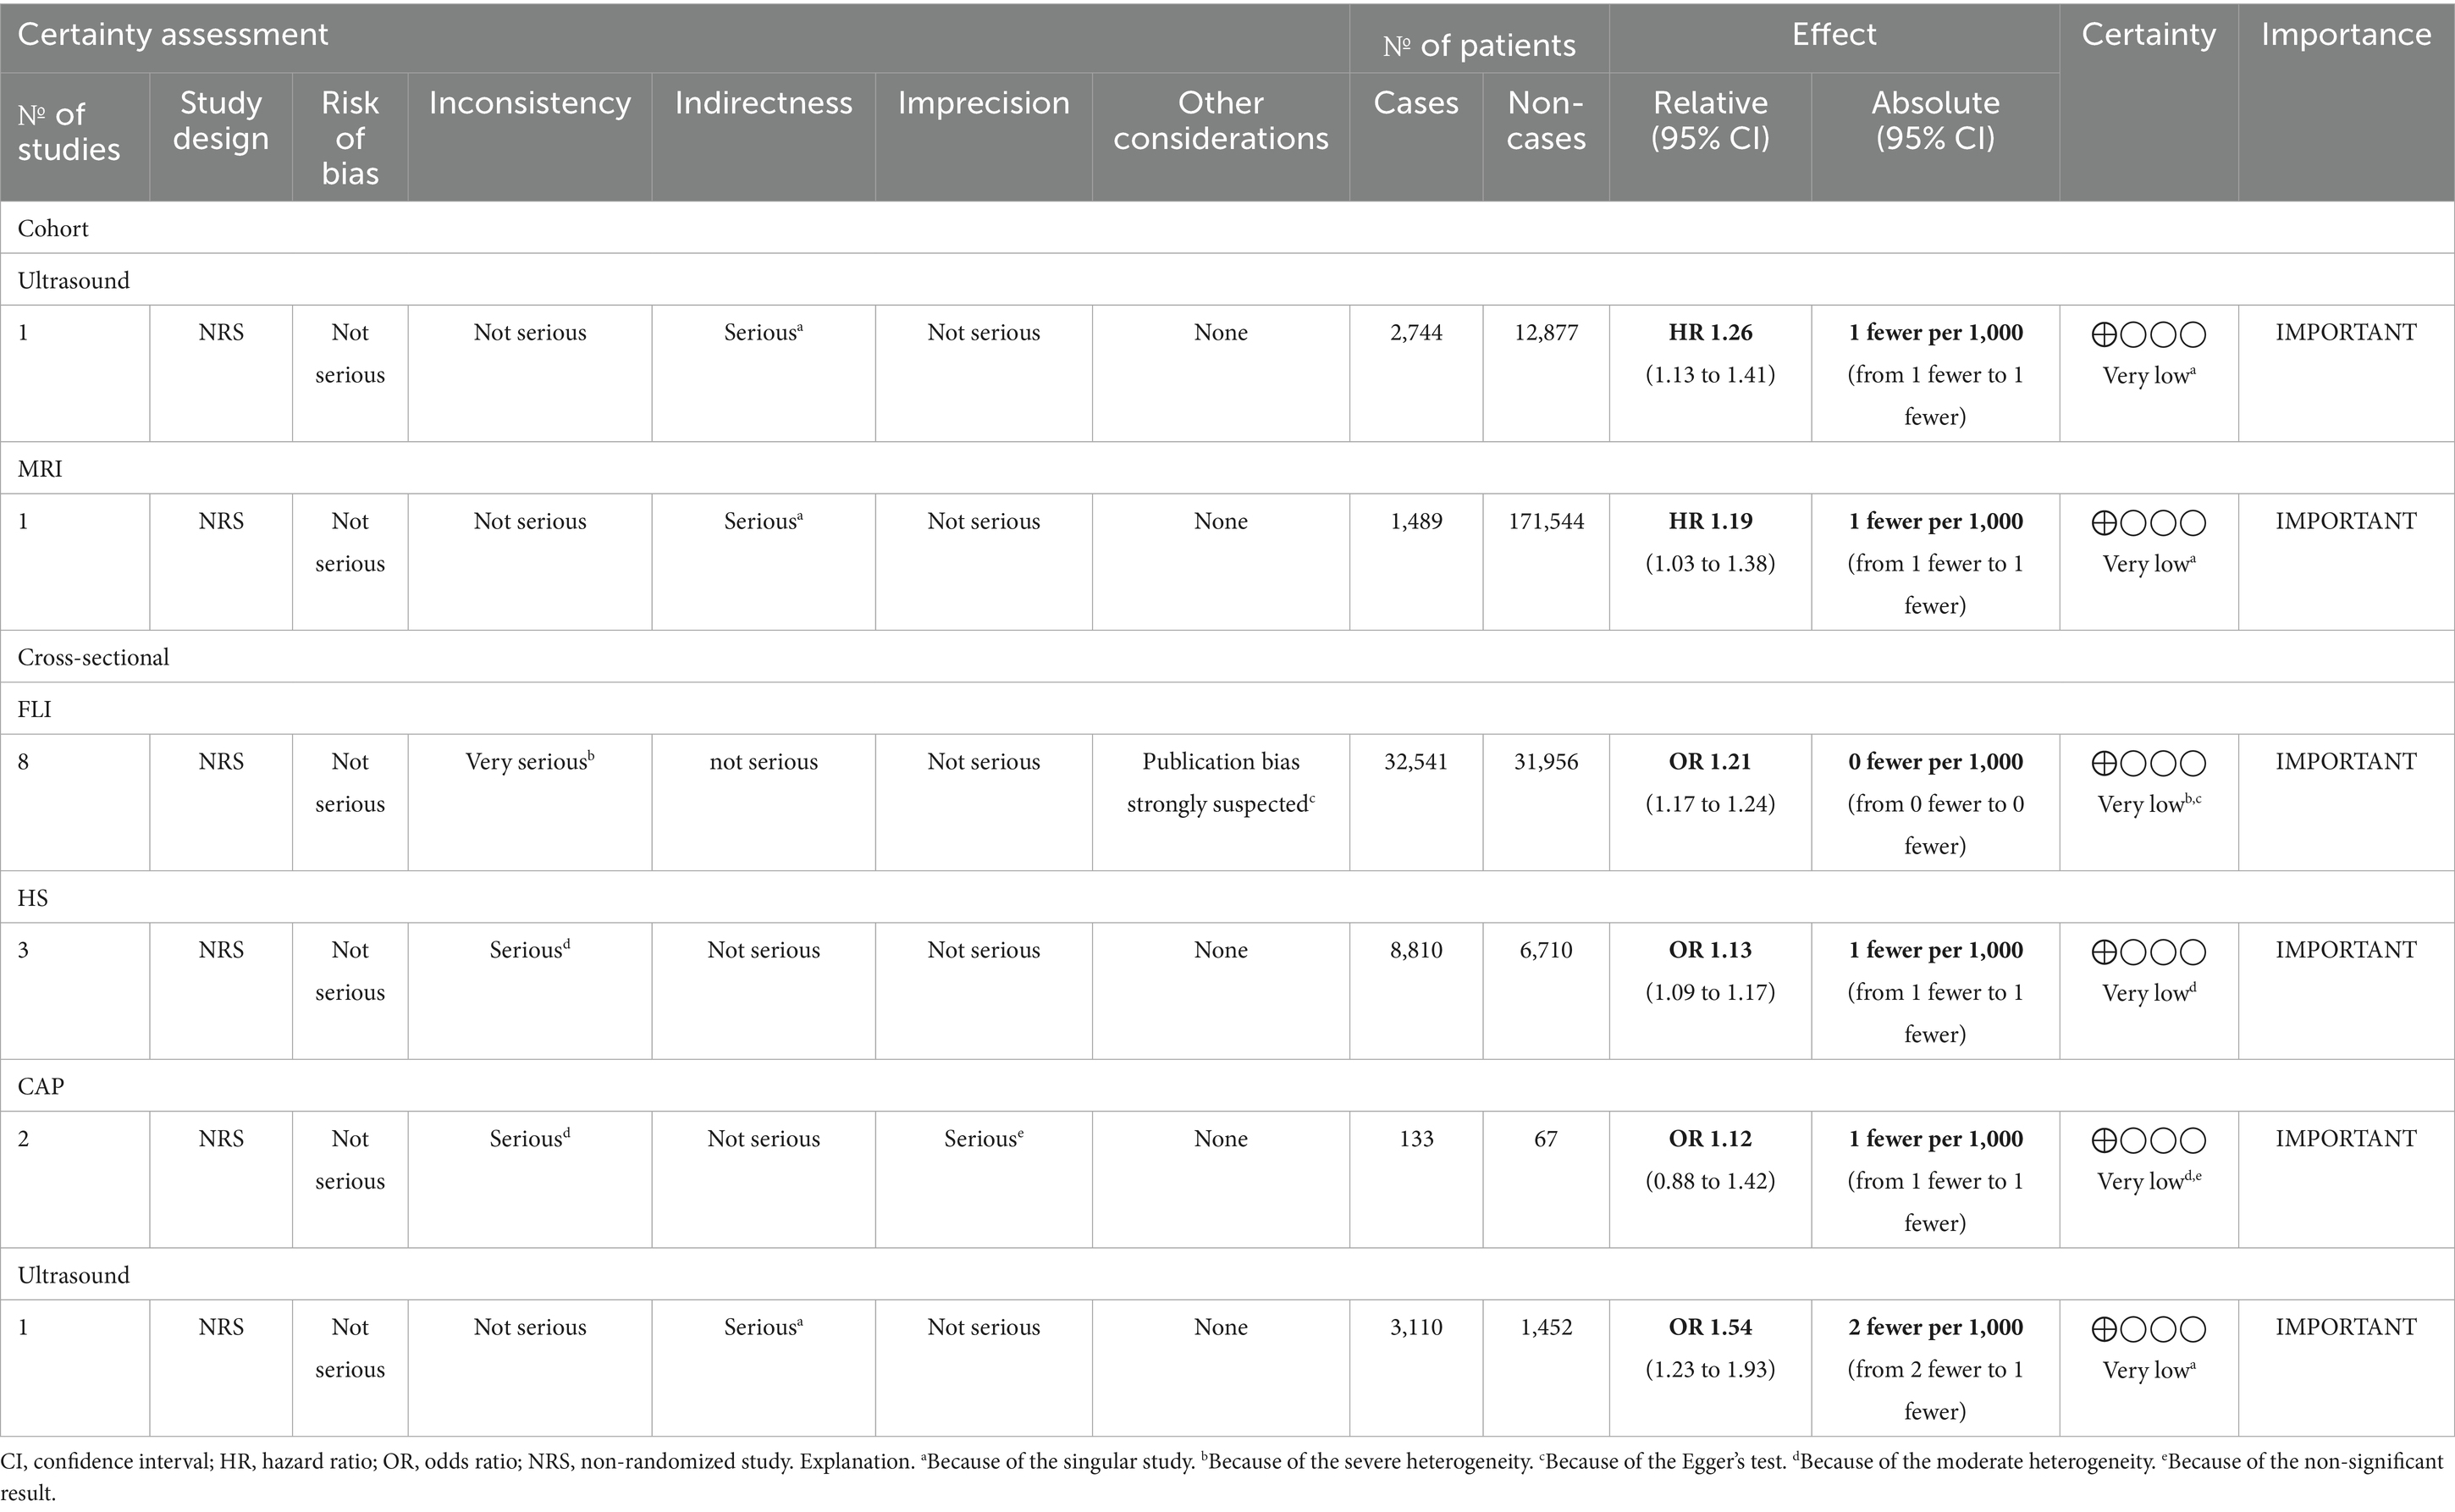
Table 1. Certainty of evidence of primary outcomes using the GRADE tool.
2.6 Statistical analysis
A meta-analysis was conducted utilizing statistical software, Stata version 12.0. Risk estimates from various studies were combined using either a random-effects model or a fixed-effects model to calculate the pooled ORs with 95% CIs. Heterogeneity across studies was assessed based on the Cochrane Q test and I2 statistic. The level of heterogeneity was assessed based on the I2 statistic, with values of 25, 50, and 75% indicating low, moderate, and high heterogeneity, respectively. Significant heterogeneity was set at a p-value of <0.1 for the Cochrane Q test or I2 statistic >50%. A random-effects model was applied when pooled analysis resulted in statistical heterogeneity, and a fixed-effects model was used otherwise. Subgroup analyses were carried out based on the sample size (≤3,042, >3,042), age (<46 years, ≥46 years), BMI (<25, ≥25), study design (cross-sectional, cohort), study regions (Asia, America, Europe), type of DII (energy-adjusted DII (E-DII), DII), and NAFLD diagnosis method (HSI, FLI, CAP, ultrasonography) to investigate the sources of heterogeneity (30, 31).
3 Results
3.1 Literature search and included studies
A systematic search of six databases and citation searches yielded 13,438 articles, with 3,663 duplicates excluded (Figure 1). After screening 9,775 titles and abstracts, 9,740 irrelevant articles (e.g., reviews, non-human studies, congress abstracts, and study protocols) were excluded. Of the 35 full-text articles assessed, 24 were excluded for not meeting the inclusion criteria (e.g., study type, outcome, and exposure; Supplementary Table S2). An updated search added one eligible study (19), resulting in 11 included articles: 9 cross-sectional (18–21, 23, 32–35) and 2 cohort studies (36, 37). Three studies (18, 20, 23) reported 2 NAFLD diagnostic methods, while 1 study (24) reported 3, resulting in 14 effect sizes for cross-sectional studies and 2 for cohort studies, which were analyzed separately.
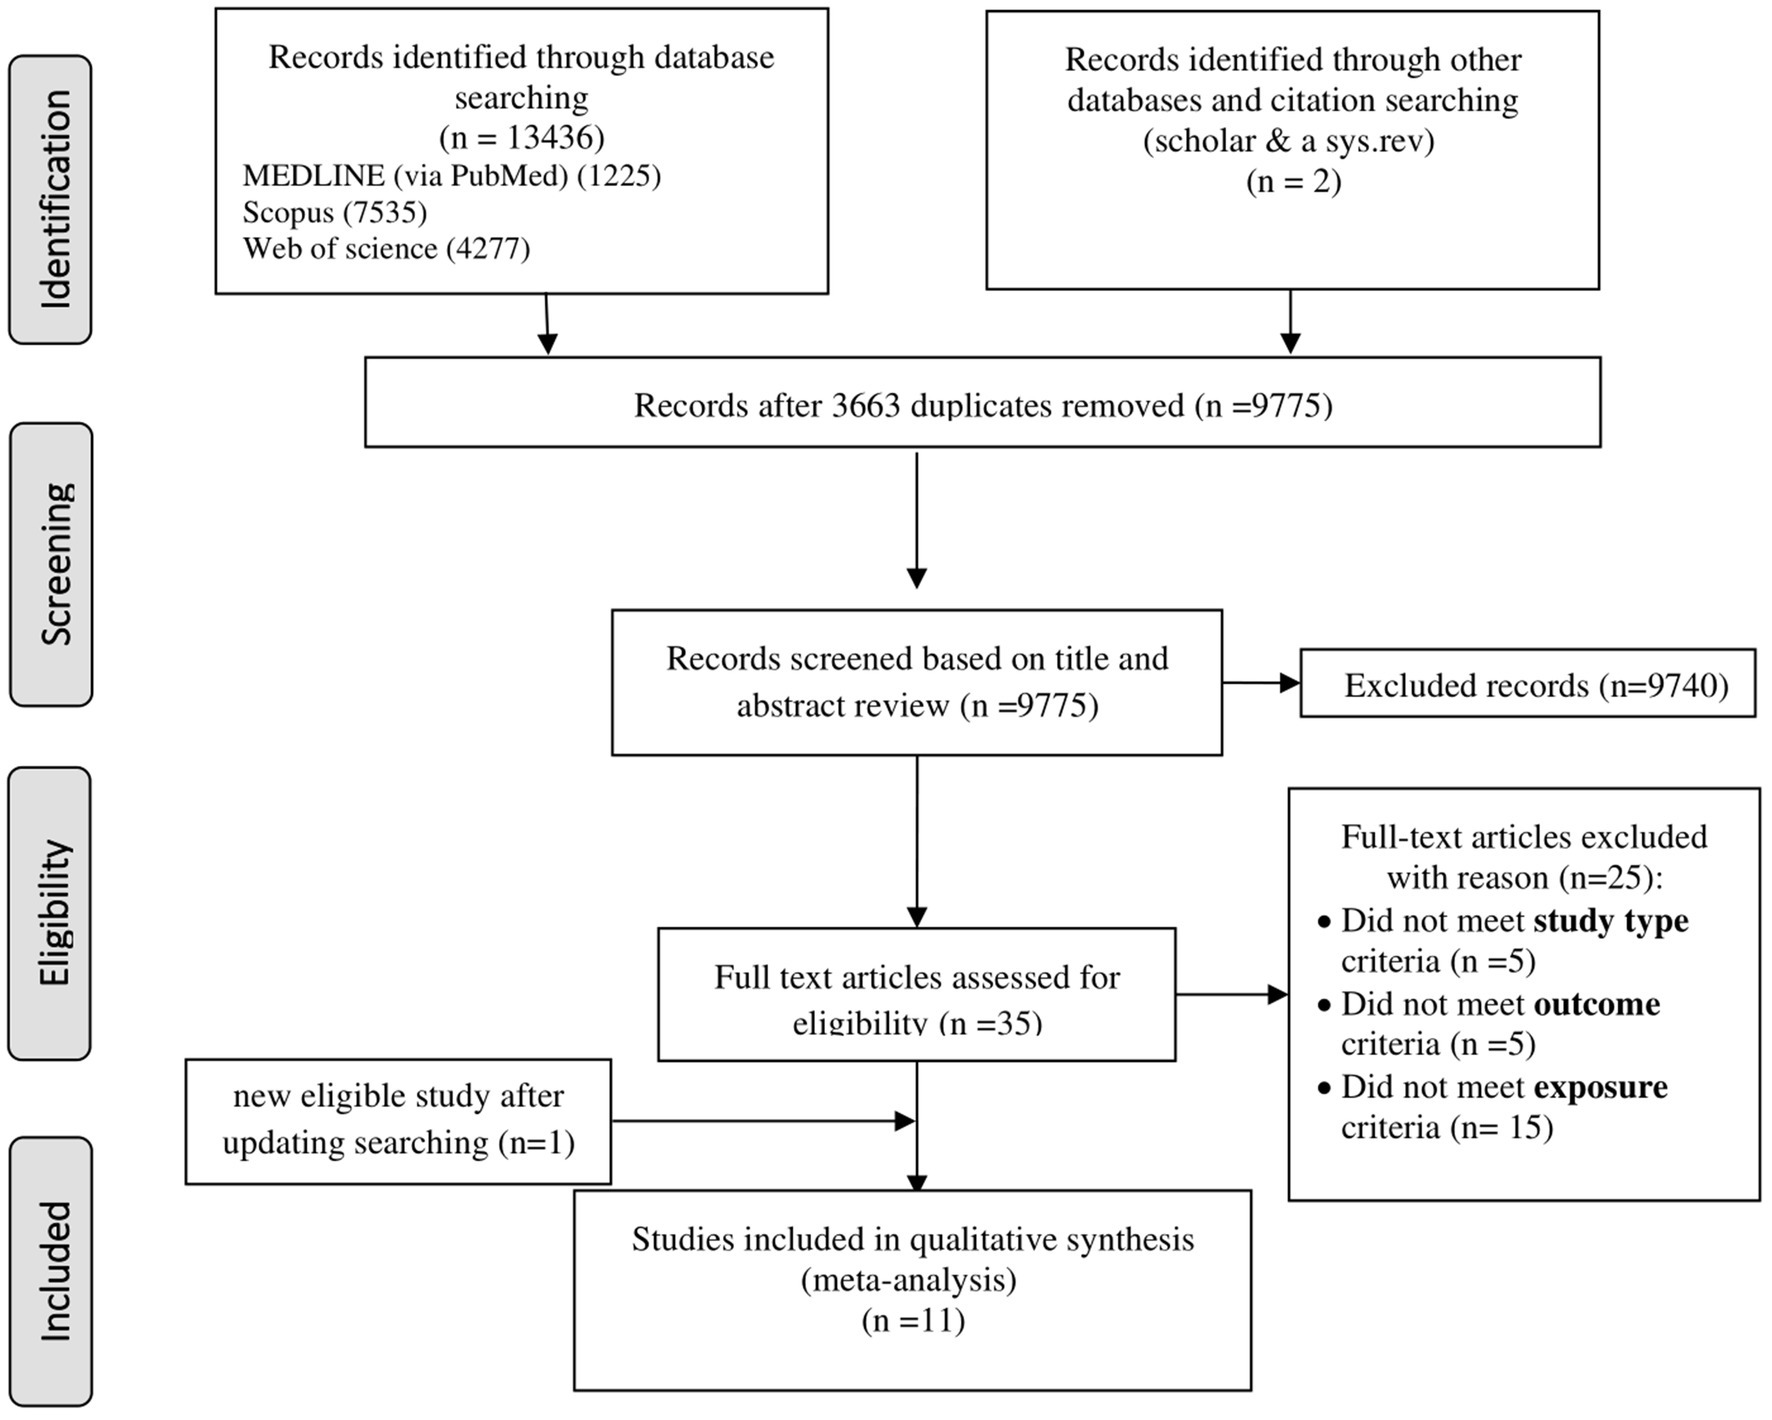
Figure 1. Flowchart of the literature search and selection.
3.2 Study characteristics
The 9 cross-sectional studies included 82,974 participants from the USA [5 studies; (18–20, 32, 35)], Iran [3 studies; (21, 33, 34)], and Greece [1 study; (23)], using various NAFLD diagnostic tools including FLI (8 studies), HSI (3 studies), liver ultrasonography (1 study), and CAP (1 study). Dietary inflammation was assessed via E-DII (4 studies) or DII (5 studies), with ORs comparing the highest and lowest DII quartiles (4 studies) or tertiles (5 studies). The two cohort studies, involving 184,421 participants, assessed dietary inflammation and NAFLD using E-DII with MRI in the United Kingdom (37) and DII with liver ultrasonography in China (36) (Table 2).
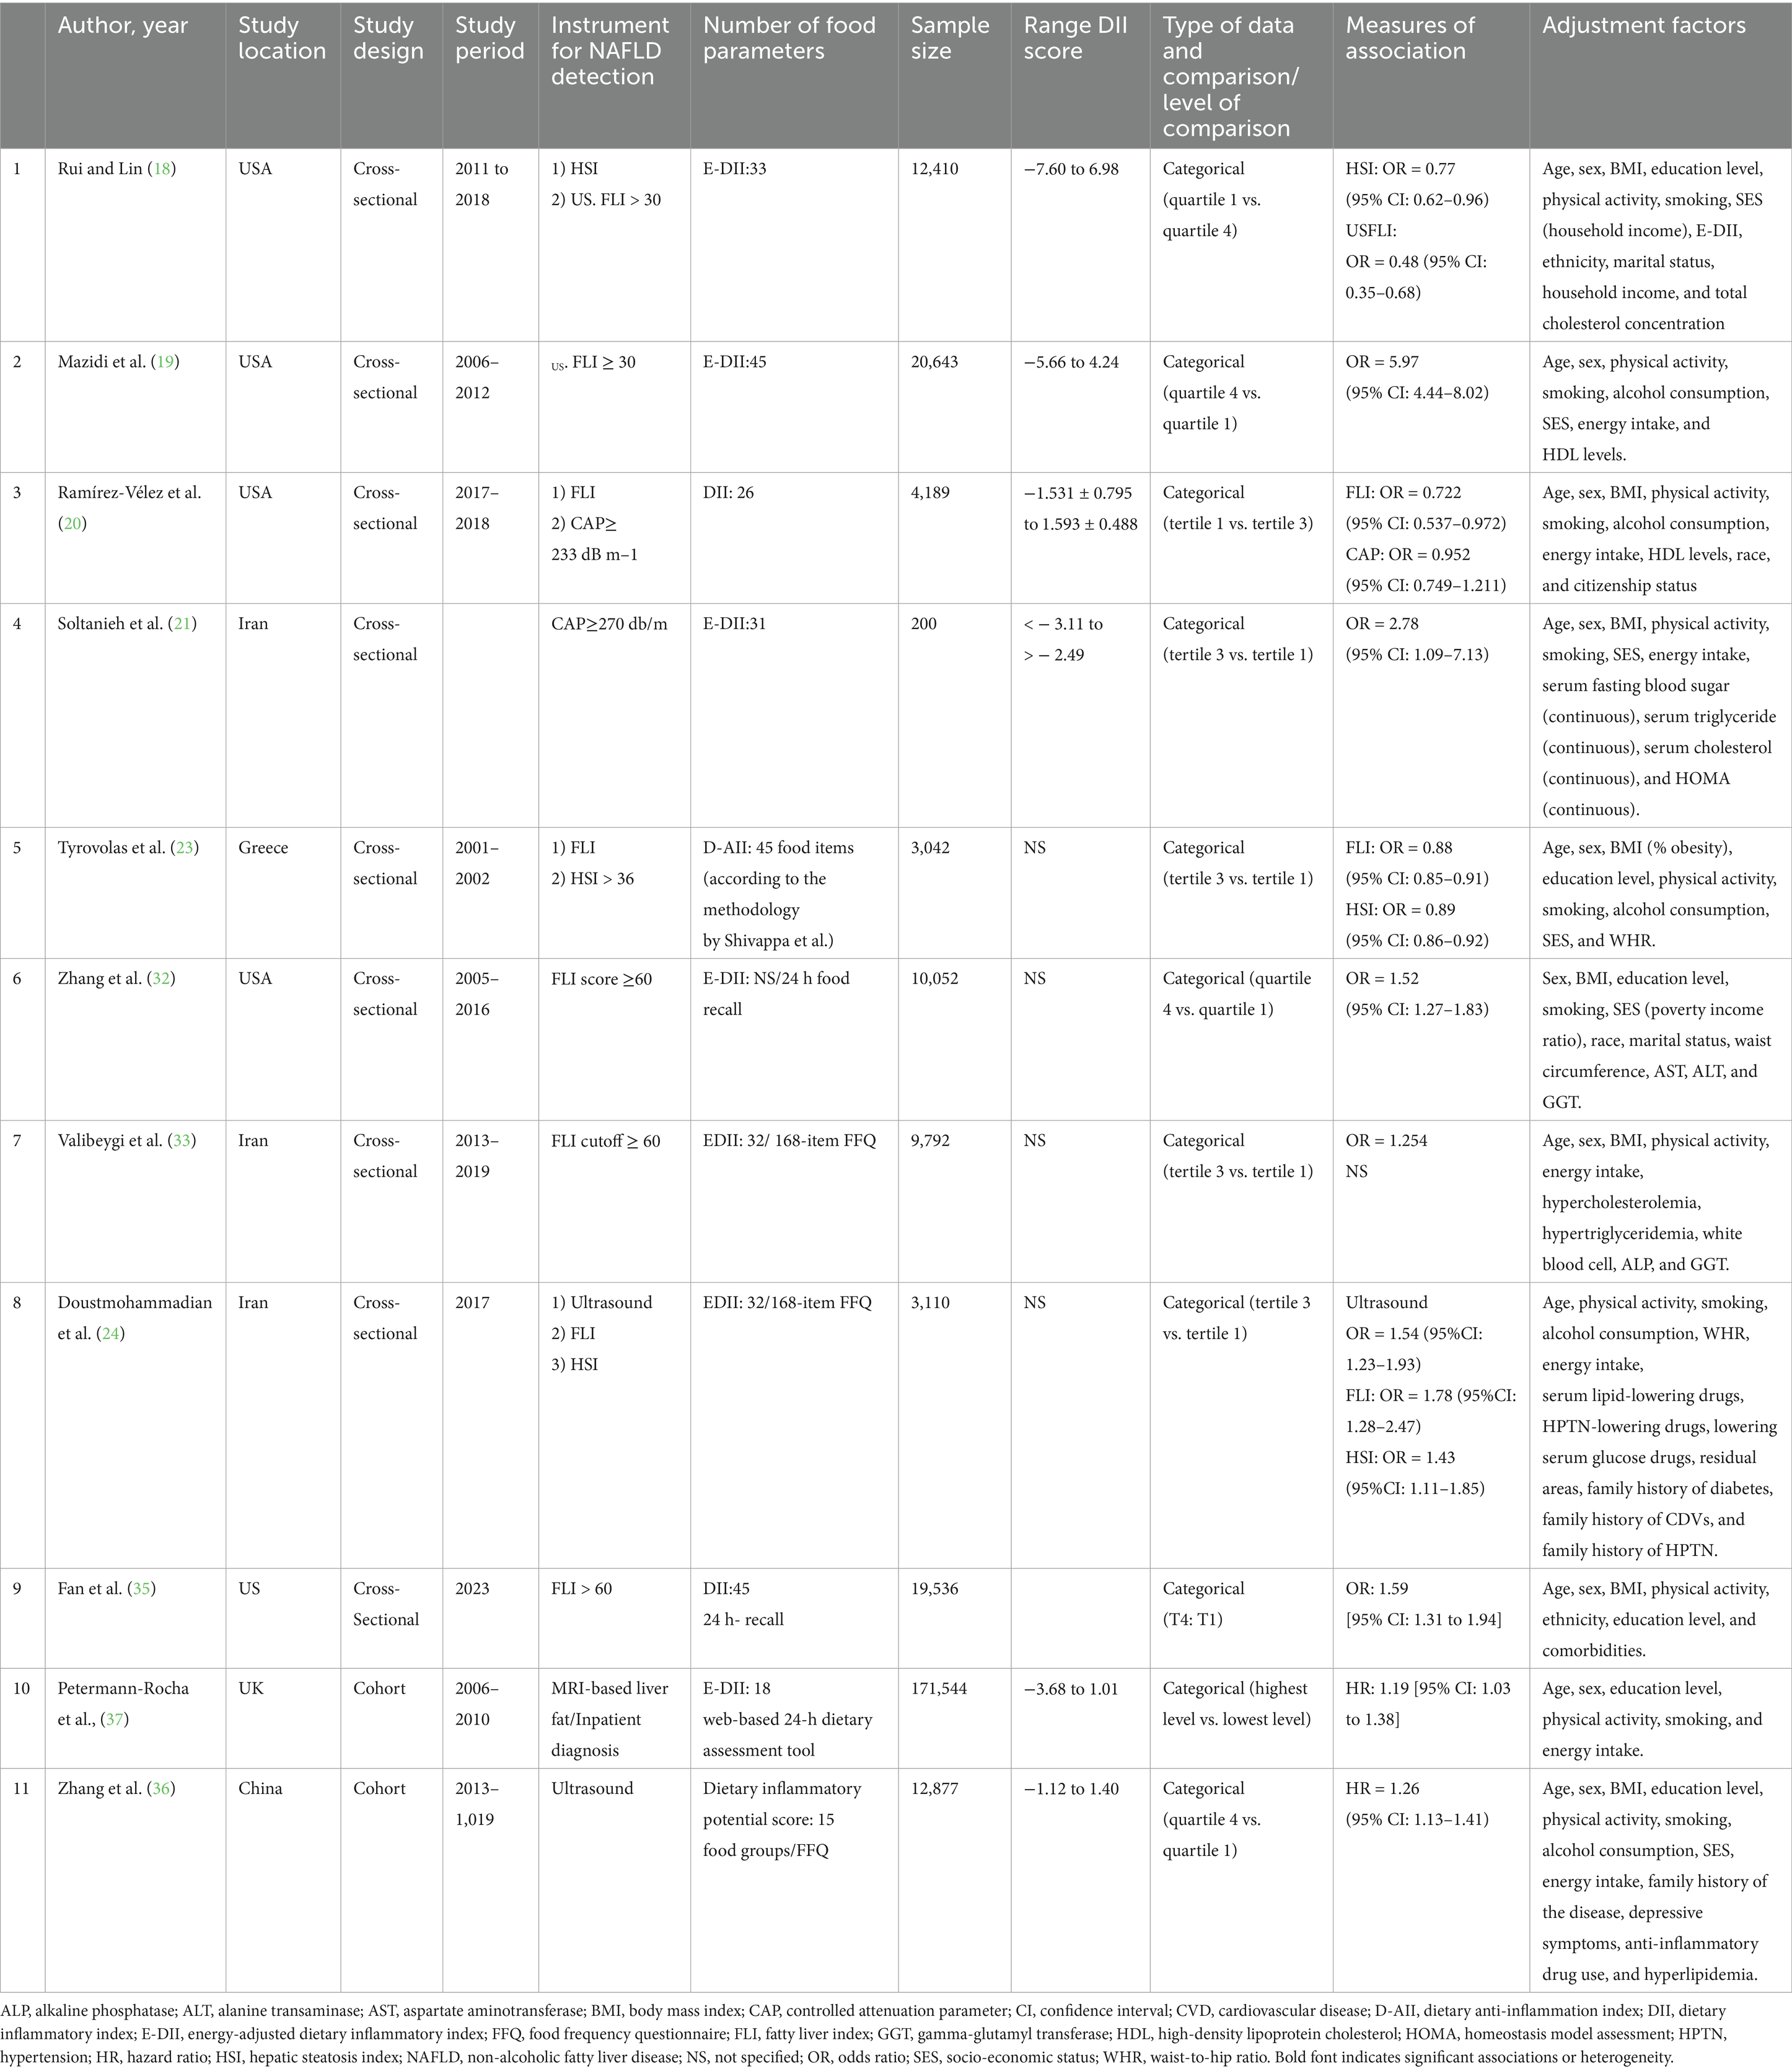
Table 2. Data extracted from the studies included for meta-analysis.
3.3 Association between DII and NAFLD risk
Higher DII scores were significantly associated with increased NAFLD risk. In 9 cross-sectional studies (14 effect sizes), the pooled ORs were 1.56 (95% CI: 1.24–1.95; p < 0.001), with significant heterogeneity (I2 = 86.9%, p < 0.0001). In two cohort studies (2 effect sizes), the pooled HR was 0.21 (95% CI: 0.12–0.30; p < 0.0001), with no heterogeneity (I2 = 0.0%, p = 0.54). These findings indicate that diets with greater inflammatory potential increase NAFLD risk across study designs (Figure 2).
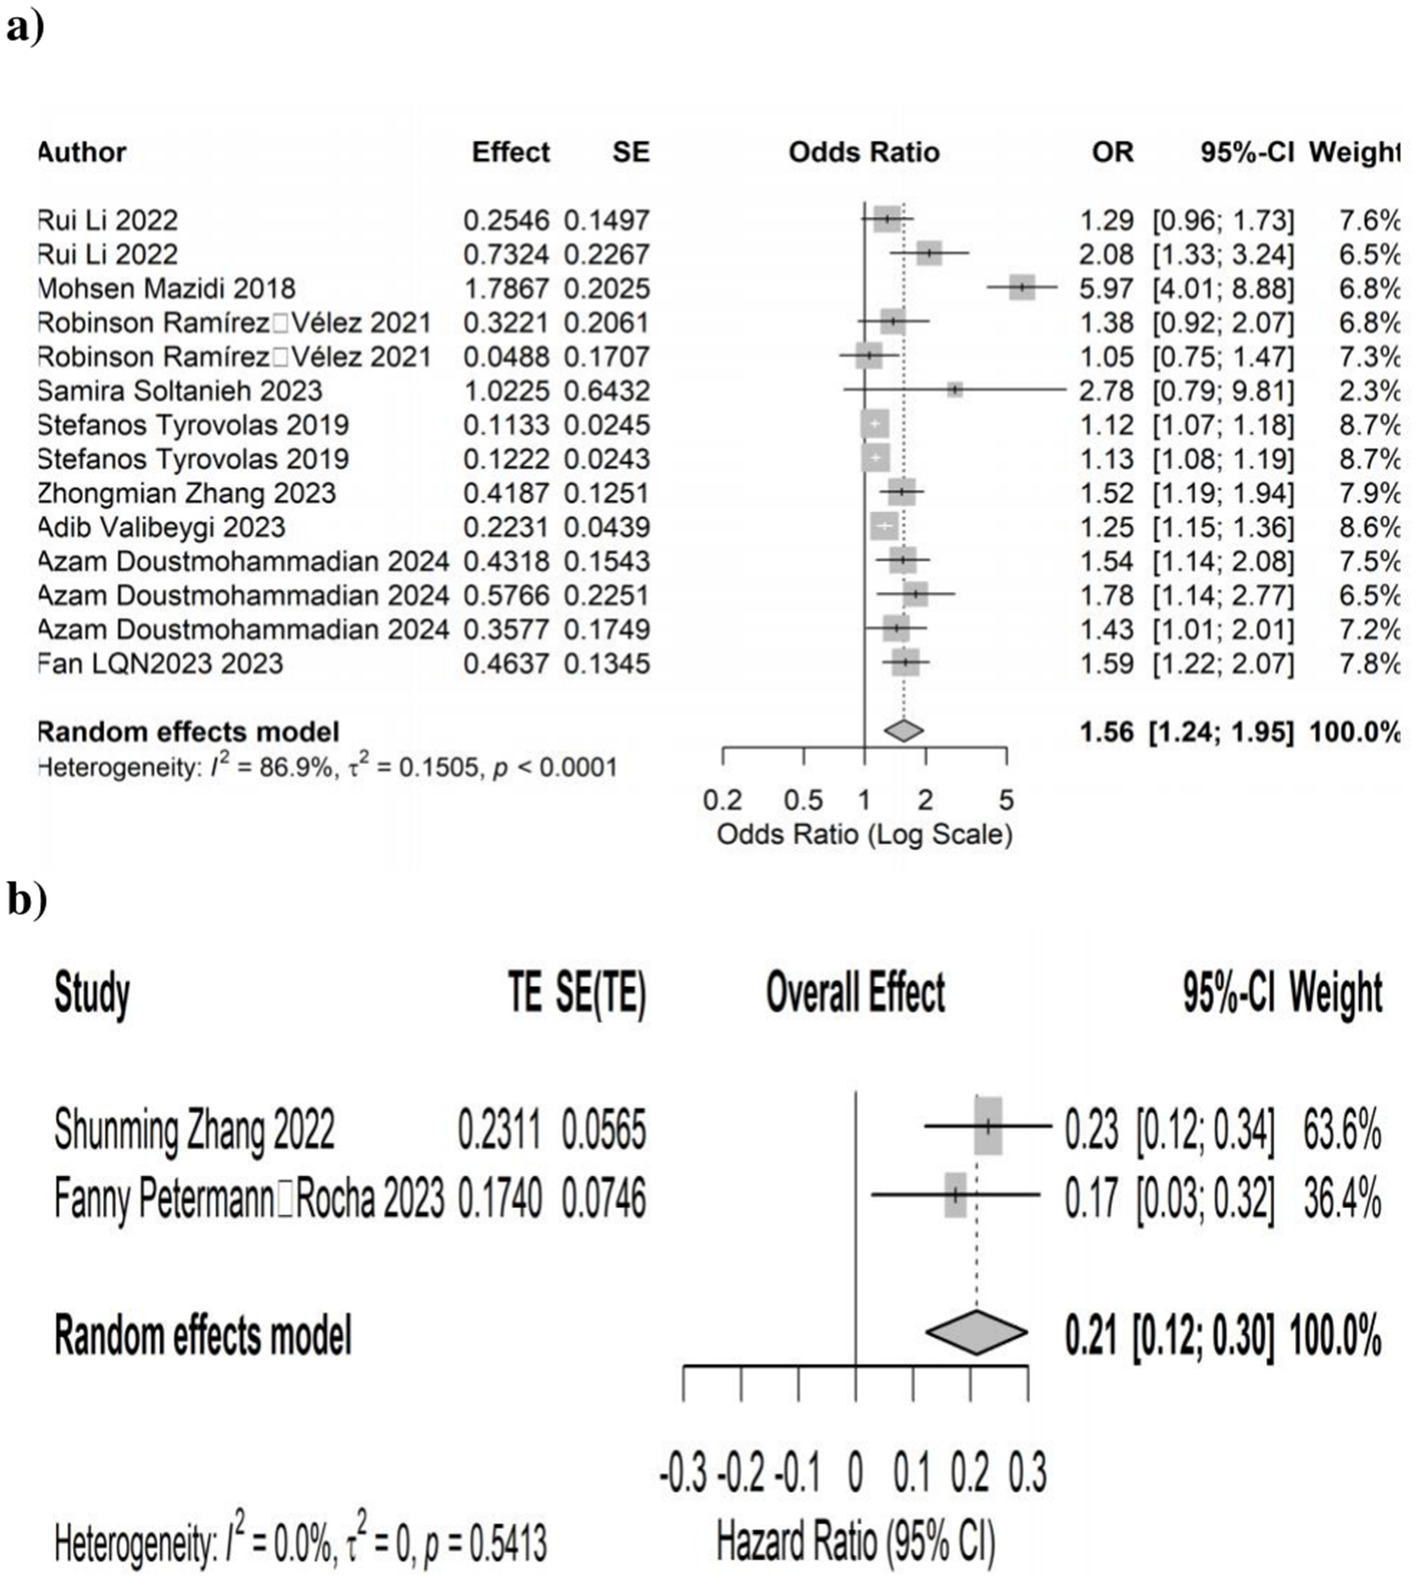
Figure 2. Forest plots illustrates the link between dietary inflammatory index (DII) and the development of non-alcoholic fatty liver disease (NAFLD). (a) Cross-sectional studies and (b) cohort studies.
3.4 Subgroup analyses
Subgroup analyses explored heterogeneity in cross-sectional studies based on BMI, DII definition, sample size, geographical region, age, and NAFLD diagnostic criteria. The significant DII-NAFLD association persisted across most subgroups, including BMI ≥ 25, E-DII, or DII, studies in Asia/Europe, participants <46 years, and studies using HSI with reduced heterogeneity (I2 < 50%) in these categories. However, the association was non-significant in studies with smaller sample sizes (<3,042 participants) or used CAP for NAFLD diagnosis (Table 3).
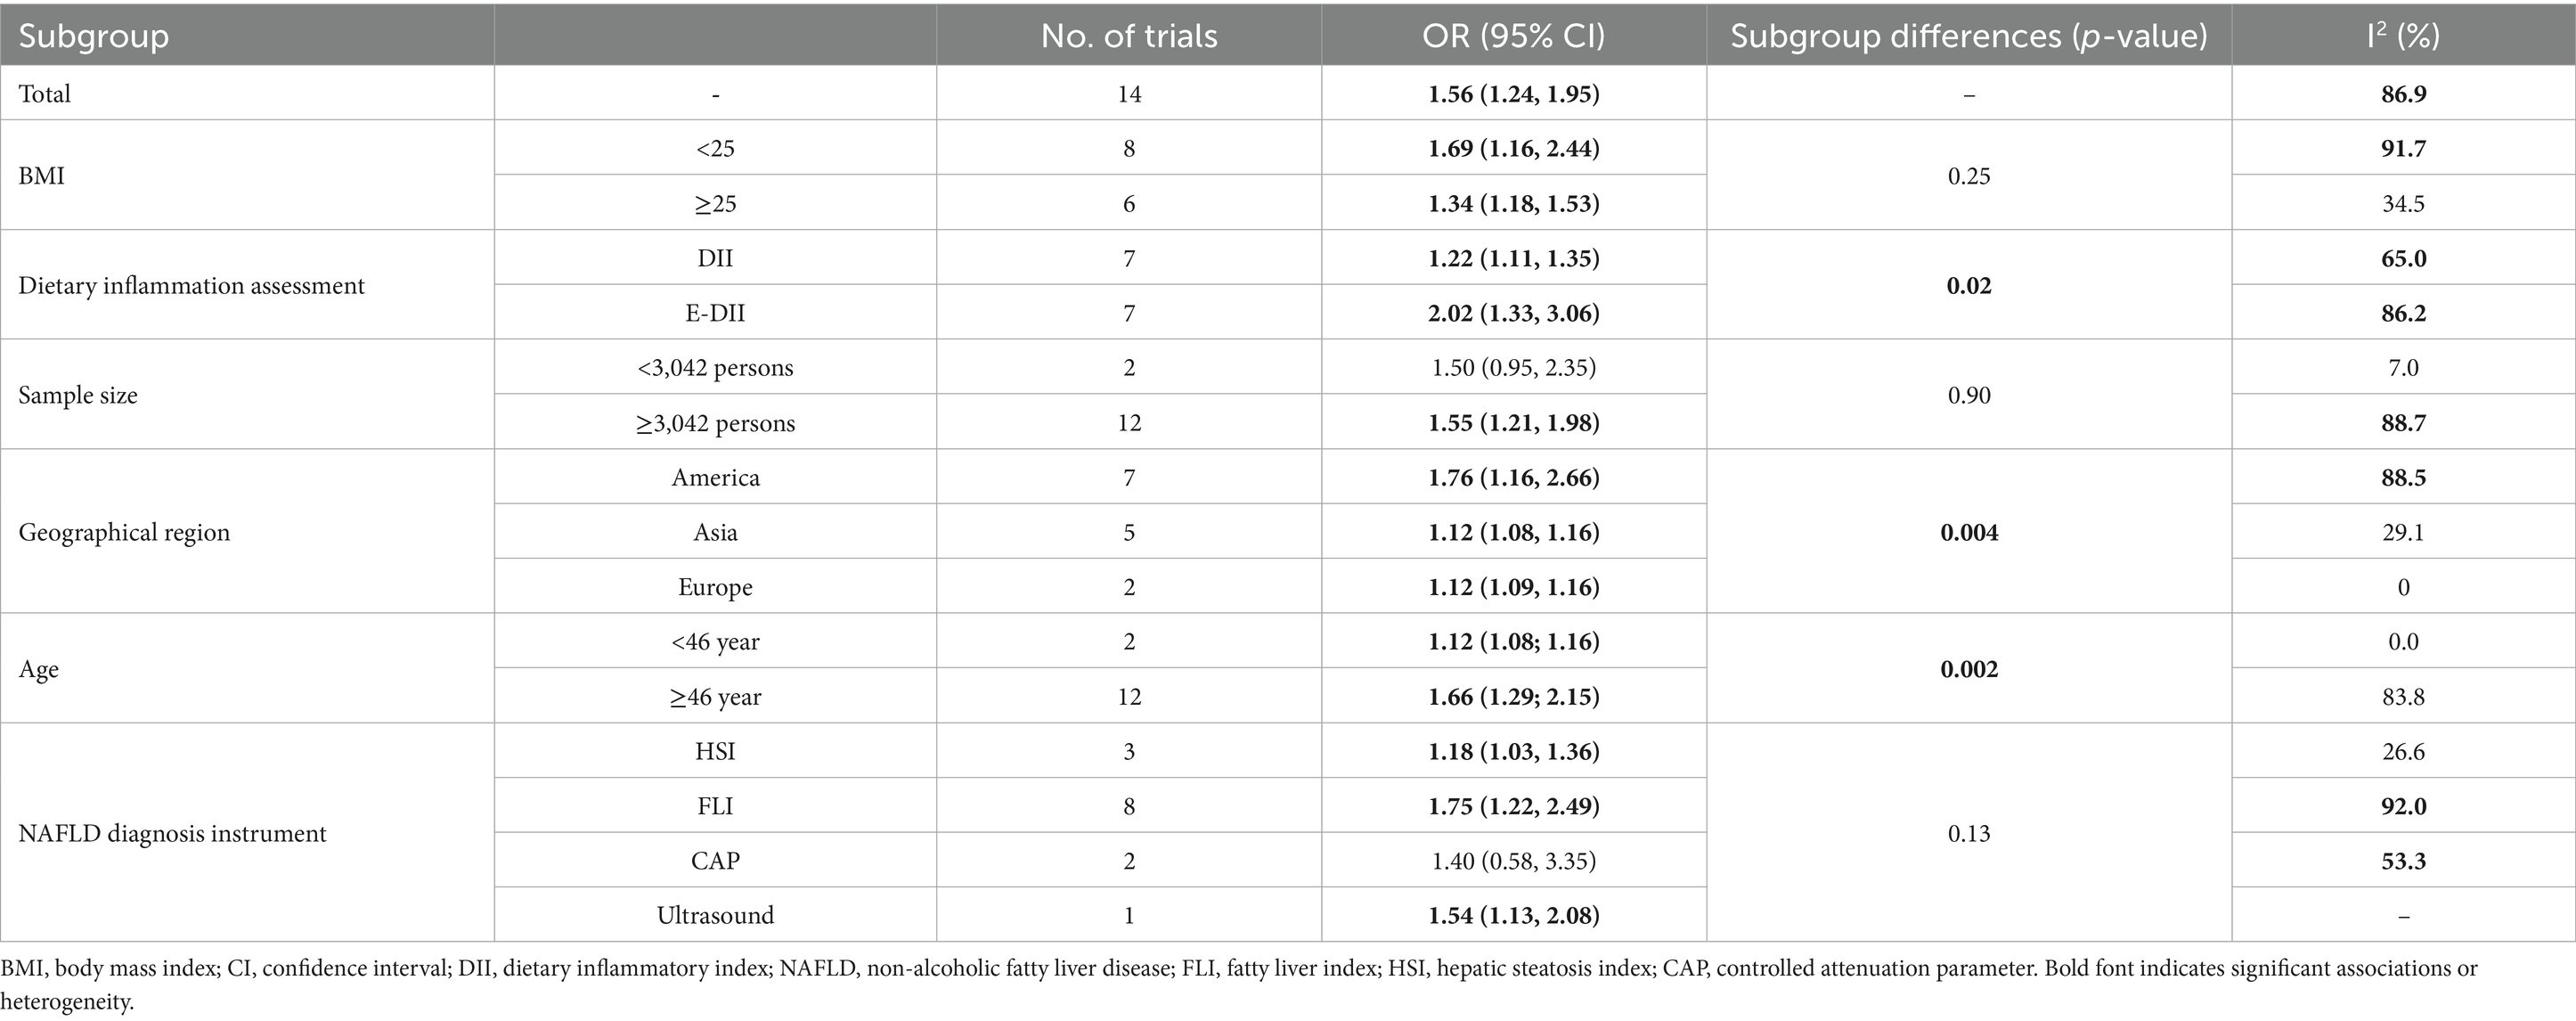
Table 3. Results of subgroup analyses for studies evaluating the effect of DII on NAFLD diagnosis in cross-sectional studies.
3.5 Quality and bias assessment
All included studies were of high quality as per the Newcastle–Ottawa Scale (NOS), with cross-sectional studies scoring an average of 7.89 and cohort studies scoring 9 (Table 4). The majority of studies had a low risk of bias, as assessed by ROBINS-I, both overall and for each individual component (e.g., confounding and outcome measurement), except one cross-sectional study (21) with moderate bias in outcome measurement and results reporting (Table 5).
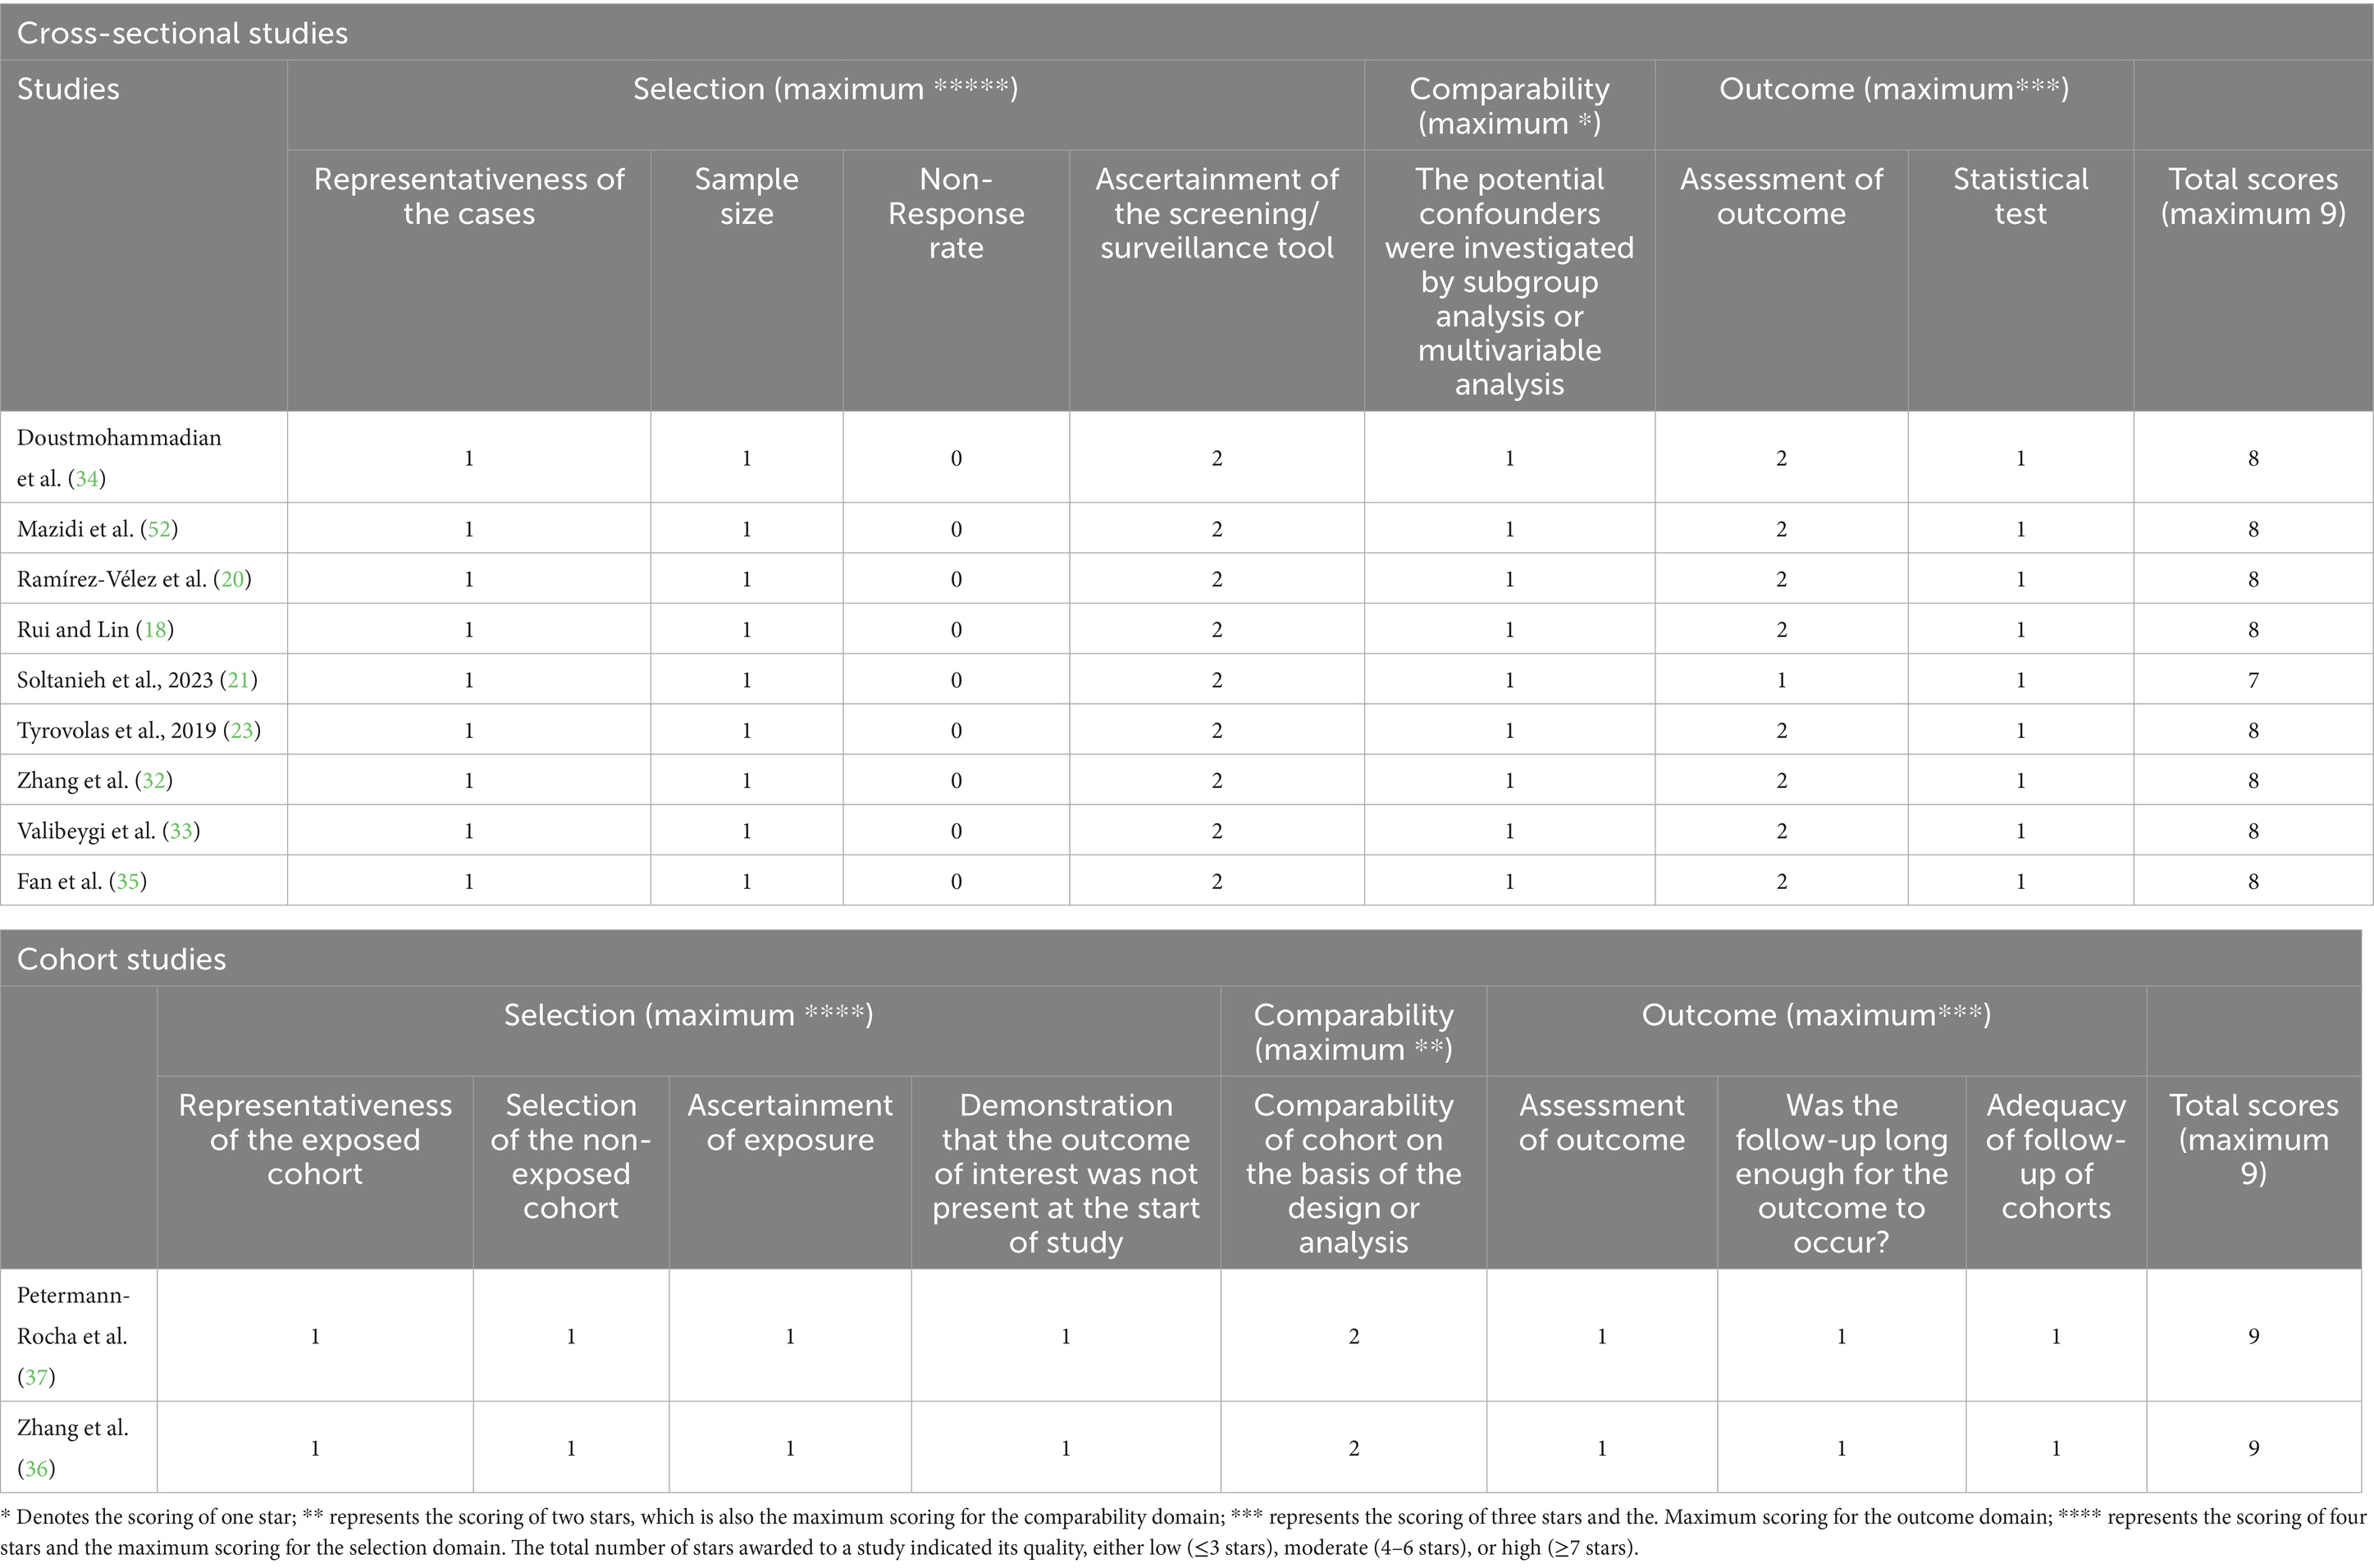
Table 4. Quality appraisal of included studies.
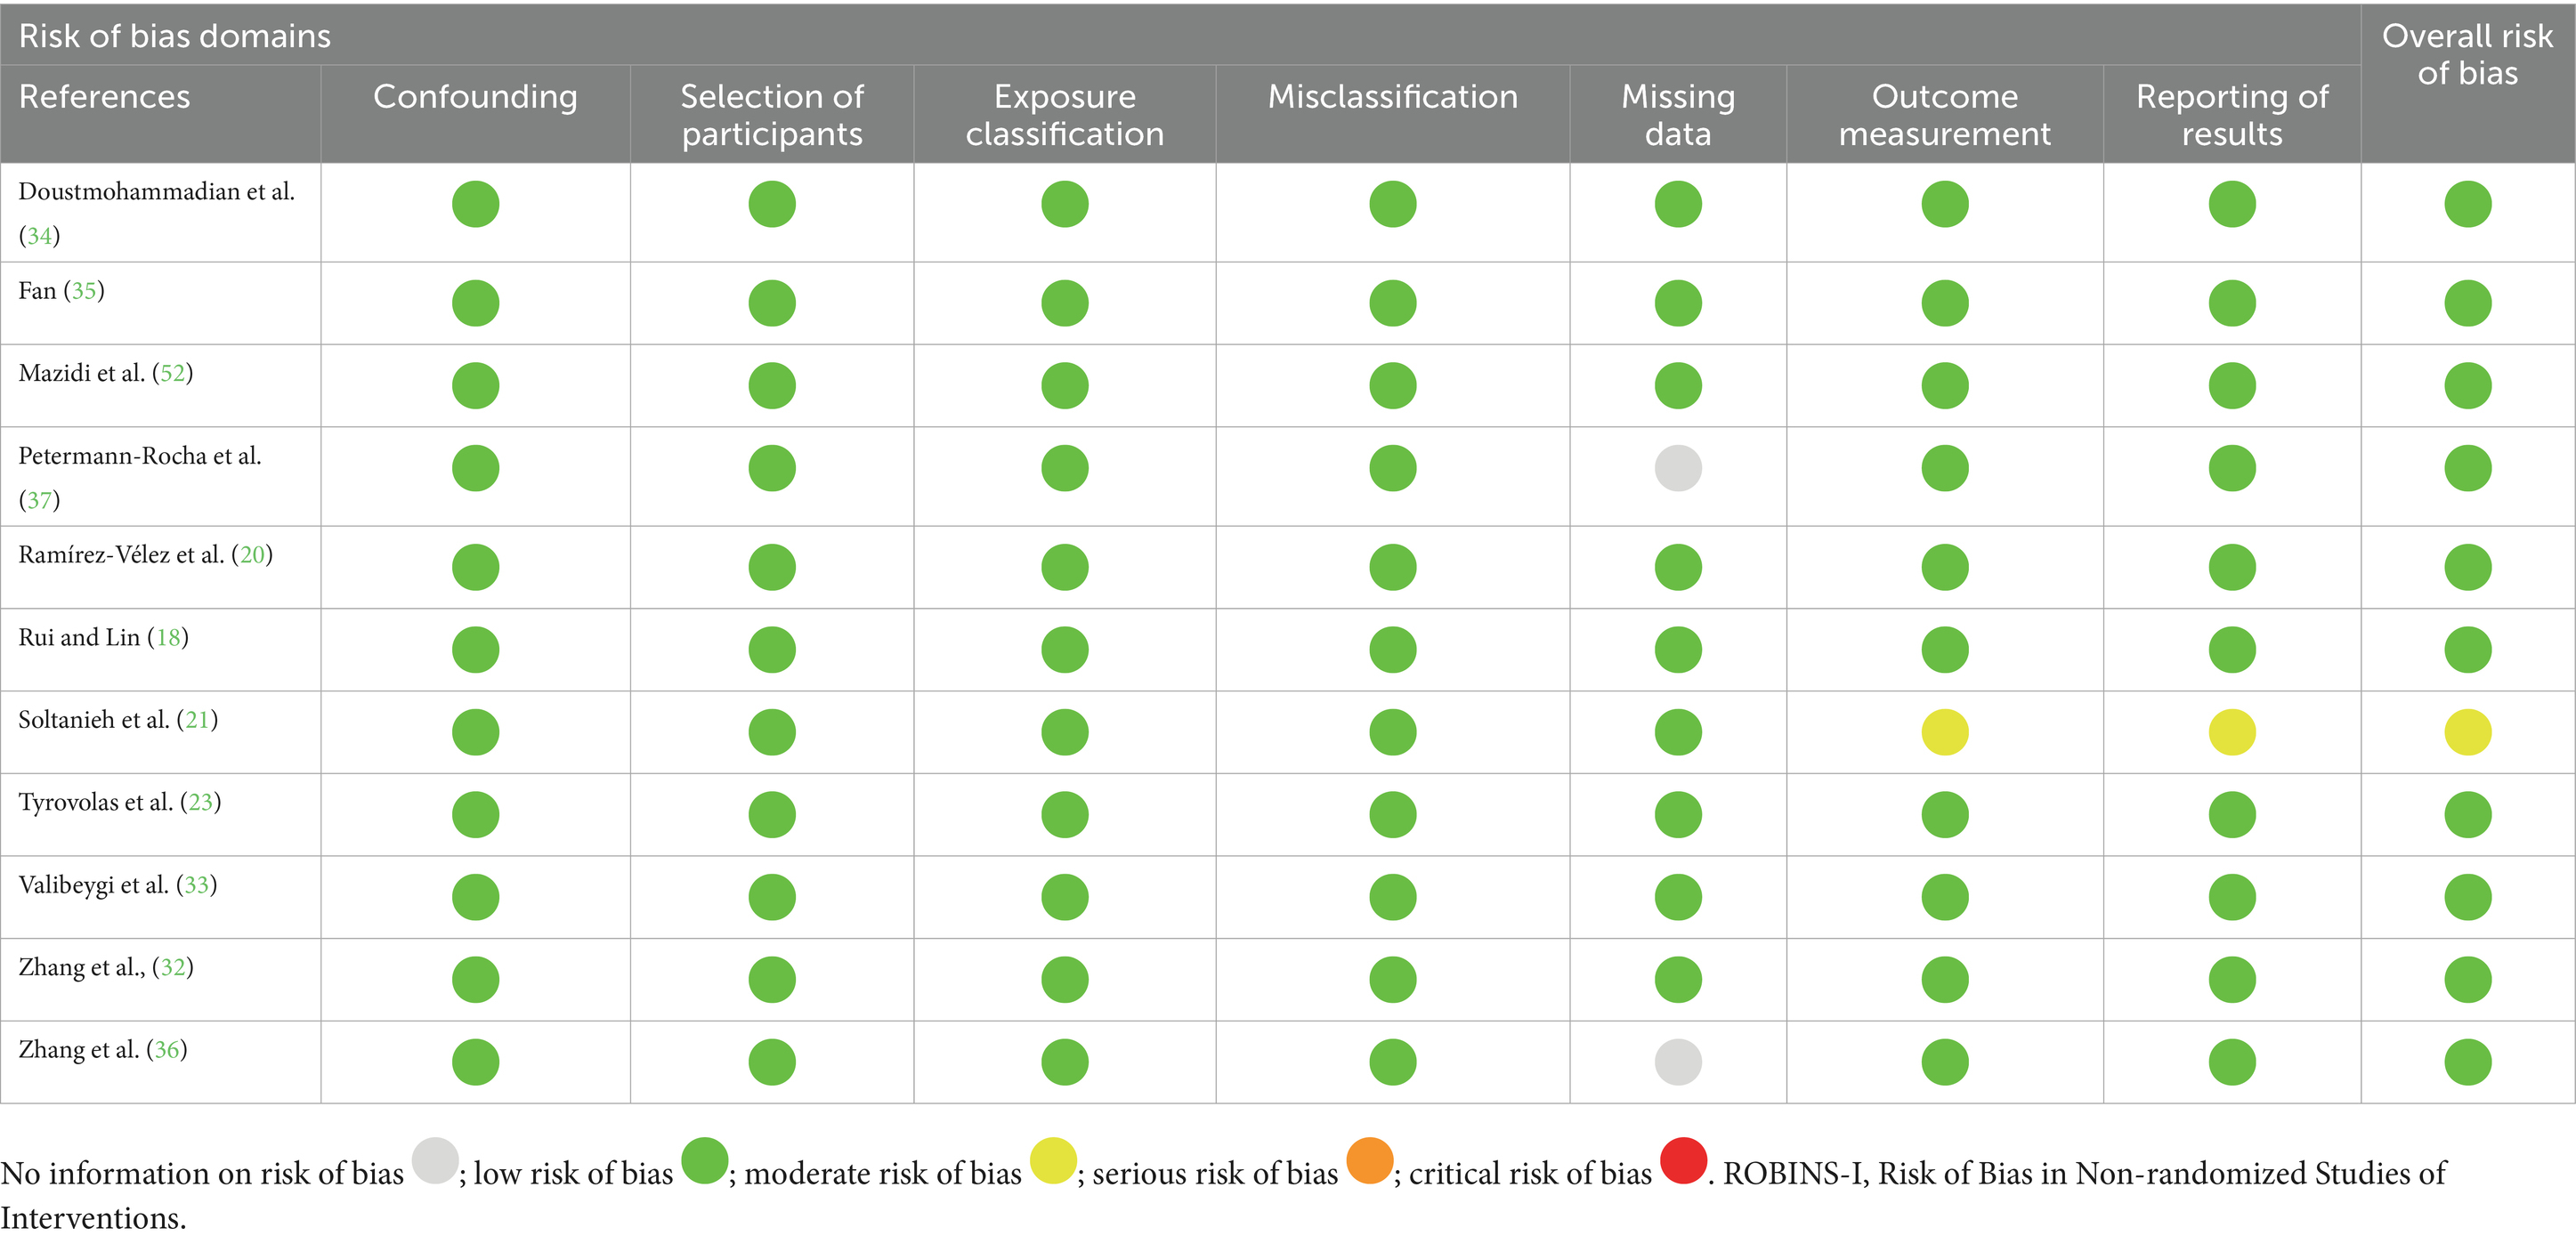
Table 5. Risk of bias in included studies according to ROBINS-I.
3.6 Evidence certainty
Based on the GRADE framework, all outcomes were rated “very low” certainty (Table 1). In cross-sectional studies, evidence was downgraded due to inconsistency (13 effect sizes; 8 for FLI, 3 for HSI, and 2 for CAP), publication bias (8 effect sizes; FLI), imprecision (2 effect sizes; CAP), and indirectness (1 effect size; liver ultrasonography). In cohort studies, indirectness was the primary factor.
4 Discussion
Our meta-analysis of observational studies demonstrated a significant association between high DII scores and increased NAFLD risk, with a pooled OR of 1.56 (95% CI: 1.24–1.95; p < 0.001) in cross-sectional studies and a HR of 0.21 (95% CI: 0.12–0.30; p < 0.0001) in cohort studies. These findings, which are built on Qianwen Zhao’s meta-analysis (22) by including four additional high-quality observational studies (18, 20, 23, 24), confirm that diets with greater inflammatory potential are linked to a higher likelihood of NAFLD. This association underscores the role of dietary composition in liver health and the potential of anti-inflammatory diets to mitigate NAFLD risk (38).
Several mechanisms can explain the link between high DII scores and NAFLD. Pro-inflammatory diets, rich in refined carbohydrates, saturated fats, and processed foods, elevate cytokines such as TNF-α, IL-6, and CRP, promoting hepatic inflammation and fibrosis (39, 40). These diets also increase oxidative stress through reactive oxygen species (ROS), causing lipid peroxidation and hepatocyte injury (41, 42). Additionally, high DII diets exacerbate insulin resistance, impairing lipid metabolism and driving hepatic fat accumulation (43). Gut microbiota dysbiosis, induced by pro-inflammatory foods, increases intestinal permeability and systemic inflammation via endotoxins such as lipopolysaccharides (LPS) (44), further contributing to NAFLD (45, 46). Imbalanced adipokines, such as reduced adiponectin and elevated leptin, also contribute to hepatic steatosis and inflammation (47–51). These interconnected pathways highlight the multifaceted role of dietary inflammation in NAFLD pathogenesis.
Despite the significant association, substantial heterogeneity (I2 = 86.9%, p < 0.0001) was observed, reflecting differences in study designs, populations, and DII methodologies. Subgroup analyses revealed that the DII-NAFLD association was consistent across BMI, geographical regions, age groups, and DII assessment methods, strengthening the robustness of our findings. However, the association was not statistically significant in studies with smaller sample sizes (<3,042 participants) or those using CAP for NAFLD diagnosis, likely due to limited statistical power or diagnostic variability. These findings suggest that study size and diagnostic methods influence observed associations, warranting cautious interpretation.
Using the GRADE framework, we rated the evidence certainty as “very low” due to inconsistency, publication bias in cross-sectional studies, and indirectness in cohort studies. Inconsistency arose from methodological variations, while publication bias likely inflated effect sizes due to preferential reporting of significant results. Indirectness in cohort studies stemmed from differences between study populations and real-world settings, limiting generalizability. One of the included cohort studies (37) categorized severe NAFLD as hospitalization or death due to NAFLD/NASH, using hospital/death databases, focusing on advanced endpoints, unlike routine diagnostics (e.g., ultrasound, MRI, and CAP). Another cohort (36) used a novel dietary inflammatory potential score, differing from the standardized DII, thereby adding methodological variability. These differences limited the findings’ clinical applicability, contributing to the “very low” GRADE evidence certainty.
Our results suggest that reducing dietary inflammatory potential could be a key strategy for NAFLD prevention, informing public health policies and dietary guidelines (39). However, the “very low” evidence certainty and reliance on observational studies preclude causal inferences.
Moreover, the DII presents inherent limitations that may affect our findings. DII scores rely on self-reported dietary data, such as food frequency questionnaires, which are susceptible to recall bias and misreporting, potentially affecting the accuracy of the observed association with NAFLD risk. Variability in DII food parameters (e.g., 18–45 parameters) across studies reduces score comparability, contributing to substantial heterogeneity. Additionally, the DII’s inflammatory weights, derived from global literature, may not fully account for dietary or cultural differences across populations (e.g., USA, Iran, Greece, UK, and China), limiting its applicability in diverse settings. The reliance on cross-sectional designs in most studies limits causal inferences, particularly since the DII reflects only short-term dietary patterns. Given these limitations, our findings on the DII-NAFLD association require cautious interpretation. Future research should prioritize longitudinal cohort studies and randomized controlled trials to address the DII’s reliance on self-reported data and cross-sectional limitations, standardize DII assessment and NAFLD diagnostics across diverse populations, and reduce publication bias through comprehensive reporting. Addressing these issues strengthens the evidence base, thereby supporting targeted interventions for NAFLD prevention and management.
5 Conclusion
This meta-analysis, integrating cross-sectional and cohort studies, confirms that higher DII scores are associated with increased NAFLD risk, suggesting that anti-inflammatory diets can help prevent NAFLD. However, the systematic application of the GRADE framework revealed “very low” certainty of evidence, highlighting methodological limitations. High-quality cohort studies and randomized controlled trials are needed to strengthen the evidence and guide public health strategies.
Data availability statement
The original contributions presented in the study are included in Supplementary material; further inquiries and requests to access the datasets can be directed to the corresponding author AD, ZG9vc3RfbW9oYW1tYWRpQHlhaG9vLmNvbQ==.
Author contributions
BA: Data curation, Writing – original draft, Conceptualization, Formal analysis. MF: Conceptualization, Data curation, Writing – original draft, Formal analysis. MH: Data curation, Writing – original draft, Conceptualization, Formal analysis. AG: Formal analysis, Writing – original draft, Data curation, Conceptualization. FS: Data curation, Conceptualization, Investigation, Formal analysis, Writing – original draft. MS: Data curation, Investigation, Writing – original draft, Formal analysis, Conceptualization. AD: Conceptualization, Supervision, Data curation, Investigation, Writing – review & editing, Formal analysis, Methodology, Writing – original draft.
Funding
The author(s) declare that financial support was received for the research and/or publication of this article. This study was financed by the Iran University of Medical Sciences (IUMS) with grant number: 1402-3-75-26547.
Acknowledgments
We extend our gratitude to the Iran University of Medical Sciences (IUMS) for funding this study.
Conflict of interest
The authors declare that the research was conducted in the absence of any commercial or financial relationships that could be construed as a potential conflict of interest.
Generative AI statement
The author(s) declare that no Gen AI was used in the creation of this manuscript.
Publisher’s note
All claims expressed in this article are solely those of the authors and do not necessarily represent those of their affiliated organizations, or those of the publisher, the editors and the reviewers. Any product that may be evaluated in this article, or claim that may be made by its manufacturer, is not guaranteed or endorsed by the publisher.
Supplementary material
The Supplementary material for this article can be found online at: https://www.frontiersin.org/articles/10.3389/fnut.2025.1596300/full#supplementary-material
References
1. Riazi, K, Azhari, H, Charette, JH, Underwood, FE, King, JA, Afshar, EE, et al. The prevalence and incidence of NAFLD worldwide: a systematic review and meta-analysis. Lancet Gastroenterol Hepatol. (2022) 7: 851–61. doi: 10.1016/S2468-1253(22)00165-0
2. Estes, C, Anstee, QM, Arias-Loste, MT, Bantel, H, Bellentani, S, Caballeria, J, et al. Modeling nafld disease burden in China, France, Germany, Italy, Japan, Spain, United Kingdom, and United States for the period 2016–2030. J Hepatol. (2018) 69:896–904. doi: 10.1016/j.jhep.2018.05.036
3. Angulo, P. Nonalcoholic fatty liver disease. N Engl J Med. (2002) 346:1221–31. doi: 10.1056/NEJMra011775
4. Burt, AD, Lackner, C, and Tiniakos, DG, editors. Diagnosis and assessment of NAFLD: definitions and histopathological classification. Semin Liver Dis (2015): Thieme Medical Publishers.
5. Furman, D, Campisi, J, Verdin, E, Carrera-Bastos, P, Targ, S, Franceschi, C, et al. Chronic inflammation in the etiology of disease across the life span. Nat Med. (2019) 25:1822–32. doi: 10.1038/s41591-019-0675-0
6. Mohamed, J, Nafizah, AN, Zariyantey, A, and Budin, S. Mechanisms of diabetes-induced liver damage: the role of oxidative stress and inflammation. Sultan Qaboos Univ Med J. (2016) 16:e132. doi: 10.18295/squmj.2016.16.02.002
7. Petrescu, M, Vlaicu, SI, Ciumărnean, L, Milaciu, MV, Mărginean, C, Florea, M, et al. Chronic inflammation—a link between nonalcoholic fatty liver disease (NAFLD) and dysfunctional adipose tissue. Medicina. (2022) 58:641. doi: 10.3390/medicina58050641
8. Zhang, W-J, Li, K-Y, Huang, B-H, Wang, H, Wan, S-G, and Zhou, S-C. The hepatocyte in the innate immunity. Virology. (2022) 576:111–6. doi: 10.1016/j.virol.2022.09.011
9. Doustmohammadian, A, Nezhadisalami, A, Safarnezhad Tameshke, F, Motamed, N, Maadi, M, Farahmand, M, et al. A randomized triple-blind controlled clinical trial evaluation of sitagliptin in the treatment of patients with non-alcoholic fatty liver diseases without diabetes. Front Med. (2022) 9:937554. doi: 10.3389/fmed.2022.937554
10. Hallsworth, K, and Adams, LA. Lifestyle modification in NAFLD/NASH: facts and figures. JHEP Rep. (2019) 1:468–79. doi: 10.1016/j.jhepr.2019.10.008
11. Custodero, C, Mankowski, R, Lee, S, Chen, Z, Wu, S, Manini, T, et al. Evidence-based nutritional and pharmacological interventions targeting chronic low-grade inflammation in middle-age and older adults: a systematic review and meta-analysis. Ageing Res Rev. (2018) 46:42–59. doi: 10.1016/j.arr.2018.05.004
12. Doustmohammadian, A, Zamani, F, Hébert, JR, Moradi-Lakeh, M, Esfandyiari, S, Amirkalali, B, et al. Exploring the link between dietary inflammatory index and NAFLD through a structural equation modeling approach. J Health Popul Nutr. (2024) 43:224. doi: 10.1186/s41043-024-00721-1
13. Hart, MJ, Torres, SJ, McNaughton, SA, and Milte, CM. Dietary patterns and associations with biomarkers of inflammation in adults: a systematic review of observational studies. Nutr J. (2021) 20:1–14. doi: 10.1186/s12937-021-00674-9
14. Ahluwalia, N, Andreeva, VA, Kesse-Guyot, E, and Hercberg, S. Dietary patterns, inflammation and the metabolic syndrome. Diabetes Metab. (2013) 39:99–110. doi: 10.1016/j.diabet.2012.08.007
15. Esmaillzadeh, A, Kimiagar, M, Mehrabi, Y, Azadbakht, L, Hu, FB, and Willett, WC. Dietary patterns and markers of systemic inflammation among Iranian women. J Nutr. (2007) 137:992–8. doi: 10.1093/jn/137.4.992
16. Shivappa, N, Wirth, MD, Murphy, EA, Hurley, TG, and Hébert, JR. Association between the dietary inflammatory index (DII) and urinary enterolignans and C-reactive protein from the National Health and nutrition examination Survey-2003–2008. Eur J Nutr. (2019) 58:797–805. doi: 10.1007/s00394-018-1690-5
17. Shivappa, N, Steck, SE, Hurley, TG, Hussey, JR, and Hébert, JR. Designing and developing a literature-derived, population-based dietary inflammatory index. Public Health Nutr. (2014) 17:1689–96. doi: 10.1017/S1368980013002115
18. Rui, L, and Lin, JD. Reprogramming of hepatic metabolism and microenvironment in nonalcoholic steatohepatitis. Annu Rev Nutr. (2022) 42:91. doi: 10.1146/annurev-nutr-062220-105200
19. Mazidi, M, Shivappa, N, Wirth, MD, Hebert, JR, and Kengne, AP. Diet with greater inflammatory potential is associated with higher prevalence of fatty liver among US adults. Eur J Clin Nutr. (2019) 73:1653–6. doi: 10.1038/s41430-018-0364-y
20. Ramírez-Vélez, R, García-Hermoso, A, Izquierdo, M, and Correa-Rodríguez, M. The dietary inflammatory index and hepatic health in the US adult population. J Hum Nutr Diet. (2022) 35:968–79. doi: 10.1111/jhn.12962
21. Soltanieh, S, Salavatizadeh, M, Poustchi, H, Yari, Z, Mansour, A, Khamseh, ME, et al. The association of dietary inflammatory index (DII) and central obesity with non-alcoholic fatty liver disease (NAFLD) in people with diabetes (T2DM). Heliyon. (2023) 9:e13983. doi: 10.1016/j.heliyon.2023.e13983
22. Zhao, Q, Deng, Y, Gong, R, Chen, T, and Yang, L. Association between dietary inflammatory index and risk of fatty liver disease: a systematic review and meta-analysis. Dig Liver Dis. (2023) 56:541–50. doi: 10.1016/j.dld.2023.09.024
23. Tyrovolas, S, Panagiotakos, DB, Georgousopoulou, EN, Chrysohoou, C, Skoumas, J, Pan, W, et al. The anti-inflammatory potential of diet and nonalcoholic fatty liver disease: the ATTICA study. Ther Adv Gastroenterol. (2019) 12:1756284819858039. doi: 10.1177/1756284819858039
24. Doustmohammadian, A, Amirkalali, B, Esfandyari, S, Motamed, N, Maadi, M, Shivappa, N, et al. The association between dietary inflammatory index (DII) scores and c-reactive protein (CRP) and nonalcoholic fatty liver disease (NAFLD) in a general population cohort. Clin Nutr ESPEN. (2024) 60:156–64. doi: 10.1016/j.clnesp.2024.01.017
25. Page, MJ, McKenzie, JE, Bossuyt, PM, Boutron, I, Hoffmann, TC, Mulrow, CD, et al. The PRISMA 2020 statement: an updated guideline for reporting systematic reviews. BMJ. (2021) 372:n71. doi: 10.1136/bmj.n71
26. Stang, A. Critical evaluation of the Newcastle-Ottawa scale for the assessment of the quality of nonrandomized studies in meta-analyses. Eur J Epidemiol. (2010) 25:603–5. doi: 10.1007/s10654-010-9491-z
27. Lo, CK-L, Mertz, D, and Loeb, M. Newcastle-Ottawa scale: comparing reviewers’ to authors’ assessments. BMC Med Res Methodol. (2014) 14:1–5. doi: 10.1186/1471-2288-14-45
28. Sterne, JA, Hernán, MA, McAleenan, A, Reeves, BC, and Higgins, JP. Assessing risk of bias in a non-randomized study In: JPT Higgins, J Thomas, J Chandler, M Cumpston, T Li, and MJ Page, et al., editors. Cochrane handbook for systematic reviews of interventions (2019). 621–41. doi: 10.1002/9781119536604.ch25
29. Granholm, A, Al Duhailib, Z, Alhazzani, W, Oczkowski, S, Belley-Cote, E, and Møller, MH. GRADE pearls and pitfalls—part 2: clinical practice guidelines. Acta Anaesthesiol Scand. (2024) 68:593–600. doi: 10.1111/aas.14384
30. Begg, CB, and Mazumdar, M. Operating characteristics of a rank correlation test for publication bias. Biometrics. (1994) 50:1088–101. doi: 10.2307/2533446
31. Egger, M, Smith, GD, Schneider, M, and Minder, C. Bias in meta-analysis detected by a simple, graphical test. BMJ. (1997) 315:629–34. doi: 10.1136/bmj.315.7109.629
32. Zhang, Z, Wang, L, Lin, Z, Yan, W, Chen, J, Zhang, X, et al. Dietary inflammatory index and risk of non-alcoholic fatty liver disease and advanced hepatic fibrosis in US adults. Front Nutr. (2023) 10:1102660. doi: 10.3389/fnut.2023.1102660
33. Valibeygi, A, Davoodi, A, Dehghan, A, Vahid, F, Hébert, JR, Farjam, M, et al. Dietary inflammatory index (DII) is correlated with the incidence of non-alcoholic fatty liver disease (NAFLD): Fasa PERSIAN cohort study. BMC Nutr. (2023) 9:84. doi: 10.1186/s40795-023-00738-5
34. Doustmohammadian, A, Clark, CCT, Maadi, M, Motamed, N, Sobhrakhshankhah, E, Ajdarkosh, H, et al. Favorable association between Mediterranean diet (MeD) and DASH with NAFLD among Iranian adults of the Amol cohort study (AmolCS). Sci Rep. (2022) 12:2131. doi: 10.1038/s41598-022-06035-8
35. Fan, L, Zhao, S, Shi, H, and Zhang, S. Role of BMI in the relationship between dietary inflammatory index and non-alcoholic fatty liver disease: an intermediary analysis. Scand J Gastroenterol. (2023) 58:1159–65. doi: 10.1080/00365521.2023.2213791
36. Zhang, S, Meng, G, Zhang, Q, Liu, L, Wu, H, Gu, Y, et al. Inflammatory potential of diet and risk of nonalcoholic fatty liver disease: a prospective cohort study. Eur J Clin Nutr. (2022) 76:1125–32. doi: 10.1038/s41430-022-01069-7
37. Petermann-Rocha, F, Wirth, MD, Boonpor, J, Parra-Soto, S, Zhou, Z, Mathers, JC, et al. Associations between an inflammatory diet index and severe non-alcoholic fatty liver disease: a prospective study of 171,544 UK biobank participants. BMC Med. (2023) 21:123. doi: 10.1186/s12916-023-02793-y
38. Shivappa, N, Godos, J, Hébert, JR, Wirth, MD, Piuri, G, Speciani, AF, et al. Dietary inflammatory index and cardiovascular risk and mortality—a meta-analysis. Nutrients. (2018) 10:200. doi: 10.3390/nu10020200
39. Tilg, H, and Moschen, AR. Evolution of inflammation in nonalcoholic fatty liver disease: the multiple parallel hits hypothesis. Hepatology. (2010) 52:1836–46. doi: 10.1002/hep.24001
40. Calder, PC, Bosco, N, Bourdet-Sicard, R, Capuron, L, Delzenne, N, Doré, J, et al. Health relevance of the modification of low grade inflammation in ageing (inflammageing) and the role of nutrition. Ageing Res Rev. (2017) 40:95–119. doi: 10.1016/j.arr.2017.09.001
41. Sies, H, Berndt, C, and Jones, DP. Oxidative stress. Annu Rev Biochem. (2017) 86:715–48. doi: 10.1146/annurev-biochem-061516-045037
42. Sunny, NE, Bril, F, and Cusi, K. Mitochondrial adaptation in nonalcoholic fatty liver disease: novel mechanisms and treatment strategies. Trends Endocrinol Metab. (2017) 28:250–60. doi: 10.1016/j.tem.2016.11.006
43. Samuel, VT, and Shulman, GI. The pathogenesis of insulin resistance: integrating signaling pathways and substrate flux. J Clin Invest. (2016) 126:12–22. doi: 10.1172/JCI77812
44. Chae, Y-R, Lee, YR, Kim, Y-S, and Park, H-Y. Diet-induced gut dysbiosis and leaky gut syndrome. J Microbiol Biotechnol. (2024) 34:747–56. doi: 10.4014/jmb.2312.12031
45. Boursier, J, Mueller, O, Barret, M, Machado, M, Fizanne, L, Araujo-Perez, F, et al. The severity of nonalcoholic fatty liver disease is associated with gut dysbiosis and shift in the metabolic function of the gut microbiota. Hepatology. (2016) 63:764–75. doi: 10.1002/hep.28356
46. Le Roy, T, Llopis, M, Lepage, P, Bruneau, A, Rabot, S, Bevilacqua, C, et al. Intestinal microbiota determines development of non-alcoholic fatty liver disease in mice. Gut. (2013) 62:1787–94. doi: 10.1136/gutjnl-2012-303816
47. Polyzos, SA, Kountouras, J, and Mantzoros, CS. Adipokines in nonalcoholic fatty liver disease. Metabolism. (2016) 65:1062–79. doi: 10.1016/j.metabol.2015.11.006
48. Suhett, LG, Hermsdorff, HHM, Ribeiro, SAV, Filgueiras, MS, Shivappa, N, Hébert, JR, et al. The dietary inflammatory index is associated with anti- and pro-inflammatory adipokines in Brazilian schoolchildren. Eur J Nutr. (2021) 60:2841–9. doi: 10.1007/s00394-021-02500-8
49. Tabung, FK, Smith-Warner, SA, Chavarro, JE, Wu, K, Fuchs, CS, Hu, FB, et al. Development and validation of an empirical dietary inflammatory index. J Nutr. (2016) 146:1560–70. doi: 10.3945/jn.115.228718
50. Lécuyer, L, Laouali, N, Viallon, V, Artaud, F, Hébert, JR, Shivappa, N, et al. Associations between dietary inflammatory scores and biomarkers of inflammation in the European prospective investigation into Cancer and nutrition (EPIC) cohort. Clin Nutr. (2023) 42:1115–25. doi: 10.1016/j.clnu.2023.05.012
51. Shiraseb, F, Farazi, M, Rasaei, N, Clark, CCT, Jamili, S, and Mirzaei, K. The interaction between rs 3,807,992 genotypes with the dietary inflammatory index on leptin, leptin resistance, and galectin 3 in obese and overweight women. BMC Endocr Disord. (2022) 22:237. doi: 10.1186/s12902-022-01136-x
Keywords: non-alcoholic fatty liver disease, inflammation, diet, observational studies as topic, meta-analysis
Citation: Amirkalali B, Farahmand M, Rashedi MH, Gholami A, Sheikholmolooki F, Sedighi M and Doustmohammadian A (2025) Dietary inflammatory index and non-alcoholic fatty liver disease risk: a systematic review and meta-analysis of observational studies. Front. Nutr. 12:1596300. doi: 10.3389/fnut.2025.1596300
Edited by:
Lidia Santarpia, University of Naples Federico II, ItalyReviewed by:
Katarzyna Piotrowska, Pomeranian Medical University in Szczecin, PolandMuniyappan Madesh, Yangzhou University, China
Er Sheng Gong, Gannan Medical University, China
Satabdi Mitra, KPC Medical College and Hospital, India
Copyright © 2025 Amirkalali, Farahmand, Rashedi, Gholami, Sheikholmolooki, Sedighi and Doustmohammadian. This is an open-access article distributed under the terms of the Creative Commons Attribution License (CC BY). The use, distribution or reproduction in other forums is permitted, provided the original author(s) and the copyright owner(s) are credited and that the original publication in this journal is cited, in accordance with accepted academic practice. No use, distribution or reproduction is permitted which does not comply with these terms.
*Correspondence: Azam Doustmohammadian, ZG9vc3RfbW9oYW1tYWRpQHlhaG9vLmNvbQ==
†ORCID: Azam Doustmohammadian, https://orcid.org/0000-0001-6249-2520