 Chuan-Xi Wang
 Miao Kuang1,2†
 Jing-Jing Hou
 Zheng-Xuan Jiang
- 1Department of Ophthalmology, The Second Affiliated Hospital of Anhui Medical University, Hefei, China
- 2Xuancheng Eye Hospital, Xuancheng, China
- 3Department of Clinical Medicine, The Second School of Clinical Medicine, Anhui Medical University, Hefei, China
Background: Obesity is harmful to the retina. Few studies have examined obesity indicators for retinopathy, and our research is intended to elucidate this relationship.
Methods: This study assessed the association between obesity indicators and retinopathy using weighted multifactorial logistic regression, participants from the National Health and Nutrition Examination Survey (NHANES). The stability of the relationship was tested by subgroup analysis. Moreover, restricted cubic spline (RCS) was used to test for a non-linear relationship between them. Finally, Receiver Operating Characteristic (ROC) curves were applied to compare the prognostic value of each obesity indicator for retinopathy.
Results: After adjusting the confounding factor, weighted logistic regression showed positive associations between body roundness index (BRI), conicity index (CI), waist-to-height ratio (WHtR), tri-ponderal mass index (TMI), weight-adjusted-waist index (WWI), body mass index (BMI), and retinopathy. RCS curves found linear correlations between BRI, CI, WHtR, TMI, and WWI with retinopathy, except for BMI. Subgroup analyses showed no significant interactions between age, sex, ethnicity, and education subgroups. ROC curves showed that WWI had the highest predictive value for retinopathy.
Conclusion: Overall, increased levels of these obesity indicators increase the likelihood of developing retinopathy.
1 Introduction
Retinopathy is the most common ocular complication of diabetes mellitus (1), characterized by retinal microvascular dysfunction (2). It is thought to be the main reason for blindness in adults over 20 years in the United States (3). Previous research found that patients with retinopathy were more likely to suffer from heart failure, stroke, kidney disease (4), and neurological disorders. Retinopathy may be a marker for the risk of reactive vascular disease (5). This shows that retinopathy affects not only vision but also other vascular complications. Therefore, identifying the risk factors that influence retinopathy is crucial for systemic microvascular health.
Obesity and diabetes are well-established risk factors for retinal diseases (6, 7). Enhanced oxidative stress induced by diabetes plays a central role in the pathogenesis of retinopathy diseases by contributing to retinal cell dysfunction and apoptosis (8). It also triggers the release of pro-inflammatory cytokines, which can lead to basement membrane thickening, disruption of the blood-retinal barrier (BRB), microvascular occlusion, and ultimately, the development of retinopathy (9, 10).
Obesity is a significant public health problem worldwide (11), and the incidence of overweight and obesity has continued to increase in recent years (12). Obesity is also closely linked to retinal diseases, potentially contributing through mechanisms such as insulin resistance, systemic inflammation, oxidative stress, and microvascular dysfunction (13, 14). Although body mass index (BMI) is widely used to assess obesity, it does not accurately reflect fat distribution. Abnormal fat accumulation can occur even in individuals with a normal BMI (15). While imaging techniques such as computerized tomography (CT) and magnetic resonance imaging (MRI) can directly quantify visceral adiposity, their highly cost limits large-scale clinical use (16). Therefore, several alternative anthropometric indices have been developed to provide low-cost, practical assessments of body fat distribution: body roundness index (BRI), conicity index (CI), waist-to-height ratio (WHtR), tri-ponderal mass index (TMI), weight-adjusted-waist index (WWI), and a body shape index (ABSI).
BRI based on eccentricity theory and incorporating waist circumference and height, offers a more nuanced evaluation of visceral fat and abdominal obesity (17, 18). The WWI, introduced by Park et al., is calculated as waist circumference divided by the square root of body weight, enabling the assessment of central obesity independent of total body weight (19). The WHtR is another simple yet effective index that reflects central fat distribution (20). Additionally, the ABSI and the CI are commonly used to evaluate fat distribution, with ABSI more indicative of central obesity and CI focusing specifically on abdominal adiposity (21).
Previous studies have demonstrated that: compared to general obesity, central obesity is more strongly associated with insulin resistance and diabetes mellitus—both of which are key contributors to retinal diseases (22). While much research has been conducted on the association between these anthropometric indices and conditions such as diabetes, hypertension, and kidney stones (23–25), the relationship between these obesity-related measures and retinal diseases remains unclear. Additionally, it is not known which indicator has the greatest diagnostic value for retinal diseases. Therefore, we used data from the National Health and Nutrition Examination Survey (NHANES) from 2005 to 2008 to examine the relationship between various measures and the prevalence of retinal diseases in the U. S. population. We also compared the diagnostic value of novel and traditional indicators for retinal diseases using the receiver operating characteristic (ROC) method.
2 Methods
2.1 Research population
This study used publicly available data from the NHANES from two consecutive cycles, 2005–2006 and 2007–2008. The NHANES is a cross-sectional survey conducted by the US National Institutes of Health to assess the health and nutritional status of the US population.
There were 20,497 participants in this study, and participants who did not meet the following criteria were excluded: (1) missing data on retinal examination, (2) missing information on waist circumference, height, and weight, and (3) missing data on relevant covariates. In the end, 4,867 participants met the criteria. Figure 1 demonstrates the detailed screening process.
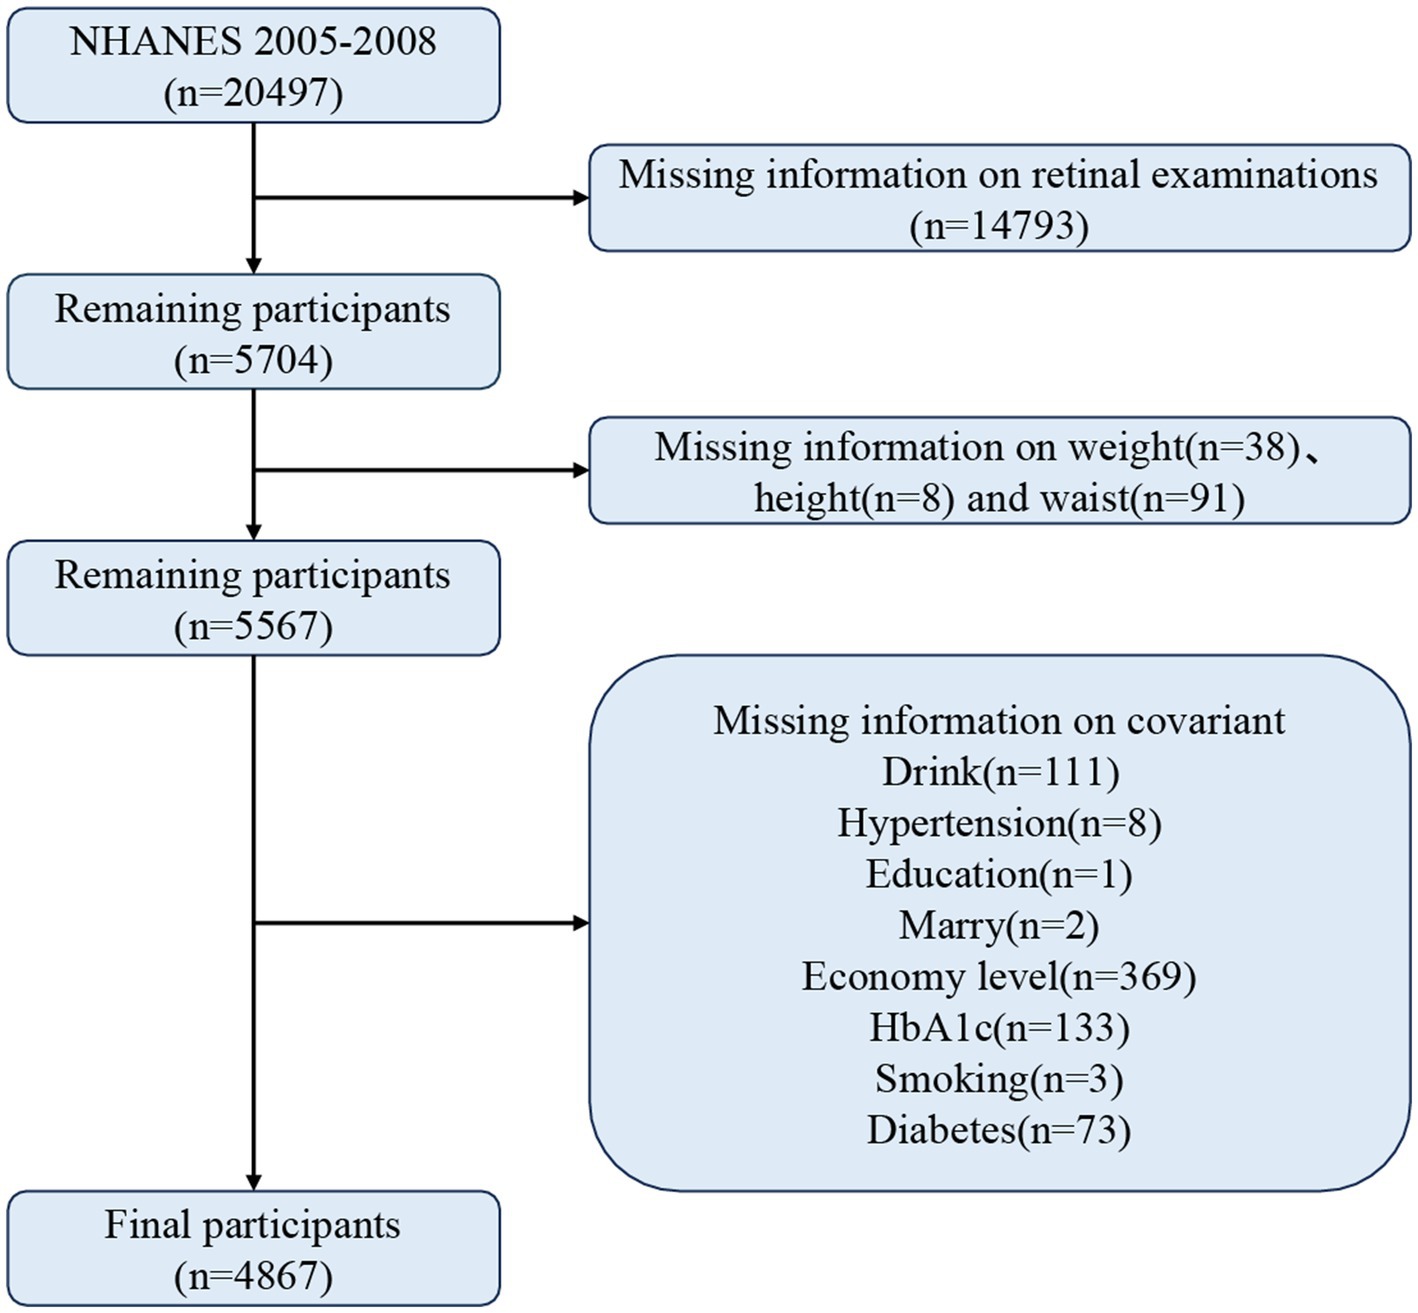
Figure 1. Screening flowchart for the study.
2.2 Assessment of retinopathy
Technicians used a Canon fundus camera to take color photographs of participants’ retinas, two from each eye. Two professional graders graded pictures according to the Early Treatment Diabetic Retinopathy Study (ETDRS) criteria: no retinopathy (<14 grades), retinopathy (> = 14 grades).
2.3 Calculation of obesity indicators
We calculate the following indicators using waist, height, and weight. The unit of weight is “kg,” the unit of height is “m,” and the unit of the waist is “m,” except for WWI.
2.4 Assessment of covariates
To better assess the relationship between these obesity indicators and retinopathy, we included influential covariates: age, sex, ethnicity, education, poverty income ratio, marital status, hemoglobinA1c (HbA1c), smoking and drinking status, and whether they had hypertension and diabetes. Of these, smoking, alcohol consumption, and hypertension were obtained from self-reported questionnaires. Diabetes was diagnosed if one of the following criteria was met: (1) being told by a doctor that they had diabetes; (2) taking glucose-lowering medication or insulin; and (3) having a HbA1c ≥ 6.5%.
2.5 Statistical analysis
Participants were divided into groups with and without retinopathy according to whether they had retinopathy. Continuous variables were expressed as weighted means (standard error) and categorical variables as sample sizes (weighted percentages), and statistical discrepancies between the different clusters were assessed using the t-test and Rao-Scott χ, respectively. We used weighted logistic regressions to test the association of obesity markers with retinopathy in the US and diabetic populations, respectively. Restricted cubic spline (RCS) models were applied further to detect a non-linear connection between obesity markers and retinopathy. In addition, we performed subgroup analyses and calculated interaction p-values according to age, sex, race, and education to assess the stability of their relationships. Finally, we calculated the area under the curve based on ROC curves to compare the predictive value of each indicator for retinopathy. Statistical analysis for this investigation was conducted using R (version 4.2.1) and EmpowerStats (version 2.0), with p < 0.05 as significant.
3 Results
3.1 Characteristics of participants
A total of 4,867 participants were enrolled, 47.6% of whom were male, with an average age of 56.18 (0.40). Of these participants, 596 were diagnosed with retinal disease. Table 1 shows more detailed information. People with retinopathy were more likely to be male, non-Hispanic White, educated to college level and above than participants without retinopathy, and to have higher levels of ABSI, BRI, CI, WHtR, TMI, WWI, and BMI. Retinal scores also divided the retinopathy group into a non-proliferative retinopathy group (grades 14–51) and a proliferative retinopathy group (grades 60–80). The results showed higher levels of ABSI, BRI, CI, WHtR, TMI, WWI, and BMI in the proliferative retinopathy group compared to the other.
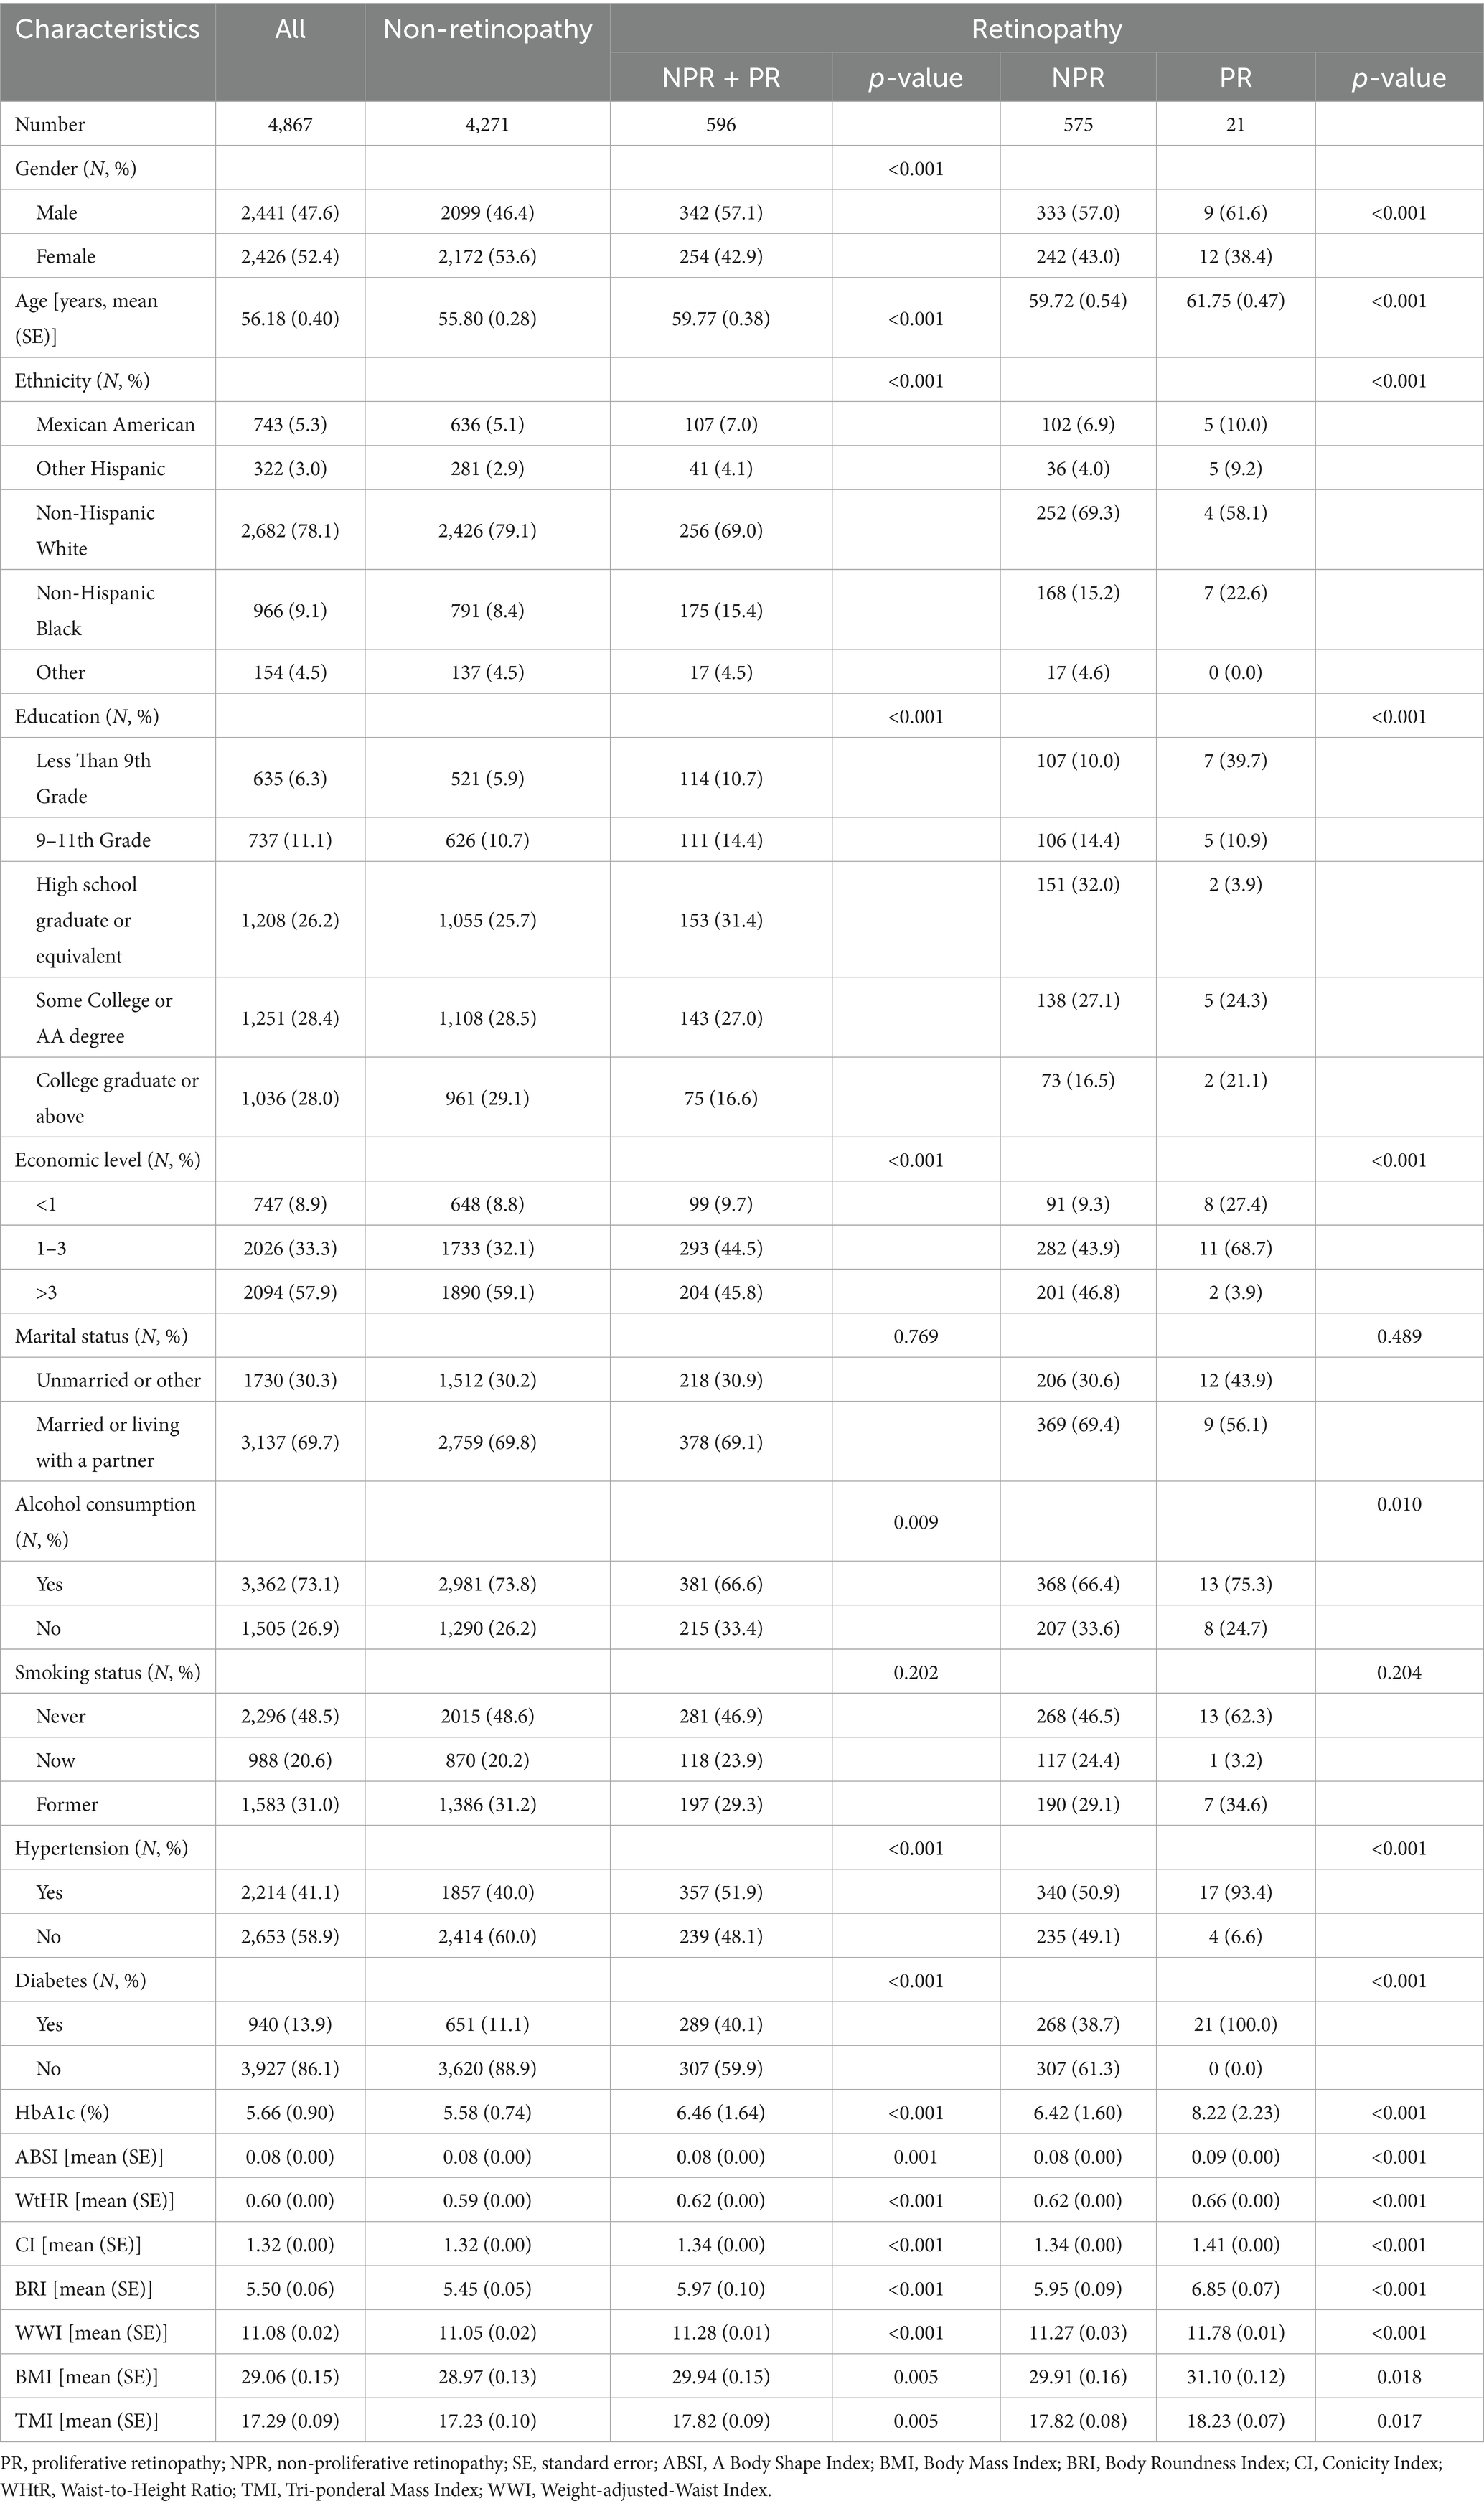
Table 1. Demographics classified with retinopathy.
3.2 Relationship between obesity indicators and retinopathy in the American population and the diabetic population
Multifactorial weighted logistic regression showed that WHtR, CI, BRI, WWI, BMI, and TMI were positively associated with retinopathy in the total population. When converted to categorical variables by quartile, compared to Q1 participants, Q4, the risk of retinopathy increased by 65, 44, 65, 56, 64, and 84%, respectively. In the diabetic population, we found a negative association between WWI and retinopathy, with a 39% decreased risk of having retinopathy in group Q3 (11.619–12.065) compared with group Q1 (9.381–11.136). The other indicators of obesity were not statistically significant. Detailed information can be found in Table 2 and Supplementary Table S1.
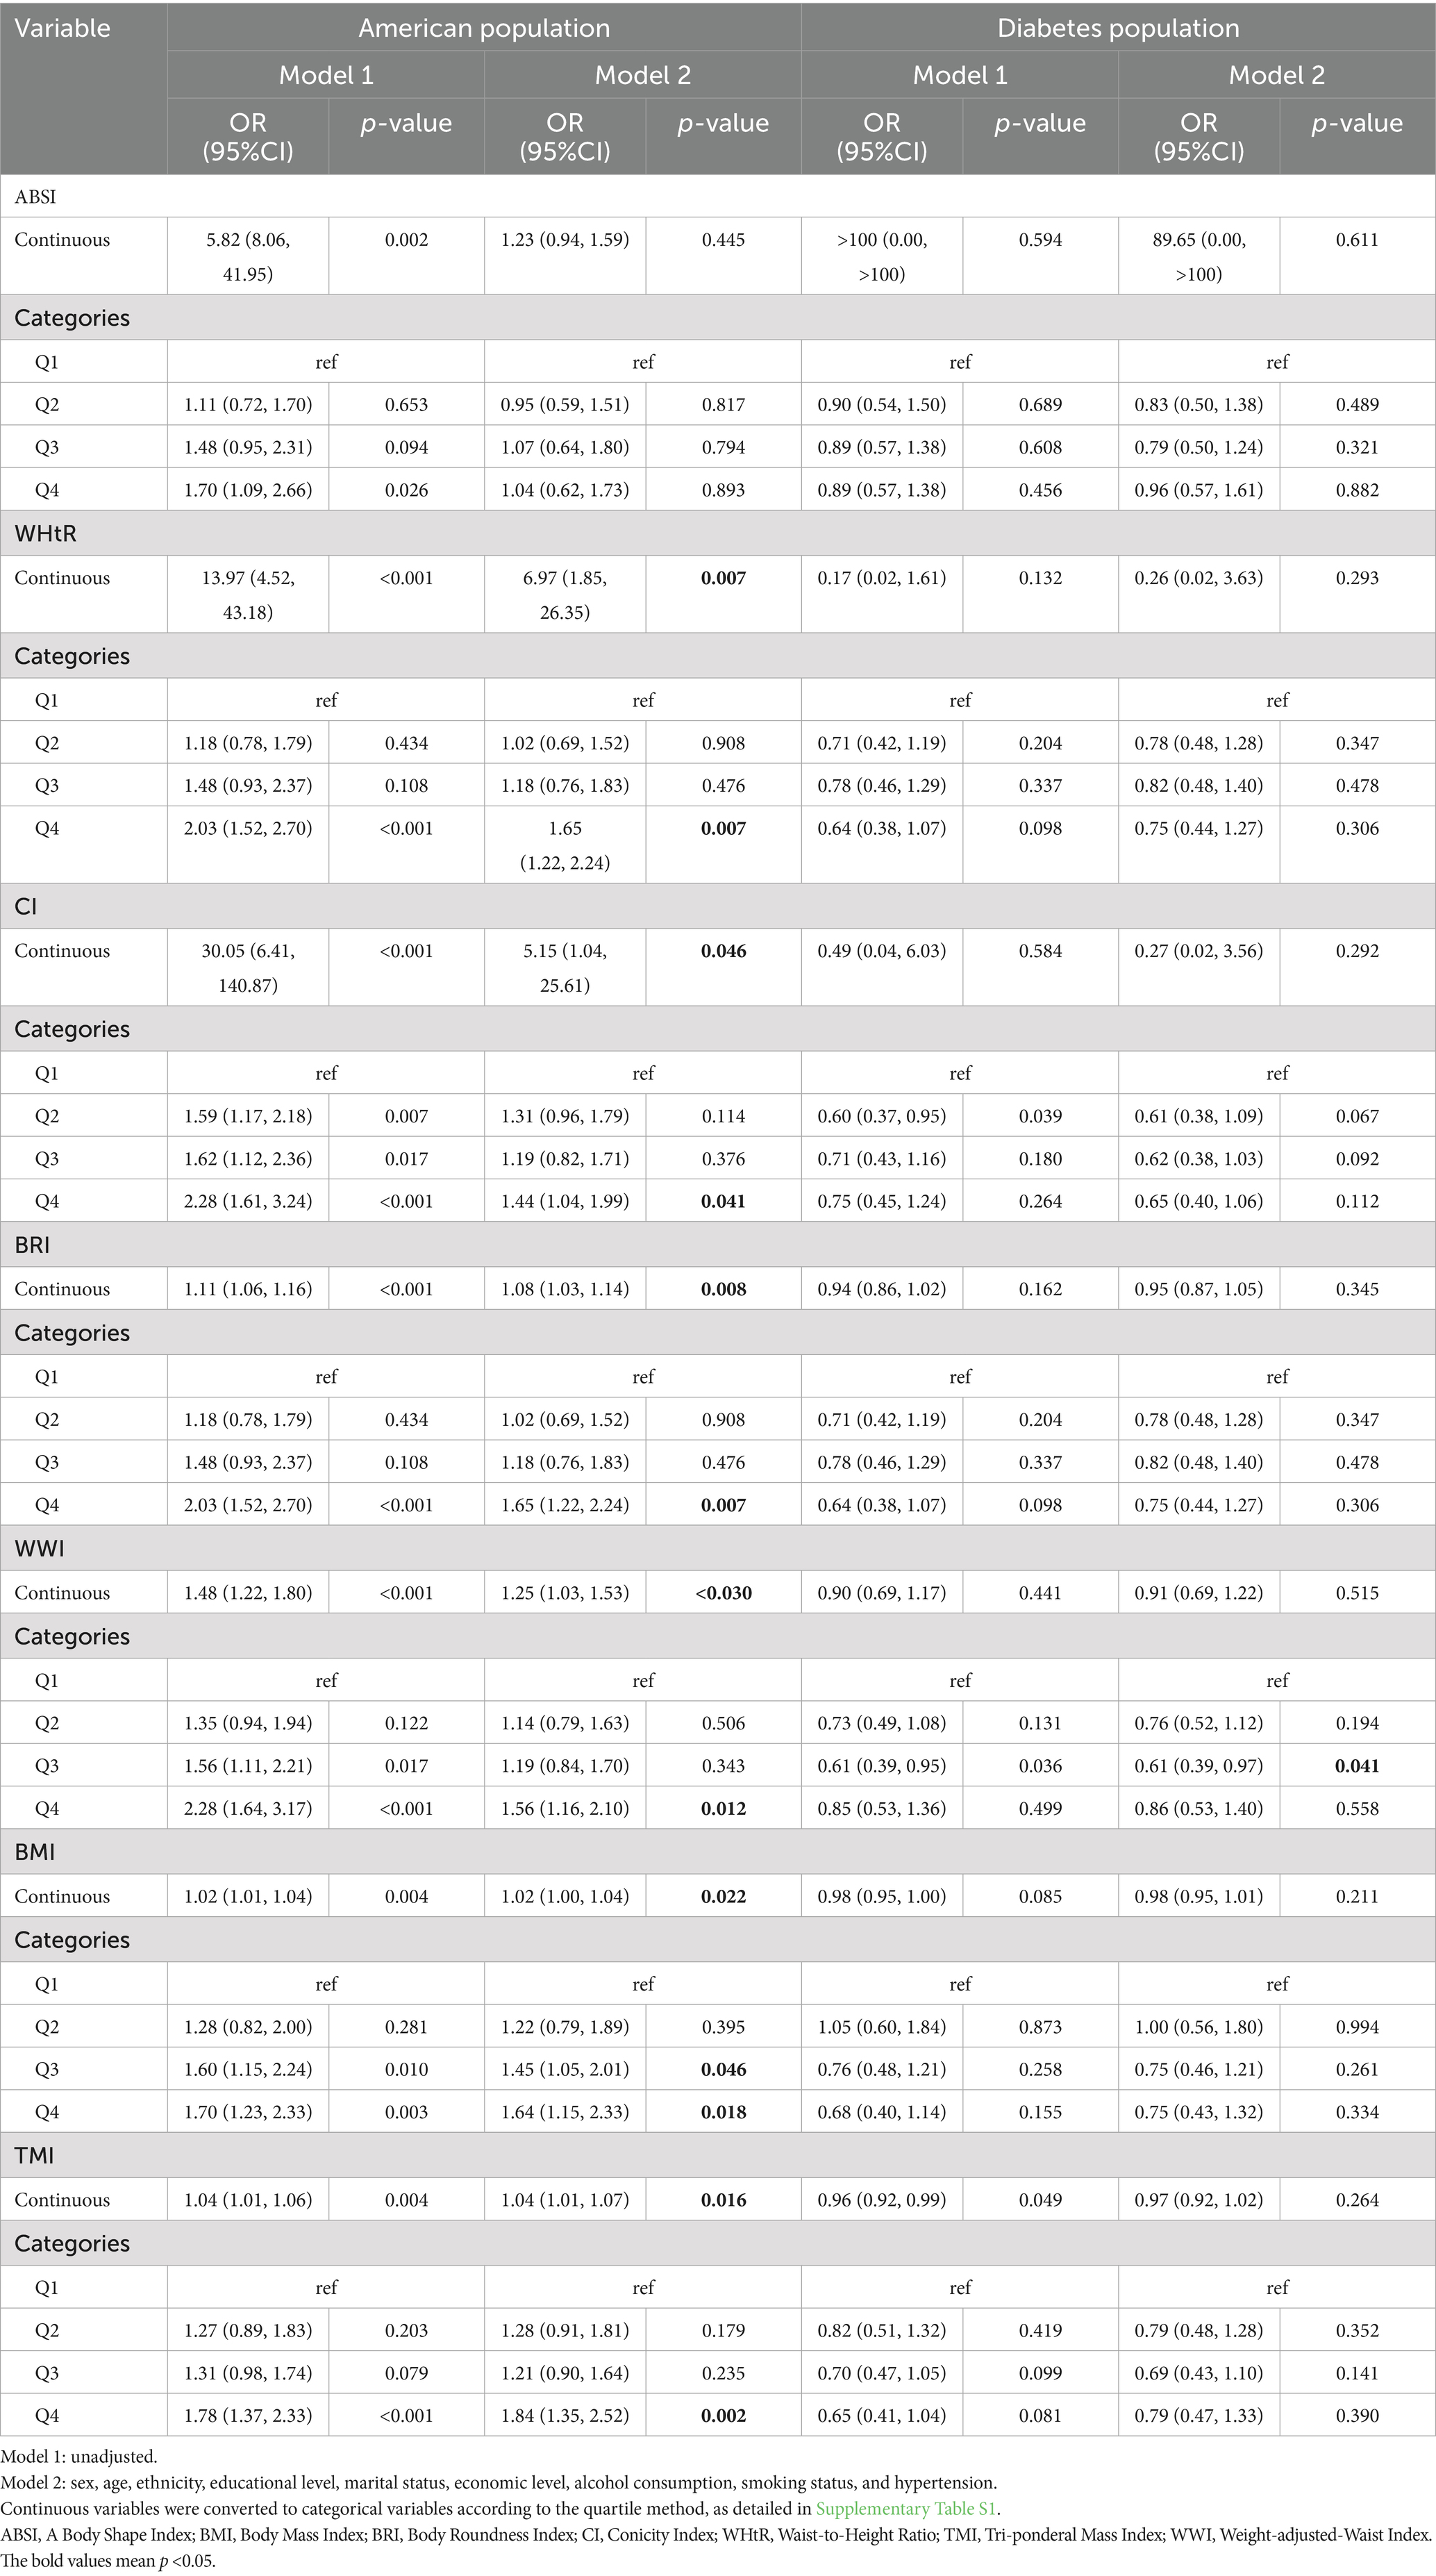
Table 2. Relationship between new obesity indicators and retinopathy in the American population and the diabetic population.
3.3 Linear relationship between obesity indicators and retinopathy
We used RCS to test whether there was a linear relationship between the new obesity indicators and retinopathy (Figure 2). After adjusting related variables, the linear relationship between BRI, CI, WHtR, TMI, WWI, and retinopathy is significant (p-non-linear>0.05). The relationship between BMI and retinopathy was an inverted U-shape, with the highest point corresponding to a BMI of approximately 34 kg/m2.
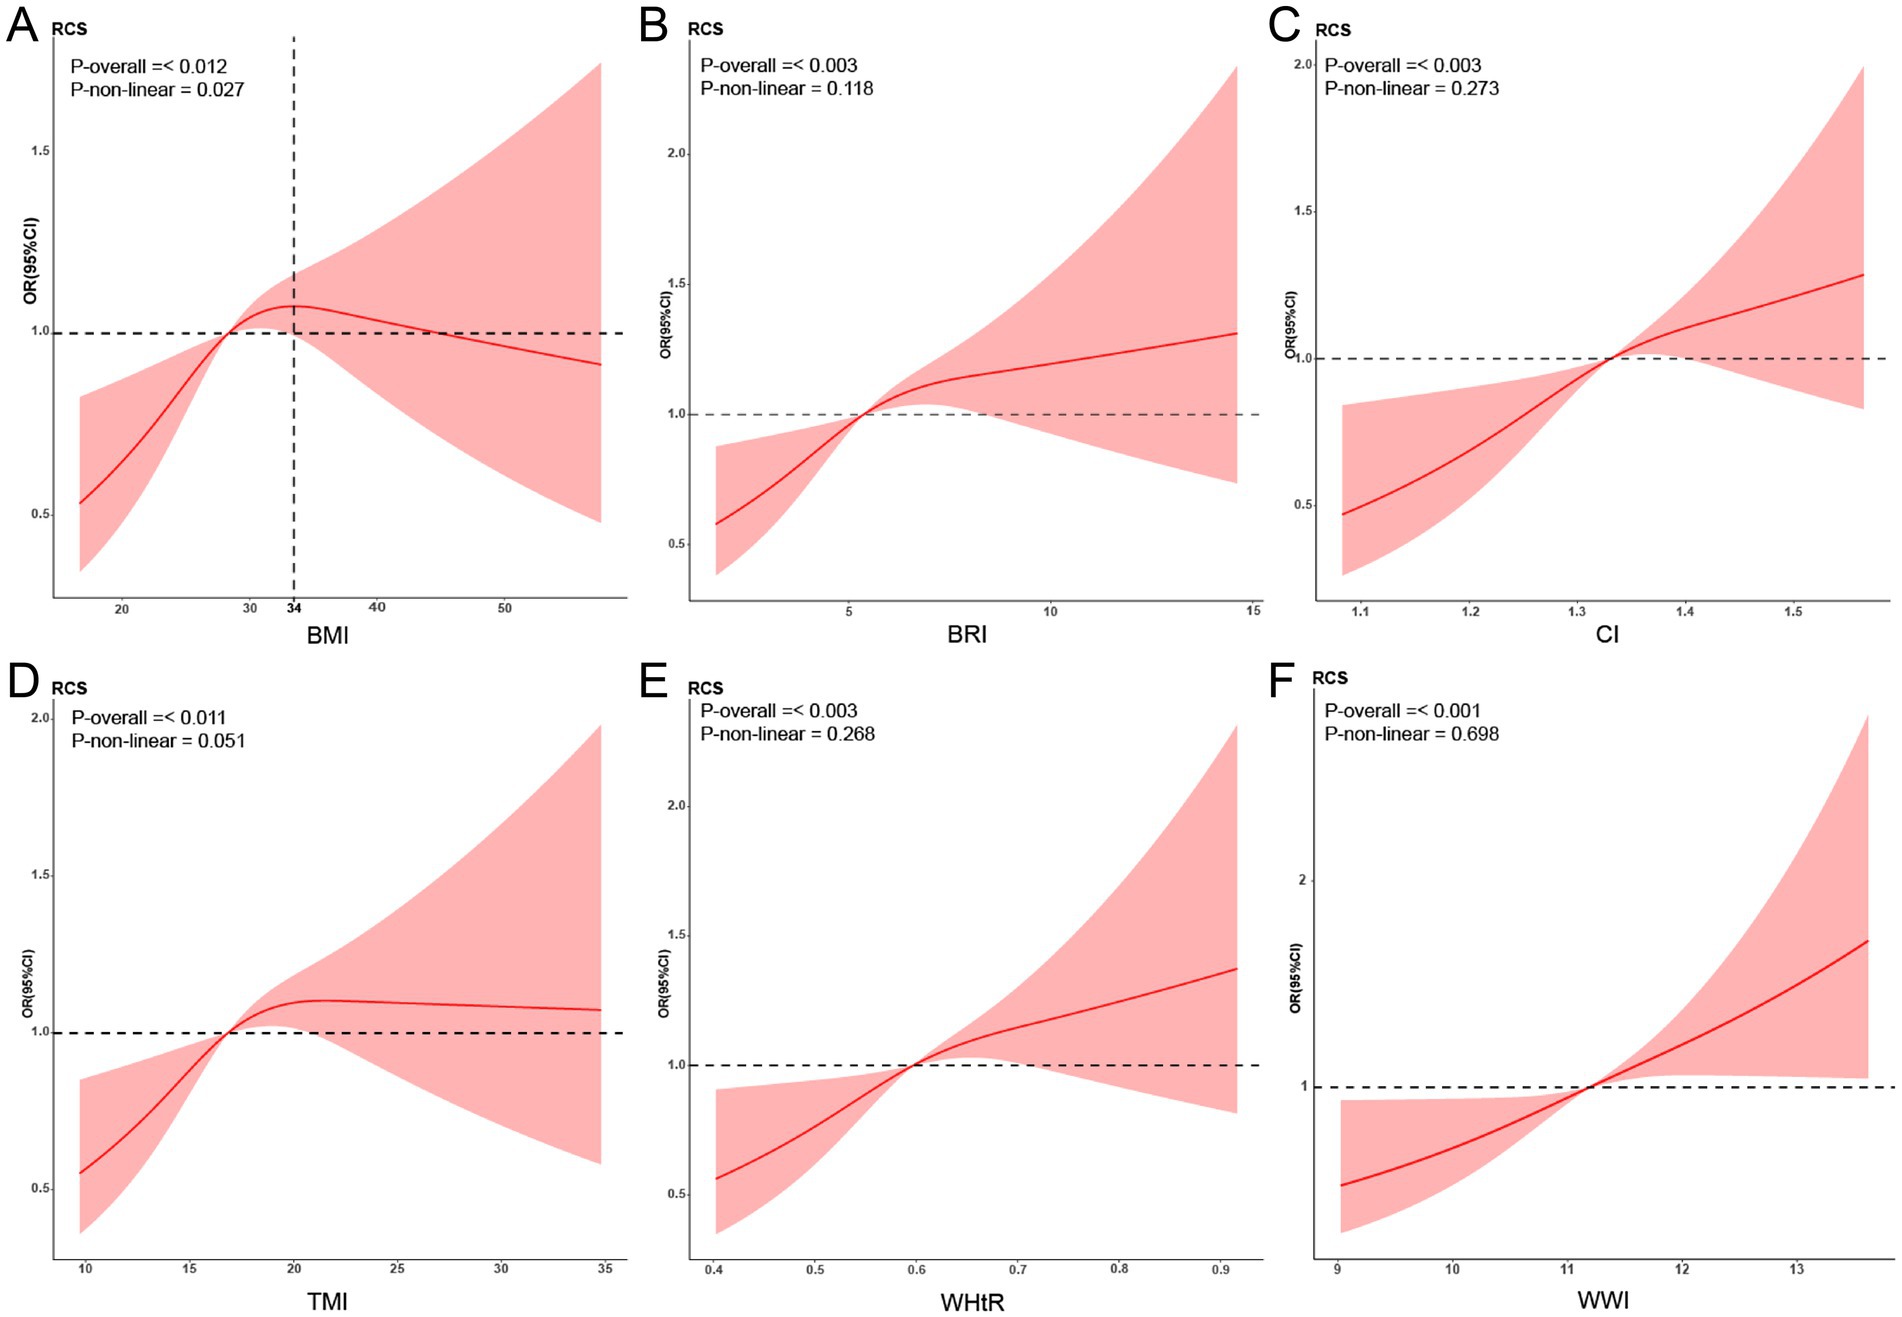
Figure 2. Restricted cubic spline (RCS) relationship between new obesity indicators and retinopathy. RCS analysis results for obesity indicators and retinopathy (A: BMI; B: BRI; C: CI; D: TMI; E: WHtR; F: WWI). The red curve in the figure represents the ratio (OR), and the shaded area represents the 95% confidence interval (CI). The adjustment factors include sex, age, ethnicity, educational level, marital status, economic level, alcohol consumption, smoking status, and hypertension. BMI, Body Mass Index; BRI, Body Roundness Index; CI, Conicity Index; WHtR, Waist-to-Height Ratio; TMI, Tri-ponderal Mass Index; WWI, Weight-adjusted-Waist Index.
3.4 Subgroup analyses
We examined the association between the obesity measures and retinopathy in different subgroups of age, sex, ethnicity, and education (Figure 3). The results showed that the obesity indicators were all statistically significant in those aged 60–85. However, the p-value for the interaction between the subgroups was more substantial than 0.05. This suggests that the association between the new measures and retinopathy is stable and not confounded by these covariates.
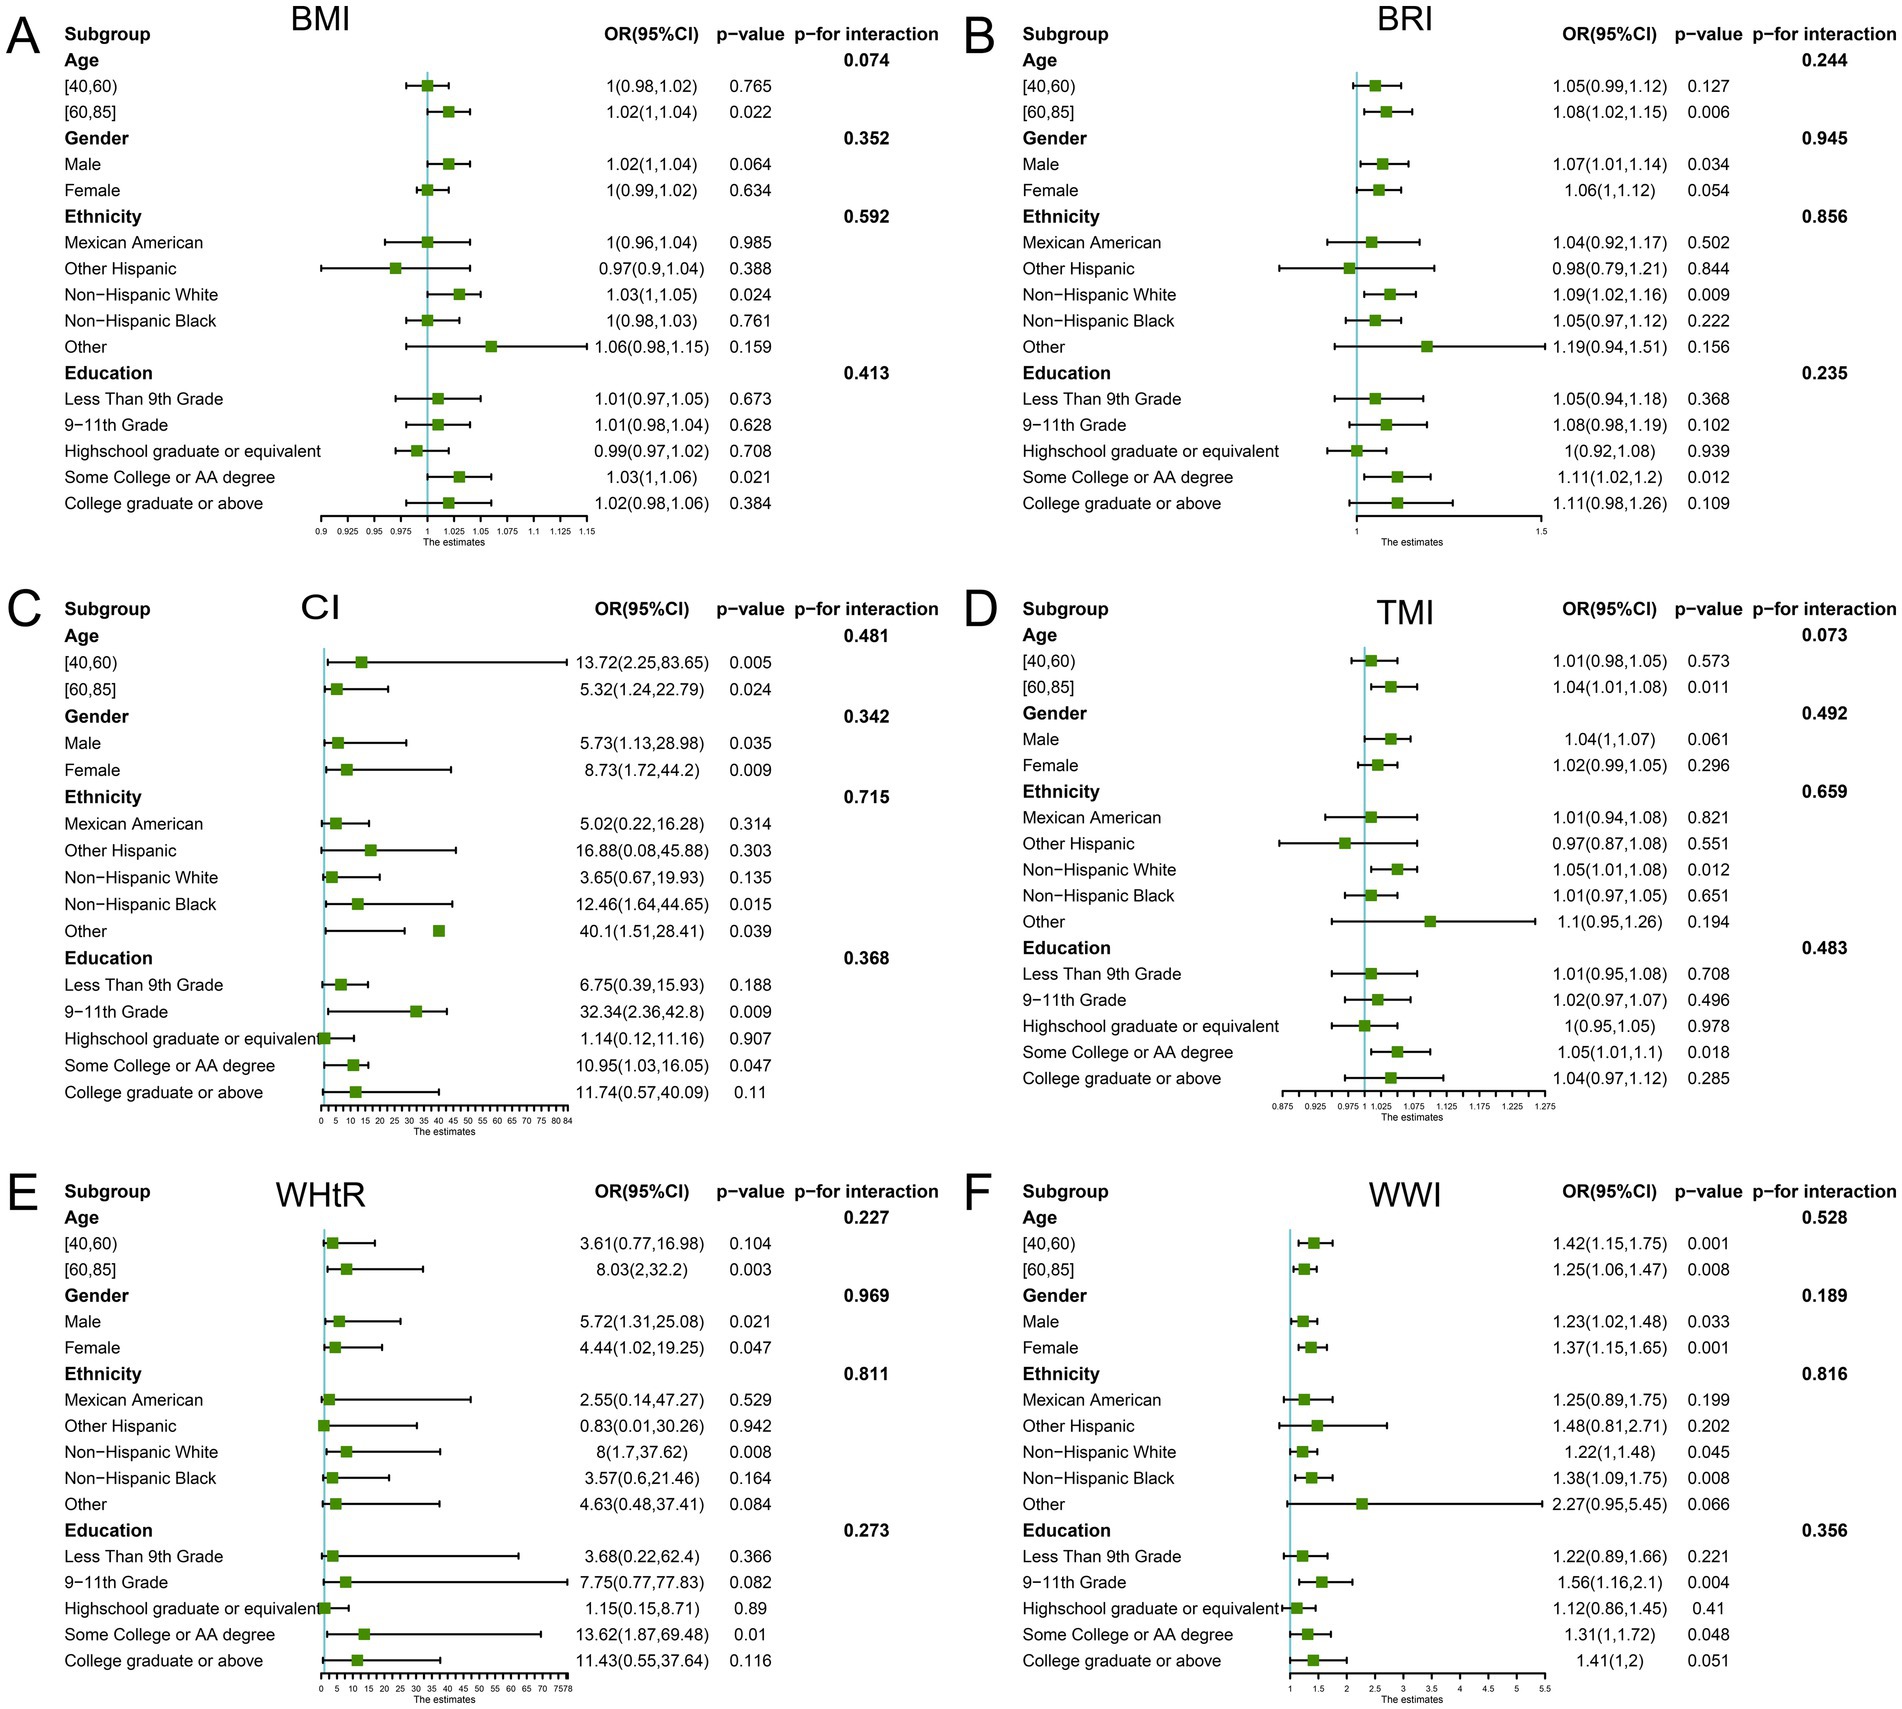
Figure 3. Subgroup analysis. Subgroup and interaction analyses of the association of obesity indicators and retinopathy (A: BMI; B: BRI; C: CI; D: TMI; E: WHtR; F: WWI). The green dots represent odd ratios (OR), and the bars on either side represent the 95% confidence intervals (CI). Each stratification was adjusted for sex, age, ethnicity, educational level, marital status, economic level, alcohol consumption, smoking status, and hypertension. BMI, Body Mass Index; BRI, Body Roundness Index; CI, Conicity Index; WHtR, Waist-to-Height Ratio; TMI, Tri-ponderal Mass Index; WWI, Weight-adjusted-Waist Index.
3.5 ROC analysis
To assess the predictive value of the new measures for retinopathy, we performed ROC analysis and calculated the area under the curve (AUC) for BRI (0.572), CI (0.577), WHtR (0.572), TMI (0.549), WWI (0.579) and BMI (0.549). Finally, WWI was found to have the highest predictive value for retinopathy (see Figure 4) for details.
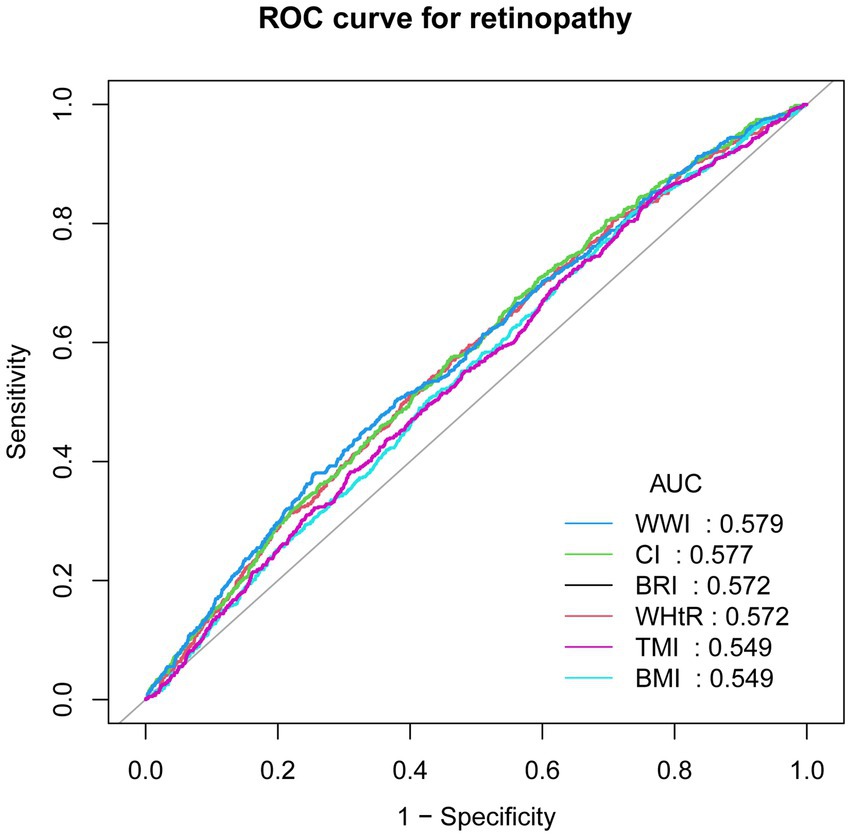
Figure 4. Receiver operating characteristic (ROC) curves analysis. ROC, receiver operating characteristic; AUC, area under the curve; BMI, Body Mass Index; BRI, Body Roundness Index; CI, Conicity Index; WHtR, Waist-to-Height Ratio; TMI, Tri-ponderal Mass Index; WWI, Weight-adjusted-Waist Index.
4 Discussion
This study is the first to examine the relationship between obesity indicators and retinopathy using data from 4,867 participants in the NHANES database. After adjustment for relevant covariates, BRI, CI, WHtR, TMI, and WWI were positively correlated with retinopathy. Subgroup analyses showed that this association was stable across populations. BRI, CI, WHtR, and WWI were more predictive of retinopathy than BMI, a conventional measure of obesity.
Obesity refutation has been shown to exist in many chronic diseases, and previous studies have shown that overweight and obese individuals have reduced mortality in patients with coronary heart disease, heart failure, and some types of breast cancer (26, 27). In the present study, we found an ‘obesity refutation’ of the relationship between BMI and retinopathy, and the risk of retinopathy decreases with an increase in BMI above 34 kg/m2. This may be related to lipocalin, secreted by white fat cells in obese people. Studies have shown that lipocalin can have anti-inflammatory and antioxidant effects under certain conditions (28, 29). Secondly, obese people are more likely to consume vitamins and minerals, nutrients that can reduce oxidative stress throughout the body and reduce retinal damage (30, 31).
Weight-adjusted-waist index is a new indicator of obesity, as proposed by Park et al. (32) A retrospective study found that the likelihood of having diabetic retinopathy decreased by 31% for every additional unit of WWI (33). Another study found a negative correlation between WWI and diabetic nephropathy when WWI < 11.48 (34). Similarly, we found that people with diabetes with WWI between 11.619 and 12.065 were less likely to develop retinopathy compared to people with diabetes with WWI (9.381–11.136). This may be related to the high levels of C-peptide in obese people with diabetes (35), which has been shown to increase retinal vascular blood flow and improve retinal endothelial cell function (36, 37). It may also counteract the production of ROS and inhibit the production of VEGF (38).
Sun et al. (39) found that WWI was more predictive of diabetes mellitus and hypertension than BMI (40). Several retrospective studies have also shown that newer indices like WWI and visceral adiposity index (VAI) are more predictive of diabetic retinopathy (41, 42). This suggests that BMI, which reflects generalized obesity, has limitations and that indicators reflecting fat distribution have more excellent clinical predictive value. Lee et al. (43) suggested that excess abdominal and visceral fat may be an essential risk factor for diabetic retinopathy. However, the above studies did not focus on fat distribution and other retinopathies. Therefore, we examined the association of these obesity markers with retinopathy in the American population. They were helpful as indicators for assessing the risk of developing retinopathy.
Obesity as a risk factor for retinopathy may be related to several aspects. Obesity is often associated with insulin resistance (44, 45), producing hyperglycemia. Prolonged hyperglycemia damages retinal endothelial cells, triggering retinal vascular hyperglycemia and leakage (46, 47), resulting in retinal damage. Second, visceral fat accumulation can disrupt the function of pancreatic β-cells, leading to persistent hyperglycemia. On the other hand, visceral fat can inhibit the secretion of adipokines (48, 49), leading to increased expression of inflammatory factors, including TNF-1A and IL-6, which damages the retina (50).
Our study is the first to comprehensively examine the association between six anthropometric measures and the prevalence of retinal disease, while also comparing their predictive value. The findings suggest that controlling obesity and improving body composition may help reduce the prevalence of retinal disorders. Among the indicators evaluated, the WWI demonstrated the strongest predictive potential. Therefore, individuals with higher WWI values may benefit from further retinal examinations. Such an approach could facilitate earlier detection and treatment of retinal disease, reduce the risk of vision loss or blindness, and ultimately conserve medical resources and alleviate societal burden. Moreover, given the close relationship between retinal health and chronic conditions such as diabetes and hypertension, paying closer attention to the retinal status of obese individuals may also contribute to improving their overall health outcomes.
We note that the study still has limitations: the population was from the United States, and the universality of these findings needs further exploration. Due to the limitations of a cross-sectional study, it was impossible to explain the specific mechanisms linking the measurements to retinopathy. In addition, it was impossible to fully adjust for relevant covariates and exclude the influence of confounding factors.
5 Conclusion
In this study, using NHANES data, we found that obesity indicators (BRI, CI, WHtR, TMI, WWI, and BMI) and retinopathy were significantly and positively correlated and had some predictive value for retinopathy. It is recommended that the risk of retinopathy be reduced by keeping these indicators within safe limits through a healthy lifestyle. Combining these indicators by clinicians is helpful in the prevention and early diagnosis of retinopathy.
Data availability statement
Publicly available datasets were analyzed in this study. This data can be found at: NHANES is a public database, and all researchers can access the data from www.cdc.gov/nchs/nhanes.
Ethics statement
This research was approved by the National Center for Health Statistics Ethics Review Board. The studies were conducted in accordance with the local legislation and institutional requirements. The participants provided their written informed consent to participate in this study.
Author contributions
C-XW: Data curation, Writing – original draft, Conceptualization, Methodology. MK: writing - review & editing. J-JH: Writing – original draft, Visualization. S-YL: Writing – original draft, Formal analysis. S-ZL: Writing – original draft, Data curation. NB: Writing – review & editing. Z-XJ: Supervision, Writing – review & editing, Funding acquisition.
Funding
The author(s) declare that financial support was received for the research and/or publication of this article. This research was funded by the National Natural Science Foundation of China (No. 82371080, 82070986 and 82171043, 82471094), the Natural Science Funds for Distinguished Young Scholar of Anhui Province (Nos. 2308085J29, 2023AH020046).
Acknowledgments
The authors thank the researchers responsible for designing, collecting, and uploading the NHANES database.
Conflict of interest
The authors declare that the research was conducted in the absence of any commercial or financial relationships that could be construed as a potential conflict of interest.
Generative AI statement
The authors declare that no Gen AI was used in the creation of this manuscript.
Publisher’s note
All claims expressed in this article are solely those of the authors and do not necessarily represent those of their affiliated organizations, or those of the publisher, the editors and the reviewers. Any product that may be evaluated in this article, or claim that may be made by its manufacturer, is not guaranteed or endorsed by the publisher.
Supplementary material
The Supplementary material for this article can be found online at: https://www.frontiersin.org/articles/10.3389/fnut.2025.1598240/full#supplementary-material
Abbreviations
NHANES, National Health and Nutrition Examination Survey; ABSI, A Body Shape Index; BMI, Body Mass Index; BRI, Body Roundness Index; CI, Conicity Index; WHtR, Waist-to-Height Ratio; TMI, Tri-ponderal Mass Index; WWI, Weight-adjusted-Waist Index; HbA1c, Hemoglobin A1c; OR, Odds Ratio; CI, Confidence Interval; RCS, Restricted Cubic Spline.
References
1. Yau, JWY, Rogers, SL, Kawasaki, R, Lamoureux, EL, Kowalski, JW, Bek, T, et al. Global prevalence and major risk factors of diabetic retinopathy. Diabetes Care. (2012) 35:556–64. doi: 10.2337/dc11-1909
2. Liu, X, Chang, Y, Li, Y, Liu, Y, Chen, N, and Cui, J. Association between cardiovascular health and retinopathy in US adults: from NHANES 2005-2008. Am J Ophthalmol. (2024) 266:56–67. doi: 10.1016/j.ajo.2024.05.019
3. Zhang, X, Saaddine, JB, Chou, C-F, Cotch, MF, Cheng, YJ, Geiss, LS, et al. Prevalence of diabetic retinopathy in the United States, 2005-2008. JAMA. (2010) 304:649–56. doi: 10.1001/jama.2010.1111
4. Klein, R, Zinman, B, Gardiner, R, Suissa, S, Donnelly, SM, Sinaiko, AR, et al. The relationship of diabetic retinopathy to preclinical diabetic glomerulopathy lesions in type 1 diabetic patients: the renin-angiotensin system study. Diabetes. (2005) 54:527–33. doi: 10.2337/diabetes.54.2.527
5. Cheung, N, and Wong, TY. Diabetic retinopathy and systemic vascular complications. Prog Retin Eye Res. (2008) 27:161–76. doi: 10.1016/j.preteyeres.2007.12.001
6. Man, RE, Sabanayagam, C, Chiang, PP, Li, LJ, Noonan, JE, Wang, JJ, et al. Differential association of generalized and abdominal obesity with diabetic retinopathy in Asian patients with type 2 diabetes. JAMA Ophthalmol. (2016) 134:251–7. doi: 10.1001/jamaophthalmol.2015.5103
7. Liu, K, Gao, X, Hu, C, Gui, Y, Gui, S, Ni, Q, et al. Capsaicin ameliorates diabetic retinopathy by inhibiting poldip2-induced oxidative stress. Redox Biol. (2022) 56:102460. doi: 10.1016/j.redox.2022.102460
8. Kang, Q, and Yang, C. Oxidative stress and diabetic retinopathy: molecular mechanisms, pathogenetic role and therapeutic implications. Redox Biol. (2020) 37:101799. doi: 10.1016/j.redox.2020.101799
9. Wu, M-Y, Yiang, G-T, Lai, T-T, and Li, C-J. The oxidative stress and mitochondrial dysfunction during the pathogenesis of diabetic retinopathy. Oxidative Med Cell Longev. (2018) 2018:5. doi: 10.1155/2018/3420187
10. Alfonso-Muñoz, EA, Burggraaf-Sánchez de las Matas, R, Mataix Boronat, J, Molina Martín, JC, and Desco, C. Role of Oral antioxidant supplementation in the current Management of Diabetic Retinopathy. Int J Mol Sci. (2021) 22:4020. doi: 10.3390/ijms22084020
11. Wang, Y, Zhao, L, Gao, L, Pan, A, and Xue, H. Health policy and public health implications of obesity in China. Lancet Diabetes Endocrinol. (2021) 9:446–61. doi: 10.1016/S2213-8587(21)00118-2
12. Ng, M, Fleming, T, Robinson, M, Thomson, B, Graetz, N, Margono, C, et al. Global, regional, and national prevalence of overweight and obesity in children and adults during 1980-2013: a systematic analysis for the global burden of disease study 2013. Lancet. (2014) 384:766–81. doi: 10.1016/S0140-6736(14)60460-8
13. Nyström, T, Andersson Franko, M, Ludvigsson, J, Lind, M, and Persson, M. Overweight or obesity, weight variability and the risk of retinopathy in type 1 diabetes. Diabetes Obes Metab. (2024) 26:2509–12. doi: 10.1111/dom.15545
14. Fu, S, Zhang, L, Xu, J, Liu, X, and Zhu, X. Association between abdominal obesity and diabetic retinopathy in patients with diabetes mellitus: a systematic review and meta-analysis. PLoS One. (2023) 18:e0279734. doi: 10.1371/journal.pone.0279734
15. Piqueras, P, Ballester, A, Durá-Gil, JV, Martinez-Hervas, S, Redón, J, and Real, JT. Anthropometric indicators as a tool for diagnosis of obesity and other health risk factors: a literature review. Front Psychol. (2021) 12:631179. doi: 10.3389/fpsyg.2021.631179
16. Omura-Ohata, Y, Son, C, Makino, H, Koezuka, R, Tochiya, M, Tamanaha, T, et al. Efficacy of visceral fat estimation by dual bioelectrical impedance analysis in detecting cardiovascular risk factors in patients with type 2 diabetes. Cardiovasc Diabetol. (2019) 18:137. doi: 10.1186/s12933-019-0941-y
17. Wu, X, Song, Y, and Wu, S. The development and evaluation of nine obesity-based indices for gallstones in U.S. adults. Int J Surg. (2025) 111:2348–57. doi: 10.1097/JS9.0000000000002237
18. Pan, X, Liu, F, Fan, J, Guo, Q, Guo, M, Chen, Y, et al. Association of Body Roundness Index and a Body Shape Index with obstructive sleep apnea: insights from NHANES 2015-2018 data. Front Nutr. (2024) 11:18. doi: 10.3389/fnut.2024.1492673
19. Li, Q, Qie, R, Qin, P, Zhang, D, Guo, C, Zhou, Q, et al. Association of weight-adjusted-waist index with incident hypertension: the rural Chinese cohort study. Nutr Metab Cardiovasc Dis. (2020) 30:1732–41. doi: 10.1016/j.numecd.2020.05.033
20. Jin, J, Zheng, Y, Gao, T, Lin, X, Li, S, and Huang, C. Associations between the waist-to-height ratio index and migraine: a cross-section study of the NHANES 1999-2004. PLoS One. (2024) 19:e0312321. doi: 10.1371/journal.pone.0312321
21. Chen, X, Wu, Z, Hou, X, Yu, W, Gao, C, Gou, S, et al. Association between anthropometric indices and chronic kidney disease: insights from NHANES 2009-2018. PLoS One. (2025) 20:e0311547. doi: 10.1371/journal.pone.0311547
22. American Diabetes Association. Standards of medical care in diabetes--2014. Diabetes Care. (2014) 37:S14–80. doi: 10.2337/dc14-S014
23. Sekgala, MD, Sewpaul, R, Kengne, AP, Mchiza, Z, and Peer, N. Clinical utility of novel anthropometric indices in identifying type 2 diabetes mellitus among south African adult females. BMC Public Health. (2024) 24:2676. doi: 10.1186/s12889-024-20168-7
24. Zhang, X, Ye, R, Sun, L, Liu, X, Wang, S, Meng, Q, et al. Relationship between novel anthropometric indices and the incidence of hypertension in Chinese individuals: a prospective cohort study based on the CHNS from 1993 to 2015. BMC Public Health. (2023) 23:436. doi: 10.1186/s12889-023-15208-7
25. Lin, G, Zhan, F, Ren, W, Pan, Y, and Wei, W. Association between novel anthropometric indices and prevalence of kidney stones in US adults. World J Urol. (2023) 41:3105–11. doi: 10.1007/s00345-023-04582-x
26. Simati, S, Kokkinos, A, Dalamaga, M, and Argyrakopoulou, G. Obesity paradox: fact or fiction? Curr Obes Rep. (2023) 12:75–85. doi: 10.1007/s13679-023-00497-1
27. Key, TJ, and Pike, MC. The role of oestrogens and progestagens in the epidemiology and prevention of breast cancer. Eur J Cancer Clin Oncol. (1988) 24:29–43. doi: 10.1016/0277-5379(88)90173-3
28. Hand, LE, Usan, P, Cooper, GJS, Xu, LY, Ammori, B, Cunningham, PS, et al. Adiponectin induces A20 expression in adipose tissue to confer metabolic benefit. Diabetes. (2015) 64:128–36. doi: 10.2337/db13-1835
29. Okuno, Y, Fukuhara, A, Hashimoto, E, Kobayashi, H, Kobayashi, S, Otsuki, M, et al. Oxidative stress inhibits healthy adipose expansion through suppression of SREBF1-mediated Lipogenic pathway. Diabetes. (2018) 67:1113–27. doi: 10.2337/db17-1032
30. Rapa, SF, di Iorio, BR, Campiglia, P, Heidland, A, and Marzocco, S. Inflammation and oxidative stress in chronic kidney disease-potential therapeutic role of minerals, vitamins and plant-derived metabolites. Int J Mol Sci. (2019) 21:263. doi: 10.3390/ijms21010263
31. Pellegrini, M, Senni, C, Bernabei, F, Cicero, AFG, Vagge, A, Maestri, A, et al. The role of nutrition and nutritional supplements in ocular surface diseases. Nutrients. (2020) 12:952. doi: 10.3390/nu12040952
32. Park, Y, Kim, NH, Kwon, TY, and Kim, SG. A novel adiposity index as an integrated predictor of cardiometabolic disease morbidity and mortality. Sci Rep. (2018) 8:16753. doi: 10.1038/s41598-018-35073-4
33. Li, X, Huang, Y, and Chen, M. Correlation of weight-adjusted waist index with diabetic retinopathy in US adults aged ≥ 40 years: the NHANES 2005-2008. Sci Rep. (2024) 14:19369. doi: 10.1038/s41598-024-69404-5
34. Ding, Y, Lv, S, Xie, R, Ye, W, Luo, Y, and Li, Y. Association of weight-adjusted waist index and diabetic kidney disease in type 2 diabetes mellitus. Endocr Connect. (2024) 13:e230491. doi: 10.1530/EC-23-0491
35. Ahrén, J, Ahrén, B, and Wierup, N. Increased β-cell volume in mice fed a high-fat diet: a dynamic study over 12 months. Islets. (2010) 2:353–6. doi: 10.4161/isl.2.6.13619
36. Wallerath, T, Kunt, T, Forst, T, Closs, EI, Lehmann, R, Flohr, T, et al. Stimulation of endothelial nitric oxide synthase by proinsulin C-peptide. Nitric Oxide Biol Chem. (2003) 9:95–102. doi: 10.1016/j.niox.2003.08.004
37. Chen, J, Huang, Y, Liu, C, Chi, J, Wang, Y, and Xu, L. The role of C-peptide in diabetes and its complications: an updated review. Front Endocrinol. (2023) 14:1256093. doi: 10.3389/fendo.2023.1256093
38. Ushio-Fukai, M, and Nakamura, Y. Reactive oxygen species and angiogenesis: NADPH oxidase as target for cancer therapy. Cancer Lett. (2008) 266:37–52. doi: 10.1016/j.canlet.2008.02.044
39. Sun, Q, Yang, Y, Liu, J, Ye, F, Hui, Q, Chen, Y, et al. Association of the weight-adjusted waist index with hypertension in the context of predictive, preventive, and personalized medicine. EPMA J. (2024) 15:491–500. doi: 10.1007/s13167-024-00375-3
40. Wu, J, and Guo, J. Is weight-adjusted waist index more strongly associated with diabetes than body mass index and waist circumference?: results from the database large community sample study. PLoS One. (2024) 19:e0309150. doi: 10.1371/journal.pone.0309150
41. Wei, B, Zhou, L, Shu, B-L, Huang, Q-Y, Chai, H, Yuan, H-Y, et al. Association of diabetic retinopathy with plasma atherosclerotic index, visceral obesity index, and lipid accumulation products: NHANES 2005-2008. Lipids Health Dis. (2024) 23:331. doi: 10.1186/s12944-024-02325-4
42. Wang, S, Qin, H, Zhang, Y, Yang, N, and Zhao, J. The relationship between weight-adjusted-waist index, body mass index and diabetic retinopathy among American adults: a population-based analysis. Sci Rep. (2024) 14:23837. doi: 10.1038/s41598-024-75211-9
43. Lee, YJ, Kim, JJ, Kim, J, Cho, DW, and Won, JY. The correlation between waist circumference and the pro-inflammatory adipokines in diabetic retinopathy of type 2 diabetes patients. Int J Mol Sci. (2023) 24:2036. doi: 10.3390/ijms24032036
44. Lee, JS, Kim, SH, Jun, DW, Han, JH, Jang, EC, Park, JY, et al. Clinical implications of fatty pancreas: correlations between fatty pancreas and metabolic syndrome. World J Gastroenterol. (2009) 15:1869–75. doi: 10.3748/wjg.15.1869
45. Lu, T, Wang, Y, Dou, T, Xue, B, Tan, Y, and Yang, J. Pancreatic fat content is associated with β-cell function and insulin resistance in Chinese type 2 diabetes subjects. Endocr J. (2019) 66:265–70. doi: 10.1507/endocrj.EJ18-0436
46. Hammes, H-P. Diabetic retinopathy: hyperglycaemia, oxidative stress and beyond. Diabetologia. (2018) 61:29–38. doi: 10.1007/s00125-017-4435-8
47. Yang, J, and Liu, Z. Mechanistic pathogenesis of endothelial dysfunction in diabetic nephropathy and retinopathy. Front Endocrinol. (2022) 13:816400. doi: 10.3389/fendo.2022.816400
48. Wagner, R, Eckstein, SS, Yamazaki, H, Gerst, F, Machann, J, Jaghutriz, BA, et al. Metabolic implications of pancreatic fat accumulation. Nat Rev Endocrinol. (2022) 18:43–54. doi: 10.1038/s41574-021-00573-3
49. Rodríguez, A, Ezquerro, S, Méndez-Giménez, L, Becerril, S, and Frühbeck, G. Revisiting the adipocyte: a model for integration of cytokine signaling in the regulation of energy metabolism. Am J Physiol Endocrinol Metab. (2015) 309:E691–714. doi: 10.1152/ajpendo.00297.2015
Keywords: obesity, retinopathy, NHANES, American, cross-sectional study
Citation: Wang C-X, Kuang M, Hou J-J, Lin S-Y, Liu S-Z, Bao N and Jiang Z-X (2025) Association between obesity indicators and retinopathy in US adults: NHANES 2005–2008. Front. Nutr. 12:1598240. doi: 10.3389/fnut.2025.1598240
Edited by:
Mithun Rudrapal, Vignan’s Foundation for Science, Technology and Research, IndiaReviewed by:
Prashanta Kumar Deb, University of Texas Medical Branch at Galveston, United StatesKratika Singh, Centre of Bio-Medical Research (CBMR), India
Copyright © 2025 Wang, Kuang, Hou, Lin, Liu, Bao and Jiang. This is an open-access article distributed under the terms of the Creative Commons Attribution License (CC BY). The use, distribution or reproduction in other forums is permitted, provided the original author(s) and the copyright owner(s) are credited and that the original publication in this journal is cited, in accordance with accepted academic practice. No use, distribution or reproduction is permitted which does not comply with these terms.
*Correspondence: Zheng-Xuan Jiang, amlhbmd6aGVuZ3h1YW5AYWhtdS5lZHUuY24=; Ning Bao, YmFvbmluZ2xlb25AMTYzLmNvbQ==
†These authors share first authorship