 Jiawang Bai1,2
 Mengyuan Chen1,2Wenfeng Hou1,2
 Yan Han1,2Jihong Shao1,2Ying Zhang1,2Yang Jiao1,2Hui Hua1,2
 Xiangmei Ren1,2*
- 1School of Public Health, Xuzhou Medical University, Xuzhou, Jiangsu, China
- 2Jiangsu Engineering Research Center of Biological Data Mining and Healthcare Transformation, Xuzhou Medical University, Xuzhou, Jiangsu, China
Background: Overweight and obesity among college students have become significant public health concerns. This study aims to develop a nomogram model for assessing obesity risk in college students.
Methods: A cross-sectional study was conducted among college students in Xuzhou. Demographic, dietary, and lifestyle information was obtained through self-administered questionnaires, while body composition was assessed using the InBody 570 analyzer. Dietary patterns and obesity prevalence were examined through multiple indicators. Principal component analysis (PCA), logistic regression, and a non-invasive risk assessment model based on percentage of body fat (PBF) were applied.
Results: The vegetable meat grain dietary pattern and milk egg dietary pattern were associated with a reduced risk of PBF (P < 0.01), while the snack mode dietary pattern and aquatic meat dietary pattern increased the risk of PBF (P < 0.05). Binary logistic regression identified gender, physical activity, late-night snacking, regular meals, and a healthy diet as key predictors of PBF obesity in college students. The model achieved an area under curve (AUC) of 0.805, with a non-significant Hosmer–Lemeshow (H–L) test (P > 0.05). Decision curve analysis (DCA) showed that the model outperformed extreme curves, indicating its reliability.
Conclusion: This study highlights the high prevalence of overweight and obesity among college students and the importance of using multiple indicators for comprehensive evaluation. The developed PBF-based nomogram model demonstrates potential for obesity screening but requires further validation in diverse populations.
1 Introduction
The global burden of overweight and obesity has tripled over the past 50 years, posing an urgent public health challenge (1). More than half the European and North American population was overweight or obese (2). Such trend is mirrored in China, where the prevalence of overweight and obesity among adults has exceeded 50% and is projected to reach 65.3% by 2030, with substantial implications for healthcare costs. This trend was expected to lead to medical costs exceeding 58.52 billion United States Dollar (USD), representing approximately 21.5% of China’s total healthcare expenditure (3). Beyond economic burdens, obesity profoundly compromises cognitive function through reduced concentration and memory linked to poor sleep, and psychological wellbeing by elevating depression and anxiety from weight stigmatization (4); manifesting as elevated clinical depression and anxiety disorders among obese students (5), pathological eating behaviors like binge-restrict cycles, and social withdrawal due to body image dissatisfaction, collectively impairing identity formation during this critical developmental stage and long-term health trajectories. Among college students, 47.3% with late-night snacking habits face 9.8-fold higher obesity risk, while high-fat dietary patterns like aquatic meat directly increase visceral adiposity. These synergistically impair academic performance, social adaptability, and lifelong productivity, underscoring the need for targeted interventions.
The prevalence of overweight and obesity was substantially high among college students (6). Several studies have shown that 1/3 college students have overweight or obesity and the prevalence rate of obesity in men was significantly higher than that in women (7, 8). Obesity is influenced by a complex interplay of genetic, environmental, and behavioral factors. While genetic predisposition plays a role, the rapid increase in obesity rates highlights the critical influence of environmental and lifestyle changes (9). Dietary habits and lifestyle factors may determine the obesity phenotypes in children and adolescents (10). Recent researches have linked overweight and obesity in this group to unhealthy habits such as a strong preference for high-fat and high-sugar foods, insufficient physical activity, inadequate sleep, and cigarette consumption (11–13). Furthermore, sociodemographic factors, including age, education level, household income, and nutritional knowledge, also contribute to the incidence of overweight and obesity (14).
There are various methods for measuring obesity, and different countries and regions may use different measurement indicators. Most studies only used a single indicator (15), while the combination of multiple indicators can comprehensively consider multiple factors, reduce errors, and improve prediction accuracy. The bioelectrical impedance analyzer (BIA) is a portable, efficient, and fast method that can simultaneously measure multiple obesity indicators, such as commonly used body mass index (BMI), PBF, visceral fat level (VFL), waist hip ratio (WHR), waist circumference (WC), and fat mass index (FMI) (16). Among these, PBF represents the proportion of body fat to total body weight, reflecting how much fat is present in the body. In some populations, although their BMI are within the normal range, their PBF may exceed the normal level and lead to hidden obesity. Abnormally high PBF increases the risk of related diseases such as high blood sugar (17). Therefore, PBF is more valuable as a reference for assessing individual health risks compared to other indicators.
Multiple studies have shown that obesity is closely related to diet, dietary factors greatly affect body composition, and dietary pattern analysis could comprehensively explore the impact of food intake on human health (18). Numerous studies have shown that dietary patterns are closely related to non communicable chronic diseases such as obesity, hypertension, and cardiovascular and cerebrovascular diseases. For example, a healthy dietary pattern is positively correlated with good levels of cardiorespiratory health. Numerous studies have demonstrated significant associations between specific dietary patterns and obesity risk in young adults. For instance, research among college populations indicates that inadequate vegetable consumption doubles obesity risk, while high intake of processed snacks correlates with higher visceral adiposity. Our study builds on this evidence by identifying four distinct dietary patterns in Chinese college students, including the obesity-promoting snack mode and protective vegetable meat grain patterns, quantifying population-specific risk (19, 20). Poor diet could become one of the main causes of overweight and obesity in adolescents (21).
Health risk assessment models played a crucial role in identifying individuals at higher risk of obesity and guiding targeted interventions (22). Classic models usually included BMI and Box-Cox power exponential (BCPE) model to assess obesity risk (23). However, important behavioral modifiable factors such as smoking, physical activity, and diet are often overlooked in these models. Therefore, developing a non-invasive, behavior-based risk assessment model that incorporates modifiable lifestyle factors was essential to enable the early and individualized interventions suggestions for college students at risk of obesity (24).
Hence, this study aimed to investigate the distribution and epidemiological characteristics of overweight and obesity among college students in Xuzhou, and to develop risk assessment models for different obesity types with visualization, providing a theoretical basis for obesity prevention and its practical application.
2 Materials and methods
2.1 Study design and setting
This was a cross-sectional study conducted among university students between October 2023 and June 2024 in Xuzhou, China. Participants were selected using a simple random sampling method, and both questionnaire and body composition measurements were employed to collect data through face-to-face interviews. The study adhered to ethical guidelines, and written informed consent was obtained from all participants prior to data collection. Ethical approval for this study was granted by the ethics committee (Approval No. XZFY 2024-052K-01J).
2.2 Study population
The target population consisted of undergraduate students aged 18–25 enrolled at university in Xuzhou. The current study recruited participants who fulfilled the following inclusion criteria: being physically healthy and between the ages of 18 and 25, spanning from freshmen to seniors. Exclusion criteria comprised: (1) chronic diseases affecting metabolic function, such as chronic wasting disease, chronic digestive tract disease, or thyroid/pituitary dysfunction; (2) conditions interfering with body composition measurements, including implantable electronic devices and metal implants.
2.3 Sample size and methods
The sample size was calculated using Epi Info 7.2.5.0, assuming 50% overweight and obesity prevalence to maximizing variability, 5% margin of error, and 95% confidence level, yielding a minimum of 385 participants. With a 35% non-response buffer, the target sample was 520. Ultimately, 1,080 students completed questionnaires; after exclusions, 885 were analyzed, exceeding the minimum requirement.
The fundamental formula for sample size calculation is used to estimate the prevalence of a single proportion such as the prevalence of overweight and obesity. The formula is as follows and verification has been performed:
n: Minimum sample size (unadjusted). Z: The Z-value of the standard normal distribution corresponds to the confidence level. p: The estimated prevalence rate. E: The acceptable margin of error.
2.4 Data collection tools
A self-administered anonymous questionnaire of five sections was created to collect data after obtaining their consent for participation in the study. The first section collected the sociodemographic and health-related condition data including age, gender, grade, ethnicity, and family income. The second section collected data about lifestyle factors including smoking, drinking, exercise, prolonged sitting, mobile phone usage, length of sleep, and quality of sleep. The third section collected data on dietary behavior including breakfast, midnight snack, regular meals, number of meals, water, takeaway, and nutritional knowledge. The fourth section included the Food Frequency Questionnaire (FFQ) that collected the average weekly frequency of intake of 16 food items in the last three months, categorized based on the Chinese food composition table. The reliability and validity of the FFQ were assessed through a test-retest process. The two FFQ surveys were administered at a 1-month interval, yielding 25 pairs of complete questionnaires. These questionnaires, using 146 food items as a benchmark, were used to assess dietary factor score consistency. The FFQ reliability was confirmed with a Pearson correlation coefficient greater than 0.7. The final fifth section was the body composition measurement where researchers used BIA system, which provided detailed information on body weight, BMI, PBF, WHR, skeletal muscle mass, and total body water. Measurements were conducted in a controlled laboratory setting, with participants required to fast for at least four hours and empty their bladders prior to testing. All measurements were conducted by trained personnel to ensure accuracy and consistency.
2.5 Data collection plan
A pilot study was conducted to assess the feasibility, clarity, response rate, and completion time of the questionnaire. Based on the piloted population feedback some minor edits were made to improve the flow and comprehensibility of the questions. The questionnaire needed 5 to 10 min to be completed. Furthermore, all participants involved in the pilot study were excluded from the final analysis. Participants were invited to complete the questionnaire and FFQ on campus, and body composition measurements were taken immediately afterward. Before taking body the measurements, participants were asked to empty their stomachs, empty their bladders, remove their shoes and socks, stand in the designated area of the instrument, and place their front feet on the front foot electrodes and their heels on the back foot electrodes. During the measurement, participants placed their palms on the palm electrode and pressed their thumbs against the thumb electrode to touch the current. The analyzer automatically obtains body composition data such as BMI, PBF, VFL, WC, FMI, protein, skeletal muscle content, minerals, and total water content.
2.6 Dietary pattern and scoring
Principal component analysis (PCA) was used to identify underlying dietary patterns from the collected FFQ data. The Kaiser–Meyer–Olkin (KMO) test and Bartlett’s test of sphericity confirmed the suitability of the data for PCA. Factor loadings greater than or equal to 0.3 were considered significant and included in the scoring calculation. Participants were categorized into tertiles (T1, T2, T3) based on their adherence to specific dietary patterns. T3 represented the group most aligned with a given dietary pattern, which was used for further analysis. Further, a confirmatory analysis was used to extract different sample sizes for principal component analysis of dietary patterns to see whether the results were consistent.
Food items with absolute factor loading values ≥ 0.4 and non-repetitive in the extracted dietary patterns were selected as food groups for calculating the healthy dietary pattern score. According to the relationship between positive and negative effects of food items and obesity, the weight of food items was set to 1 and −1, respectively, and then the healthy dietary pattern score was constructed. The weight of 1 food group is a total of 7 items, namely, rice noodles, coarse grains, vegetables, fungi, dairy products, eggs, and soy products; the weight of −1 food group is a total of 7 items, respectively, pork, beef and mutton, poultry, aquatic products, oil products, desserts, snacks, beverages. The total score was calculated by assigning 1–4 points to the quartile of the daily intake frequency of each food item. The healthy dietary pattern not only preserves the dietary habits of participants inclined toward a healthy dietary pattern but also includes specific food items that influence obesity. A higher score in this dietary pattern indicates a stronger tendency toward a healthy dietary pattern. Additionally, a validation analysis was conducted in which the same participants completed the dietary questionnaire again after 2–4 weeks to assess the consistency of the scores between the two time points.
2.7 Risk assessment model
A risk assessment model for different types of obesity was developed using a combination of logistic regression and dietary pattern data. The dataset was randomly divided into training (70%) and validation (30%) groups. Logistic step-up regression analysis was applied to identify significant predictors of obesity. The final model was visualized using a nomogram, which provides an individualized risk score for obesity based on the identified factors. Model performance was evaluated using the area under the receiver operating characteristic (ROC), with a target AUC of ≥ 0.7 indicating acceptable predictive accuracy. Based on this, we build a risk assessment model for different types of obesity and display it visually, which provides a theoretical basis for obesity prevention work and can be applied in practice.
2.8 Statistical analysis
The data were collected, reviewed, and then fed to SPSS version 23. Numerical variables were described by the mean and standard deviation (SD), whereas categorical variables were described by number and percentage (%). A chi-square test was used to assess the association between the body fat layering variable and demographic and lifestyle variables including differences between males and females. Logistic regression analysis was used to analyze the relationship between different obesity factors, dietary patterns, and different types of obesity while adjusted odds ratios (ORs) and 95% confidence intervals (CIs) were calculated. A p-value < 0.05 was considered statistically significant.
3 Results
3.1 Baseline characteristics stratified by percentage of body fat
A total of 1,080 participants completed the questionnaire on diet and lifestyle habits, of which 945 volunteered to provide a weekly food frequency questionnaire and body composition measurement, among which 5 participants did not meet the requirements of the measurement of the composition of the body. When sorting out the data, it was found that 55 participants filled in the questionnaire incompletely or repeatedly, and 885 students were finally included in the study. Among them, there were 392 (44.3%) females and 493 (55.7%) males. 412 (46.5%) of participants were 20 years old or younger and 600 (67.8%) had a low level of income. The overall characteristics of the participants, based on PBF classification (25–28), are presented in Table 1. There was a significant difference in the number of obese and overweight individuals between males and females (χ2 = 44.256, p < 0.01), with men more likely to be obese or overweight than women. Alcohol consumption showed a significant association with obesity (χ2 = 16.907, p = 0.001), with 49.2% of overweight participants reporting alcohol consumption compared to 39.9% of normal-weight participants. Physical exercise showed a significant association with obesity (χ2 = 43.465, p < 0.001), with 49.9% of inactive individuals being overweight or obese compared to 29.1% obesity among the active group. A significant difference was observed in water intake (χ2 = 16.137, p < 0.001), with 56.4% of participants consuming less than 2 liters per day being overweight or obese compared to 40.7% prevalence of obesity among participants consuming more than 1 liter.
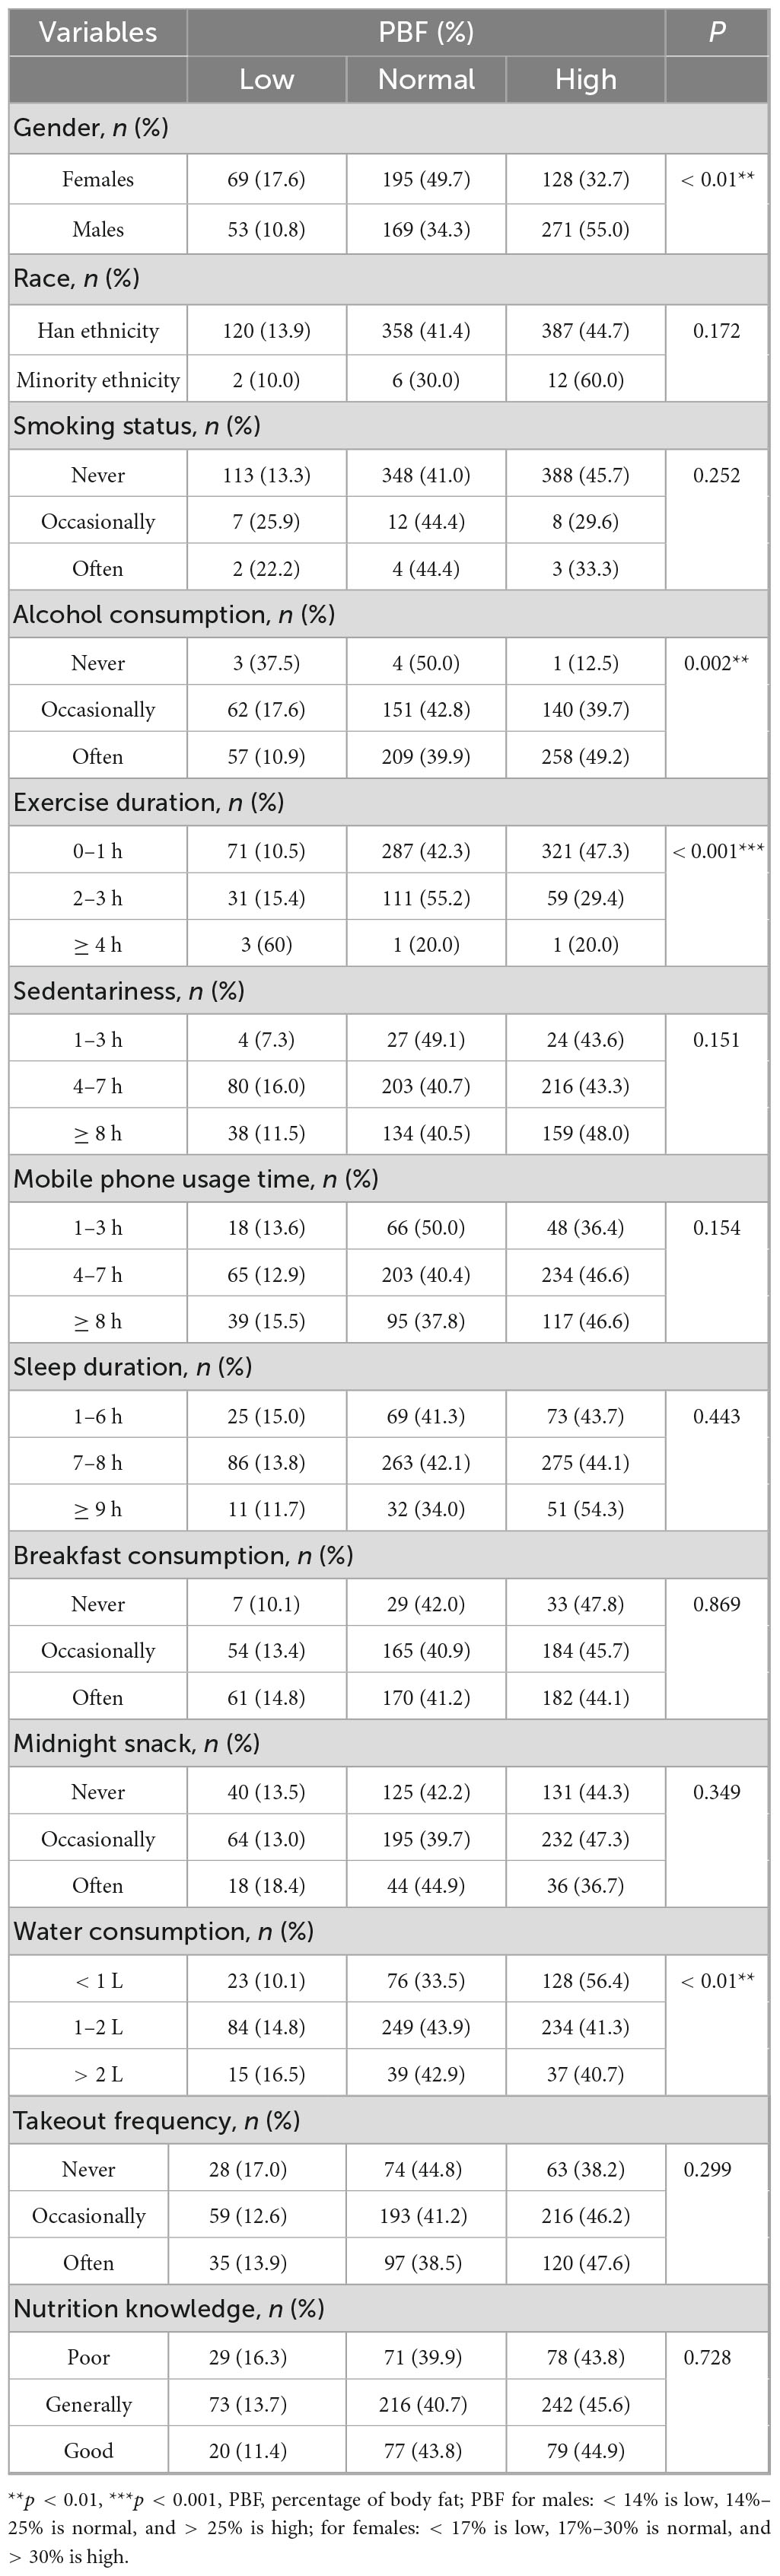
Table 1. Baseline characteristics stratified by percentage of body fat.
3.2 Body composition analysis by percentage of body fat classification
To further understand the effect of obesity on body composition, we performed the analysis in Supplementary Table 1. The analysis showed that participants with a lower body fat percentage had higher levels of water, protein, inorganic salts, and skeletal muscle. Furthermore, significant differences were observed when obesity was defined by other indicators (p < 0.01).
3.3 Comparison of different obesity indicators
The prevalence of obesity and overweight varies significantly depending on the indicators employed. These metrics include BMI, FMI, PBF, VFL, WC, and WHR. From Supplementary Table 2, PBF identified the highest proportion of individuals classified as overweight and obese (42.5%), followed by WC (40.2%), FMI (37.1%), and BMI (30.7%). Although more men than women were categorized as overweight or obese across all indicators, none of these differences were statistically significant. Since the detection rates of obesity and overweight vary depending on the indicators used, we conducted a comparison of different obesity indicators, as shown in Figure 1. The correlation and consistency across different obesity metrics are not uniform; however, they exhibit low levels of agreement.
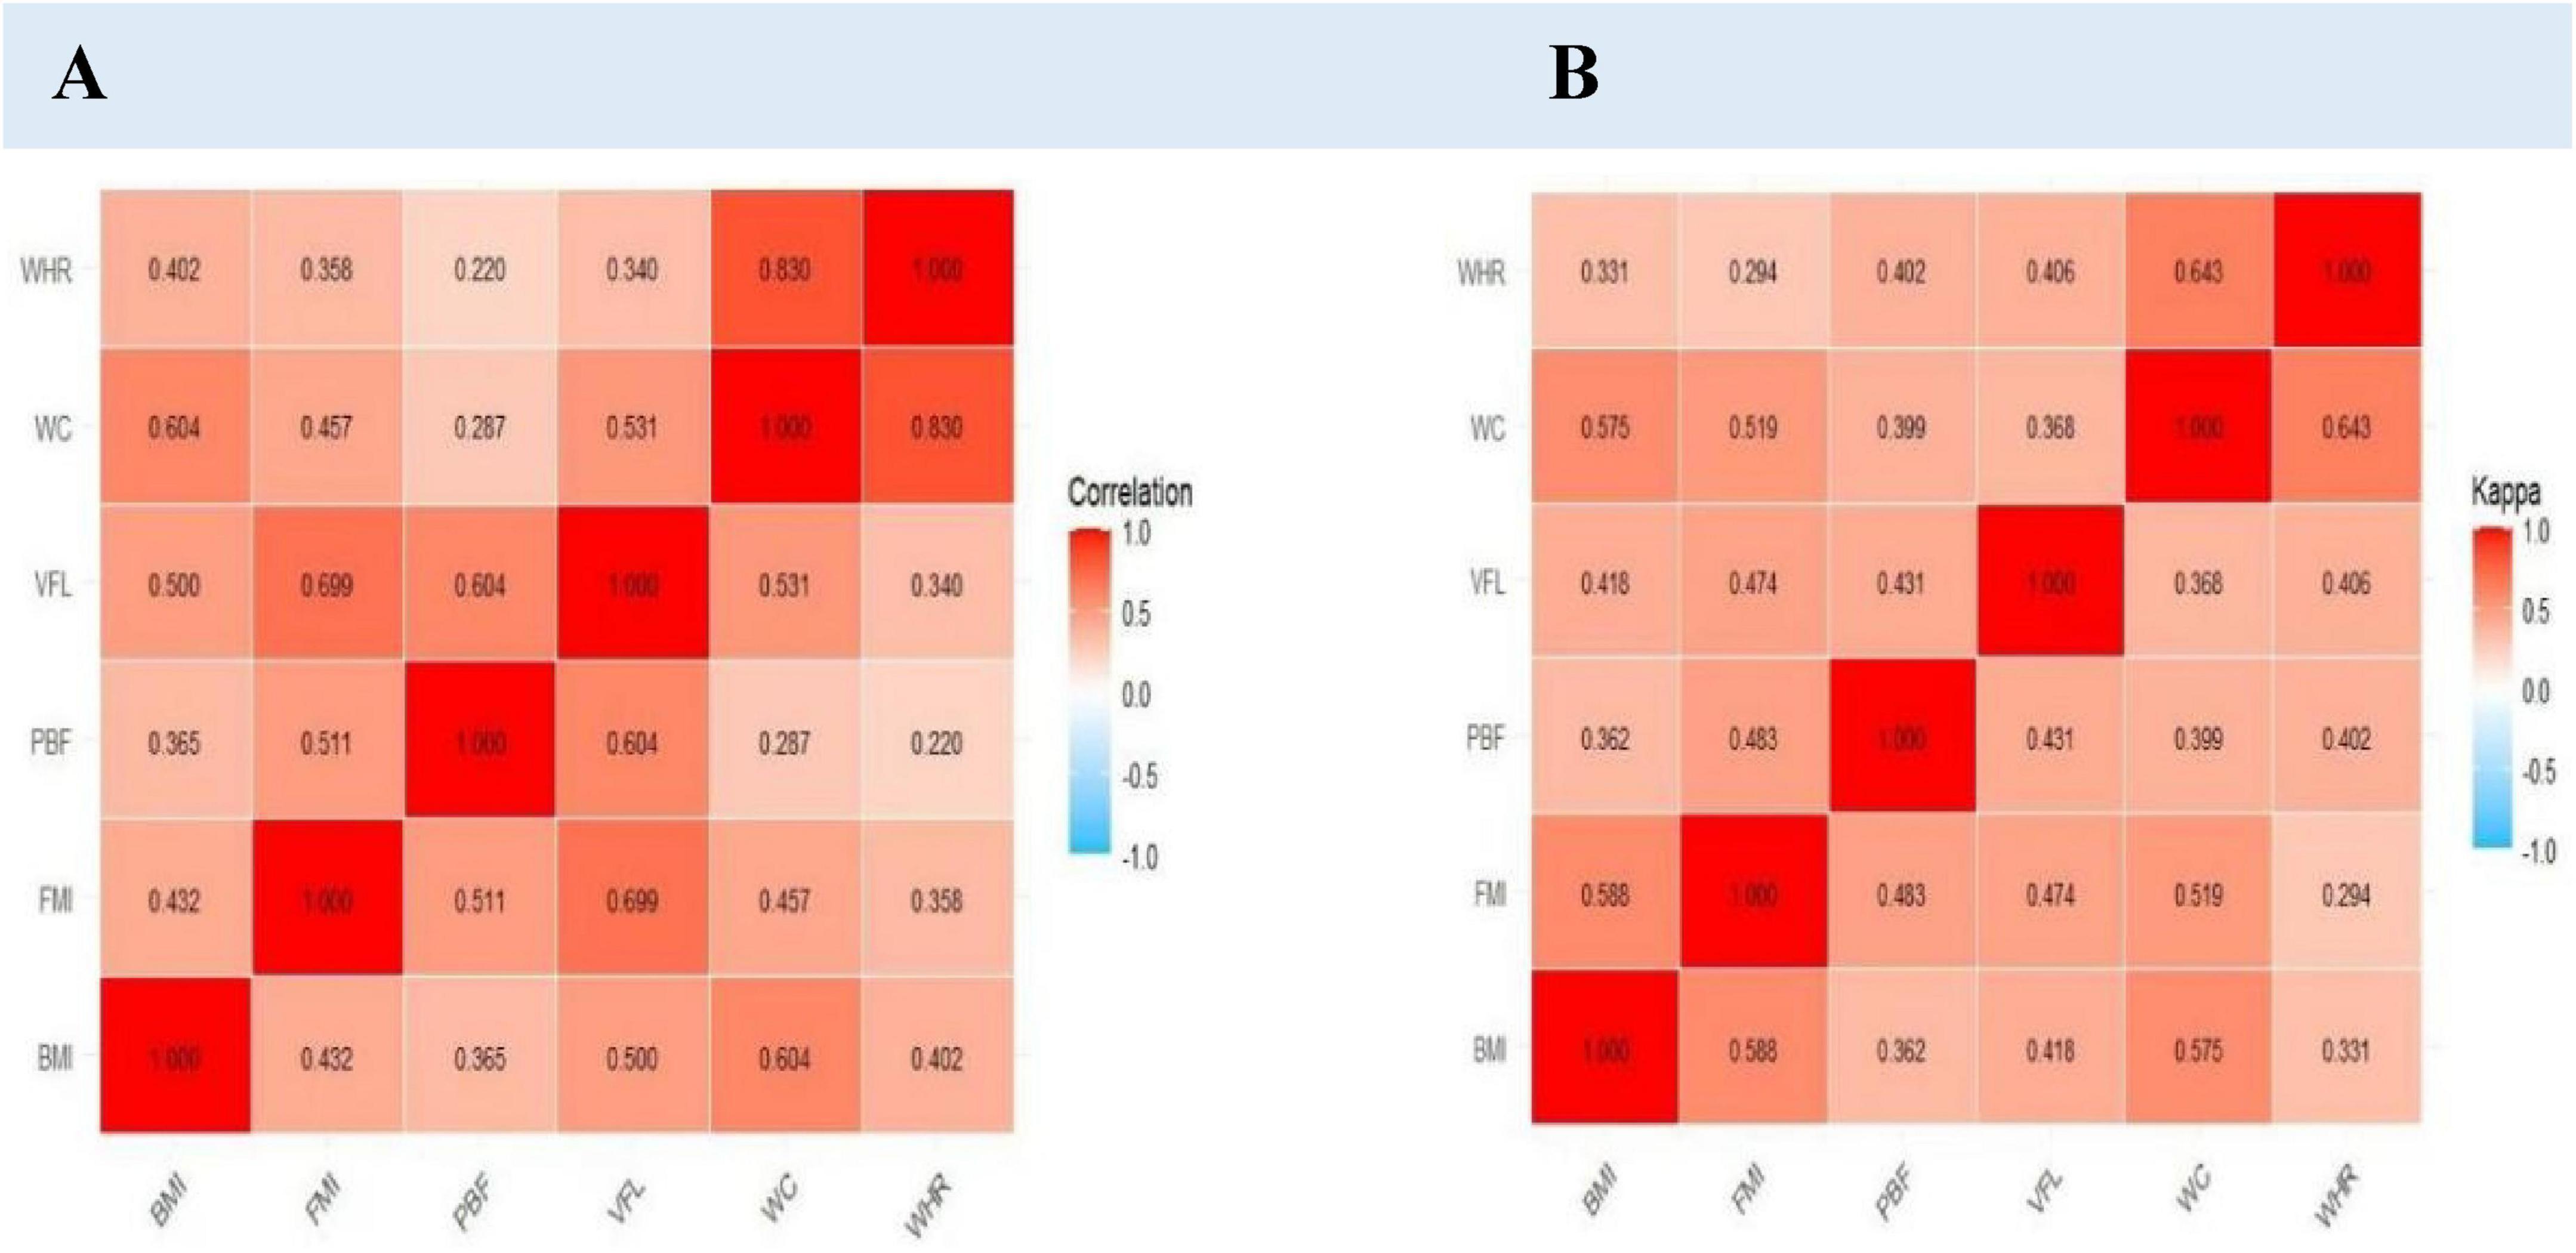
Figure 1. Correlation and kappa concordance of obesity indicators in college students. (A) Correlation of obesity indicators. (B) Kappa concordance of obesity indicators.
3.4 Construction of dietary patterns for research subjects
In order to gain a more comprehensive understanding of the impact of diet on obesity, we conducted a dietary pattern analysis, as shown in Figure 2. Dietary patterns were identified using principal component analysis (PCA). From Supplementary Tables 3, 4, Supplementary Figure 1, Suitability verification results showed a KMO (Kaiser–Meyer–Olkin) value of 0.84 (> 0.7) and Bartlett’s sphericity test P < 0.001, indicating that the dietary data were appropriate for factor analysis. Four main factors were extracted, accounting for a cumulative contribution rate of 50.0%. After applying maximum variance orthogonal rotation, dietary patterns were named based on factor loadings with absolute values greater than 0.4.
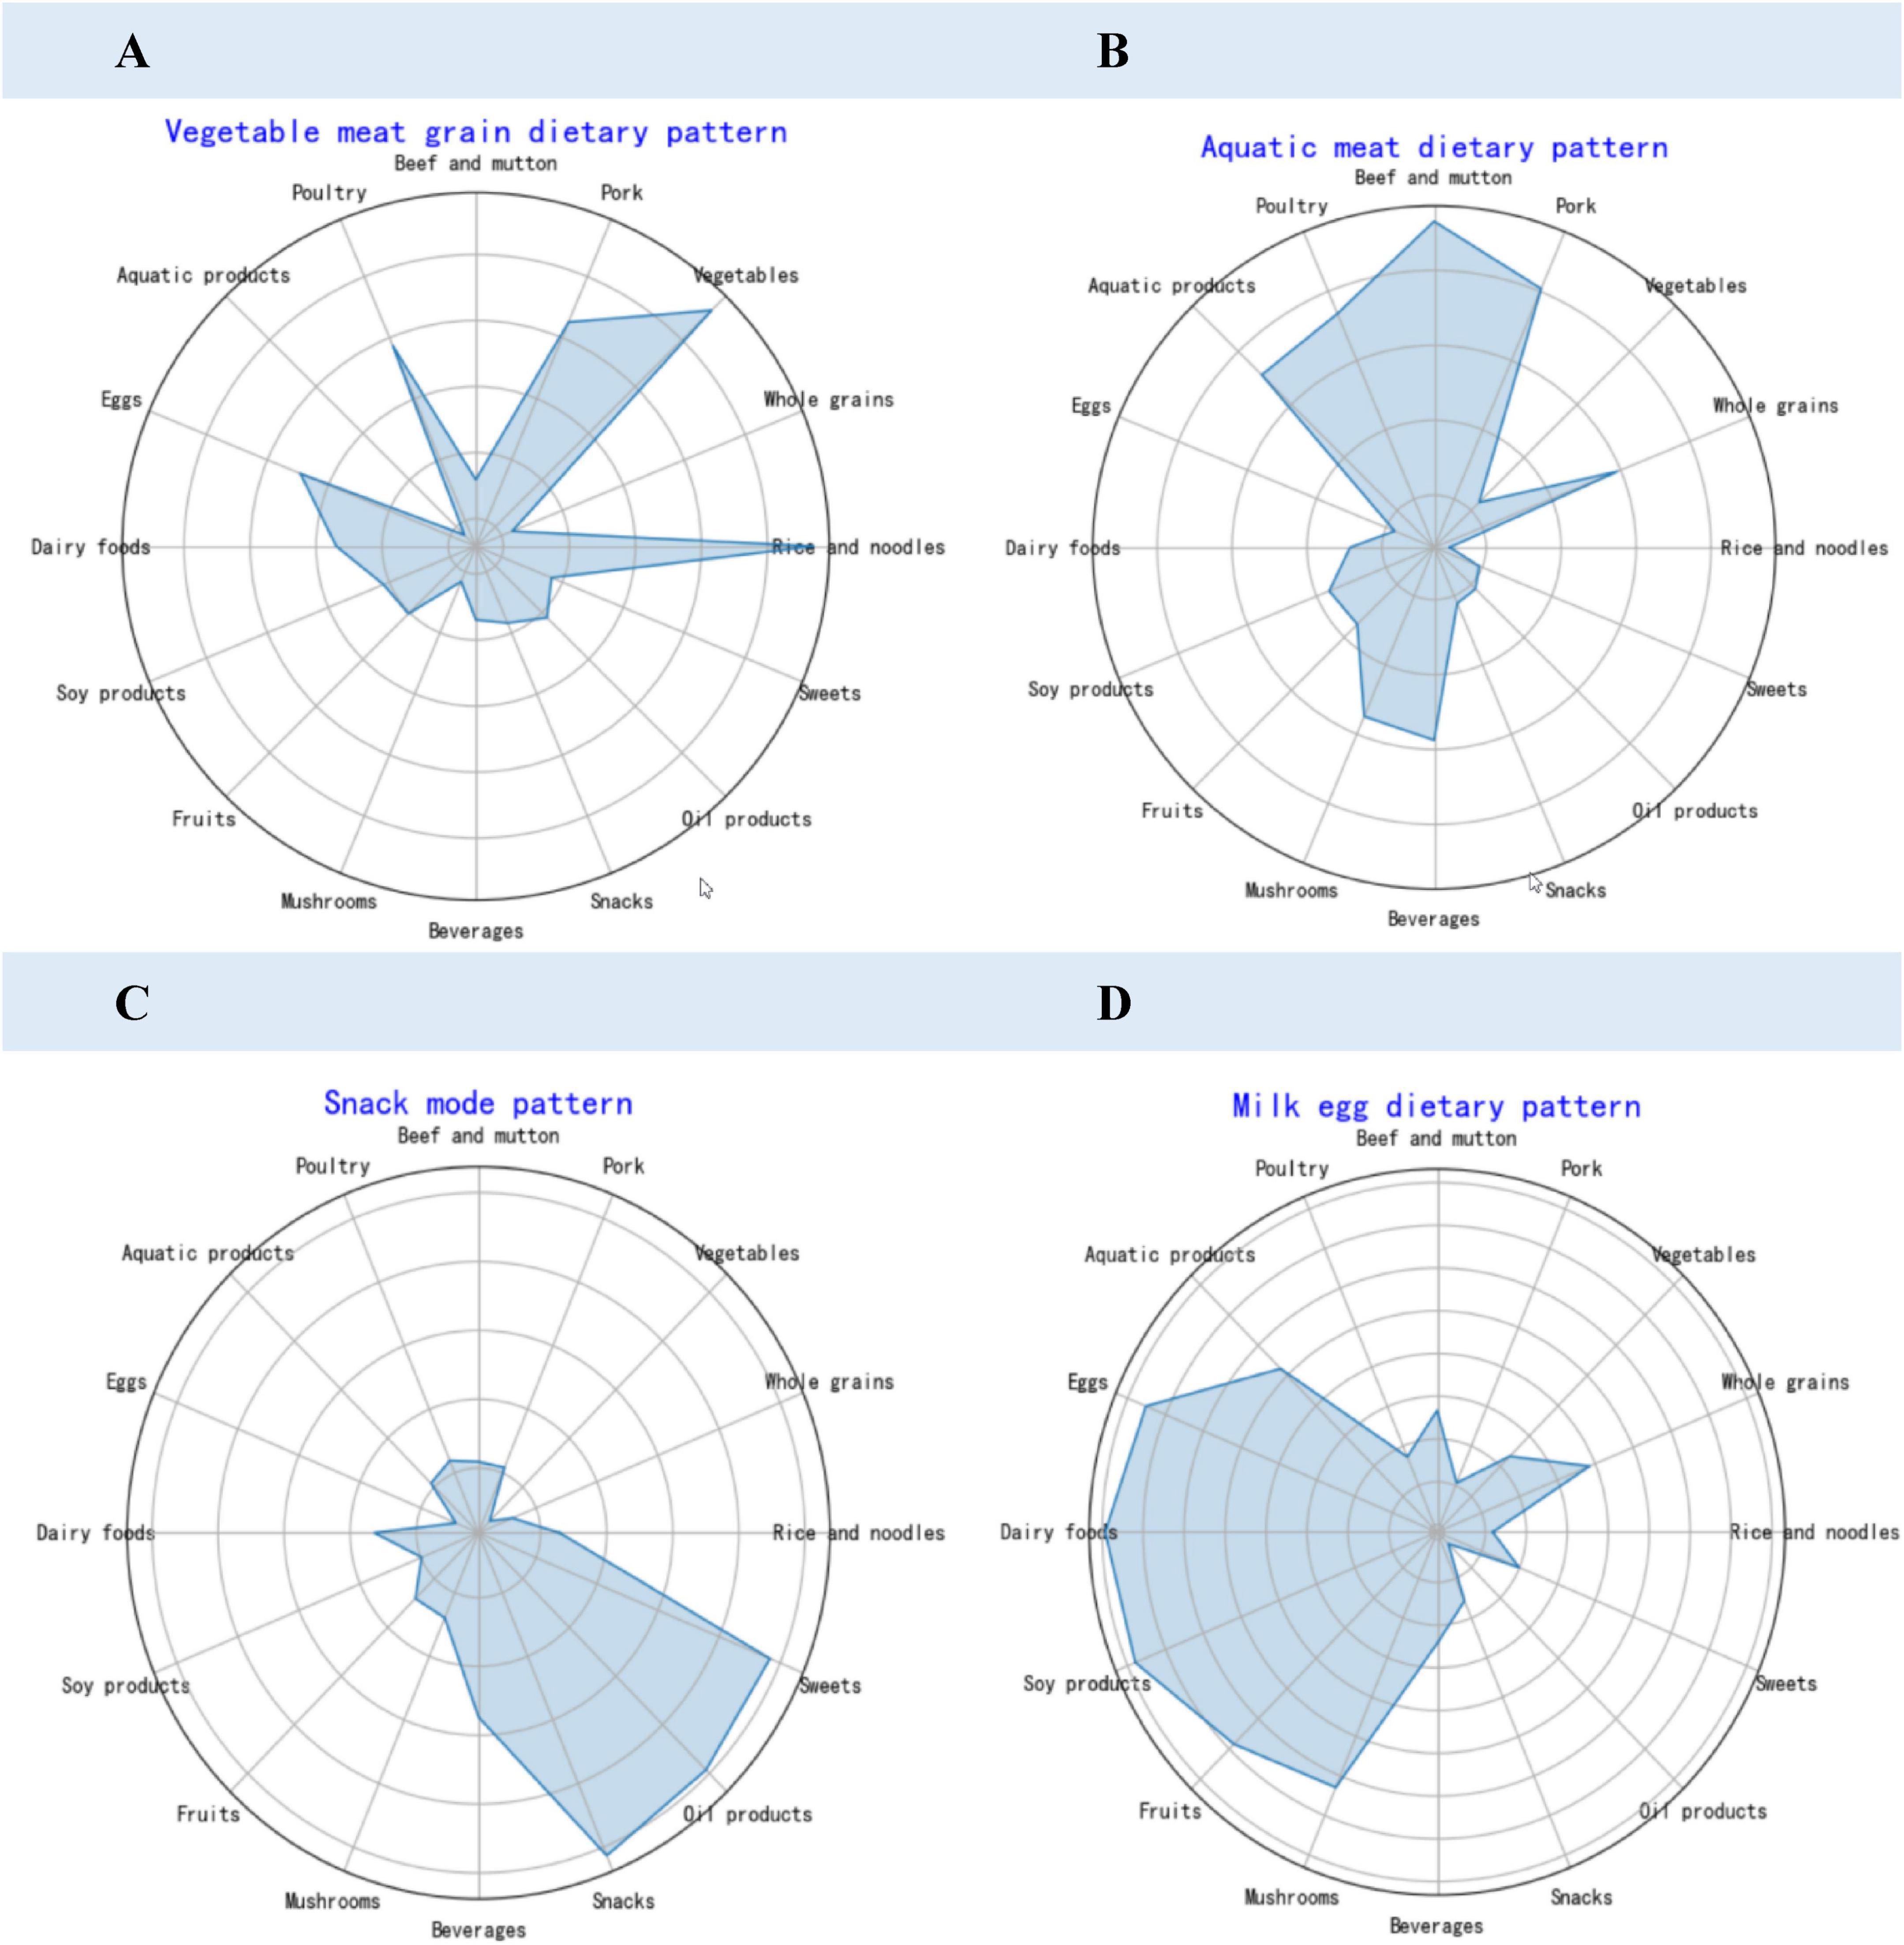
Figure 2. Dietary pattern factor loading radar chart. (A) Vegetable meat grain dietary pattern. (B) Aquatic meat dietary pattern. (C) Snack mode pattern. (D) Milk egg dietary pattern.
The first factor, vegetable meat grain dietary pattern, consisted of rice, grains, vegetables, bean products, fruits, and mushrooms. The second factor, aquatic meat dietary pattern, was characterized by pork, beef, mutton, poultry, aquatic products, and oil products. The third factor, Snack mode dietary pattern, included beverages, snacks, and sweets. The fourth factor, Milk egg dietary pattern, was primarily composed of dairy products.
3.5 Relationship between dietary patterns and obesity in college students
In order to clarify the relationship between dietary patterns and a variety of different obesities, a series of analysis were performed as follows. The research results from Table 2 indicate that all four dietary patterns were associated with PBF. Aquatic meat dietary pattern and Snack mode dietary pattern were linked to an increased risk of PBF, while the vegetable meat grain dietary pattern and milk egg dietary pattern were associated with a decreased risk of PBF (P < 0.01). Furthermore, it was found that aquatic meat dietary pattern increases the risk of FMI (P < 0.05) and VFL (P < 0.01) from Supplementary Tables 6–10, while Snack mode dietary pattern increased the risk of WHR (adjusted before P < 0.05) and WC (P < 0.05).
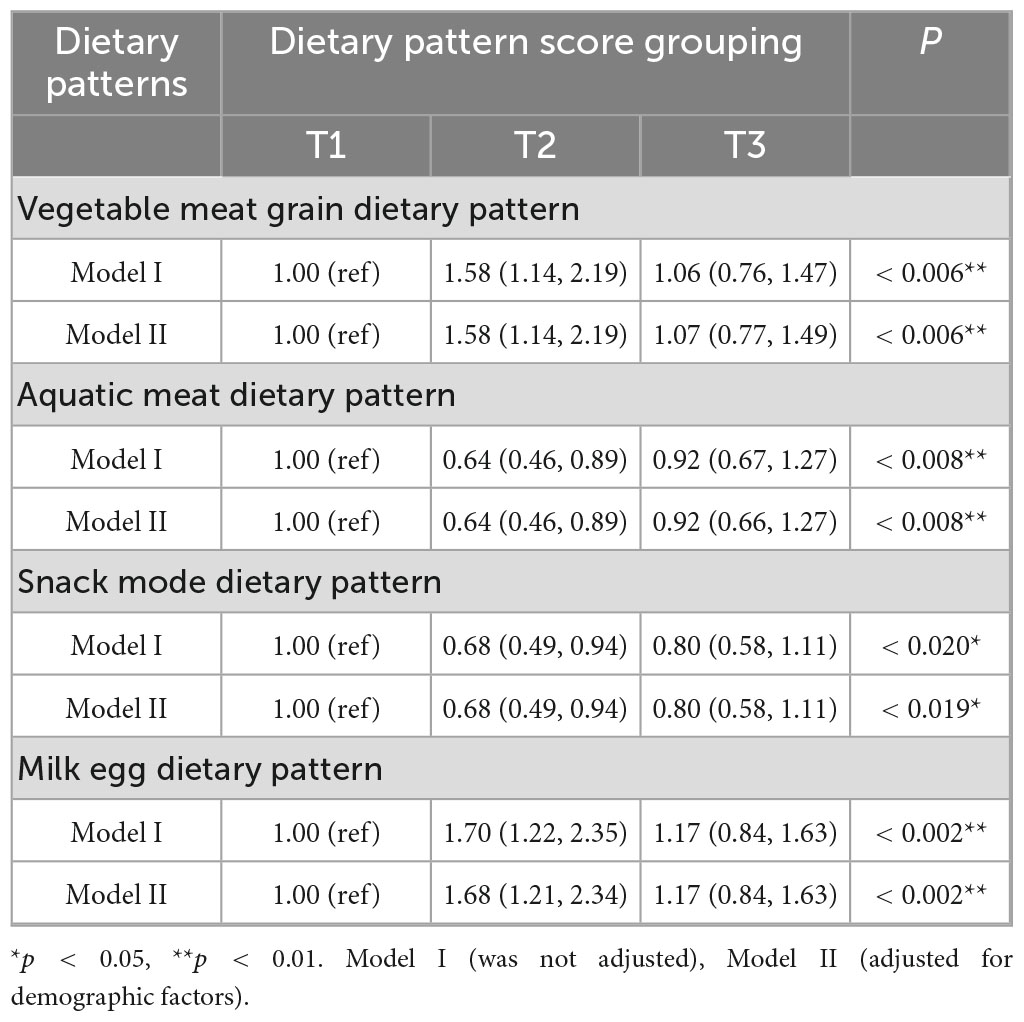
Table 2. Logistic regression analysis of the relationship between dietary patterns and percentage of body fat (PBF) in college students.
3.6 Development and validation of a dietary pattern-based PBF risk model
3.6.1 Basic characteristics of the training set and validation set
For better predictive modeling analysis and validation, a total of 885 research subjects were randomly divided as 7:3, with 620 subjects comprising the training set and 265 subjects forming the validation set. The research findings revealed that the obesity prevalence of PBF in the training set was 42.1%, while it was 43.4% in the validation set. However, this difference was not statistically significant (P = 0.73). As shown in Table 3.
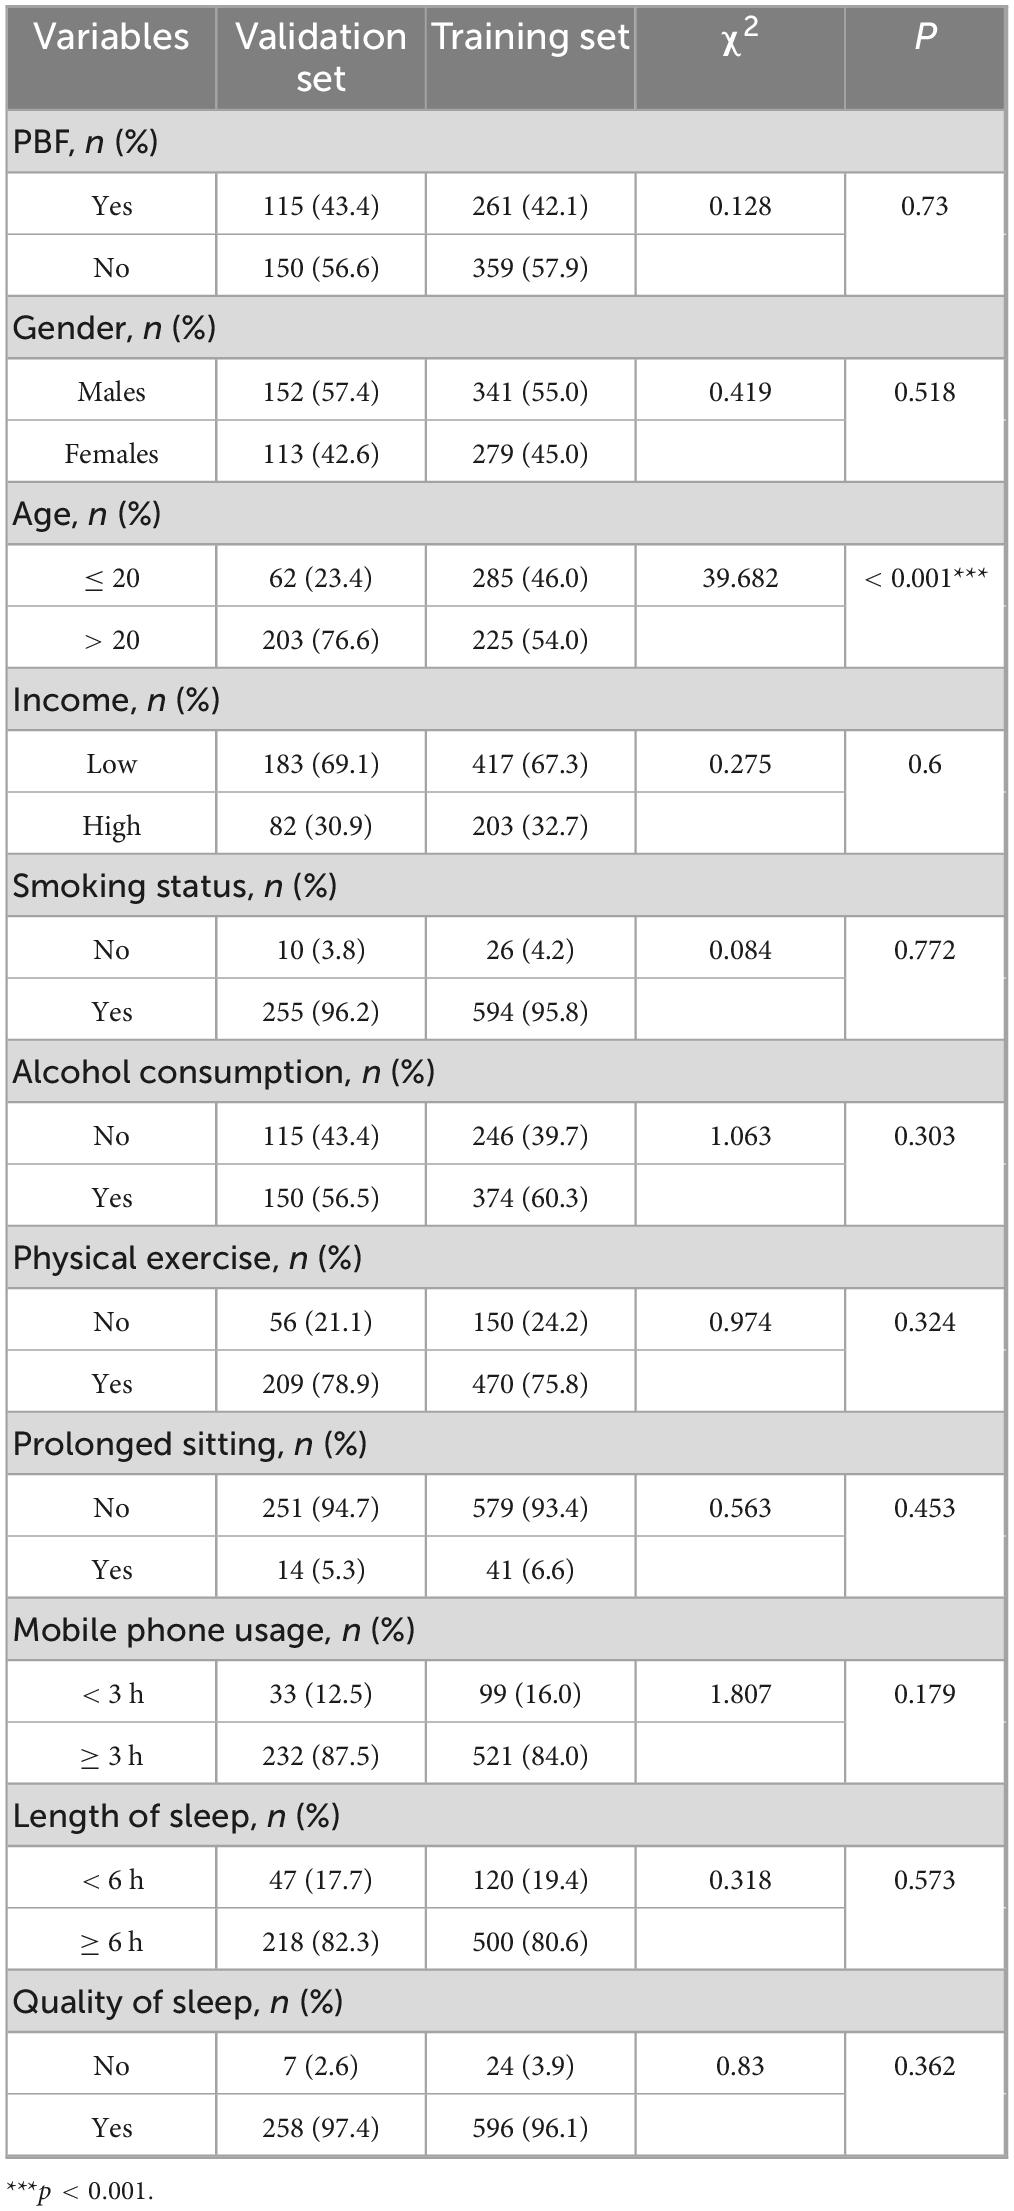
Table 3. The basic information of the training set and validation set for the research.
3.6.2 Construction and validation of a PBF obesity risk assessment model for college students based on dietary patterns
From Supplementary Table 5, it further illustrates the impact of healthy diet extraction of PBF. Population demographics, lifestyle, dietary habits, and healthy diet extraction were used as independent variables, and whether or not a person had PBF obesity was used as the dependent variable to enter the model. Predictive factors were selected, and a PBF obesity risk assessment model was constructed. The research results showed that the predictive factors in the model in the training set mainly included gender, exercise, late-night snacking, regular meals, and healthy diet extraction. The results of the relevant regression analysis were shown in Table 4.
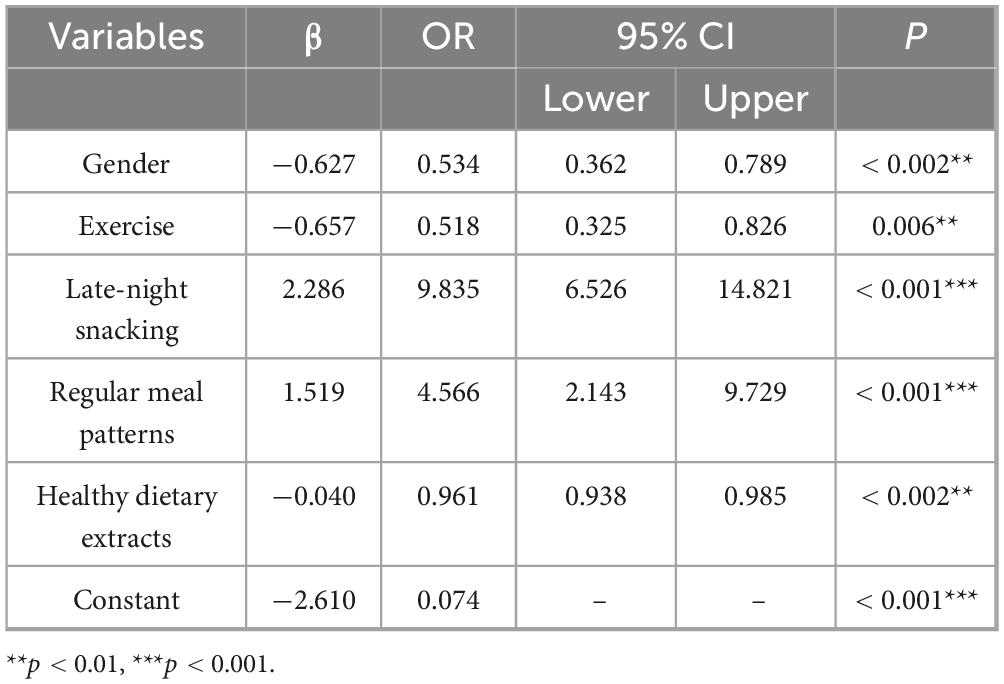
Table 4. PBF obesity risk assessment model for college students in the training set.
A line chart depicting the risk assessment model constructed from the training set can be used to calculate the total score based on the values of each predictive factor, thereby evaluating the probability of developing PBF Obesity. Specific results were presented in Figure 3.
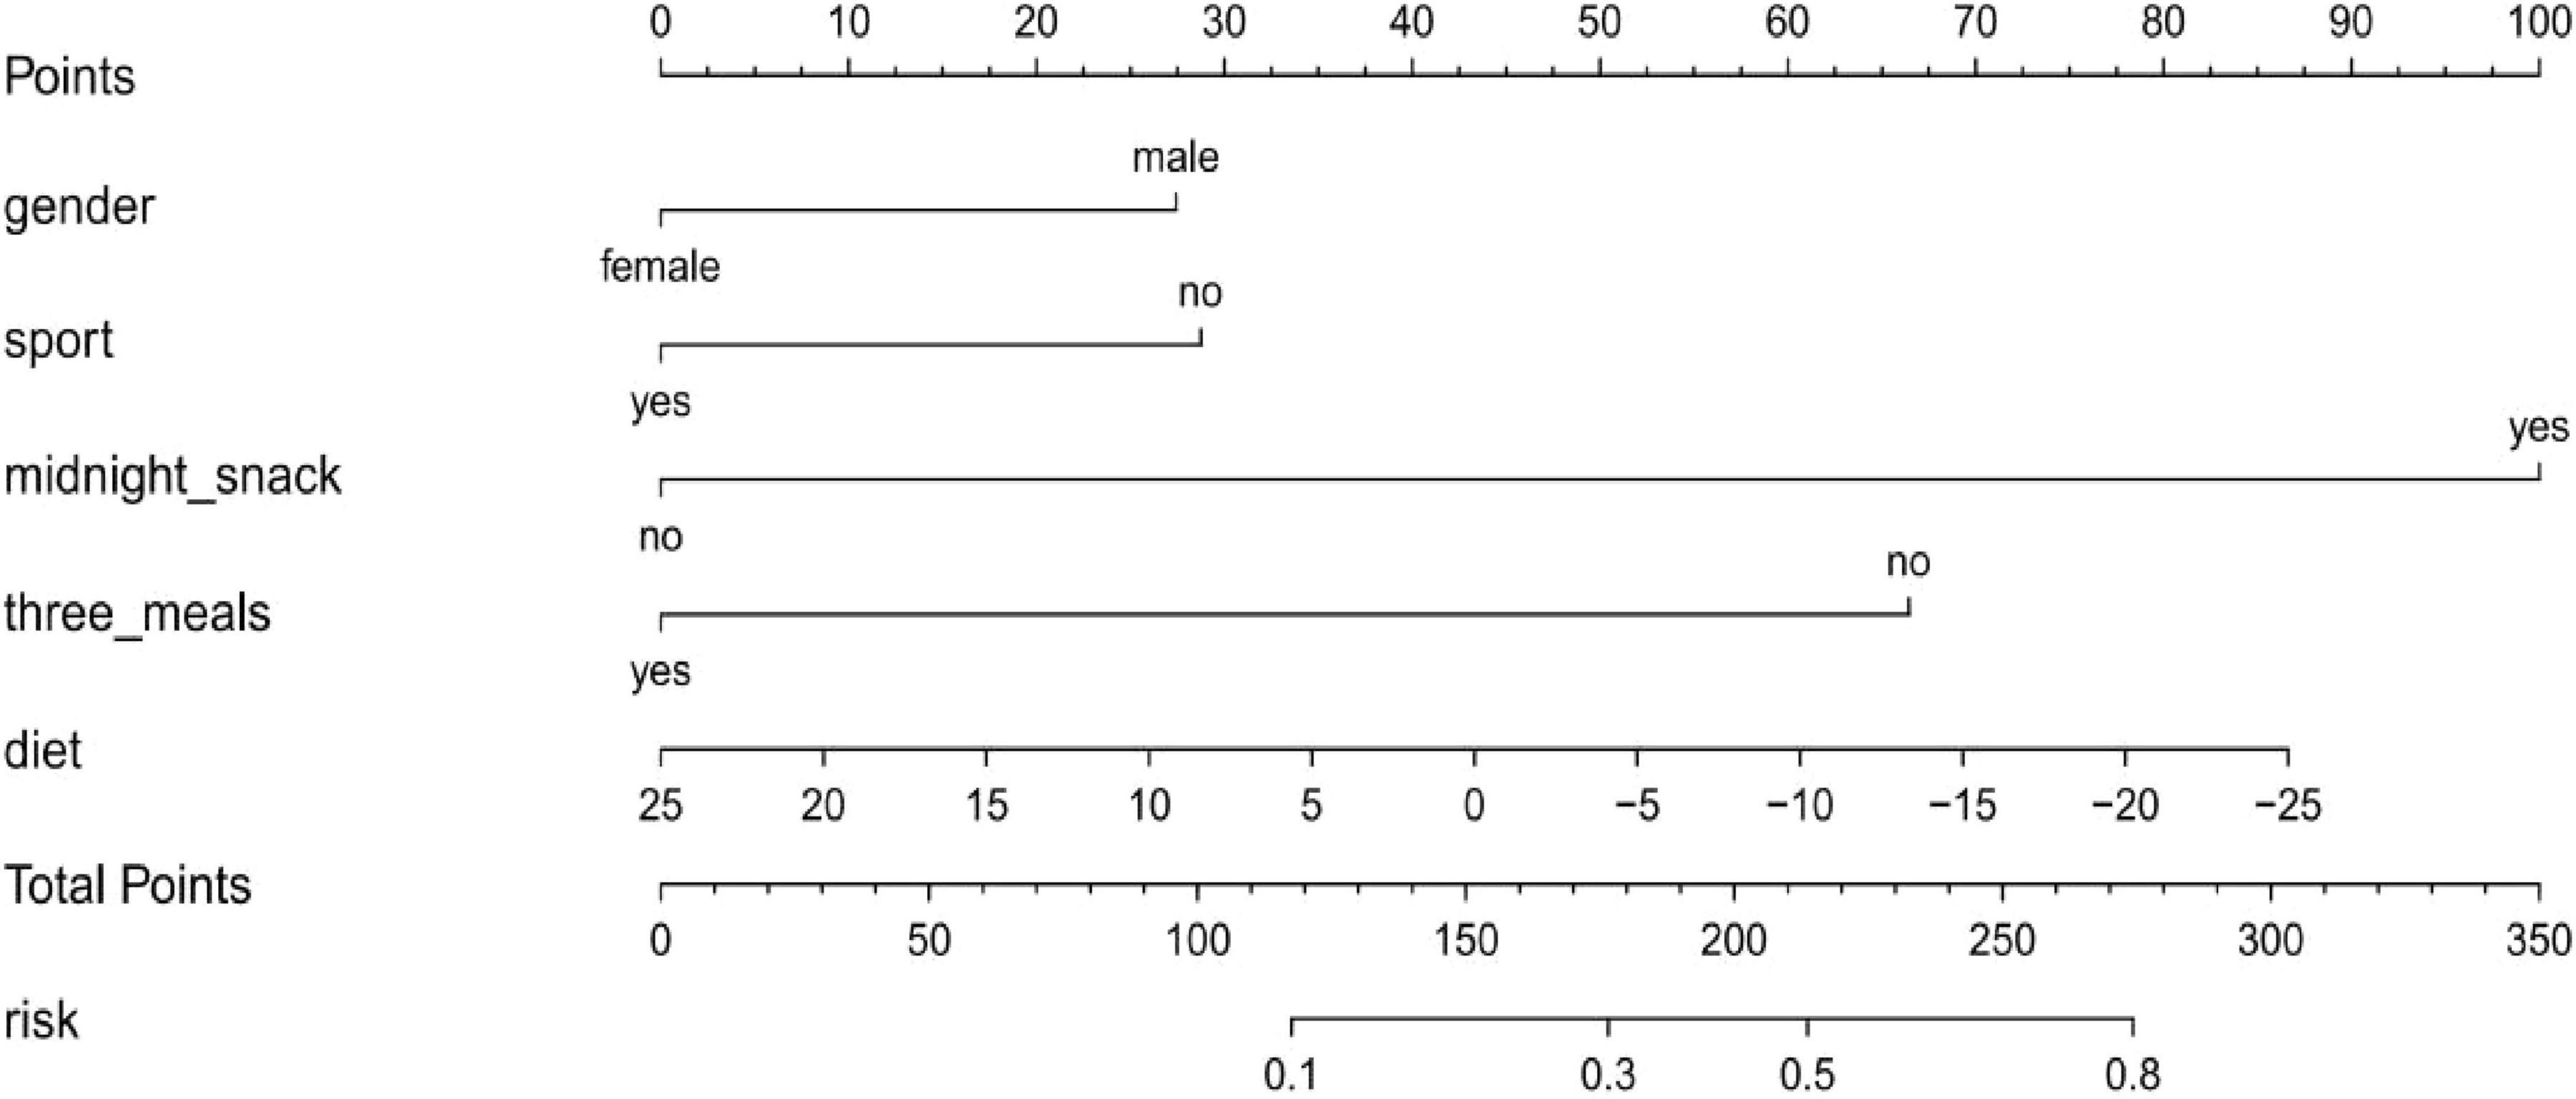
Figure 3. Nomogram for the PBF obesity risk assessment model based on a training set of college students.
The PBF obesity risk assessment model underwent rigorous internal validation, demonstrating robust predictive performance, as illustrated in Figure 4. The model exhibited excellent discriminatory ability, with an AUC of 0.805 in the training set and 0.731 in the validation set. Calibration accuracy, assessed using the Hosmer–Lemeshow test, was high in both the training and validation sets (P > 0.05), indicating strong agreement between predicted and observed outcomes. Furthermore, clinical DCA revealed that the model provides significant clinical utility, with its curves substantially surpassing the “treat all” and “treat none” reference lines, underscoring its net clinical benefit. Collectively, these findings affirm the reliability and clinical applicability of the PBF obesity risk assessment model for identifying individuals at risk of obesity.

Figure 4. Adaption of the PBF obesity risk assessment model of college students. (A,B) OC curves of PBF obesity risk model for college students in training and validation sets; (C,D) calibration curves of PBF obesity risk model for college students in training and validation sets; (E,F) DCA curves of PBF obesity risk model for college students in training and validation sets.
4 Discussion
The investigation revealed a lack of research on risk assessment for overweight and obesity in college students based on dietary patterns. Our study found that the prevalence of overweight and obesity among college students is relatively high and overall obesity prevalence analysis revealed 42.5% of participants (376 out of 885) had PBF-defined obesity. PBF-defined obesity was defined as > 25% body fat for males and > 30% for females; significantly more males were affected (55.0%) than females (32.7%). Supplementary Table 1 demonstrates varying results across the six obesity indicators, further highlighting the differences between these metrics. A comprehensive analysis incorporating multiple indicators can help reduce measurement errors. The “vegetable meat grain dietary pattern” and “milk egg dietary pattern” were associated with a reduced risk of PBF, while the “snack mode dietary pattern” and “aquatic meat dietary pattern” dietary patterns were linked to an increased risk of PBF. Binary logistic regression analysis identified five key predictors of body fat percentage obesity in college students: gender, exercise habits, late-night snacking, regular meal patterns, and adherence to a healthy diet.
The observed associations between dietary patterns and obesity phenotypes were mediated through distinct metabolic mechanisms, where the meat and aquatic product dietary pattern—rich in saturated and monounsaturated fats—upregulated de novo lipogenesis via SREBP-1c activation, promoted visceral adiposity and hepatic insulin resistance that reduced Very Low-Density Lipoprotein clearance (29); conversely, the vegetable meat grain pattern provided polyunsaturated fatty acids (PUFAs) activating PPAR-α pathways to enhance β-oxidation and reduce FMI and VFL. The Snack mode pattern’s high sugar load induced postprandial hyperinsulinemia, promoting adipocyte differentiation through PI3K or Akt signaling. Fructose metabolism specifically stimulated hepatic de novo lipogenesis via ChREBP activation (30). The milk egg pattern delivered bioactive peptides that increased thermogenesis through UCP1 upregulation in brown adipose tissue, and its calcium content inhibited calcitriol-mediated adipocyte Ca2+ influx to suppress lipogenesis. Additionally, plant-based fibers in the vegetable pattern were fermented to SCFAs, such as butyrate, which improved insulin sensitivity via GLP-1 secretion and AMPK activation, explaining its protective effect against PBF accumulation (31).
The prevalence of overweight and obesity among college students has become a growing concern. According to the BMI evaluation standard, 30.7% of students are classified as overweight or obese. However, BMI may underestimate the true prevalence of obesity (15). When assessed using the body fat percentage standard, the prevalence increases to 42.5%, reflecting improved predictive accuracy (32). This perspective was supported by other studies (33). This situation can be attributed to the heavy academic pressure faced by young students and the widespread use of electronic devices, which contribute to sedentary behavior, insufficient physical activity, and unhealthy dietary habits. These factors collectively led to abdominal fat accumulation and relatively low muscle mass (33).
Abdominal fat is commonly assessed using indices such as VFL, WHR, and WC. In our study, the prevalence of central obesity varied significantly depending on the measure used: 21.0% based on the VFL standard, 35.6% using WHR, and 40.2% using WC. The correlation and consistency among these measures were not statistically significant, likely due to their inherent strengths and limitations, as well as variations in body composition, muscle mass, and gender-related fat distribution (34).
This study also explored the relationship between dietary patterns and various obesity indicators. The first dietary pattern, characterized by a traditional Chinese plant-based diet rich in rice, wheat, whole grains, vegetables, bean products, fruits, and mushrooms, was negatively associated with BMI and PBF. These findings aligned with previous research suggesting that plant-based diets, similar to the Eastern dietary pattern, were linked to a lower risk of obesity (35). Furthermore, evidence indicated that higher vegetable consumption was negatively associated with body weight, while fruit and vegetable intake is positively associated with a lower body fat percentage (36).
In contrast, the second dietary pattern, primarily composed of pork, poultry, livestock, aquatic products, and oil-based foods, showed positive associations with PBF, FMI, and VFL. This pattern is closer to a Western dietary style and is more prevalent among students from high-income households. Due to its higher fat content compared to other patterns, it is more likely to contribute to abdominal obesity, as evidenced by elevated FMI and VFL. These results were consistent with previous studies linking high-fat diets to increased risks of central obesity (37).
Research indicates that dietary patterns rich in saturated and monounsaturated fatty acids are associated with a 25% increase in the odds of developing metabolic disorders. A study of Filipino adults aged 20 and above found that a dietary pattern primarily consisting of meat and sugary drinks was significantly positively associated with diabetes, overweight, and obesity (38).
The third dietary pattern, characterized by a high intake of beverages, snacks, and sweets, represents a common junk food diet among students. It is positively correlated with PBF, WHR, and WC. This pattern’s high proportion of sugary drinks aligns with evidence showing that unhealthy foods, including sweets and sugary beverages, may increased the risk of abdominal obesity (39). Sugar intake, in particular, has been strongly linked to visceral fat accumulation and other body composition variables (40).
In contrast, the fourth dietary pattern, dominated by dairy and egg products, was negatively associated with PBF and BMI. Dairy products are rich in essential vitamins and minerals, while eggs provide high-quality protein and calcium. Adherence to this pattern ensured sufficient nutrient intake and reduced the risk of obesity (41).
To further investigate, a simplified healthy dietary pattern score was developed using posterior inference to extract dietary patterns. This approach has been widely applied in studies examining the relationship between diet and metabolic diseases such as non-alcoholic fatty liver disease, hypertension, and hyperlipidemia (42). Based on the four identified dietary patterns, a simple dietary score was constructed and found to be significantly correlated with PBF. The food items included in the score reflect the eating habits of the study population and emphasize food groups with a notable impact on obesity. This healthy dietary pattern showed a stronger association with PBF risk, thereby enhancing the potential for targeted obesity prevention strategies.
Our study identified several key factors influencing overweight and obesity among college students, including gender, physical activity, sleep duration, fluid intake, alcohol consumption, regular meals, and adherence to a healthy diet. The prevalence of PBF-defined obesity among male students was 55.0%, significantly higher than the 32.7% observed in females. Other obesity indicators also revealed higher prevalence rates among males, consistent with global and domestic trends (43). This disparity can largely be attributed to lifestyle differences: males are more likely to engage in smoking and alcohol consumption, whereas females tend to adopt healthier habits, such as higher fruit and vegetable intake, reduced alcohol and meat consumption, and increased physical activity (44).
Alcohol consumption was confirmed as a significant risk factor for overweight and obesity among college students. A prospective study demonstrated that reducing weekly alcohol intake and avoiding excessive drinking can help control waist circumference and BMI in men (45). Excessive and frequent alcohol consumption during youth has been shown to contribute to weight gain (46).
Physical activity emerged as one of the most effective ways to improve obesity-related metrics. Increasing moderate-intensity exercise while reducing low-intensity activities significantly improved obesity indicators (47). Additionally, more physical activity, less screen time, and sufficient sleep were positively associated with lower BMI, reduced cardiometabolic risk, and improved cognitive development, such as enhanced motor skills and academic performance (48).
Sleep duration also played a crucial role. A study of Chinese adolescents found that short sleep duration was associated with increased overweight or obesity, particularly central obesity in boys (49). Similarly, adequate hydration has been linked to healthier body composition. Research suggested that sufficient water intake might help prevent abdominal obesity, particularly in young adults (50).
Moreover, higher meal frequency was associated with slightly lower body fat percentage (51). Furthermore, a higher eating frequency could be associated with diet quality improvement, lower adiposity, and lower risk of developing MetS or its components (52).
Finally, our study developed a non-invasive obesity risk assessment model using PBF as the primary indicator, incorporating demographic, dietary, and lifestyle factors. The use of the InBody 570 analyzer provided accurate body composition data within a short timeframe (53), and its reliability has led to frequent application in obesity research (54). The resulting model demonstrated strong discriminatory power and calibration, with an AUC exceeding 0.7. In addition to traditional measures such as BMI and WC for defining overall and abdominal obesity, this study included comprehensive body composition indicators such as FMI, VFL, WHR, and PBF. While our PBF-based nomogram (AUC = 0.805) demonstrates robust predictive performance for college-specific obesity screening, we acknowledge the need for contextualizing these findings against existing models. In direct comparison to Liu et al. (24)—whose machine learning model predicted BMI-defined obesity in Chinese adolescents with an AUC of 0.72—our approach achieves key advancements through outcome specificity. We target PBF-defined obesity, a more sensitive adiposity indicator than BMI, capturing a 42.5% prevalence rate versus BMI’s 30.7% prevalence. Behavioral granularity emerges when incorporating dietary pattern scores such as the healthy diet extract (OR = 0.961, p < 0.002), enabling precise behavioral interventions, whereas Liu et al.’s (24) model relied primarily on demographic or anthropometric factors. Visualizing the results through line charts enhances the model’s practical utility, making it a valuable tool for college health programs. However, the model’s applicability may be limited to the local population, necessitating further validation in diverse cohorts.
Despite its contributions, this study has several limitations. First, as a cross-sectional survey, it cannot establish causal relationships or determine temporal sequences. Second, the sample was limited to college students from a specific region, which limits the generalizability of the findings. Third, the lack of parental body shape data in the questionnaire design prevented the inclusion of hereditary factors in the regression analysis. Future research should focus on larger and more diverse samples, employ longitudinal designs, and explore genetic influences on body composition to enhance the predictive accuracy of obesity risk models. Additionally, validating the model in external populations is crucial to improve its applicability beyond the local context.
5 Conclusion
In this study, the non-invasive college body fat obesity risk assessment model, combined with the ROC curve, offers valuable support for the primary prevention and management of obesity in college students. Furthermore, we found a significant association between dietary patterns and obesity among college students. Four distinct dietary patterns were identified: the vegetable meat grain dietary pattern, the aquatic meat dietary pattern, the snack mode dietary pattern and the milk egg dietary pattern. A healthy dietary pattern, constructed based on these four patterns, was negatively associated with obesity risk in college students. Binary logistic regression analysis highlighted four key predictors of body fat percentage obesity: gender, physical activity, late-night snacking, regular meals, and adherence to a healthy diet.
Data availability statement
The original contributions presented in this study are included in this article/Supplementary material, further inquiries can be directed to the corresponding author.
Ethics statement
The studies involving humans were approved by the Xuzhou Maternal and Child Health Hospital. The studies were conducted in accordance with the local legislation and institutional requirements. The participants provided their written informed consent to participate in this study.
Author contributions
JB: Investigation, Writing – original draft, Validation, Visualization, Formal analysis. MC: Writing – original draft, Data curation, Validation. WH: Writing – original draft, Validation. YH: Methodology, Writing – original draft. JS: Conceptualization, Writing – original draft. YZ: Writing – original draft, Supervision. YJ: Software, Writing – original draft. HH: Software, Writing – original draft. XR: Writing – review & editing.
Funding
The authors declare that financial support was received for the research and/or publication of this article. This research was funded by the National Natural Science Foundation of China (82204056 and 81302429) and Postgraduate Research & Practice Innovation Program of Jiangsu Province (KYCX25_3218 and KYCX24_3133).
Conflict of interest
The authors declare that the research was conducted in the absence of any commercial or financial relationships that could be construed as a potential conflict of interest.
Generative AI statement
The authors declare that no Generative AI was used in the creation of this manuscript.
Any alternative text (alt text) provided alongside figures in this article has been generated by Frontiers with the support of artificial intelligence and reasonable efforts have been made to ensure accuracy, including review by the authors wherever possible. If you identify any issues, please contact us.
Publisher’s note
All claims expressed in this article are solely those of the authors and do not necessarily represent those of their affiliated organizations, or those of the publisher, the editors and the reviewers. Any product that may be evaluated in this article, or claim that may be made by its manufacturer, is not guaranteed or endorsed by the publisher.
Supplementary material
The Supplementary Material for this article can be found online at: https://www.frontiersin.org/articles/10.3389/fnut.2025.1598946/full#supplementary-material
References
1. D’Anneo A, Lauricella M. Multimodal strategies to fight obesity: research on tailored therapies based on natural and synthetic compounds for prevention, management and treatment. Int J Mol Sci. (2023) 24:10105. doi: 10.3390/ijms241210105
2. Bardou M, Rouland A, Martel M, Loffroy R, Barkun A, Chapelle N. Review article: obesity and colorectal cancer. Aliment Pharmacol Ther. (2022) 56:407–18. doi: 10.1111/apt.17045
3. Zhao L, Cheng Z, Lu Y, Liu M, Chen H, Zhang M, et al. Tirzepatide for weight reduction in Chinese adults with obesity: the SURMOUNT-CN randomized clinical trial. JAMA. (2024) 332:551–60. doi: 10.1001/jama.2024.9217
4. Meseri R, Küçükerdönmez Ö, Akder R. A factor that can yield to eating attitude disorders in university students: self-esteem. J Am Coll Health. (2021) 71:1053–8. doi: 10.1080/07448481.2021.1920598
5. Costache A, Ignat B, Grosu C, Mastaleru A, Abdulan I, Oancea A, et al. Inflammatory pathways in overweight and obese persons as a potential mechanism for cognitive impairment and earlier onset Alzeihmer’s Dementia in the general population: a narrative review. Biomedicines. (2023) 11:3233. doi: 10.3390/biomedicines11123233
6. Jiang Q, Huang X, Wang Z, Dai X, Li R, Cui D. Regional differences of physical fitness and overweight and obesity prevalence among college students before and after COVID-19 pandemic since the “double first-class” initiative in China. Front Public Health. (2024) 11:1252270. doi: 10.3389/fpubh.2023.1252270
7. Liu L, Aimaiti X, Zheng Y, Zhi X, Wang Z, Yin X, et al. Epidemic trends of dyslipidemia in young adults: a real-world study including more than 20,000 samples. Lipids Health Dis. (2023) 22:108. doi: 10.1186/s12944-023-01876-2
8. Hayes J, Balantekin K, Graham A, Strube M, Bickel W, Wilfley D. Implementation intentions for weight loss in college students with overweight and obesity: a proof-of-concept randomized controlled trial. Transl Behav Med. (2021) 11:359–68. doi: 10.1093/tbm/ibaa038
9. Van Hulst A, Jayanetti S, Sanson-Rosas A, Harbec M, Kakinami L, Barnett T, et al. Adolescents’ reports of chaos within the family home environment: investigating associations with lifestyle behaviours and obesity. PLoS One. (2023) 18:e0280737. doi: 10.1371/journal.pone.0280737
10. Qorbani M, Khashayar P, Rastad H, Ejtahed H, Shahrestanaki E, Seif E, et al. Association of dietary behaviors, biochemical, and lifestyle factors with metabolic phenotypes of obesity in children and adolescents. Diabetol Metab Syndr. (2020) 12:108. doi: 10.1186/s13098-020-00617-0
11. Yang Y, Li S, Zhang Y, Wang F, Jiang D, Wang S, et al. Chronotype is associated with eating behaviors, physical activity and overweight in school-aged children. Nutr J. (2023) 22:50. doi: 10.1186/s12937-023-00875-4
12. Al Sabbah H. Prevalence of overweight/obesity, anaemia and their associations among female university students in Dubai, United Arab Emirates: a cross-sectional study. J Nutr Sci. (2020) 9:e26. doi: 10.1017/jns.2020.23
13. Chatterjee A, Gerdes M, Martinez S. Identification of risk factors associated with obesity and overweight-a machine learning overview. Sensors. (2020) 20:2734. doi: 10.3390/s20092734
14. El Kishawi R, Soo K, Abed Y, Muda W. Prevalence and predictors of overweight and obesity among women in the Gaza strip-Palestine: a cross-sectional study. BMC Public Health. (2020) 20:864. doi: 10.1186/s12889-020-08966-1
15. Liu X, He M, Li Y. Adult obesity diagnostic tool: a narrative review. Medicine. (2024) 103:e37946. doi: 10.1097/MD.0000000000037946
16. Spehnjak M, Gušić M, Molnar S, Baić M, Andrašić S, Selimi M, et al. Body composition in elite soccer players from youth to senior squad. Int J Environ Res Public Health. (2021) 18:4982. doi: 10.3390/ijerph18094982
17. Shukohifar M, Mozafari Z, Rahmanian M, Mirzaei M. Performance of body mass index and body fat percentage in predicting metabolic syndrome risk factors in diabetic patients of Yazd. Iran. BMC Endocr Disord. (2022) 22:216. doi: 10.1186/s12902-022-01125-0
18. Wu Y, Nie Q, Wang Y, Liu Y, Liu W, Wang T, et al. Associations between temporal eating patterns and body composition in young adults: a cross-sectional study. Eur J Nutr. (2024) 63:2071–80. doi: 10.1007/s00394-024-03414-x
19. Mello Rodrigues V, Bray J, Fernandes A, Luci Bernardo G, Hartwell H, Secchi Martinelli S, et al. Vegetable consumption and factors associated with increased intake among college students: a scoping review of the last 10 years. Nutrients. (2019) 11:1634. doi: 10.3390/nu11071634
20. Bazyar H, Zare Javid A, Dasi E, Sadeghian M. Major dietary patterns in relation to obesity and quality of sleep among female university students. Clin Nutr ESPEN. (2020) 39:157–64. doi: 10.1016/j.clnesp.2020.07.003
21. Senekal M, Nel J, Eksteen G, Steyn N. Dietary patterns, socio-demographic predictors thereof, and associations of dietary patterns with stunting and overweight/obesity in 1-<10-Year-old children in two economically active provinces in South Africa. Nutrients. (2023) 15:4136. doi: 10.3390/nu15194136
22. Zhao Z, Lu H, Meng R, Si Z, Wang H, Wang X, et al. Risk factor analysis and risk prediction study of obesity in steelworkers: model development based on an occupational health examination cohort dataset. Lipids Health Dis. (2024) 23:10. doi: 10.1186/s12944-023-01994-x
23. Yamada G, Castillo-Salgado C, Jones-Smith J, Moulton L. Obesity prediction by modelling BMI distributions: application to national survey data from Mexico, Colombia and Peru, 1988-2014. Int J Epidemiol. (2020) 49:824–33. doi: 10.1093/ije/dyz195
24. Liu H, Wu Y, Chau P, Chung T, Fong D. Prediction of adolescent weight status by machine learning: a population-based study. BMC Public Health. (2024) 24:1351. doi: 10.1186/s12889-024-18830-1
25. Brubaker P, Otto R, Whaley M. ACSM’s Guidelines for Exercise Testing and Prescription. Indianapolis, IN: American College of Sports Medicine (2006).
26. Park S, Ryoo J, Oh C, Choi J, Chung P, Jung J. Body fat percentage, obesity, and their relation to the incidental risk of hypertension. J Clin Hypertens. (2019) 21:1496–504. doi: 10.1111/jch.13667
27. Brand C, Sehn A, Fochesatto C, de Castro Silveira J, Mota J, Gomez D, et al. Body fat percentage, cardiorespiratory fitness and arterial blood pressure in children and adolescents: a longitudinal analysis. BMC Cardiovasc Disord. (2022) 22:267. doi: 10.1186/s12872-022-02704-8
28. Potter A, Chin G, Looney D, Friedl K. Defining overweight and obesity by percent body fat instead of body mass index. J Clin Endocrinol Metab. (2025) 110:e1103–7. doi: 10.1210/clinem/dgae341
29. Naja F, Hwalla N, Itani L, Karam S, Sibai A, Nasreddine LA. Western dietary pattern is associated with overweight and obesity in a national sample of Lebanese adolescents (13-19 years): a cross-sectional study. Br J Nutr. (2015) 114:1909–19. doi: 10.1017/S0007114515003657
30. Zhang S, Guo F, Yu M, Yang X, Yao Z, Li Q, et al. Reduced Nogo expression inhibits diet-induced metabolic disorders by regulating ChREBP and insulin activity. J Hepatol. (2020) 73:1482–96. doi: 10.1016/j.jhep.2020.07.034
31. Satija A, Hu F, Bowen L, Bharathi A, Vaz M, Prabhakaran D, et al. Dietary patterns in India and their association with obesity and central obesity. Public Health Nutr. (2015) 18:3031–41. doi: 10.1017/S1368980015000312
32. Karpińska E, Moskwa J, Puścion-Jakubik A, Naliwajko S, Soroczyńska J, Markiewicz-Żukowska R, et al. Body composition of young women and the consumption of selected nutrients. Nutrients. (2022) 15:129. doi: 10.3390/nu15010129
33. Haq I, Mariyam Z, Zeb F, Jiang P, Wu X, Shah J, et al. Identification of body composition, dietary patterns and its associated factors in Medical University Students in China. Ecol Food Nutr. (2020) 59:65–78. doi: 10.1080/03670244.2019.1663350
34. Jeong S, Lee D, Rezende L, Giovannucci E. Different correlation of body mass index with body fatness and obesity-related biomarker according to age, sex and race-ethnicity. Sci Rep. (2023) 13:3472. doi: 10.1038/s41598-023-30527-w
35. Remde A, DeTurk S, Almardini A, Steiner L, Wojda T. Plant-predominant eating patterns - how effective are they for treating obesity and related cardiometabolic health outcomes? - a systematic review. Nutr Rev. (2022) 80:1094–104. doi: 10.1093/nutrit/nuab060
36. Tell M, Hedin K, Nilsson M, Golsäter M, Lingfors H. Associations between intakes of foods and their relations to overweight/obesity in 16-year-old adolescents. J Nutr Sci. (2022) 11:e26. doi: 10.1017/jns.2022.24
37. Nkoubat Tchoundjwen S, Kamgang Tchawou A, Mvongo C, Mfopa A, Ngakou Mukam J, Noubissi P, et al. A Cameroon Western Regions high-fat diet (MACAPOS 2) induces visceral obesity in rat. Heliyon. (2024) 11:e41011. doi: 10.1016/j.heliyon.2024.e41011
38. Angeles-Agdeppa I, Sun Y, Tanda K. Dietary pattern and nutrient intakes in association with non-communicable disease risk factors among Filipino adults: a cross-sectional study. Nutr J. (2020) 19:79. doi: 10.1186/s12937-020-00597-x
39. Makura-Kankwende C, Gradidge P, Crowther N, Norris S, Chikowore T. Nutrient patterns and body composition parameters of black South African Women. Nutrients. (2020) 13:6. doi: 10.3390/nu13010006
40. Gallagher C, Moschonis G, Lambert K, Karaglani E, Gavrili S, Erbas B, et al. Sugar-sweetened beverage consumption is associated with visceral fat in children. Br J Nutr. (2021) 125:819–27. doi: 10.1017/S0007114520003256
41. Feng Y, Zhao Y, Liu J, Huang Z, Yang X, Qin P, et al. Consumption of dairy products and the risk of overweight or obesity, hypertension, and type 2 diabetes mellitus: a dose-response meta-analysis and systematic review of cohort studies. Adv Nutr. (2022) 13:2165–79. doi: 10.1093/advances/nmac096
42. Wang P, Song M, Eliassen A, Wang M, Fung T, Clinton S, et al. Optimal dietary patterns for prevention of chronic disease. Nat Med. (2024) 29:719–28. doi: 10.1038/s41591-023-02235-5
43. Saito K, Shimamoto T, Takahashi Y, Okushin K, Takahashi M, Masuda Y, et al. Gender-specific factors contributing to visceral obesity including the sleep-obesity relationship: a large-scale cross-sectional study from East Asia. Sci Rep. (2022) 12:20318. doi: 10.1038/s41598-022-24863-6
44. Holley-Mallo R, Golden A. Obesity and Men’s Health. Nurs Clin North Am. (2021) 56:599–607. doi: 10.1016/j.cnur.2021.07.004
45. Butler J, Gordon-Larsen P, Steffen L, Shikany J, Jacobs D, Popkin B, et al. Associations of 5-year changes in alcoholic beverage intake with 5-year changes in waist circumference and BMI in the Coronary Artery Risk Development in Young Adults (CARDIA) study. PLoS One. (2023) 18:e0281722. doi: 10.1371/journal.pone.0281722
46. Ganson K, Nagata J, Rodgers R, Cunningham M, Lavender J, Murray S, et al. Weight gain attempts and substance use behaviors among adults across five countries. Body Image. (2022) 41:375–83. doi: 10.1016/j.bodyim.2022.04.006
47. Gába A, Dygrýn J, Štefelová N, Rubín L, Hron K, Jakubec L. Replacing school and out-of-school sedentary behaviors with physical activity and its associations with adiposity in children and adolescents: a compositional isotemporal substitution analysis. Environ Health Prev Med. (2021) 26:16. doi: 10.1186/s12199-021-00932-6
48. Julian V, Haschke F, Fearnbach N, Gomahr J, Pixner T, Furthner D, et al. Effects of movement behaviors on overall health and appetite control: current evidence and perspectives in children and adolescents. Curr Obes Rep. (2022) 11:10–22. doi: 10.1007/s13679-021-00467-5
49. de Oliveira I, Maciel N, da Costa B, Soares A, Gomes J. Association between abdominal obesity, screen time and sleep in adolescents. J Pediatr. (2023) 99:45–52. doi: 10.1016/j.jped.2022.02.007
50. Laja García A, Moráis-Moreno C, Samaniego-Vaesken M, Puga A, Partearroyo T, Varela-Moreiras G. Influence of water intake and balance on body composition in healthy young adults from Spain. Nutrients. (2019) 11:1923. doi: 10.3390/nu11081923
51. Mogensen C, Færch K, Bruhn L, Amadid H, Tetens I, Quist J, et al. Timing and frequency of daily energy intake in adults with prediabetes and overweight or obesity and their associations with body fat. Nutrients. (2020) 12:3484. doi: 10.3390/nu12113484
52. Garcidueñas-Fimbres T, Paz-Graniel I, Nishi S, Salas-Salvadó J, Babio N. Eating speed, eating frequency, and their relationships with diet quality, adiposity, and metabolic syndrome, or its components. Nutrients. (2021) 13:1687. doi: 10.3390/nu13051687
53. Torres L, Caciula M, Tomoiaga A, Gugu-Gramatopol C. Correlations between Mental health, physical activity, and body composition in American College Students after the COVID-19 Pandemic Lockdown. Int J Environ Res Public Health. (2023) 20:7045. doi: 10.3390/ijerph20227045
Keywords: risk prediction study, obesity, college students, dietary patterns, PBF
Citation: Bai J, Chen M, Hou W, Han Y, Shao J, Zhang Y, Jiao Y, Hua H and Ren X (2025) Risk factors analysis and prediction models of obesity in college students based on dietary patterns. Front. Nutr. 12:1598946. doi: 10.3389/fnut.2025.1598946
Received: 24 March 2025; Accepted: 22 August 2025;
Published: 11 September 2025.
Edited by:
Shaojie Liu, The First Affiliated Hospital of Xiamen University, ChinaReviewed by:
Haseeb Sattar, Huazhong University of Science and Technology, ChinaDesiani Rizki Purwaningtyas, IPB University, Indonesia
Copyright © 2025 Bai, Chen, Hou, Han, Shao, Zhang, Jiao, Hua and Ren. This is an open-access article distributed under the terms of the Creative Commons Attribution License (CC BY). The use, distribution or reproduction in other forums is permitted, provided the original author(s) and the copyright owner(s) are credited and that the original publication in this journal is cited, in accordance with accepted academic practice. No use, distribution or reproduction is permitted which does not comply with these terms.
*Correspondence: Xiangmei Ren, cnhtQHh6aG11LmVkdS5jbg==