 Xinya Zhu
 Weiping Zhao
 Aiyuan Zhu
 Jianyun Zhao
 Zheng Shen
 Lujia Shou
 Yiyi Mai
 Fen Rong
- 1School of Public Health, Shanghai University of Traditional Chinese Medicine, Shanghai, China
- 2School of Traditional Chinese Medicine, Shanghai University of Traditional Chinese Medicine, Shanghai, China
Backgrounds: There are no studies discussing the relationship between NPAR and mortality among individuals with non-alcoholic Fatty Liver Disease (NAFLD) has not been studied. We aimed to evaluate the correlation between NPAR and all-cause and cardiovascular (CVD) mortality in NAFLD patients in the U.S.
Methods: Based on the National Health and Nutrition Examination Survey (NHANES) database from 2003 to 2018, a total of 4,906 participants aged 20 years and older with NAFLD were enrolled in this study. The survival data came from the National Death Index (NDI), which was followed up to 2019. Multivariable cox proportional hazard models were used to explore the relationship between NPAR and all-cause mortality and cardiovascular (CVD) mortality. Restricted cubic spline analysis and threshold effect analysis were applied to assess the nonlinear association between NPAR and all-cause and CVD mortality.
Results: After adjusting for multiple covariates, compared to participants with the lowest NPAR reference group (<12.63), those in the highest NPAR group (15.96–26.83) have the hazard ratio for all-cause mortality was 1.979 (95%CI, 1.436–2.729) with P value < 0.001 and for CVD mortality was 2.678 (95%CI, 1.428–5.024) with P value < 0.001. A J-shaped relationship between NPAR and all-cause mortality risk was observed among patients with NAFLD (P for nonlinear = 0.003), whereas there was no nonlinear association with CVD mortality (P for nonlinear = 0.121).
Conclusion: The study identified a significant association between elevated levels of NPAR and an increased risk of all-cause and CVD mortality in the United States NAFLD patients.
1 Introduction
Non-alcoholic fatty liver disease (NAFLD) is a global metabolic disease characterized by hepatic parenchymal cell steatosis, which is the result of the combined effects of fat accumulation, oxidative stress, poor lifestyle, intestinal flora imbalance, and insulin resistance (1). Non-alcoholic fatty liver disease, as one of the most common chronic liver disease worldwide (2), has a lobal prevalence of 25.24%, with considerable geographical differences (3). The regions with the highest prevalence of NAFLD were Latin America (44.4%), with lower prevalence in Asia Pacific (28.0%) and Western Europe (25.1%) (4). Over the past 20 years, the death rate from NAFLD has increased by 58%, severely affecting the life quality of patients and placing an enormous financial burden on families and society (5). Extrahepatic diseases such as cardiovascular diseases, diabetes, and obesity have a great impact on the mortality of NAFLD patients (6). To enhance surveillance of mortality associated with NAFLD, it is an imperative need to identify a risk assessment parameter that is not only easily measurable but also cost-effective.
Neutrophil-Percentage-to-Albumin Ratio (NPAR) is a novel composite blood biochemical index reflecting systemic inflammation and immune response. It is easy to obtain and attracts great concern as a potential biomarker for risk assessment of cardiovascular disease, diabetes, chronic obstructive pulmonary disease, metabolic syndrome and other diseases (7–10). According to earlier research (11, 12), NPAR can be used as a biomarker for NAFLD, showing high predictive value in the clinical diagnosis of chronic liver disease. For all we know, few studies have looked at the association of NPAR and mortality among the population with NAFLD. Therefore, our research aimed to examine such association among the participants with NAFLD in National Health and Nutrition Examination Survey (NHANES), a nationally representative large population database.
2 Methods
2.1 Research design and subjects
The study is based on the database of NHANES. It is a national survey conducted by the Centers for Disease Control and Prevention that measures the health and nutrition of adults and children in the United States. In our analysis, we initially included 80,312 participants in total from eight cycles of survey (2003–2004 to 2017–2018) of NHANES. The study protocol was approved by the CDC’s National Committee for Ethical Review of Health Statistics, and all participants signed informed consent, following the principles of the Declaration of Helsinki. After excluding 35,522 participants younger than 20 years of age, we excluded 26,404 excluding with incomplete data on calculating US-FLI and US-FLI scores below 30, retaining 6,317 participants with US-FLI scores ≥ 30. Further exclusion for 140 participants with HBV or HCV positive and 970 participants with heavy alcohol consumption (males alcohol intake > 30 g/d and females alcohol intake > 20 g/d). Ultimately, we eliminated 364 participants on account of pregnant or missing data on mortality status, NPAR and relevant covariates. Therefore, there were 4,906 participants with NAFLD eligible for this study (Figure 1).

Figure 1. Flowchart depicting the selection of participants.
2.2 Diagnosis of NAFLD
We adopted US Fatty Liver Index (US-FLI) as measurement criteria to diagnose NAFLD in this study. The US-FLI is a non-invasive assessment tool that incorporates multiple metabolic markers and demographic factors (13), which was calculated as the following formula:
In the US-FLI prediction model, the AUC (95%CI) was 0.80 (0.77–0.83) and the cutoff was 30 (14). If participants identified as non-Hispanic black or Mexican American, their value was set to 1, and if not, to 0. The measurement units included age in years, international U/L for γ-glutamyltransferase, cm for waist circumference, pmol/L for insulin and mg/dL for glucose (13).
After eliminating those who engaged in heavy alcohol consumption (males alcohol intake > 30 g/d and females alcohol intake > 20 g/d) and hepatitis B and C, patients whose US-FLI score ≥ 30 were defined as NAFLD.
2.3 Ascertainment of mortality
Mortality status in NHANES were linked to the National Death Index (NDI) records as of December 31, 2019. We used the Inter-national Classification of Diseases, Tenth Revision (ICD-10), to define the underlying causes of death. All-cause mortality encompassed deaths resulting from all the causes. CVD mortality refers specifically to deaths caused by cardiovascular diseases (codes I00–I09, I11, I13, and I20–I51) and cerebrovascular diseases (codes I60–I69) (15).
2.4 Measurement of neutrophil percentage-to-albumin ratio
NPAR is a blood biochemical index developed in recent years to measure the ratio of the percentage of neutrophils to the serum albumin level (16). In NHANES, the serum albumin concentration was determined using the bromocresol purple method, while the percentage of neutrophils was determined using a Beckman Coulter automated blood analyzer. NPAR was calculated as Neutrophil percentage (in total WBC count) (%) × 100/Albumin (g/dL) (17).
2.5 Covariates determination
The covariates include age (years: ≤ 39, 40–59, ≥ 60), gender, race (Mexican American, Non-Hispanic White, Non-Hispanic Black, Other Hispanic, or Other Race), marital status (Married, Divorced, Widowed, Never married), education level (Less than high school, High school and Some college or above), smoking status (Never smokers, Former smokers, Never smokers), income (family poverty income ratio: ≤ 1.3, 1.3–3.5, ≥ 3.5), Body mass index (BMI: < 25.0, 25–25.9, ≥ 30.0), diabetes, hypertension, cardiovascular disease, kidney disease, Physical activity (Active, Inactive), high-density lipoprotein (HDL in mmol/L), low-density lipoprotein (LDL in mmol/L), alanine aminotransferase (ALT in U/L), aspartate aminotransferase (AST in U/L), blood creatinine (Cr in μmol/L), blood urea nitrogen (BUN in mmol/L), uric acid (UA in μmol/L) and triglyceride (TG in μmol/L).
2.6 Statistical analysis
We took into account the complicated NHANES sample design by considering appropriate sample, weights, stratification, and clustering. Sample weights for analysis of eight survey cycles were calculated as fasting sample 2-year MEC weight divided by 8. Participants were divided into four groups (Q1, Q2, Q3, Q4) by the quartiles of NPAR, and the Q1 group was used as the reference group. All baseline characteristics were presented as median and inter-quartile range for continuous variables due to non-normal distributions (all Shapiro–Wilk p < 0.001), while unweighted frequency counts and weighted percentages were used to describe categorical variables. To assess between-group differences, we employed the Kruskal-Wallis H test for continuous variables and the Rao-Scott chi-square test for categorical variables.
For the sake of investigating the independent association of NPAR with all-cause and CVD mortality among participants with NAFLD, we established three weighted Cox proportional hazards models using univariate and multivariate Cox regression models, including model 1 (no covariates adjusted), model 2 (basic sociodemographic variables: age, gender, and race) and model 3 (further adjusted for education level, marital status, family poverty income ratio, smoke, BMI, hypertension, cardiovascular disease, diabetes, kidney disease, physical activity, HDL, LDL, AST, ALT, Cr, BUN, UA, and TG). We performed restricted cubic spline (RCS) analysis, an epidemiology method of utilizing third-order polynomials to smoothly joint independent variable intervals at knot points and ensuring the linear extension of the spline function outside the boundary knots through restrictive conditions (18), to account for nonlinearity to consider the nonlinear correlation between NPAR and the two kinds of mortality. The threshold effect analysis detected the inflection point at which the relationship transitioned to nonlinearity. A piecewise Cox proportional hazards regression model was applied to assess NPAR-mortality correlation, stratified by the inflection point.
Kaplan–Meier curves were utilized to evaluate the cumulative survival rates with the log-rank test comparing the discrepancies among four NPAR groups. Employing time-dependent receiver operator characteristic curve (ROC) analyses to access the accuracy of NPAR in forecasting survival outcomes at different time points. Our analyses were additionally stratified by subgroups based on age, gender, race, education levels, BMI, smoke, hypertension, diabetes, cardiovascular disease, and kidney disease. The significance of interactions was evaluated by calculating the p-value for interaction. Data management and statistical analyses were conducted by using Stata/SE software (version 16.0) and R software (version 4.4.1). A 2-sided p value less than 0.05 was deemed statistically significant.
3 Results
3.1 Baseline characteristics of study participants
A total of 4,906 participants diagnosed with NAFLD were enrolled in our research, where 2,620 (55.06%) men and 2,286 (44.94%) women with a mean age of 54.51 ± 16.57. Participants were classified into quartiles based on the distribution of NPAR ranging from 0.18 to 12.63 (first quartile), 12.64–14.24 (second quartile), 14.25–15.95 (third quartile) and 15.96–26.83 (fourth quartile). Compared with participants in the lowest quartile of NPAR, individuals with higher levels of NPAR tend to be older, female, Non-Hispanic White, widowed or divorced, education level at high school, former smokers or current smokers, BMI ≥ 30.0, hypertension, diabetes, and cardiovascular disease. In terms of biochemical indicators, with the increase of NPAR value, the levels of LDL, AST, ALT, UA, Cr, and TG all show a downward trend (Table 1).

Table 1. Baseline characteristics of participants with NAFLD based on NPAR levels.
3.2 Association between NPAR and mortality
During a median follow-up period of 94.5 months (inter-quartile range (IQR), 49.0–135.0 months), 739 (15.1%) deaths were observed in 4,906 participants, with 239 (4.9%) deaths attributed to cardiovascular and cerebrovascular diseases (CVD mortality). We included NPAR in the Cox proportional hazards models as continuous factors and quartile categorical factors, respectively. The analysis of the continuous NPAR variable in model 3 showed that the risk of all-cause and CVD mortality increased by 13.9% (HR: 1.139, 95% CI: 1.084–1.196, p < 0.001) and 20.9% (HR: 1.209, 95% CI: 1.107–1.320, p < 0.001) for each 1-unit upward NPAR levels (Table 2). About categorical variable NPAR, for all-cause mortality in model 1, the risk of all-cause mortality significantly increased with incremental NPAR values (HR: 2.536, 95% CI: 1.939–3.316, p < 0.001). After comprehensive covariate adjustment in model 3, the HR for all-cause mortality in the fourth quartile was 1.979 (95% CI: 1.436–2.729, p < 0.001) compared to the first quartile, showing a conspicuous growing trend (Table 2). Restricted cubic spline analysis demonstrated a nonlinear correlation between NPAR and all-cause mortality (P overall < 0.001, P nonlinear = 0.003) (Figure 2A), specifically revealing a J-shaped relationship. In addition, we further investigated the association between NPAR and all-cause mortality using two segmented Cox regression models. The threshold for all-cause mortality was determined to be 12.535 (Table 3). When NPAR value was ≥ 12.535, we observed that each 1-unit increase in NPAR was related to a 16.7% increase in the all-cause mortality risk (HR: 1.167, 95%CI: 1.129–1.206). While NPAR < 12.535, no significant association was found between NPAR and all-cause mortality. For CVD mortality, in model 1, the risk of CVD mortality significantly increased with incremental NPAR values (HR: 3.618, 95% CI: 2.235–5.857, p < 0.001). After adjusting for multiple variables in model 3, the HR for all-cause mortality in the fourth quartile was 2.678 (95% CI: 1.428–5.024, p = 0.002) compared to the first quartile, showing a conspicuous increasing trend (Table 2). Restricted cubic spline analysis showed an increasing trend in the risk of CVD mortality with rising NPAR (P overall < 0.001), with no evidence of a nonlinear relationship (P for nonlinearity = 0.121) (Figure 2B).

Table 2. Hazard ratios for all-cause mortality and CVD mortality among participants with NAFLD.
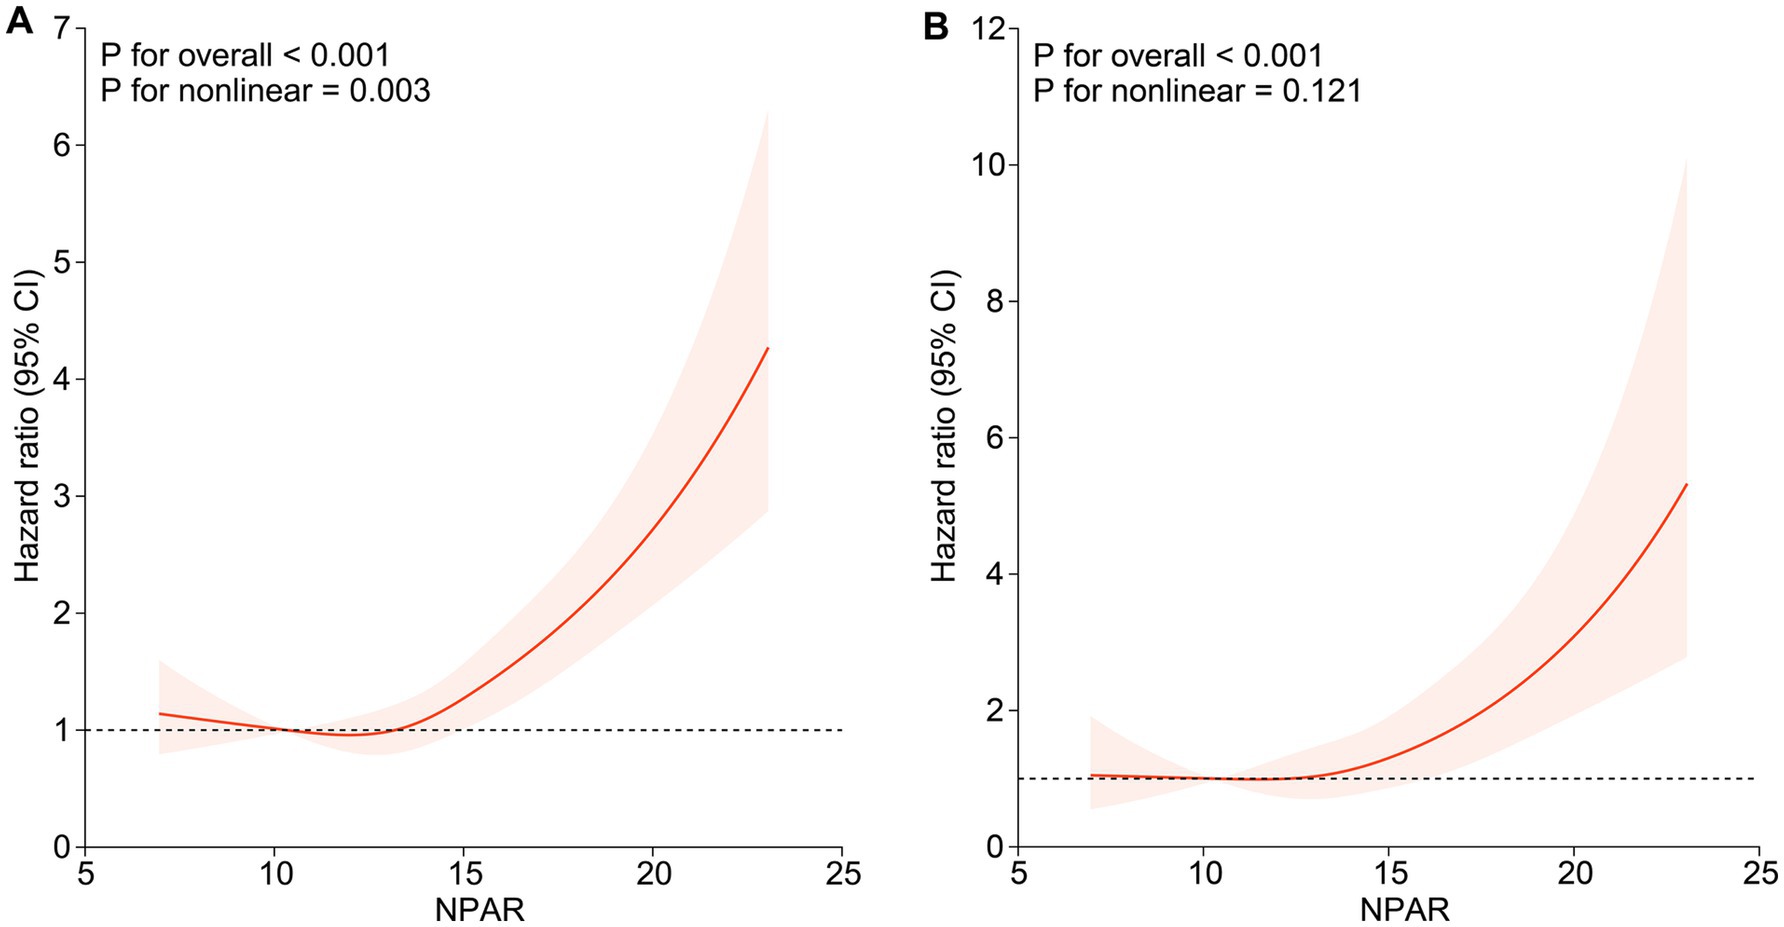
Figure 2. Association of NPAR with all-cause mortality and CVD mortality among participants with NAFLD. (A) Association of NPAR with all-cause mortality; (B) Association of NPAR with CVD mortality. Hazard ratios were adjusted for age, gender, race, education level, marital status, family poverty income ratio, smoke, BMI, hypertension, cardiovascular disease, diabetes, kidney disease, physical activity, HDL, LDL, AST, ALT, Cr, BUN, UA and TG. Solid lines indicate HR and shadow shapes indicate 95% CI. HR, hazard ratio; CI, confidence interval.
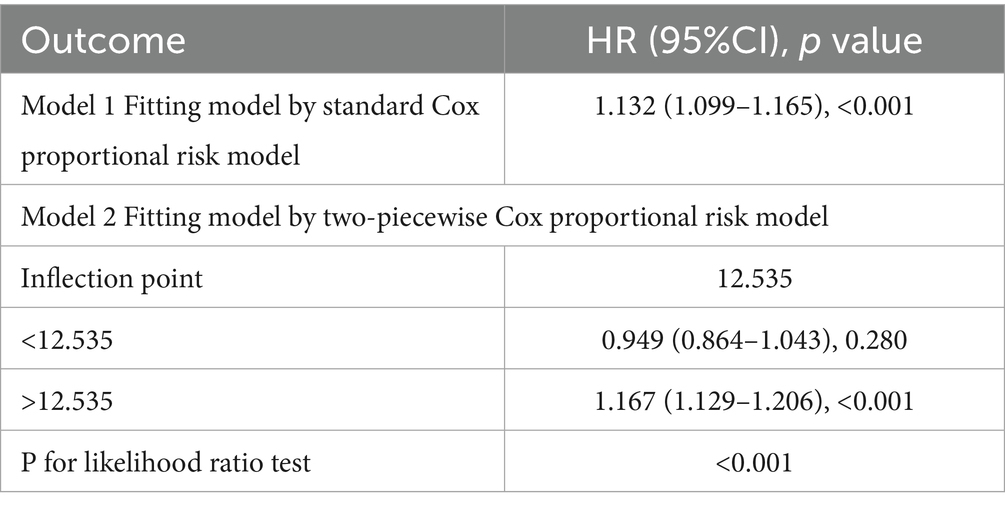
Table 3. Threshold effect analysis of NPAR on all-cause mortality.
3.3 Survival analysis curves based on NPAR
Kaplan–Meier (KM) curves reflected the cumulative survival probability for different NPAR groups (Figure 3). We found significant discrepancies in survival rates between distinct NPAR groups (log-rank test: all-cause mortality: p < 0.001; CVD mortality: p < 0.001), where Kaplan–Meier curves for all-cause mortality and cardiovascular mortality indicated a lower survival rate in the higher NPAR group. Figure 4 illustrated receiver operating characteristic (ROC) curves and the area under curves (AUC) of NPAR for predicting survival conditions at different times. The AUC values were 0.736, 0.671, 0.657 for 1-year, 3-year and 5-year of all-cause deaths (Figure 4A), and were 0.679, 0.659, 0.686 for 1-year, 3-year and 5-year of CVD-cause deaths (Figure 4B).
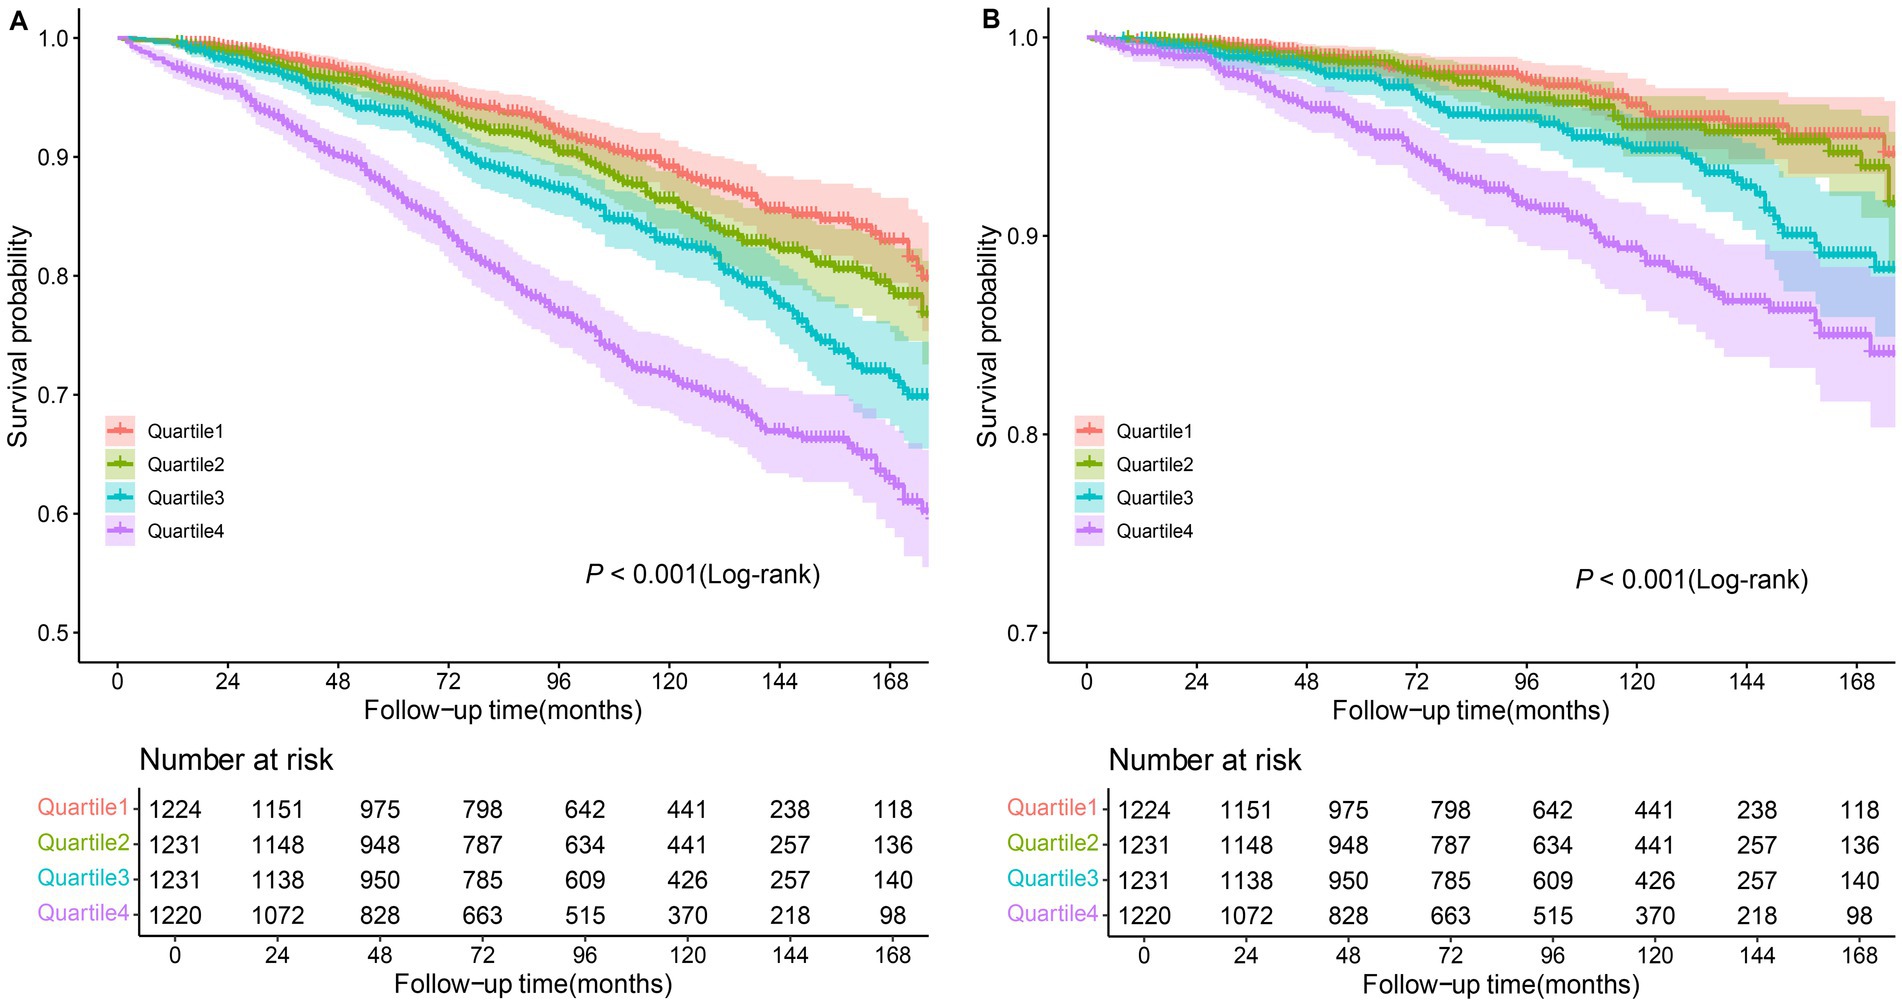
Figure 3. Kaplan–Meier curves of the survival rate among NPAR groups. (A) All-cause mortality; (B) CVD mortality.
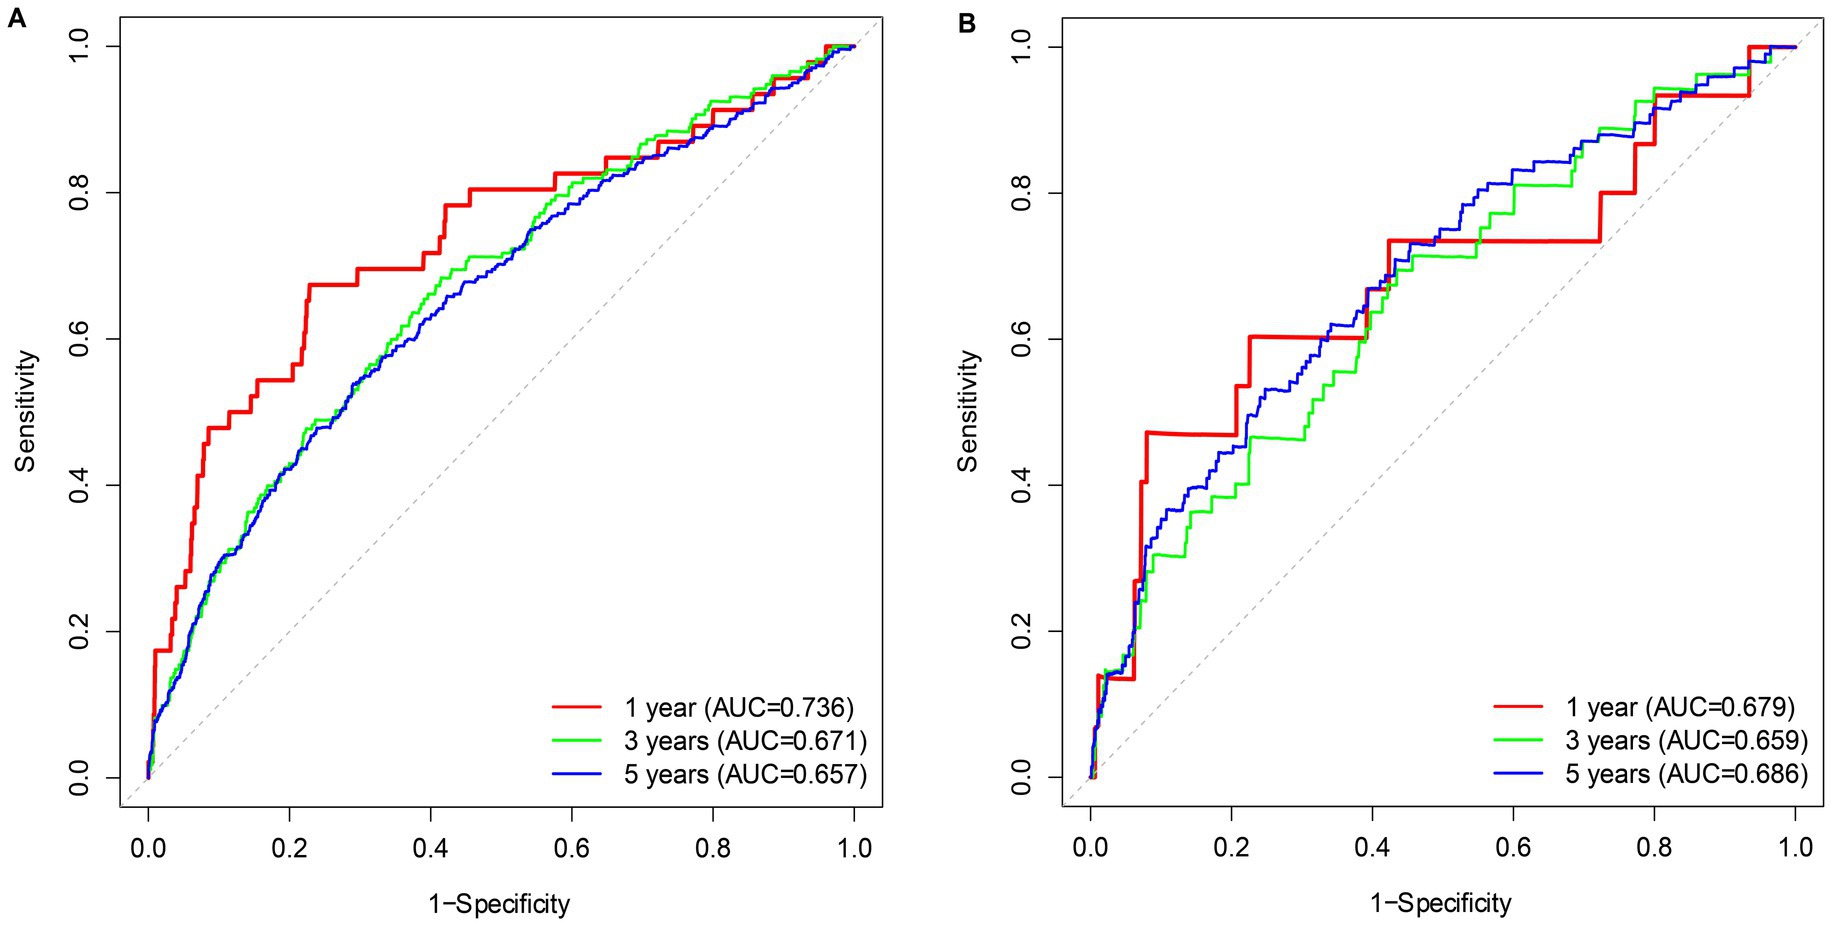
Figure 4. Time-dependent ROC curves of the survival rate with different NPAR values. (A) All-cause mortality; (B) CVD mortality.
3.4 Subgroup analyses and sensitivity analyses
To further investigate the possible association between continuous NPAR and mortality risk, we performed subgroup analyses across various factors, including age, gender, race, education level, marital status, smoke, BMI, hypertension, cardiovascular disease, diabetes, and kidney disease. In our research, notable interactions were discovered between race, BMI and diabetes (p for interaction < 0.05) in relation to all-cause mortality (Figure 5). NPAR may have interactive impact on different education individuals (Figure 6) for CVD mortality. Furthermore, we conducted a range of sensitivity analyses to inspect the robustness of the findings. Firstly, we included 3,196 NAFLD participants in the NHANES 1999–2002 database to examine the association between NPAR and mortality (Supplementary Table S1, Supplementary Figures S1A,B). The restricted cubic spline (RCS) analysis revealed a significant nonlinear association between NPAR and all-cause mortality (P for overall < 0.001; P for nonlinearity = 0.030). Secondly, we employed unweighted cox regression analysis on the correlation of NPAR with mortality rate, the results demonstrated no substantial change (Supplementary Table S2). Thirdly, when excluding the patients who died within the first 2 years of follow-up (Supplementary Table S3), and excluding individuals with liver cirrhosis, liver fibrosis, non-hepatic cancers at baseline (Supplementary Table S4), the results maintained generally robust in sensitivity.
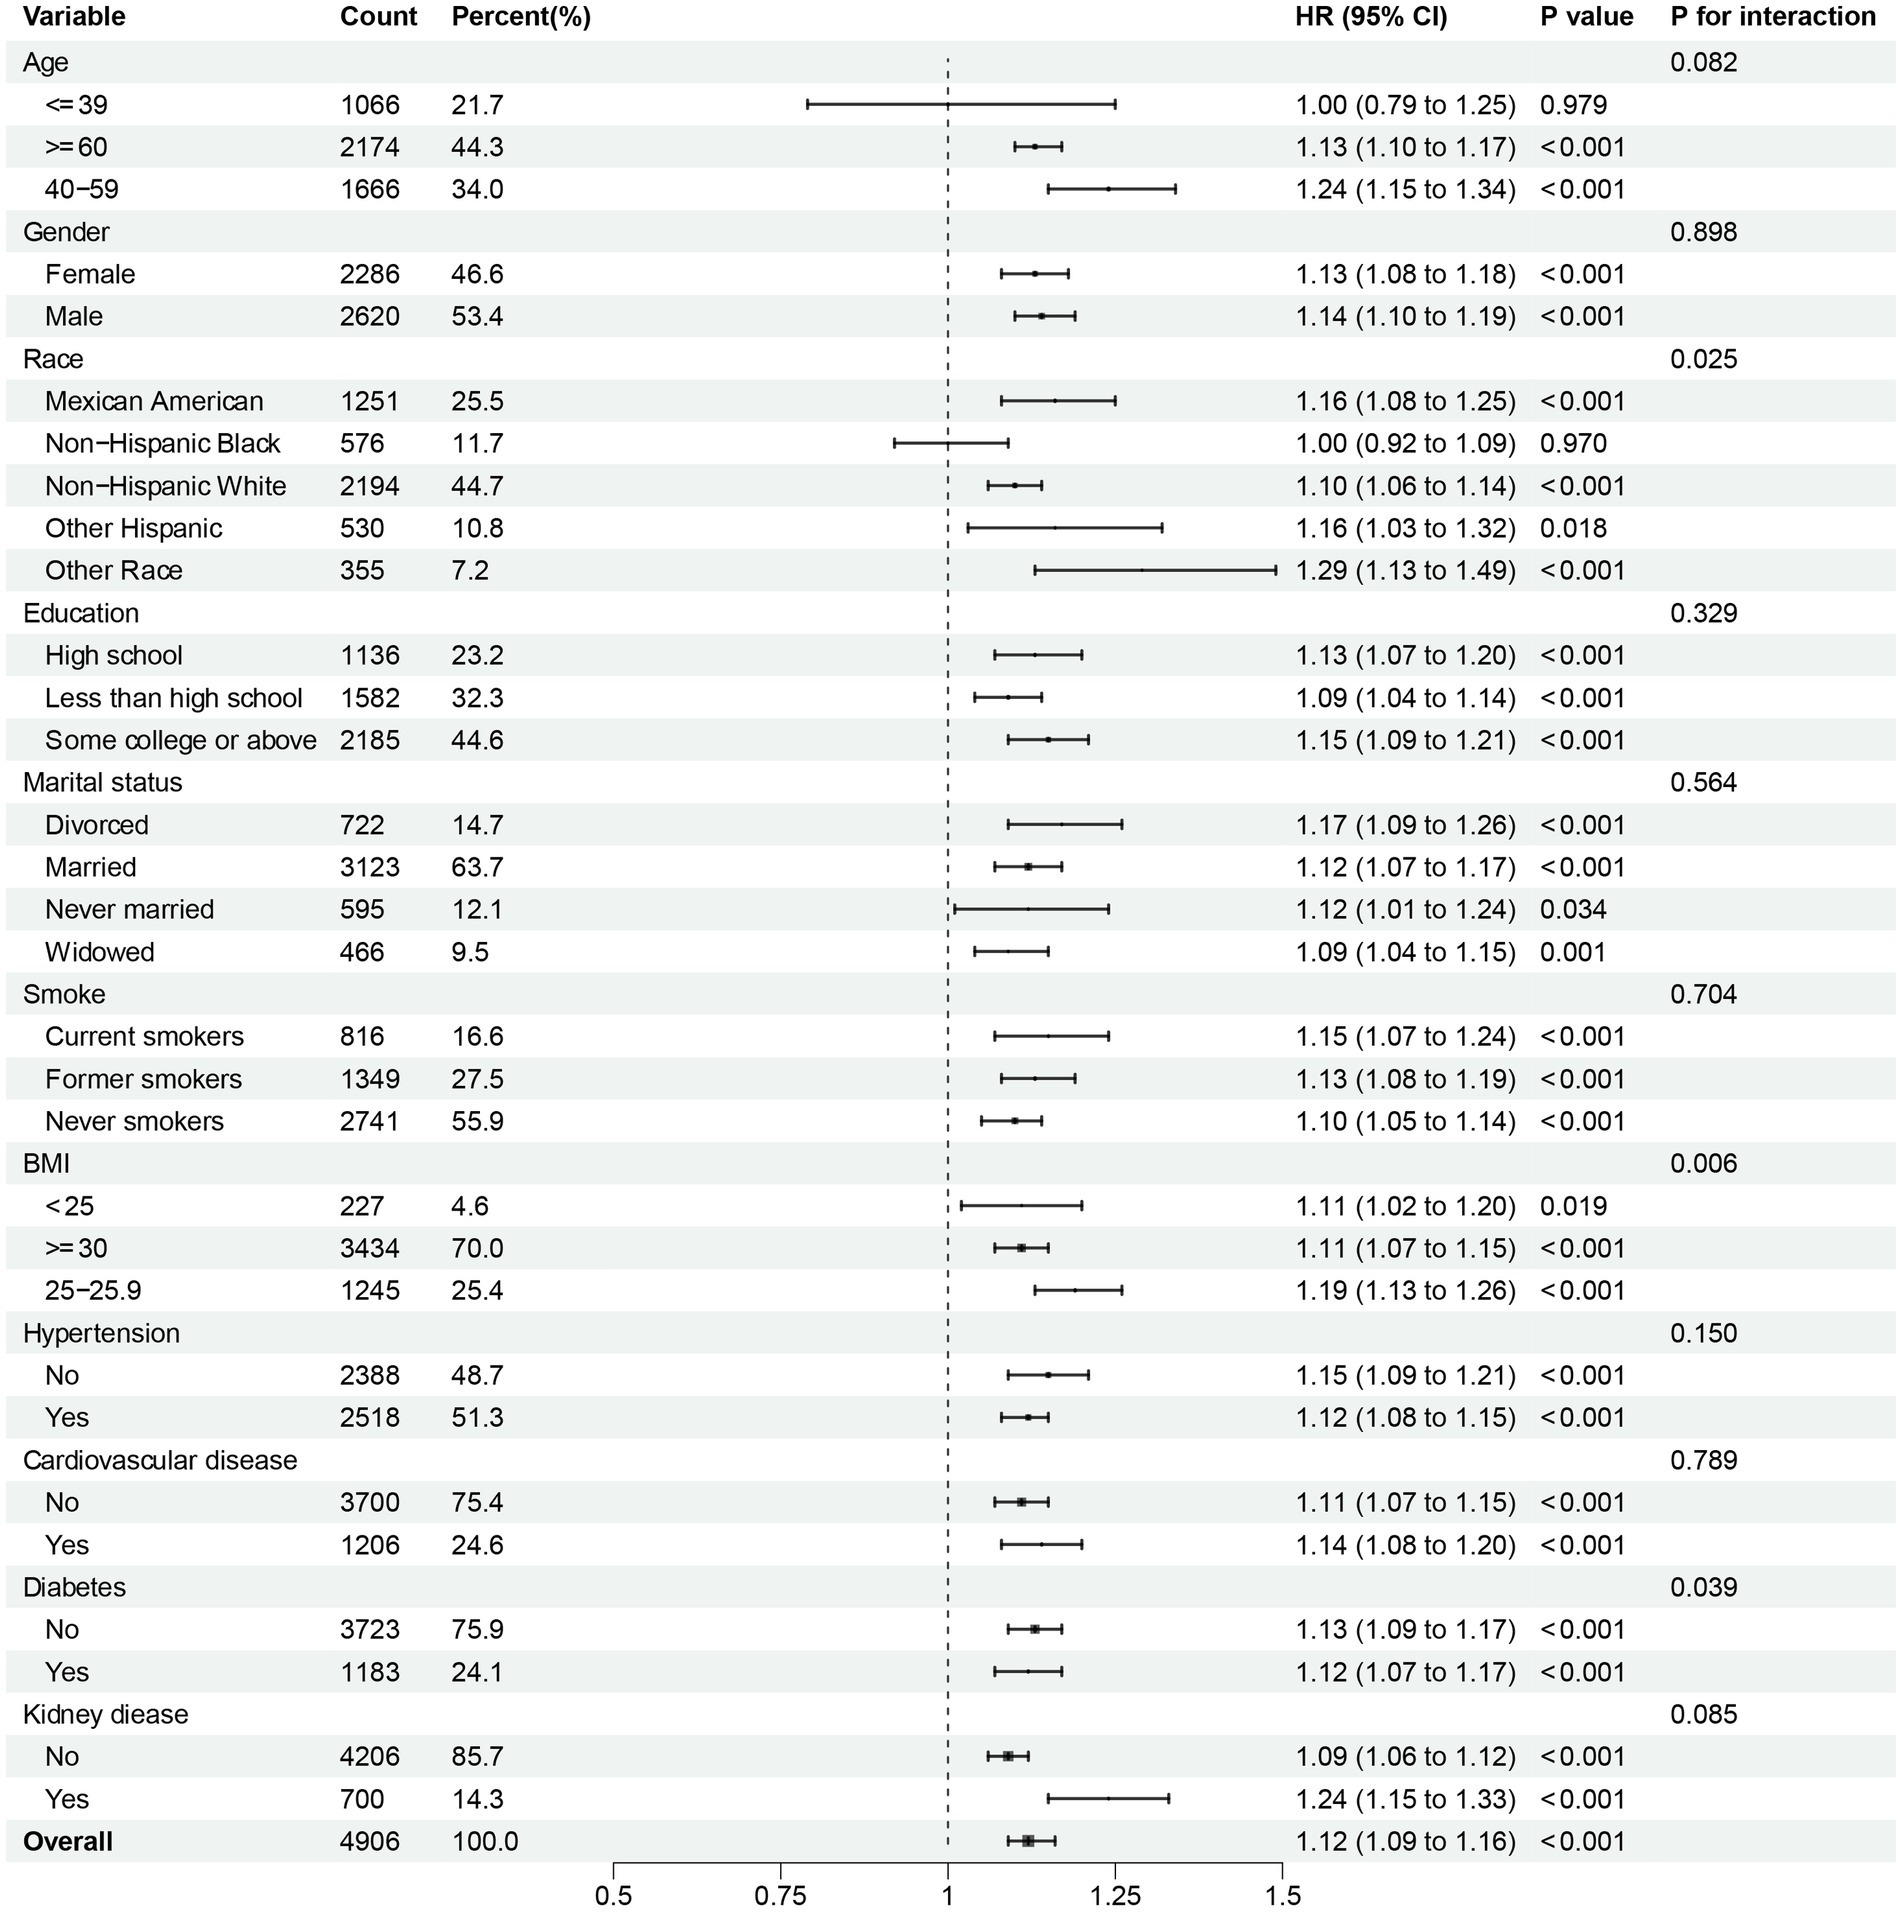
Figure 5. Subgroup analysis of multi-variable adjusted association of NPAR with all-cause mortality.
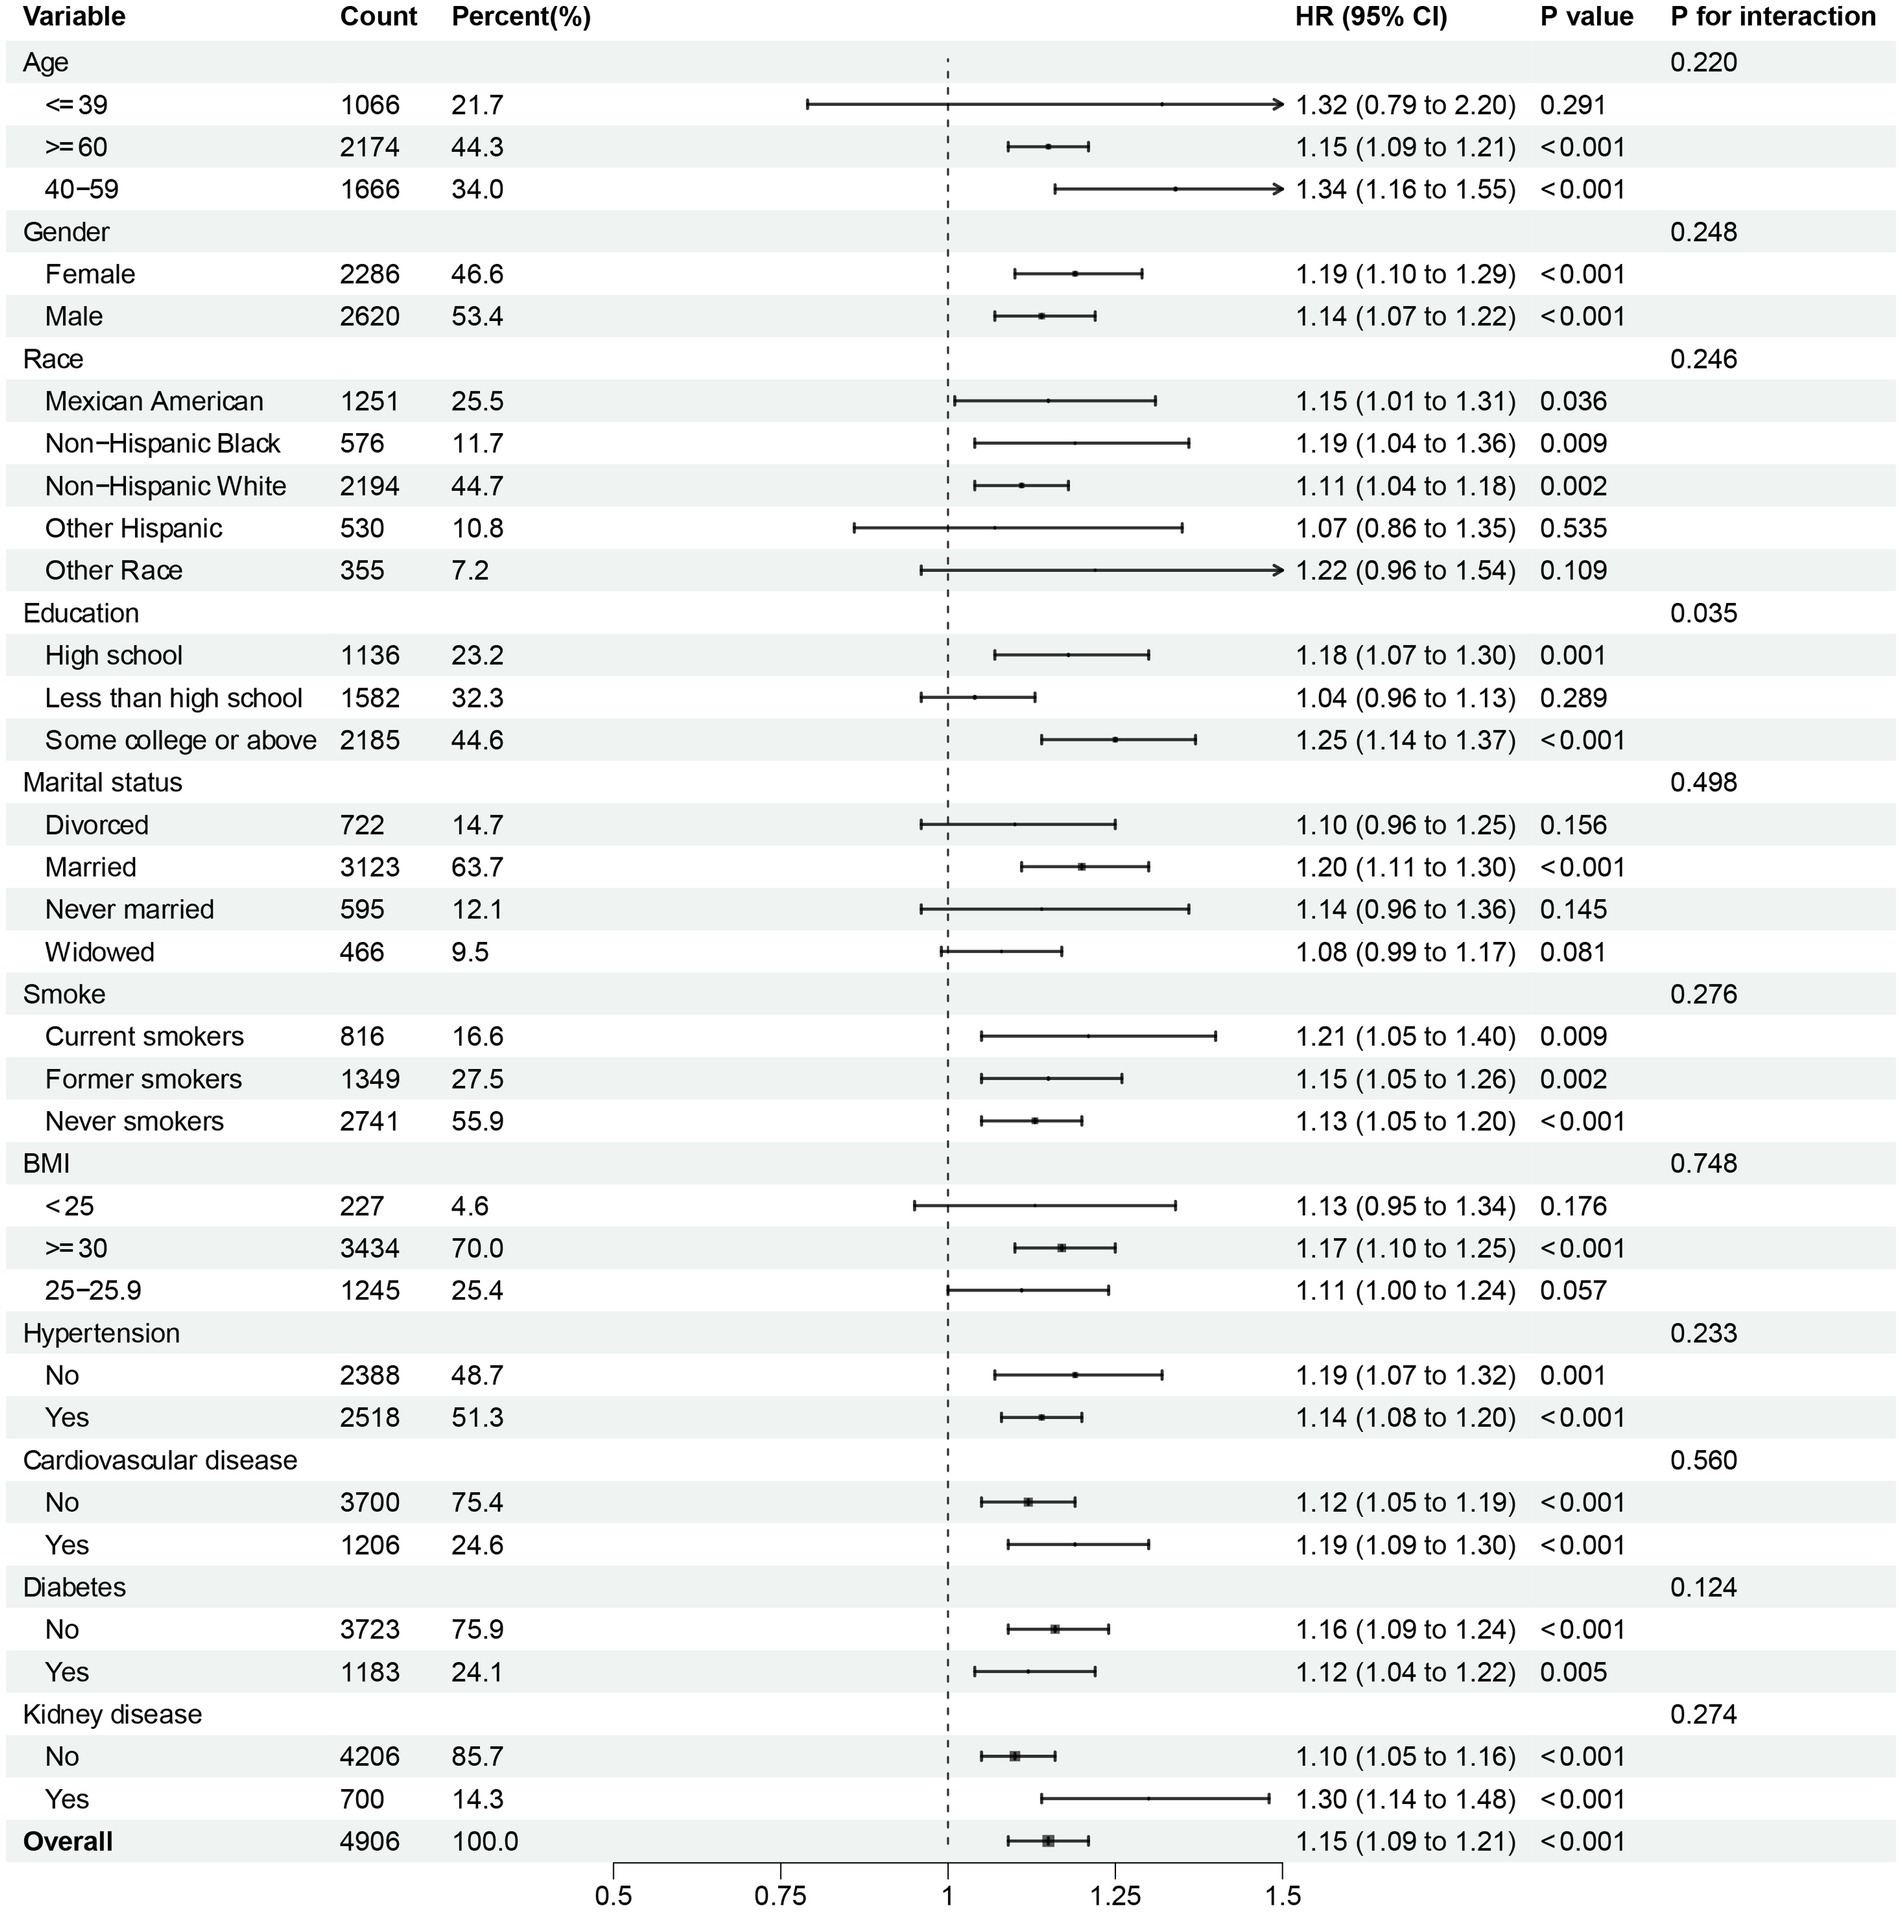
Figure 6. Subgroup analysis of multi-variable adjusted association of NPAR with CVD mortality.
4 Discussion
In this research, we comprehensively analyzed the association between the blood biochemical markers NPAR and all-cause as well as CVD mortality using multiple methods based on a large population database. Using data from NHANES, involving 4,906 participants with NAFLD at baseline, we detected an independent association between higher NPAR levels and increased risk of all-cause and CVD mortality in NAFLD patients after adjustment for multiple confounding covariates. The restricted cubic spline analysis and Kaplan–Meier curves indicated that the risk of all-cause and CVD mortality increased with growing NPAR levels. Thus, it can be seen that NPAR may be a newly developed and promising biomarker for identifying mortality in patients with NAFLD.
In clinical practice, liver biopsy is the current gold standard in assessing the degree of hepatic steatosis and confirming the diagnosis and prognosis of NAFLD (19). Nevertheless, it is an expensive and invasive procedure with high sampling error and risk of complications, resulting in poor patient acceptance of this invasive standard technique (20). Therefore, early detection and intervention by reliable and feasible non-invasive diagnostic methods for patients with high-risk NAFLD is the key to prolong the life cycle and improve the life quality. Neutrophil percentage and albumin concentration are simple and affordable clinical indicators. Neutrophils, the most abundant white blood cells in humans, play a vital role in mediating inflammatory responses (21). Albumin has immunomodulatory, antioxidant, and anti-inflammatory effects, which content might be reduced due to impaired liver function or inflammation (22). Large amounts of previous studies have examined the link between NPAR and a variety of disease-specific populations, such as patients with diabetic retinopathy (23), Oral Cavity Cancer (24), chronic kidney disease (25), spontaneous bacterial peritonitis (26), and stroke-associated infection (27). For instance, Xiao-Je He et al. who conducted a study using 1999–2018 NHANES data proofed higher NPAR was an independent risk factor for diabetic retinopathy compared to lower NPAR (OR, 95% CI: 1.18, 1.00–1.39; 1.24, 1.04–1.48) (23). A prospective cohort investigation carried out by Nasser Mousa et al. included 465 patients diagnosed with cirrhotic ascites and SBP according to international guidelines. The results revealed NPAR of > 17 effectively predicts spontaneous bacterial peritonitis (SBP) diagnosis with a sensitivity of 85.71% and specificity of 66.67% and NPAR may create a more accurate and reliable biomarker for predicting SBP. Other studies have confirmed the association between NPAR and NAFLD. In a cross-sectional study based on NHANES data from 2017 to 2018, Chi-Feng Liu and Li-Wei Chien found that per unit increases in NPAR were significantly associated with an increased risk of developing NAFLD, while NPAR was associated with higher odds of advanced fibrosis as well (11). Dragos Constantin Cucoranu et al. evaluated the association between liver decay values and NPAR by analyzing non-contrast-enhanced CT scans of 115 adult patients. Their founding showed a statistical correlation between NPAR and the presence of NAFLD and NPAR had an inverse connection with the liver HU values (28).
In addition, NPAR has become a novel and reliable predictor of adverse outcomes for a variety of diseases. Yuxuan Xu et al. obtained clinical information from patients with atrial fibrillation from Yuying Children’s Hospital of Wenzhou Medical University and Intensive Care-IV version 2.0 (MIMIC-IV) database to evaluate the relationship between NPAR and all-cause mortality, the findings suggested that Higher NPAR was associated with a higher risk of 30-day (OR 2.08, 95% CI 1.58–2.75), 90-day (OR 2.07, 95% CI 1.61–2.67), and one-year mortality (OR 1.60, 95% CI 1.26–2.04) (29). In a retrospective, single-center study of 741 sepsis patients admitted to the ICU of the Affiliated Hospital of Jining Medical University, Chunying Hu et al. found high NPAR values remained significantly associated with 28-day mortality in comparison with low NPAR values (tertile 2 vs. 1: HR, 95% CI: 1.42, 1.06–1.90; tertile 3 vs. 1: HR, 95% CI: 1.35, 1.00–1.82) (30). To sum up, many previous studies have linked NPAR to mortality from cardiovascular disease, diabetes, kidney disease and other chronic diseases. Nevertheless, our study examined the association between NPAR and all-cause mortality and CVD mortality in NAFLD patients in the NHANES database from 2003 to 2018 and found that increased NPAR levels were strongly associated with an increased risk of death in NAFLD patients.
The biological mechanism underlying the correlation between higher NPAR and mortality in NAFLD patients could be that NPAR is an indicator of inflammatory status. Albumin is synthesized from amino acids in the liver, and its production and concentration in plasma may be reduced due to decreasing supply of precursor amino acids or liver diseases such as NAFLD (31). Low serum albumin levels are crucial biomarkers of inflammation severity and infection complications. A study revealed that albumin played an important role in the prevention and management of patients with cirrhosis through its oncotic and non-oncotic properties (32). Therefore, we hypothesized that NPAR may reflect inflammation, malnutrition, and other abnormalities throughout the lifespan of individuals with NAFLD and could be linked with all-cause and CVD mortality. Our findings had clinical implications in supporting the use of NPAR as composite biomarkers in blood biochemical tests and in early prediction of mortality in patients with NAFLD.
5 Strengths and limitations
Our study has several advantages. This research was based on a large population based NHANES database with extensive data coverage and a long enough follow-up time to make our study broadly representative. Based on the investigate of the association between NPAR and mortality in U.S. patients with NAFLD, we found a strong link between elevated NPAR and CVD and all-cause mortality by combining cox proportional hazard regression models, restricted cubic splines, threshold effect analysis, subgroup analysis and other statistical methods. It served as a scientific basis for early clinical identification of high-risk NAFLD patients and prediction of adverse disease outcomes.
Several limitations of the research should be acknowledged. First, as the study utilized a single national dataset with exclusively U.S. participants, our findings may be subject to selection bias. The results are required validation through multinational cohort studies involving diverse ethnic populations to confirm the universal applicability of the NPAR-mortality correlation. Second, we only studied the predictive values of baseline NPAR, and the longitudinal changes in NPAR over time is still unknown. Third, as an observational study, our findings demonstrated associations rather than causal relationships between NPAR and NAFLD-related mortality. Additionally, while we considered major confounders in our study, unmeasured potential factors may affect the observed associations. Therefore, further studies need to focus on confirming the above conclusions through large-scale prospective studies.
6 Conclusion
The study revealed that NPAR derived from blood neutrophils and albumin was independently associated with all-cause and CVD mortality in patients with NAFLD in the United States. We found a nonlinear positive correlation between NPAR and all-cause mortality.
Data availability statement
The datasets presented in this study can be found in online repositories. The names of the repository/repositories and accession number(s) can be found at: https://www.cdc.gov/nchs/nhanes/, National Health and Nutrition Examination Survey.
Ethics statement
All human-focused procedures relevant to this study were approved by the National Health and Nutrition Examination Survey (NHANES). The study adhered to local legislative requirements and institutional guidelines, with all participants providing written informed consent for their involvement.
Author contributions
XZ: Software, Writing – original draft, Visualization, Conceptualization, Writing – review & editing, Validation, Investigation, Formal analysis, Methodology. WZ: Data curation, Validation, Writing – review & editing. AZ: Writing – review & editing, Validation, Data curation. JZ: Data curation, Writing – review & editing, Software. ZS: Validation, Writing – review & editing, Software, Data curation. LS: Software, Data curation, Writing – review & editing. YM: Data curation, Software, Writing – review & editing. FR: Funding acquisition, Resources, Supervision, Writing – review & editing, Methodology, Investigation.
Funding
The author(s) declare that financial support was received for the research and/or publication of this article. This research was funded by 2024 Education Scientific Research Project of Shanghai (C2024167), 2023 Shanghai University Municipal Key Curriculum Construction (306), and the 23rd Issue of Curriculum Construction of Key Projects of Shanghai University of Traditional Chinese Medicine (KECJ2024012).
Acknowledgments
The authors express gratitude to the National Center for Health Statistics of the Centers for Disease Control and Prevention for their collaboration in providing the data.
Conflict of interest
The authors declare that they have no known competing financial interests or personal relationships that could have appeared to influence the work reported in this study.
Generative AI statement
The author(s) declare that no Gen AI was used in the creation of this manuscript.
Any alternative text (alt text) provided alongside figures in this article has been generated by Frontiers with the support of artificial intelligence and reasonable efforts have been made to ensure accuracy, including review by the authors wherever possible. If you identify any issues, please contact us.
Publisher’s note
All claims expressed in this article are solely those of the authors and do not necessarily represent those of their affiliated organizations, or those of the publisher, the editors and the reviewers. Any product that may be evaluated in this article, or claim that may be made by its manufacturer, is not guaranteed or endorsed by the publisher.
Supplementary material
The Supplementary material for this article can be found online at: https://www.frontiersin.org/articles/10.3389/fnut.2025.1607486/full#supplementary-material
References
1. Guo, X, Yin, X, Liu, Z, and Wang, J. Non-alcoholic fatty liver disease (NAFLD) pathogenesis and natural products for prevention and treatment. Int J Mol Sci. (2022) 23:5489. doi: 10.3390/ijms232415489
2. Niriella, MA, Ediriweera, DS, Withanage, MY, Darshika, S, De Silva, ST, and Janaka de Silva, H. Prevalence and associated factors for non-alcoholic fatty liver disease among adults in the south Asian region: a meta-analysis. Lancet Reg Health Southeast Asia. (2023) 15:100220. doi: 10.1016/j.lansea.2023.100220
3. Younossi, ZM, Koenig, AB, Abdelatif, D, Fazel, Y, Henry, L, and Wymer, M. Global epidemiology of nonalcoholic fatty liver disease-meta-analytic assessment of prevalence, incidence, and outcomes. Hepatology. (2016) 64:73–84. doi: 10.1002/hep.28431
4. Younossi, ZM, Golabi, P, Paik, JM, Henry, A, Van Dongen, C, and Henry, L. The global epidemiology of nonalcoholic fatty liver disease (NAFLD) and nonalcoholic steatohepatitis (NASH): a systematic review. Hepatology. (2023) 77:1335–47. doi: 10.1097/HEP.0000000000000004
5. Ye, Q, Zou, B, Yeo, YH, Li, J, Huang, DQ, Wu, Y, et al. Global prevalence, incidence, and outcomes of non-obese or lean non-alcoholic fatty liver disease: a systematic review and meta-analysis. Lancet Gastroenterol Hepatol. (2020) 5:739–52. doi: 10.1016/S2468-1253(20)30077-7
6. Driessen, S, Francque, SM, Anker, SD, Castro Cabezas, M, Grobbee, DE, Tushuizen, ME, et al. Metabolic dysfunction-associated steatotic liver disease and the heart. Hepatology. (2023) 82:487–503. doi: 10.1097/HEP.0000000000000735
7. Zhao, M, Huang, X, Zhang, Y, Wang, Z, Zhang, S, and Peng, J. Predictive value of the neutrophil percentage-to-albumin ratio for coronary atherosclerosis severity in patients with CKD. BMC Cardiovasc Disord. (2024) 24:277. doi: 10.1186/s12872-024-03896-x
8. Li, X, Gu, Z, and Gao, J. Elevated neutrophil percentage-to-albumin ratio predicts increased all-cause and cardiovascular mortality among individuals with diabetes. Sci Rep. (2024) 14:27870. doi: 10.1038/s41598-024-79355-6
9. Lan, CC, Su, WL, Yang, MC, Chen, SY, and Wu, YK. Predictive role of neutrophil-percentage-to-albumin, neutrophil-to-lymphocyte and eosinophil-to-lymphocyte ratios for mortality in patients with COPD: evidence from NHANES 2011-2018. Respirology. (2023) 28:1136–46. doi: 10.1111/resp.14589
10. Ji, W, Li, H, Qi, Y, Zhou, W, Chang, Y, Xu, D, et al. Association between neutrophil-percentage-to-albumin ratio (NPAR) and metabolic syndrome risk: insights from a large US population-based study. Sci Rep. (2024) 14:26646. doi: 10.1038/s41598-024-77802-y
11. Liu, CF, and Chien, LW. Predictive role of neutrophil-percentage-to-albumin ratio (NPAR) in nonalcoholic fatty liver disease and advanced liver fibrosis in nondiabetic US adults: evidence from NHANES 2017-2018. Nutrients. (2023) 15:1892. doi: 10.3390/nu15081892
12. Bao, B, Xu, S, Sun, P, and Zheng, L. Neutrophil to albumin ratio: a biomarker in non-alcoholic fatty liver disease and with liver fibrosis. Front Nutr. (2024) 11:1368459. doi: 10.3389/fnut.2024.1368459
13. Dong, J, Li, Z, Wang, C, Zhang, R, Li, Y, Liu, M, et al. Dietary folate intake and all-cause mortality and cardiovascular mortality in American adults with non-alcoholic fatty liver disease: data from NHANES 2003 to 2018. PLoS One. (2024) 19:e0314148. doi: 10.1371/journal.pone.0314148
14. Ruhl, CE, and Everhart, JE. Fatty liver indices in the multiethnic United States National Health and nutrition examination survey. Aliment Pharmacol Ther. (2015) 41:65–76. doi: 10.1111/apt.13012
15. Chen, G, Che, L, Lai, M, Wei, T, Chen, C, Zhu, P, et al. Association of neutrophil-lymphocyte ratio with all-cause and cardiovascular mortality in US adults with diabetes and prediabetes: a prospective cohort study. BMC Endocr Disord. (2024) 24:64. doi: 10.1186/s12902-024-01592-7
16. Wang, L, Liu, L, Liu, X, and Yang, L. The association between neutrophil percentage-to-albumin ratio (NPAR) and depression among US adults: a cross-sectional study. Sci Rep. (2024) 14:21880. doi: 10.1038/s41598-024-71488-y
17. Wu, CC, Wu, CH, Lee, CH, and Cheng, CI. Association between neutrophil percentage-to-albumin ratio (NPAR), neutrophil-to-lymphocyte ratio (NLR), platelet-to-lymphocyte ratio (PLR) and long-term mortality in community-dwelling adults with heart failure: evidence from US NHANES 2005-2016. BMC Cardiovasc Disord. (2023) 23:312. doi: 10.1186/s12872-023-03316-6
18. Arnes, JI, Hapfelmeier, A, Horsch, A, and Braaten, T. Greedy knot selection algorithm for restricted cubic spline regression. Front Epidemiol. (2023) 3:1283705. doi: 10.3389/fepid.2023.1283705
19. Tincopa, MA, and Loomba, R. Non-invasive diagnosis and monitoring of non-alcoholic fatty liver disease and non-alcoholic steatohepatitis. Lancet Gastroenterol Hepatol. (2023) 8:660–70. doi: 10.1016/S2468-1253(23)00066-3
20. Piazzolla, VA, and Mangia, A. Noninvasive diagnosis of NAFLD and NASH. Cells. (2020) 9:1005. doi: 10.3390/cells9041005
21. Herrero-Cervera, A, Soehnlein, O, and Kenne, E. Neutrophils in chronic inflammatory diseases. Cell Mol Immunol. (2022) 19:177–91. doi: 10.1038/s41423-021-00832-3
22. Schupp, T, Behnes, M, Rusnak, J, Ruka, M, Dudda, J, Forner, J, et al. Does albumin predict the risk of mortality in patients with cardiogenic shock? Int J Mol Sci. (2023) 24:7375. doi: 10.3390/ijms24087375
23. He, X, Dai, F, Zhang, X, and Pan, J. The neutrophil percentage-to-albumin ratio is related to the occurrence of diabetic retinopathy. J Clin Lab Anal. (2022) 36:e24334. doi: 10.1002/jcla.24334
24. Ko, CA, Fang, KH, Tsai, MS, Lee, YC, Lai, CH, Hsu, CM, et al. Prognostic value of neutrophil percentage-to-albumin ratio in patients with Oral cavity Cancer. Cancers (Basel). (2022) 14:4892. doi: 10.3390/cancers14194892
25. Li, J, Xiang, T, Chen, X, and Fu, P. Neutrophil-percentage-to-albumin ratio is associated with chronic kidney disease: evidence from NHANES 2009-2018. PLoS One. (2024) 19:e0307466. doi: 10.1371/journal.pone.0307466
26. Mousa, N, Salah, M, Elbaz, S, Elmetwalli, A, Elhammady, A, Abdelkader, E, et al. Neutrophil percentage-to-albumin ratio is a new diagnostic marker for spontaneous bacterial peritonitis: a prospective multicenter study. Gut Pathog. (2024) 16:18. doi: 10.1186/s13099-024-00610-2
27. Zhang, H, Wu, T, Tian, X, Lyu, P, Wang, J, and Cao, Y. High neutrophil percentage-to-albumin ratio can predict occurrence of stroke-associated infection. Front Neurol. (2021) 12:705790. doi: 10.3389/fneur.2021.705790
28. Cucoranu, DC, Pop, M, Niculescu, R, Kosovski, IB, Toganel, RO, Licu, RA, et al. The Association of Nonalcoholic Fatty Liver Disease with Neutrophil-to-Lymphocyte Ratio and Neutrophil-Percentage-to-Albumin Ratio. Cureus. (2023) 15:e41197. doi: 10.7759/cureus.41197
29. Xu, Y, Lin, Z, Zhu, C, Song, D, Wu, B, Ji, K, et al. The neutrophil percentage-to-albumin ratio is associated with all-cause mortality in patients with atrial fibrillation: a retrospective study. J Inflamm Res. (2023) 16:691–700. doi: 10.2147/JIR.S394536
30. Hu, C, He, Y, Li, J, Zhang, C, Hu, Q, Li, W, et al. Association between neutrophil percentage-to-albumin ratio and 28-day mortality in Chinese patients with sepsis. J Int Med Res. (2023) 51:3000605231178512. doi: 10.1177/03000605231178512
31. Allison, SP, and Lobo, DN. The clinical significance of hypoalbuminaemia. Clin Nutr. (2024) 43:909–14. doi: 10.1016/j.clnu.2024.02.018
Keywords: non-alcoholic fatty liver disease, neutrophil-percentage-to-albumin ratio, National Health and Nutrition Examination Survey, all-cause mortality, CVD mortality
Citation: Zhu X, Zhao W, Zhu A, Zhao J, Shen Z, Shou L, Mai Y and Rong F (2025) Association between neutrophil-percentage-to-albumin ratio and mortality among US adults with non-alcoholic fatty liver disease. Front. Nutr. 12:1607486. doi: 10.3389/fnut.2025.1607486
Edited by:
Suxian Zhao, Third Hospital of Hebei Medical University, ChinaReviewed by:
Banghe Bao, Huazhong University of Science and Technology, ChinaYi Feng, Shanghai Jiao Tong University, China
Copyright © 2025 Zhu, Zhao, Zhu, Zhao, Shen, Shou, Mai and Rong. This is an open-access article distributed under the terms of the Creative Commons Attribution License (CC BY). The use, distribution or reproduction in other forums is permitted, provided the original author(s) and the copyright owner(s) are credited and that the original publication in this journal is cited, in accordance with accepted academic practice. No use, distribution or reproduction is permitted which does not comply with these terms.
*Correspondence: Fen Rong, cmY5NzMyOEAxNjMuY29t