 Jun-Zhe Liao
 Xiao Liu
 Min Qi
- 1Department of Respiratory and Critical Care Medicine, Chengdu Fifth People’s Hospital, Chengdu, China
- 2Department of Geriatric Intensive Care Unit, Sichuan Provincial People’s Hospital, University of Electronic Science and Technology of China, Chengdu, China
Objective: Latent tuberculosis (TB) infection (LTBI) is a reservoir for active TB. Although body mass index (BMI) predicts LTBI progression and influences active TB outcomes, its association with mortality in LTBI patients remains unclear. We therefore investigated this relationship in a US cohort.
Research methods & procedures: Data from the National Health and Nutrition Examination Survey 2011–2012 was utilized. Survival differences across BMI categories were assessed with Kaplan–Meier curves and multivariable Cox regression. The Restricted Cubic Spline (RCS) analysis modeled the nonlinear relationship between BMI and mortality risk.
Results: Among 700 LTBI participants analyzed, multivariable Cox regression identified underweight individuals as having higher mortality risk than normalweight counterparts (adjusted HR = 2.77, 95% CI 1.06–7.22, p = 0.04). No significant mortality associations were observed for obese or overweight participants across both crude and adjusted models (all p > 0.05). RCS analysis demonstrated a U-shaped pattern between BMI and mortality, with minimum mortality risk at BMI 27.3 kg/m2 (p for nonlinearity = 0.0012).
Conclusion: In LTBI adults, underweight status independently predicted increased mortality risk, while overweight or obesity showed no association. RCS analysis confirmed a U-shaped BMI-mortality relationship with optimal survival at 27.3 kg/m2.
Introduction
The global burden of tuberculosis (TB) remains a significant public health challenge, with mortality rates varying across populations and regions (1). Latent TB infection (LTBI), defined by an enduring immune response to Mycobacterium tuberculosis antigens without clinical disease, affects approximately 25% of the global population, with an estimated 5–10% progressing to active TB disease (2). This immense scale of LTBI not only fuels ongoing TB transmission but also poses a fundamental challenge to achieving global TB elimination goals.
While the risk factors influencing on TB outcomes have been extensively studied (3–5), the relationship between body mass index (BMI) and mortality in LTBI individuals warrants focused attention. As an established metric of adiposity and nutritional status, BMI demonstrates prognostic value for clinical outcomes across diverse diseases (6–8), indicating its potential utility in assessing systemic resilience during TB infection. Substantial evidence confirms that reduced BMI independently predicts elevated mortality risk in active TB. Retrospective and prospective cohort studies encompassing both drug-sensitive and drug-resistant TB revealed that lower BMI associated with increased mortality and adverse treatment outcomes (4, 9, 10), potentially mediated through nutritional compromise and immune dysfunction (10). Conversely, BMI demonstrated an inverse epidemiological relationship with LTBI prevalence (11), while underweight status accelerates LTBI progression to active disease-though mortality implications specific to LTBI remain inadequately defined.
Elucidating this relationship is paramount. Given that LTBI represents a prolonged state affecting billions, understanding the potential impact of BMI on mortality among LTBI individuals could revolutionize risk stratification. It holds significant potential to inform targeted public health interventions (e.g., nutritional support programs) and refine clinical monitoring strategies for high-risk LTBI individuals, ultimately contributing to reduced TB-related mortality and the success of the WHO’s End TB Strategy.
Therefore, to address this pivotal knowledge gap, this study specifically investigates the association between BMI and all-cause mortality within a well-defined cohort of individuals diagnosed with LTBI.
Materials and methods
Study population
The National Health and Nutrition Examination Survey (NHANES) is a comprehensive nationwide cross-sectional study conducted in the United States. Its primary objective is to evaluate the health and nutritional well-being of the US population. The survey involves standardized household interviews and health assessments conducted at mobile examination centers. These assessments encompass physical evaluations and laboratory tests for the collection of pertinent data. NHANES employs a sophisticated stratified, multilevel probability cluster sampling approach, ensuring the inclusion of a highly representative cross-section of the US population. Ethical approval for the NHANES study protocol was granted by the Research Ethics Review Board of the National Center for Health Statistics (NCHS), and all participants provided written informed consent. Detailed information about the NHANES study design and its data is available to the public.1
Survival data for individuals with TB were acquired from the National Death Index (NDI)2, which is linked to the NHANES surveys and encompasses a repository of more than 100 million death records. The data collection protocol for NHANES surveys has received approval from the NCHS institutional review board. The Ethics Committee has affirmed that the data is analyzable and publishable under a waiver of consent from the individuals involved. Prior to utilization, the data employed in this study underwent anonymization procedures.
We utilized the 2011–2012 NHANES survey cycle for evaluating the correlation between BMI and all-cause mortality among individuals with LTBI. This specific cycle was chosen due to its comprehensive coverage of recent TB testing data for all participants aged ≥ 6 years. To ensure data quality, we excluded participants below the age of 18 and samples without positive QuantiFERON-TB Gold-In-Tube (QFT) or Tuberculin skin test (TST) results.
Assessment of BMI
Body Mass Index (BMI) was computed by dividing weight in kilograms by the square of height in meters, with rounding to a single decimal place. Adhering to the guidelines set forth by the World Health Organization, the BMI classifications were defined as follows (12): underweight <18.5 kg/m2, normalweight 18.5–24.9 kg/m2, overweight 25–29.9 kg/m2, and obesity ≥30 kg/m2.
The definition of LTBI
To determine the TB infection, NHANES participants underwent a skin test using a commercially available antigen, tuberculin-purified protein derivative (PPD) known as tubersol. A controlled amount of 0.1 mL (5 international units) of the designated PPD was administered. Trained NHANES technicians, who were blinded to the participant’s medical history and any potential TB contact, conducted measurements of reactions between 46 and 76 h later.
Furthermore, NHANES participants underwent a secondary screening through the use of an FDA-approved IGRA blood test, specifically the QFT-GIT, to detect TB infection. The QFT-GIT system employs specialized blood collection tubes, including a Nil control tube, a TB Antigen tube, and a Mitogen tube (positive control), for the collection of whole blood via venipuncture. Following collection, the tubes are agitated to mix the antigen with whole blood and then incubated at 37°C ± 1°C for 16 to 24 h. After the incubation period, plasma is harvested and the ELISA method is used to quantify the amount of IFN-γ produced in response to the peptide antigens.
In our study, a positive TST was defined as an induration size of ≥ 10 mm, a criterion commonly used for adults in the US, except for individuals with special risk factors. For the interpretation of a positive QFT-GIT, the following criteria were applied in accordance with NHANES guidelines: (1) The Nil value was required to be ≤ 8.0 IU gamma interferon (IF)/ml, (2) The TB antigen value minus the Nil value had to be ≥ 0.35 IU IF/ml, and (3) The TB antigen value minus the Nil value had to be ≥ 25% of the Nil value. Furthermore, a low response to mitogen (< 0.5 IU/mL) was considered indicative of an indeterminate result when a blood sample also exhibited a negative response to the TB antigens.
Individuals who had a positive result from either the TST or QFT-GIT, and subsequently was ruled out for active TB disease, and possessed complete mortality outcome documentation throughout the study period, were definitively classified as LTBI cases and included in the final analytical cohort.
Variables
Our analysis took into account various factors, such as age, gender, race, education level, marital status, the presence of chronic kidney diseases (CKD), history of asthma, chronic obstructive pulmonary diseases (COPD), diabetes mellitus (DM), alcohol consumption, smoking status. Moreover, we integrated laboratory measurements into our study, including parameters like white blood cell (WBC) count, lymphocyte count, monocyte count, neutrophil count, hemoglobin level, albumin level, sodium level, and glucose level. DM was defined using multiple criteria, including self-reported DM diagnosis, HbA1c levels ≥6.5%, fasting glucose levels ≥7.0 mmol/L, random blood glucose levels ≥11.1 mmol/L, two-hour plasma glucose levels ≥11.1 mmol/L in an oral glucose tolerance test, or the use of oral hypoglycemic agents or insulin. Comprehensive information concerning these variables can be accessed on the website: https://www.cdc.gov/nchs/nhanes/.
Statistical analysis
The statistical analysis was conducted adhering to NHANES analysis guidelines, incorporating intricate sampling weights to account for complex multi-stage clustering surveys. Missing data was imputed with Multiple imputation with chained equations. Continuous variables were represented by their mean values along with their corresponding standard deviations, while categorical variables were expressed in terms of counts and proportions. To evaluate differences across BMI-stratified groups, weighted one-way ANOVA with Bonferroni post-hoc testing was employed for continuous variables, while for categorical variables, weighted chi-square test was utilized, supplemented by Fisher’s exact test when expected frequencies were <5.
For the purpose of visualizing the survival differences among distinct BMI groups, a Kaplan–Meier curve was generated. The correlation between divergent BMI groups and the probability of mortality was examined using a multivariable Cox regression model, with meticulous adjustment for potential confounding variables. No covariates were adjusted for in Crude Model. Model 1 adjusted for age, gender, race, and educational level. Model 2 expanded adjustment to include DM, CKD, COPD, and asthma. Finally, Model 3 incorporated all previous covariates plus lymphocyte count.
To explore potential nonlinear relationships within the regression models comprehensively, the Restricted Cubic Spline (RCS) analysis, incorporating four distinct piecewise points, was employed. This method, widely embraced in the realms of epidemiology and clinical trials, facilitated an in-depth assessment of the intricate associations between BMI and the risk of mortality.
All analyses were executed utilizing R version 4.2.2 (https://www.r-project.org/, The R Foundation). A significance threshold of p < 0.05 was employed to determine statistical significance.
Results
Baseline characteristics of LTBI participants stratified by BMI category
At the outset, our study included 9,756 participants. After excluding those aged under 18 (n = 3,892), those lacking either a positive TST or QFT-GIT result (n = 5,147), and those with active TB disease (n = 17), our final analysis comprised 700 participants (Figure 1).
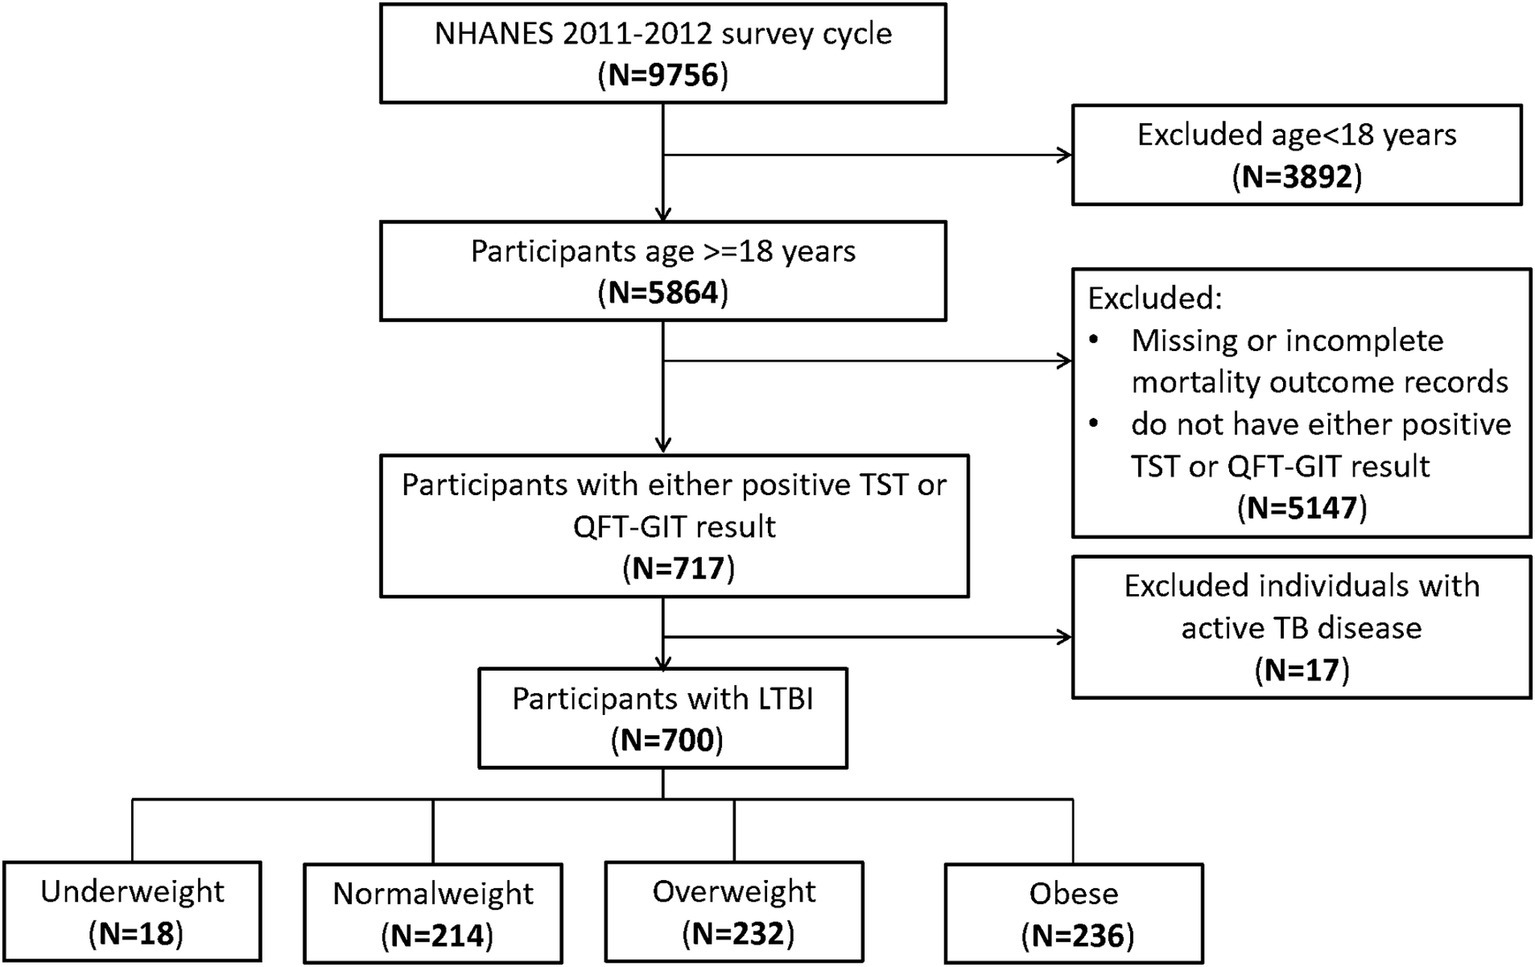
Figure 1. Flowchart of the sample selection from National Health and Nutrition Examination Survey (NHANES) 2011–2012.
The weighted baseline characteristics of the included individuals were presented in Table 1. Our study involved a total of 700 participants with LTBI, with a mean age of 50.58 ± 0.96 years, among whom 44.80% were female and 55.20% were male. The mean BMI was28.74 ± 0.44 kg/m2. TST and QFT-GIT positivity rates were 28.00 and 71.56%, respectively. Analysis across BMI categories revealed statistically significant differences (all p < 0.05) in race, educational levels, presence of DM or CKD, WBC count, lymphocyte count, neutrophil count, platelet count, albumin levels, glucose levels. Notably, compared to the normalweight group, underweight and obese participants exhibited increased mortality rates, while overweight participants demonstrated a decreased mortality rate.
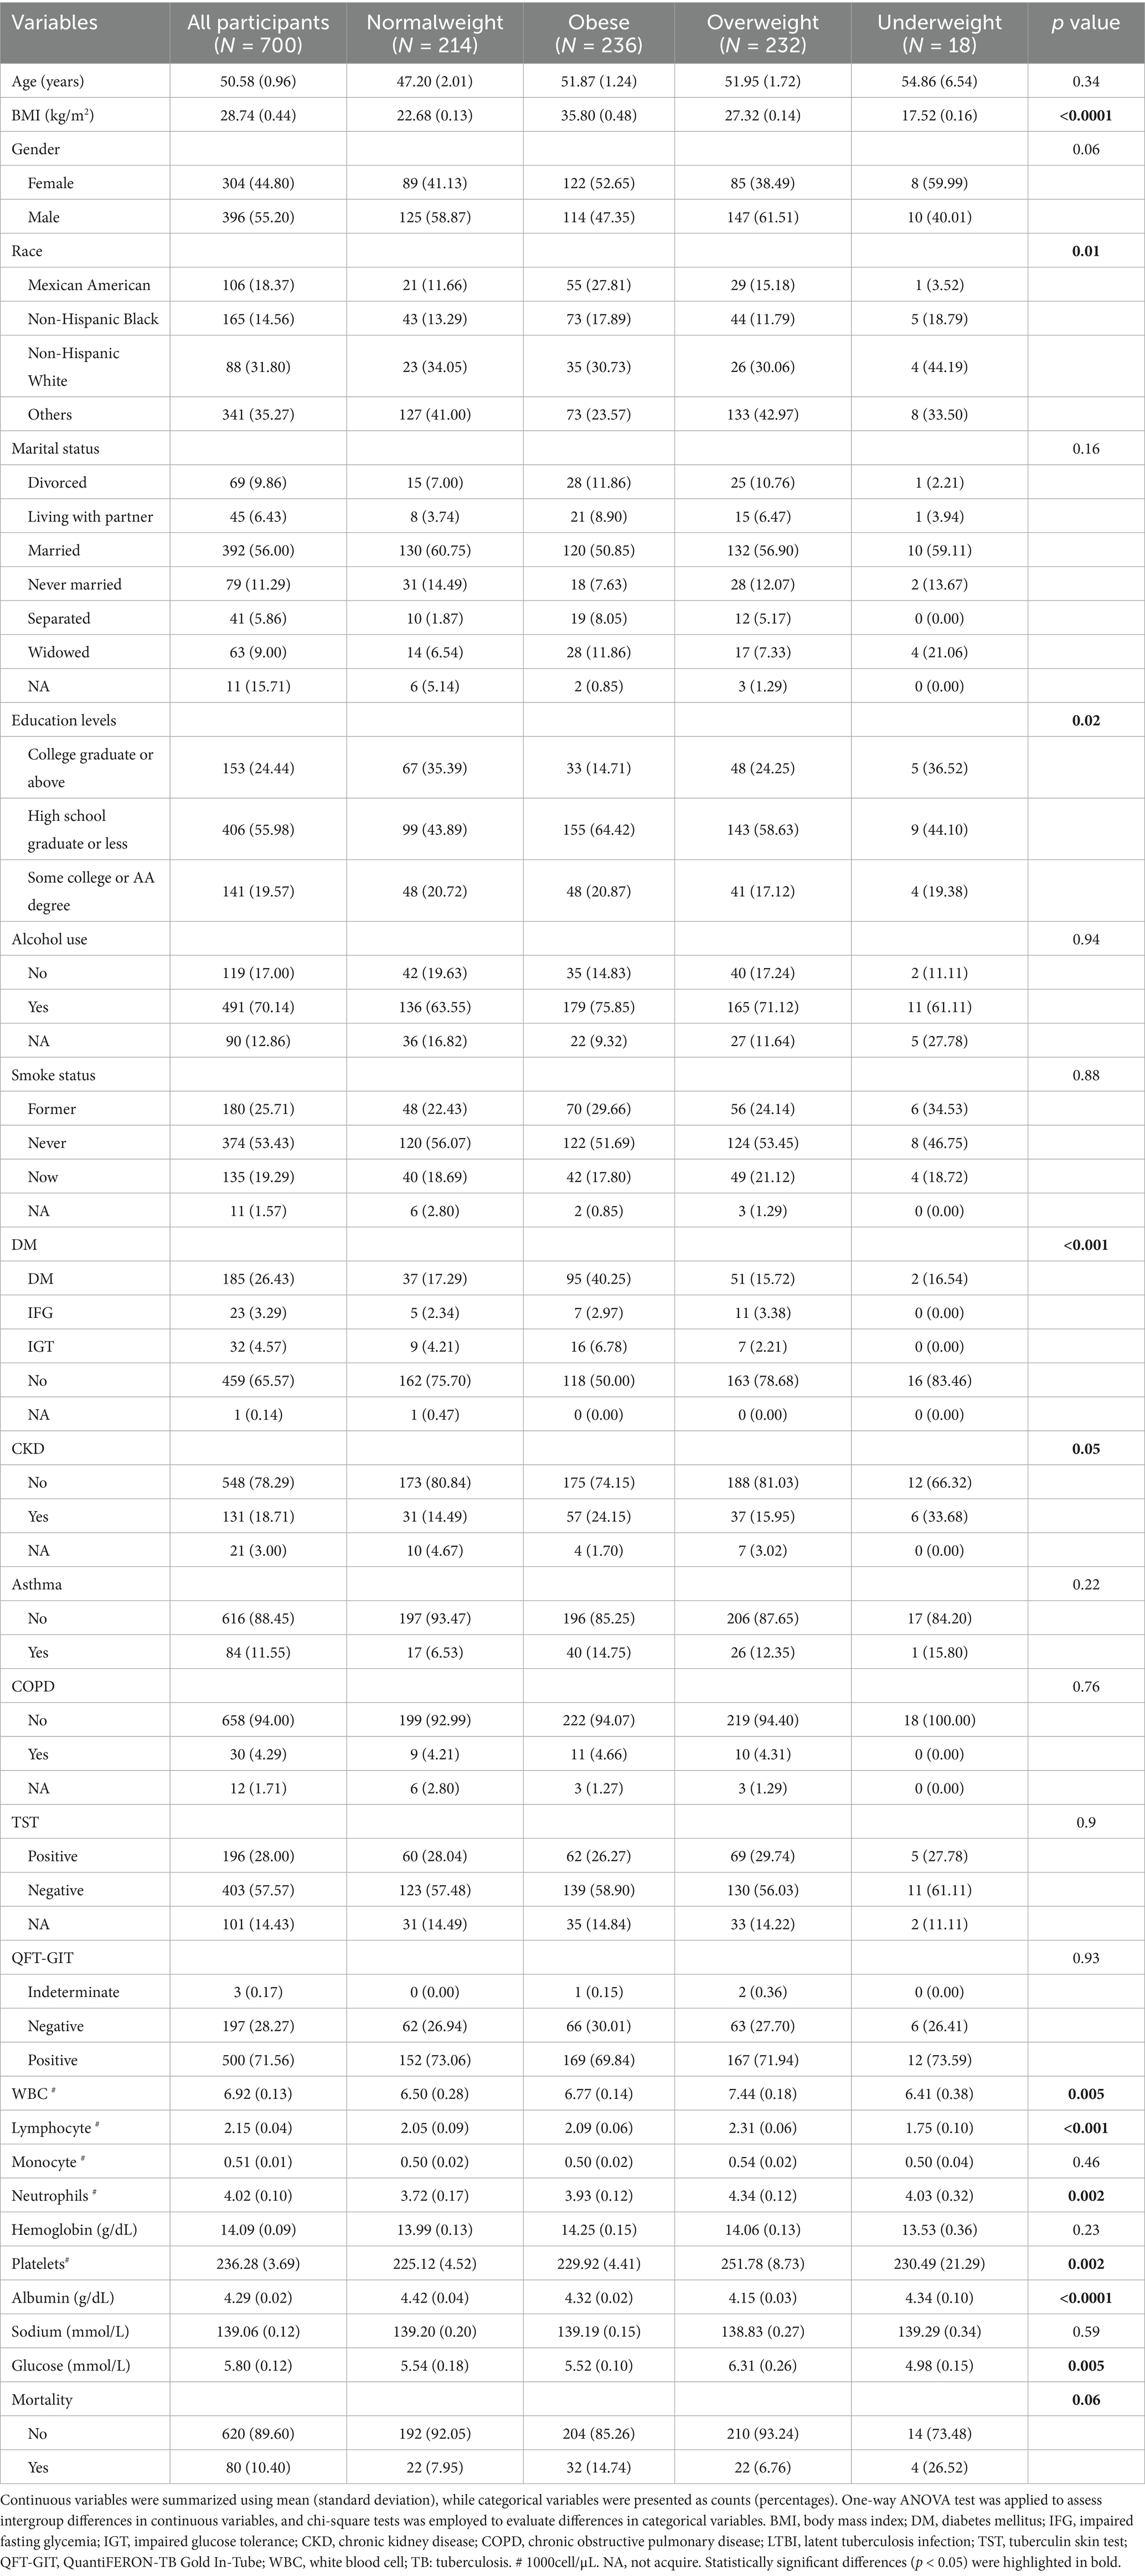
Table 1. Baseline characteristics of LTBI participants stratified by BMI category.
Conversely, no statistically significant differences were observed (all p > 0.05) among different BMI groups regarding age, gender, marital status, alcohol consumption, smoking status, presence of asthma, COPD, mortality rate, monocyte count, and serum sodium levels.
Underweight was associated with increased mortality in LTBI participants
We plotted the Kaplan–Meier survival curves for distinct BMI groups (Figure 2), revealing that the mortality rate did not exhibit statistically significant differences (p = 0.23). Moreover, we conducted an extensive examination of the relationship between different BMI categories and the mortality risk using Cox proportional hazard analysis in four distinct models (Table 2). Our findings indicated an increased mortality risk among underweight participants (HR = 2.77, 95% CI 1.06–7.22, p = 0.04). Conversely, both obese and overweight individuals demonstrated no significant mortality association across both crude and adjusted models (all p > 0.05).
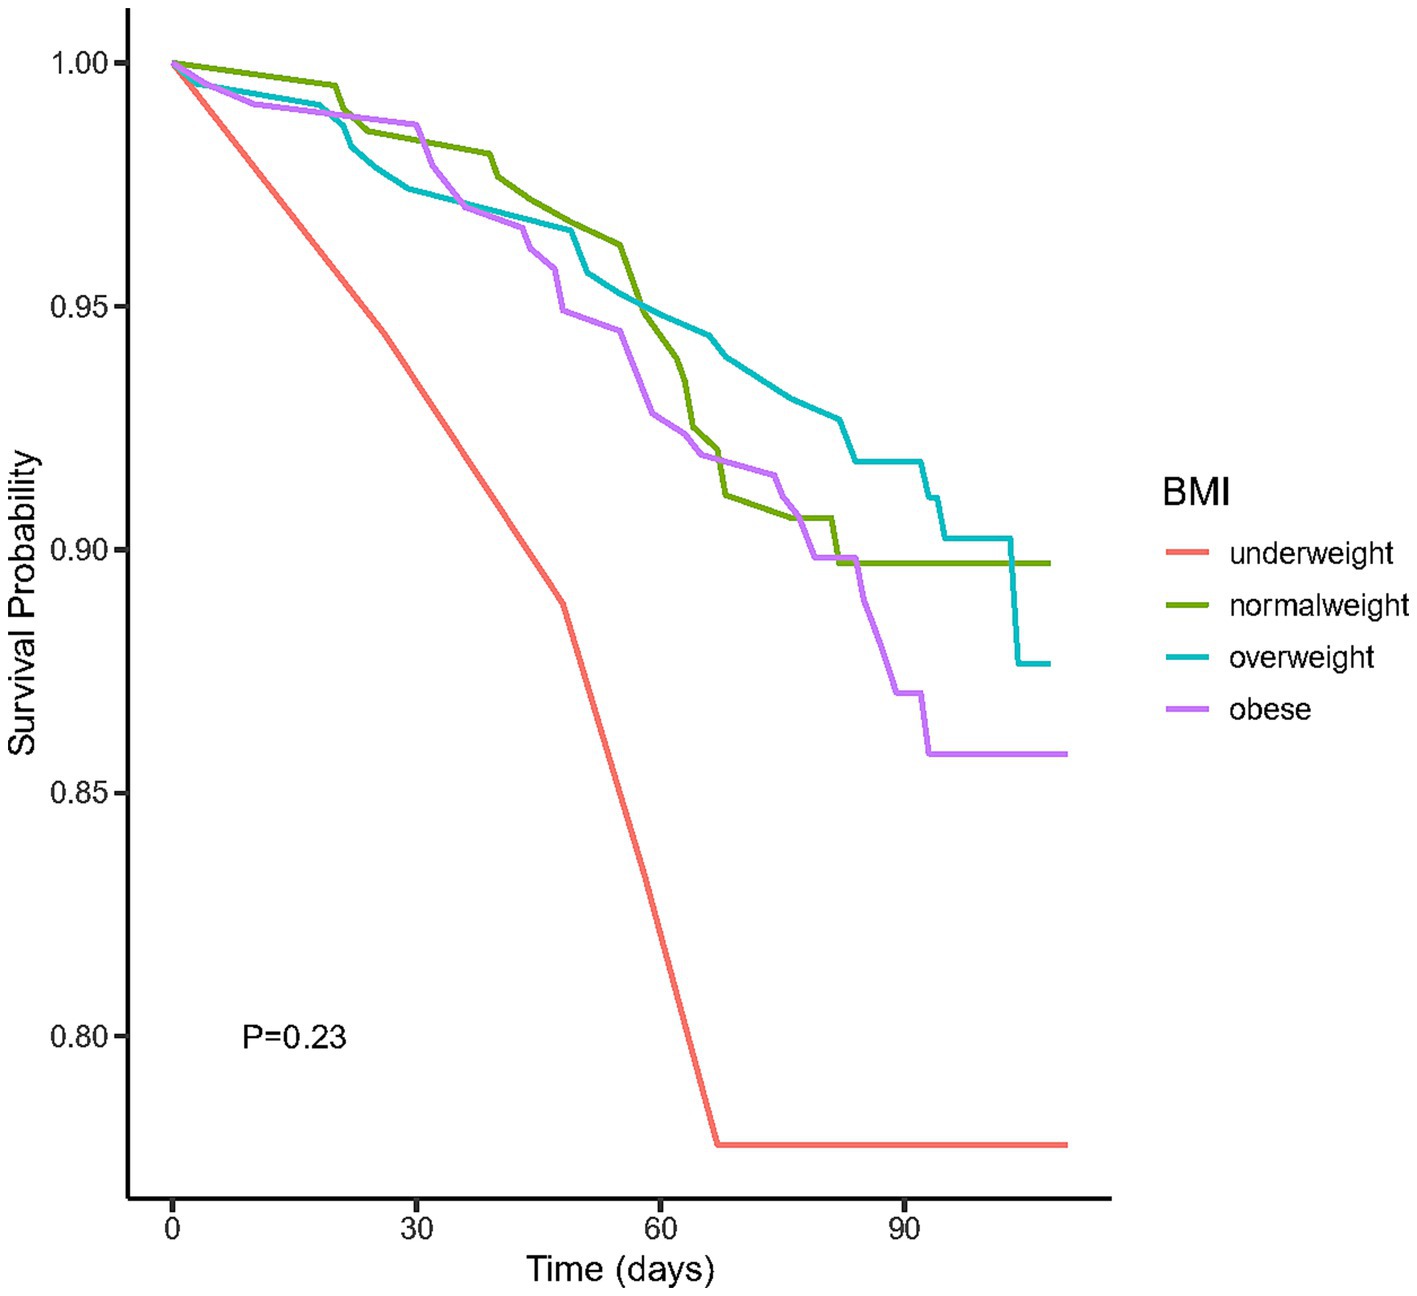
Figure 2. The Kaplan–Meier survival curves for distinct BMI groups.
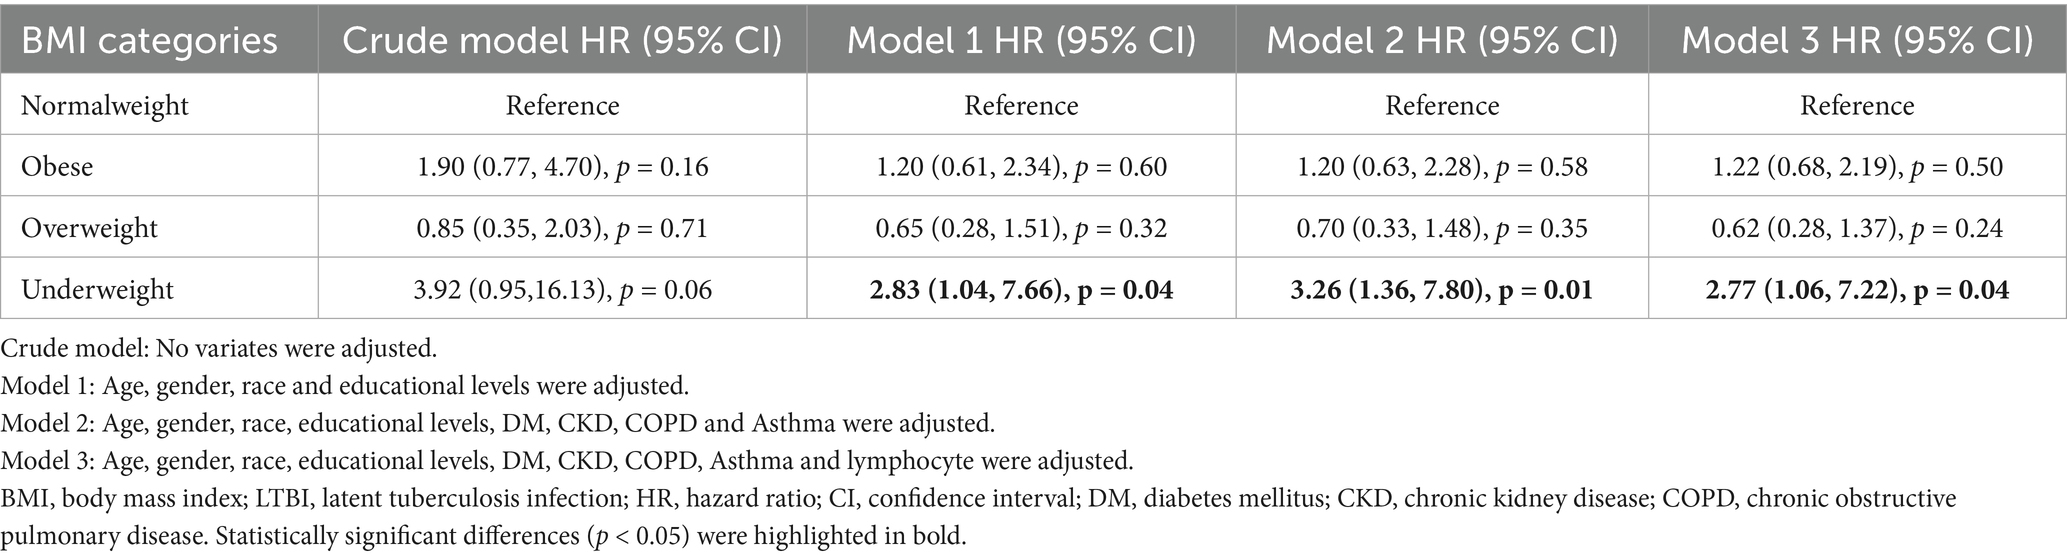
Table 2. Association between BMI categories and all-cause mortality in adults with LTBI.
RCS analysis of the association of BMI and all-cause mortality in LTBI participants
To demonstrate the dose–response relationship between BMI and mortality among individuals with LTBI, we applied multivariable-adjusted RCS regression. As shown in Figure 3, the analysis revealed a U-shaped association between BMI and all-cause mortality (p for nonlinearity = 0.0012), with an inflection point at 27.3 kg/m2.
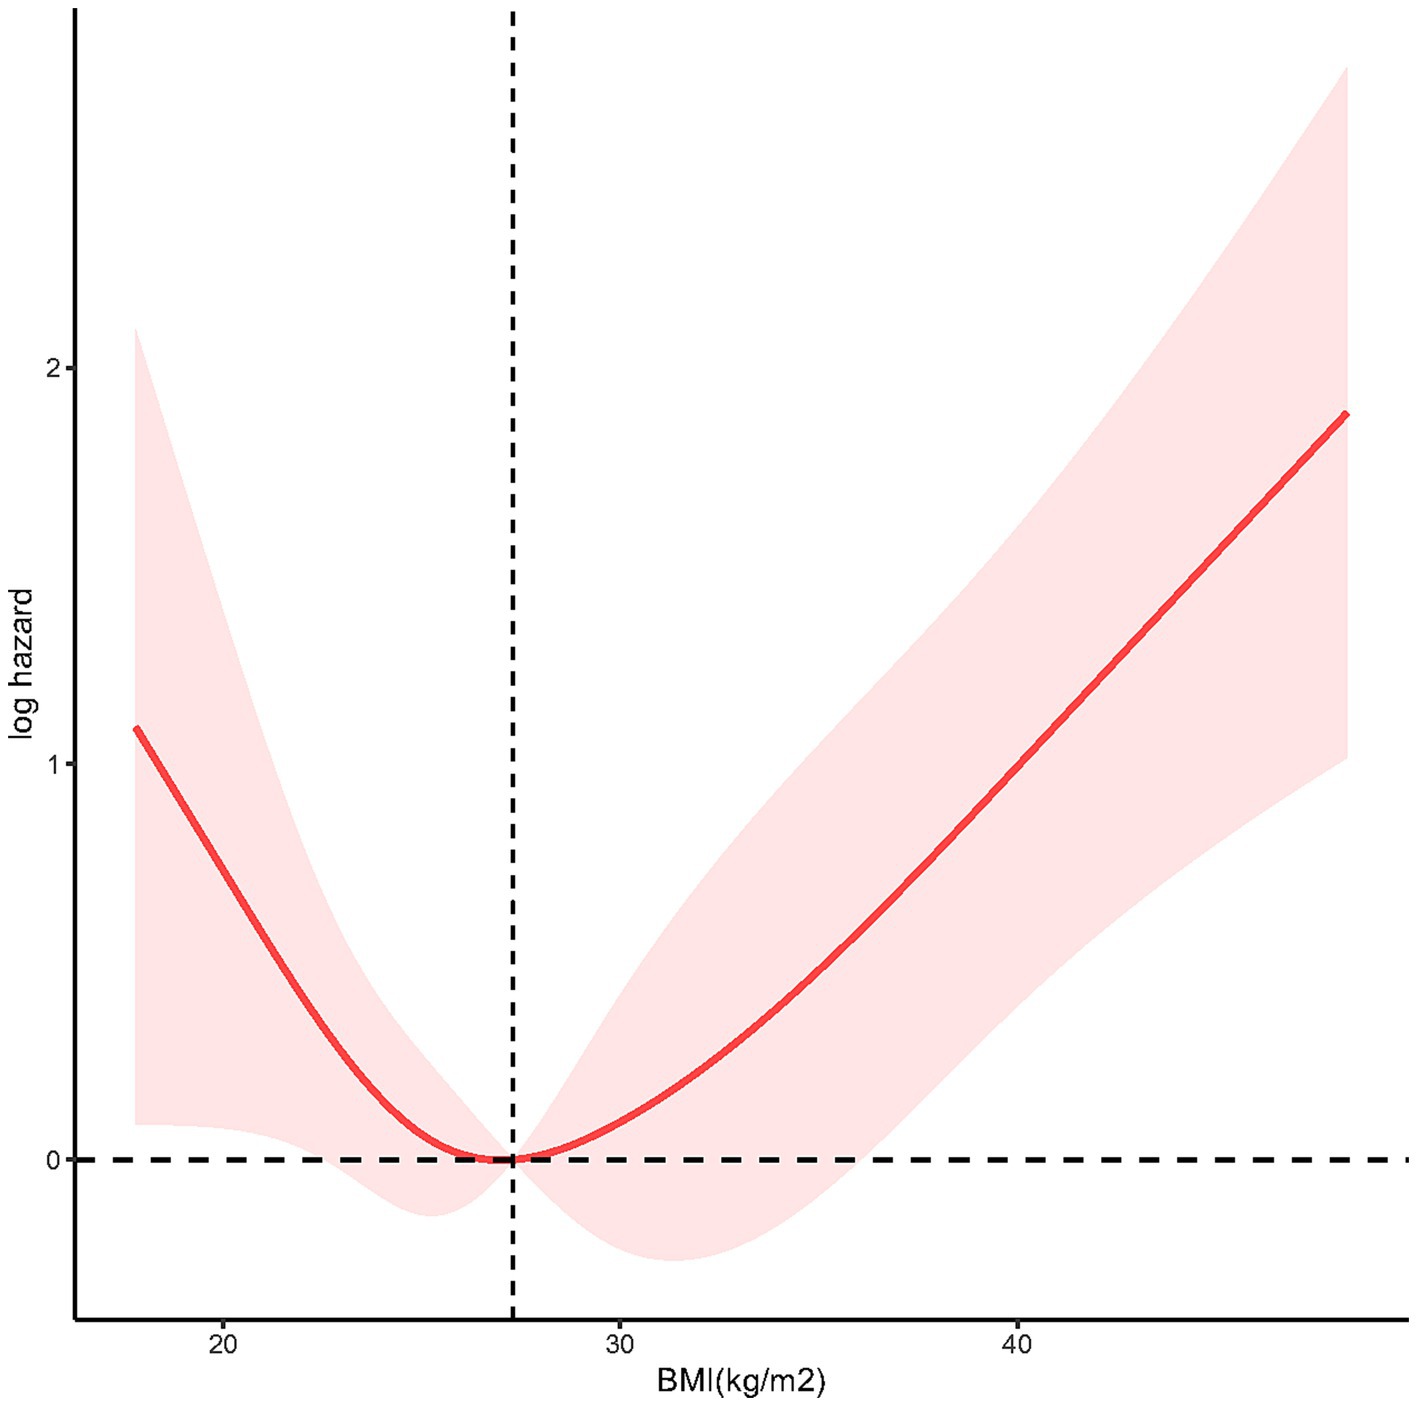
Figure 3. The restricted cubic spline (RCS) analysis between BMI and mortality risk of LTBI (p nonlinear = 0.0012).
Discussion
In this study, we enrolled 700 participants with LTBI for analysis. Our findings revealed that underweight status was associated with increased all-cause mortality among adults with LTBI after adjustment for confounding factors. Conversely, no significant association with all-cause mortality was observed for either obesity or overweight. Moreover, RCS analysis demonstrated a U-shaped relationship between BMI and all-cause mortality.
While limited study has been conducted to assess the relationship between BMI and all-cause mortality among adult individuals with LTBI, our study revealed a critical finding: although baseline mortality rates between underweight and normal-weight LTBI individuals showed no significant difference, after adjusting for key confounders (gender, age, and comorbidities), being underweight was associated with a significantly increased mortality risk. This finding aligns with broader evidence suggesting that underweight status may negatively impact TB-related outcomes. For instance, a large population-based cohort study of over ten million subjects in Korea demonstrated that the incident rate of active TB was 2.08 times higher (95% CI 2.02–2.15) in the underweight population compared to those with normal weight (13), which, although not directly measuring mortality, suggests a pathway linking low BMI to more severe TB manifestations. However, a study involving individuals with DM revealed that underweight was not a significant risk factor for LTBI progression to active TB (OR 1.07, 95% CI 0.78–1.48) (14), highlighting the potential modifying role of comorbidities. Additionally, a multi-center study of drug-sensitive pulmonary TB patients in India found that underweight patients who did not experience BMI increase after treatment initiation were associated with increased unfavorable outcomes (adjusted OR 1.81, 95% CI 1.27–2.61) (9). Our finding that confounding factors masked the underweight-mortality association underscores their critical influence on LTBI outcomes. Studies have shown lower survival rates in LTBI patients with renal insufficiency (15), and the potential underestimation of LTBI prevalence in the elderly due to higher false-negative diagnostic rates (16) further emphasizes the complex interplay of factors affecting this population’s health trajectory. Therefore, our results demonstrate that underweight is an independent risk factor for increased mortality in LTBI patients, but this risk is only evident after accounting for the substantial confounding effects of variables like age, gender, and comorbidities.
Our study revealed a clinically significant U-shaped relationship between BMI and all-cause mortality in LTBI individuals. This underscores nutritional status as a dual-edged sword: malnutrition (low BMI) and over nutrition (high BMI) independently threaten LTBI outcomes. Malnutrition can result from TB itself due to inflammation-related cachexia, anorexia, and malabsorption (17). Additionally, malnutrition can impair resistance to infection. The underlying mechanisms between underweight and poor TB infection outcomes are multifaceted. Firstly, underweight signifies inadequate nutrient intake and malnutrition, which can compromise the immune system by causing various degrees of immunodeficiency, decreased the ability of mobility, chemotaxis, attachment, and macrophage ingestion (18). It can also decrease the production of cytokines that regulate adaptive immunity against mycobacterial tuberculosis infection (19), and elevate the risk of progressing from latent infection to active disease (20). Furthermore, animal models demonstrated that imbalanced dietary nutrients can disrupt intestinal homeostasis, alter gut microbial ecology, and increase susceptibility to infection, leading to intestinal inflammation and diarrhea, further contributing to morbidity and mortality (21). Secondly, underweight individuals may have limited access to healthcare resources (22), including TB testing, diagnosis, and treatment (23), which can delay identification and management of TB infection, subsequently elevating mortality risk. Moreover, underweight individuals often have more comorbid conditions that further compromise their immune function (24, 25), heightening vulnerability to LTBI reactivation and mortality. Additionally, undernutrition reduces quality of life and economic productivity (26). Therefore, underweight individuals, particularly in low-income settings, may encounter challenges in accessing proper nutrition, healthcare, and living conditions, collectively contributing to both underweight and increased mortality risk. Which indicating that proactive nutritional support is essential for underweight LTBI individuals.
Paradoxically, our U-shaped curve inflection point fell within the overweight range, suggesting that obesity may be associated with decreased mortality. This aligns with previous studies. In a large population-based longitudinal study in Korea reported that obesity linked to lower TB mortality (27). Animal models fed a medium-fat diet have shown reduced bacterial burden and increased activation of immune cells (28). Surprisingly, in the cox regression model of our study, we did not find a significant difference in TB infection mortality between individuals with normalweight and those classified as obese. It’s important to note that our study focused on all-cause mortality rather than specific cause mortality, which may be confounded by patients’ underlying conditions. Additionally, other factors beyond weight status might play a more significant role in influencing tuberculosis outcomes.
Our study boasts several strengths. Firstly, it draws upon data from NHANES, a nationally representative population-based sample, ensuring robust sample selection and size. Secondly, we took measures to control for confounding variables, thereby enhancing the reliability of our findings. Nonetheless, our study is not without limitations. Despite our adjustments for potential covariates, we cannot completely eliminate the possibility of confounding, such as the proportions of participants progressing from latent to active TB and macronutrient supplementation. Moreover, malnutrition (29) or high BMI (30) may influence QFT-GIT test results, leading to the possible exclusion of participants with false-negative results thus some participants with false negative QFT-GIT results. Due to constraints within the mortality data, our analysis focused on all-cause mortality. Future studies should investigate TB-related mortality specifically when more data becomes available. Besides, the relatively small sample size in the underweight group reduces statistical power, increases the susceptibility of the point estimate (HR) to instability from individual cases, widens CI and limit subgroup analysis, future research must prioritize enrolling sufficient numbers of underweight individuals with LTBI to confirm this finding. Furthermore, the NHANES database exclusively represents the US population, limiting the generalizability of our results to a global context.
Conclusion
Our findings revealed that underweight was associated with increased mortality in adults with TB infection after adjusting confounding factors, whereas no significant mortality association was observed in either obese or overweight individuals. Moreover, the utilization of RCS analysis unveiled a U-shaped correlation between BMI and all-cause mortality.
Data availability statement
The datasets presented in this study can be found in online repositories. The names of the repository/repositories and accession number(s) can be found at: https://www.cdc.gov/nchs/nhanes/?CDC_AAref_Val=https://www.cdc.gov/nchs/nhanes/index.htm.
Ethics statement
The studies involving humans were approved by NCHS Research Ethics Review Board. The studies were conducted in accordance with the local legislation and institutional requirements. The participants provided their written informed consent to participate in this study.
Author contributions
J-ZL: Writing – original draft, Software, Visualization, Conceptualization, Formal analysis, Methodology. XL: Writing – review & editing, Investigation, Project administration, Conceptualization, Supervision. MQ: Formal analysis, Writing – original draft, Conceptualization.
Funding
The author(s) declare that no financial support was received for the research and/or publication of this article.
Acknowledgments
We gratefully acknowledge Jinfeng Shi (Sichuan International Studies University) for her professional editing of the manuscript, which significantly improved its clarity and flow.
Conflict of interest
The authors declare that the research was conducted in the absence of any commercial or financial relationships that could be construed as a potential conflict of interest.
Generative AI statement
The authors declare that no Gen AI was used in the creation of this manuscript.
Publisher’s note
All claims expressed in this article are solely those of the authors and do not necessarily represent those of their affiliated organizations, or those of the publisher, the editors and the reviewers. Any product that may be evaluated in this article, or claim that may be made by its manufacturer, is not guaranteed or endorsed by the publisher.
Footnotes
References
1. World Health organization. Global tuberculosis report 2022. Geneva: World Health organization (2022).
2. Pai, M, Behr, MA, Dowdy, D, Dheda, K, Divangahi, M, Boehme, CC, et al. Tuberculosis. Nat Rev Dis Primers. (2016) 2:16076. doi: 10.1038/nrdp.2016.76
3. Bhargava, A, Bhargava, M, Meher, A, Teja, GS, Velayutham, B, Watson, B, et al. Nutritional support for adult patients with microbiologically confirmed pulmonary tuberculosis: outcomes in a programmatic cohort nested within the RATIONS trial in Jharkhand, India. Lancet Glob Health. (2023) 11:e1402–11. doi: 10.1016/s2214-109x(23)00324-8
4. Adamashvili, N, Baliashvili, D, Kuchukhidze, G, Salindri, AD, Kempker, RR, Blumberg, HM, et al. Low BMI increases all-cause mortality rates in patients with drug-resistant TB. Int J Tuberc Lung Dis. (2022) 26:326–33. doi: 10.5588/ijtld.21.0450
5. Pipitò, L, Colomba, C, Mancuso, A, Catania, B, Cuccia, A, Sergio, M, et al. Hospitalizations for tuberculosis in Sicily over the years 2009-2021: clinical features, comorbidities, and predictors of mortality. J Infect Public Health. (2023) 16:1518–24. doi: 10.1016/j.jiph.2023.06.015
6. Lee, EH, Lee, JA, Ahn, JY, Jeong, SJ, Ku, NS, Choi, JY, et al. Association of body mass index and bloodstream infections in patients on extracorporeal membrane oxygenation: a single-Centre retrospective cohort study. J Hosp Infect. (2023) 140:117–23. doi: 10.1016/j.jhin.2023.08.005
7. Kwan, ML, Valice, E, Ergas, IJ, Roh, JM, Caan, BJ, Cespedes Feliciano, EM, et al. Alcohol consumption and prognosis and survival in breast cancer survivors: the pathways study. Cancer. (2023) 129:3938–51. doi: 10.1002/cncr.34972
8. Bhaskaran, K, Dos-Santos-Silva, I, Leon, DA, Douglas, IJ, and Smeeth, L. Association of BMI with overall and cause-specific mortality: a population-based cohort study of 3.6 million adults in the UK. Lancet Diabetes Endocrinol. (2018) 6:944–53. doi: 10.1016/S2213-8587(18)30288-2
9. Sinha, P, Ponnuraja, C, Gupte, N, Prakash Babu, S, Cox, SR, Sarkar, S, et al. Impact of undernutrition on tuberculosis treatment outcomes in India: a multicenter, prospective, cohort analysis. Clin Infect Dis. (2023) 76:1483–91. doi: 10.1093/cid/ciac915
10. Li, D, Tang, SY, Lei, S, Xie, HB, and Li, LQ. A nomogram for predicting mortality of patients initially diagnosed with primary pulmonary tuberculosis in Hunan province, China: a retrospective study. Front Cell Infect Microbiol. (2023) 13:1179369. doi: 10.3389/fcimb.2023.1179369
11. Badawi, A, and Liu, CJ. Obesity and prevalence of latent tuberculosis: a population-based survey. Infect Dis (Auckl). (2021) 14:1178633721994607. doi: 10.1177/1178633721994607
12. Jung, HN, Kim, S, Jung, CH, and Cho, YK. Association between body mass index and mortality in type 1 diabetes mellitus: a systematic review and Meta-analysis. J Obes Metab Syndr. (2023) 32:151–62. doi: 10.7570/jomes22061
13. Cho, SH, Lee, H, Kwon, H, Shin, DW, Joh, HK, Han, K, et al. Association of underweight status with the risk of tuberculosis: a nationwide population-based cohort study. Sci Rep. (2022) 12:16207. doi: 10.1038/s41598-022-20550-8
14. Munisankar, S, Rajamanickam, A, Balasubramanian, S, Muthusamy, S, Menon, PA, Ahamed, SF, et al. Prevalence of proximate risk factors of active tuberculosis in latent tuberculosis infection: a cross-sectional study from South India. Front Public Health. (2022) 10:1011388. doi: 10.3389/fpubh.2022.1011388
15. Aso, M, Kohatsu, K, Takayama, S, Matsuda, T, Kojima, S, Shibagaki, Y, et al. Prognosisof patients diagnosed with latent tuberculosis infection at dialysis initiation. Clin ExpNephrol. (2025) 4. doi: 10.1007/s10157-025-02667-y
16. Nguyen, DT, Teeter, LD, Graves, J, and Graviss, EA. Characteristics associated with negative interferon-γ release assay results in culture-confirmed tuberculosis patients, Texas, USA, 2013–2015. Emerg Infect Dis. (2018) 24:534–40. doi: 10.3201/eid2403.171633
17. Scrimshaw, NS, and SanGiovanni, JP. Synergism of nutrition, infection, and immunity: an overview. Am J Clin Nutr. (1997) 66:464s–77s. doi: 10.1093/ajcn/66.2.464S
18. de la Fuente, M, and Muñoz, ML. Impairment of phagocytic process in macrophages from young and old mice by protein malnutrition. Ann Nutr Metab. (1992) 36:41–7. doi: 10.1159/000177697
19. Sinha, P, Davis, J, Saag, L, Wanke, C, Salgame, P, Mesick, J, et al. Undernutrition and tuberculosis: public health implications. J Infect Dis. (2019) 219:1356–63. doi: 10.1093/infdis/jiy675
20. Savino, W, Duraes, J, Maldonado-Galdeano, C, Perdigon, G, Mendes-da-Cruz, DA, and Cuervo, P. Thymus, undernutrition, and infection: approaching cellular and molecular interactions. Front Nutr. (2022) 9:948488. doi: 10.3389/fnut.2022.948488
21. Hashimoto, T, Perlot, T, Rehman, A, Trichereau, J, Ishiguro, H, Paolino, M, et al. ACE2 links amino acid malnutrition to microbial ecology and intestinal inflammation. Nature. (2012) 487:477–81. doi: 10.1038/nature11228
22. Russell, EA, Daza Atehortua, C, Attia, SL, Genisca, AE, Palomino Rodriguez, A, Headrick, A, et al. Childhood malnutrition within the indigenous Wayuú children of northern Colombia. Glob Public Health. (2020) 15:905–17. doi: 10.1080/17441692.2020.1712448
23. Rytter, MJ, Kolte, L, Briend, A, Friis, H, and Christensen, VB. The immune system in children with malnutrition--a systematic review. PLoS One. (2014) 9:e105017. doi: 10.1371/journal.pone.0105017
24. Khlevner, J, Naranjo, K, Hoyer, C, Carullo, AS, Kerr, KW, and Marriage, B. Healthcare burden associated with malnutrition diagnoses in hospitalized children with critical illnesses. Nutrients. (2023) 15:3011. doi: 10.3390/nu15133011
25. Cederholm, T, Barazzoni, R, Austin, P, Ballmer, P, Biolo, G, Bischoff, SC, et al. ESPEN guidelines on definitions and terminology of clinical nutrition. Clin Nutr. (2017) 36:49–64. doi: 10.1016/j.clnu.2016.09.004
26. Sinha, P, Lakshminarayanan, SL, Cintron, C, Narasimhan, PB, Locks, LM, Kulatilaka, N, et al. Nutritional supplementation would be cost-effective for reducing tuberculosis incidence and mortality in India: the ration optimization to impede tuberculosis (ROTI-TB) model. Clin Infect Dis. (2022) 75:577–85. doi: 10.1093/cid/ciab1033
27. Choi, H, Han, K, Jung, JH, Park, SH, Kim, SH, Kang, HK, et al. Long-term mortality of tuberculosis survivors in Korea: a population-based longitudinal study. Clin Infect Dis. (2023) 76:e973–81. doi: 10.1093/cid/ciac411
28. Oswal, N, Thangavel, H, Lizardo, K, Dhanyalayam, D, Sidrat, T, Salgame, P, et al. Diets differently regulate pulmonary pathogenesis and immune signaling in mice during acute and chronic Mycobacterium tuberculosis infection. Life (Basel). (2023) 13:228. doi: 10.3390/life13010228
29. Hang, NT, Lien, LT, Kobayashi, N, Shimbo, T, Sakurada, S, Thuong, PH, et al. Analysis of factors lowering sensitivity of interferon-gamma release assay for tuberculosis. PLoS One. (2011) 6:e23806. doi: 10.1371/journal.pone.0023806
Keywords: BMI, underweight, latent tuberculosis infection, mortality, RCS
Citation: Liao J-Z, Liu X and Qi M (2025) Underweight was associated with increased mortality in adults with latent tuberculosis infection. Front. Nutr. 12:1607507. doi: 10.3389/fnut.2025.1607507
Edited by:
Vali Musazadeh, Iran University of Medical Sciences, IranReviewed by:
Seyed Mojtaba Ghoreishy, Tehran University of Medical Sciences, IranPedram Pam, Tabriz University of Medical Sciences, Iran
Copyright © 2025 Liao, Liu and Qi. This is an open-access article distributed under the terms of the Creative Commons Attribution License (CC BY). The use, distribution or reproduction in other forums is permitted, provided the original author(s) and the copyright owner(s) are credited and that the original publication in this journal is cited, in accordance with accepted academic practice. No use, distribution or reproduction is permitted which does not comply with these terms.
*Correspondence: Min Qi, MTU2MDg5MjUwQHFxLmNvbQ==