Abstract
Aim:
Evaluating the nutritional status of children with cerebral palsy (CP) is difficult due to spasticity and contractures. Mid-upper arm circumference (MUAC) is a potential screening tool for malnutrition in children with CP, but its effectiveness is unproven. This study aims to provide evidence on the psychometric qualities of MUAC for clinical use and establish optimal cutoffs for preschoolers with CP.
Methods:
Children with CP aged 12–60 months (n = 937) were recruited from 24 hospitals across 13 provinces in China for the cross-sectional study, while those had genetic or metabolic diseases were excluded. Weight, length/height and MUAC were obtained from participants. Weight and length/height were calculated into Z scores by using WHO Anthro software to assess the nutritional status. The sensitivity and specificity of the WHO-recommended MUAC cutoffs were calculated. The Spearman’s rank correlation, Receiver operating characteristic (ROC) curve, and Youden Index were conducted to establish the optimal MUAC cutoffs for preschoolers with CP.
Results:
Compared to Z score cutoffs, WHO-recommended MUAC cutoffs showed high specificity but low sensitivity for malnutrition. MUAC significantly correlated with weight-for-length/height Z score (r = 0.606), weight-for-age Z score (r = 0.557), length/height-for-age Z score (r = 0.276), and BMI-for-age Z score (r = 0.575). The optimal MUAC cutoffs for mild, moderate, and severe undernutrition were 15.35, 15.05, and 14.35 cm, respectively; the optimal cutoffs for overweight and obesity were 17.55 and 20.4 cm, respectively.
Conclusion:
Our study suggests that MUAC is a useful tool for screening the nutritional status of children with CP. However, the WHO-recommended MUAC cut-off may not be suitable for preschool with CP. We estimated that the optimal MUAC cutoffs were 15.35 cm for mild undernutrition, 15.05 cm for moderate undernutrition, and 14.35 cm for severe undernutrition, and 17.55 cm for overweight and 20.4 cm for obesity in preschool with CP.
Clinical trial registration:
www.chictr.org.cn, ChiCTR2000033869.
Introduction
Cerebral palsy (CP), with a prevalence of 2–3.5‰, affects about 50 million people worldwide (1, 2). Malnutrition has been recognized as a common and detrimental condition associated with CP. 57.6–80% of children with CP suffer from malnutrition for various reasons, such as feeding and swallowing difficulties, abnormal muscle tone, and gastrointestinal problems (3–6). Malnutrition affects children’s overall health, growth, and participation in educational and social activities (7). There is a growing emphasis on nutrition screening and assessment as they facilitate early recognition and management of malnutrition in CP children (8).
Anthropometric measurements are widely used to assess patients’ nutritional status and health. However, it is difficult to collect core anthropometric data, especially weight and height, from children with CP in a busy clinic due to their compromised motor ability and abnormal position (9). Mid-upper arm circumference (MUAC) is an independent and easily obtained measure of the upper arm’s subcutaneous fat, muscle, and bone. Recent studies have shown that MUAC is a reliable tool for indirectly assessing growth and changes in caloric and protein intake in children, pregnant women, and the elderly (10–12). The World Health Organization (WHO) recommends MUAC as a diagnostic tool for severe acute malnutrition in typically developing children. However, the current MUAC cutoffs proposed by WHO only identify those in moderate (between 11.5 and 12.5 cm) or severe (less than 11.5 cm) undernutrition (13, 14). Although some studies have used MUAC as a proxy to assess the nutritional status and other clinical characteristics of children with CP, few have used it for nutrition screening (15–17). Furthermore, to our knowledge, specific MUAC cutoffs to screen for malnutrition in children with CP have not been reported (18).
Recently, MUAC was found to be currently detecting overweight children though the cutoffs in different countries were established inconsistently (19). MUAC, combined with age and the Gross Motor Function Classification System (GMFCS) level, can estimate body weight in children with CP (20). As children with CP were reported to present altered body composition (21, 22), which may affect their nutritional status, it is crucial to establish the optimal MUAC cutoffs for nutrition screening.
Therefore, this study aims to identify the optimal MUAC cutoff values for predicting malnutrition (undernutrition and overnutrition) in outpatient preschoolers with CP aged 12–60 months.
Materials and methods
Study design and participants
This study is part of a multicenter cross-sectional study (ChiCTR2000033869) which was conducted to investigate the nutritional characteristics of children with CP in China (6). The enrolled participants were from 24 hospitals across 13 provinces in China. Children aged 12–60 months with a diagnosis of CP and not offered standardized nutritional intervention previously were included in this study at their first outpatient visits from July 2020 to December 2021. Those who had genetic or metabolic diseases were excluded. And the GMFCS level, the Eating and Drinking Ability Classification System (EDACS) or Mini-EDACS level were determined by experienced clinicians who received standard training.
This study was approved by the Ethics Committee of Guangzhou Women and Children’s Medical Center (GWCMC) (approval number: 2020–29602) and registered at Chinese Clinical Trial Registry (registration number: ChiCTR2000033869).
Data collection
GMFCS level
The GMFCS is a system that classifies gross motor function into five levels for people with CP (23, 24). The criteria for each level are based on age and were created with the expectation that children would remain at the same GMFCS level throughout their childhood and adolescence. Level I: Walks without limitations but experiences limitations in performing complex and skillful motor activities. Level II: Can walk without assistive devices but has limitations in outdoor and community settings. Level III: Requires assistive devices for walking and has limitations in walking outdoors and in the community. Level IV: Cannot move independently, relies on others for transportation, or uses powered devices for mobility in outdoor and community environments. Level V: Dependent on assistive technologies like wheelchairs, with severely restricted self-mobility.
EDACS/mini-EDACS level
EDACS is a system that classifies the eating functions of individuals with CP into five levels, with each level determined based on the eating efficiency and safety (25, 26). Level I: Eats and drinks safely and efficiently. Level II: Eats and drinks safely, though with some limitations in efficiency. Level III: Eats and drinks with some safety concerns; efficiency may also be limited. Level IV: Eats and drinks with major safety concerns. Level V: Unable to eat or drink safely; tube feeding may be considered for nutrition.
Anthropometric measurements
Anthropometric information including weight, length/height, and MUAC was obtained by two trained researchers following standard operating procedures to ensure consistency and accuracy (27). Weight was measured to the nearest 0.1 kg using a digital weight scale. Length/height and MUAC were measured to the nearest 0.1 cm with an anthropometer and anthropometric tape. Recumbent length was measured for participants under 24 months, while standing height was measured for those between 24 and 60 months. Estimated height was calculated using Stevenson’s equation [height (cm) = (tibial length × 3.26) + 30.8] (28) in situations where participants could not stand straight because of joint contractures or deformities. All participants were asked to remove heavy cloths and shoes prior to the measurement.
Classification of nutritional status
Nutritional status was classified by the weight-for-length/height Z score (WLZ/WHZ), weight-for-age Z score (WAZ), length/height-for-age Z score (LAZ/HAZ), and BMI-for-age Z score (BAZ). The z scores were calculated using WHO Anthro software (version 3.2.2). Malnutrition mentioned in this study includes undernutrition (underweight, stunting and wasting) and overnutrition (overweight and obesity) (29). According to WHO growth charts as well as the American Society for Parenteral and Enteral Nutrition (ASPEN) standards (13, 14, 30), mild wasting was defined as −2 < WLZ/WHZ/BAZ ≤ −1, moderate wasting was defined as −3 < WLZ/WHZ/BAZ ≤ −2, severe wasting was defined as WLZ/WHZ/BAZ ≤ −3; moderate stunting was defined as −3 < LAZ/HAZ ≤ −2, severe stunting was defined as LAZ/HAZ ≤ −3; moderate underweight was defined as −3 < WAZ ≤ −2, severe underweight was defined as WAZ ≤ −3; overweight was defined as 2<WLZ/WHZ//BAZ ≤ 3, whereas obesity was defined as WLZ/WHZ/BAZ > 3. Considering that a child may have multiple types of malnutrition categories, we used the most severe malnutrition level among the four Z Scores as the overall nutritional status. When there is a discrepancy between HAZ/LAZ and WHZ/WLZ or BAZ, we used the results from WHZ/WLZ or BAZ.
Statistical analysis
Quantitative variables were presented as mean (standard deviations, SD) or median [interquartile ranges (IQR)], and categorical variables were presented as numbers or percentages. The sensitivity and specificity were calculated to investigate the diagnostic value of the MUAC cutoffs proposed by WHO. Kolmogorov–Smirnov test was used to assess the normality of the data. Spearman’s rank correlations were chosen to measure the direction and strength of the linear relationships between MUAC and four Z scores separately because the data of MUAC, WHZ, LAZ and BAZ did not follow a normal distribution. ROC curves and the area under the curve (AUC) were conducted to assess the sensitivity and specificity of MUAC cutoffs for different types and severities of malnutrition. The Youden Index was used to determine the optimal cutoff values for malnutrition. As selecting the MUAC cutoff with the highest sensitive would lead to a higher number of false positives, it is important to balance sensitivity with specificity by limiting false-positive rate to be below 33.33%. To assess the robustness of the optimal MUAC cutoffs, we performed a bootstrap resampling analysis with 1,000 iterations by using R software (version 4.5.1; R Foundation for Statistical Computing, Vienna, Austria). To evaluate whether the optimal MUAC cutoffs that we determined have the same predictive value for preschool children with CP of different severities, we additionally calculated the sensitivity and specificity of the optimal MUAC cutoff values among different GMFCS levels. All statistical analyses, except for the bootstrap resampling (1,000 iterations) analysis, were performed by using SPSS software (IBM SPSS Statistics for Windows, version 25.0; IBM Corp., Armonk, NY, United States).
Results
A total of 937 children (606 boys and 331 girls) were included in the data analysis. The age of the sample population ranged from 12 to 60 months. The most common type of CP was spastic CP (85.17%). 52.51% of children were in GMFCS levels I and II and more than half were in the EDACS or Mini-EDACS level I. Nearly half of the children were born prematurely or had low birth weight. Sample characterization was showed in Table 1. Additionally, the height of 55 subjects was determined using estimation formulas. Table 2 showed that 53.68% participants were classified as malnourished, with the majority being categorized as undernourished (50.69%).
Table 1
| Characteristics | Values, n (%) or Mean ± SD |
|---|---|
| Age (m), mean ± SD | 32.5 ± 13.63 |
| Sex, n (%) | |
| Male | 606(64.67) |
| Female | 331(35.33) |
| Gestational age | |
| <37 weeks | 426(45.46) |
| ≥37 weeks | 511(54.54) |
| Birth weight | |
| <2.5 kg | 413(44.08) |
| ≥2.5 kg | 524(55.92) |
| Primary motor type, n (%) | |
| Spastic | 798(85.17) |
| Dyskinesia | 81(8.64) |
| Ataxia | 12(1.28) |
| Mixed | 46(4.91) |
| GMFCS levels, n (%) | |
| I | 287(30.63) |
| II | 205(21.88) |
| III | 172(18.36) |
| IV | 155(16.54) |
| V | 118(12.59) |
| EDACS/Mini-EDACS levels, n (%) | |
| I | 554(59.12) |
| II | 212(22.62) |
| III | 123(13.13) |
| IV | 38(4.06) |
| V | 10(1.07) |
The characteristics of the participants (n = 937).
Numbers are represented as n (%) or mean ± SD.
Table 2
| Nutritional status | n (%) | ||
|---|---|---|---|
| Mild | Moderate | Severe | |
| Undernutrition | 153(16.33) | 211(22.52) | 111(11.85) |
| Wasting (WLZ/WHZ) | 247(26.36) | 86(9.18) | 38(4.05) |
| Underweight (WAZ) | / | 146(15.58) | 70(7.47) |
| Stunning (LAZ/HAZ) | / | 165(17.61) | 88(9.39) |
| Wasting (BAZ) | 217(23.16) | 74(7.90) | 30(3.20) |
| Overweight | 14(1.49) | ||
| Obesity | 14(1.49) | ||
| Normal | 434(46.32) | ||
The characteristics of the nutritional status (n = 937).
Data are presented as n or percentage. WLZ, weight-for-length Z score; WHZ, weight-for-height Z score; WAZ, weight-for-age Z score; LAZ, length-for-age Z score; HAZ, height-for-age Z score; BAZ, BMI-for-age Z score.
The validity of WHO-recommended MUAC cutoffs
According to WHO’s guidelines, in children aged 6–59 months whose MUAC was between 11.5 and 12.5 cm were classified as moderate undernutrition, and those under 11.5 cm were classified as severe undernutrition. The prevalence of different nutritional statuses among CP children aged 12–60 months was classified by Z scores and MUAC, as shown in Table 3. Notably, WHO-recommended MUAC cutoffs categorized fewer children as undernutrition compared to Z scores. WHO-recommended MUAC cutoffs categorized 37 (3.95%) children as undernutrition, while WLZ/WHZ, WAZ, LAZ/HAZ, and BAZ categorized 371 (39.59%), 216 (23.05%), 253 (27%), and 321 (34.26%) children as undernutrition, respectively.
Table 3
| Variables | MUAC ≤ 11.5 cm | MUAC 11.5–12.5 cm | MUAC > 12.5 cm |
|---|---|---|---|
| WLZ/WHZ, n (%) | |||
| Severe wasting | 1(0.11) | 7(0.75) | 30(3.2) |
| Moderate wasting | 2(0.21) | 10(1.07) | 74(7.9) |
| Mild wasting | 1(0.11) | 5(0.53) | 241(25.72) |
| Normal | 2(0.21) | 5(0.53) | 535(57.1) |
| Overweight | 0 | 2(0.21) | 13(1.39) |
| Obesity | 0 | 2(0.21) | 7(0.75) |
| WAZ, n (%) | |||
| Severe underweight | 4(0.43) | 13(1.39) | 53(5.66) |
| Moderate underweight | 2(0.21) | 7(0.75) | 137(14.62) |
| Normal | 0 | 11(1.17) | 710(75.77) |
| LAZ/HAZ, n (%) | |||
| Severe stunning | 5(0.53) | 14(1.49) | 69(7.36) |
| Moderate stunning | 1(0.11) | 6(0.64) | 158(16.86) |
| Normal | 0 | 11(1.17) | 673(71.82) |
| BAZ, n (%) | |||
| Severe wasting | 0 | 8(0.85) | 22(2.35) |
| Moderate wasting | 1(0.11) | 6(0.64) | 67(7.15) |
| Mild wasting | 2(0.21) | 6(0.64) | 209(22.31) |
| Normal | 3 | 7(0.75) | 579(61.79) |
| Overweight | 0 | 1(0.11) | 12(1.28) |
| Obesity | 0 | 3(0.32) | 11(1.17) |
Prevalence of malnutrition identified by WHO-recommended MUAC cutoffs in children with CP (n = 937).
Data are presented as n or percentage. MUAC, Mid-Upper Arm circumference; WLZ, weight-for-length Z score; WHZ, weight-for-height Z score; WAZ, weight-for-age Z score; LAZ, length-for-age Z score; HAZ, height-for-age Z score; BAZ, BMI-for-age Z score.
The currently used MUAC cutoffs recommended by WHO showed high specificity but low sensitivity compared to the Z score cutoffs. Positive predictive values (PPVs) of the MUAC cutoffs ranged from 0 to 83.33%, while negative predictive values (NPVs) maintained at a relatively higher level, ranging from 74.78–96.78% (Table 4).
Table 4
| Variables | Sensitivity, % | Specificity, % | PPV, % | NPV, % |
|---|---|---|---|---|
| WLZ/WHZ | ||||
| Severe wasting | 2.63 | 99.44 | 16.67 | 96.03 |
| Moderate wasting | 16.13 | 97.91 | 54.04 | 88.44 |
| WAZ | ||||
| Severe underweight | 5.71 | 99.77 | 66.67 | 92.91 |
| Moderate underweight | 12.04 | 98.47 | 70.27 | 78.89 |
| LAZ/HAZ | ||||
| Severe stunning | 5.68 | 99.88 | 83.33 | 91.08 |
| Moderate stunning | 10.28 | 98.39 | 70.27 | 74.78 |
| BAZ | ||||
| Severe wasting | 0 | 99.34 | 0 | 96.78 |
| Moderate wasting | 14.42 | 90.11 | 40.54 | 90.11 |
Sensitivity and specificity of WHO-recommended MUAC cutoffs in children with CP.
MUAC, Mid-Upper Arm circumference; WLZ, weight-for-length Z score; WHZ, weight-for-height Z score; WAZ, weight-for-age Z score; LAZ; length-for-age Z score; HAZ, height-for-age Z score; BAZ, BMI-for-age Z score; PPV, positive predictive value; NPV, negative predictive value.
The correlation between MUAC and Z scores
Figure 1 shows the correlations between MUAC and WLZ/WHZ, WAZ, LAZ/HAZ, and BAZ, respectively. There was a statistically significant, strong correlation between MUAC and WLZ/WHZ (r = 0.606, p < 0.001), followed by WAZ (r = 0.557, p < 0.001) and BAZ (r = 0.575, p < 0.001). Meanwhile, there was a significant but weak correlation between MUAC and HAZ (r = 0.276, p < 0.001).
Figure 1
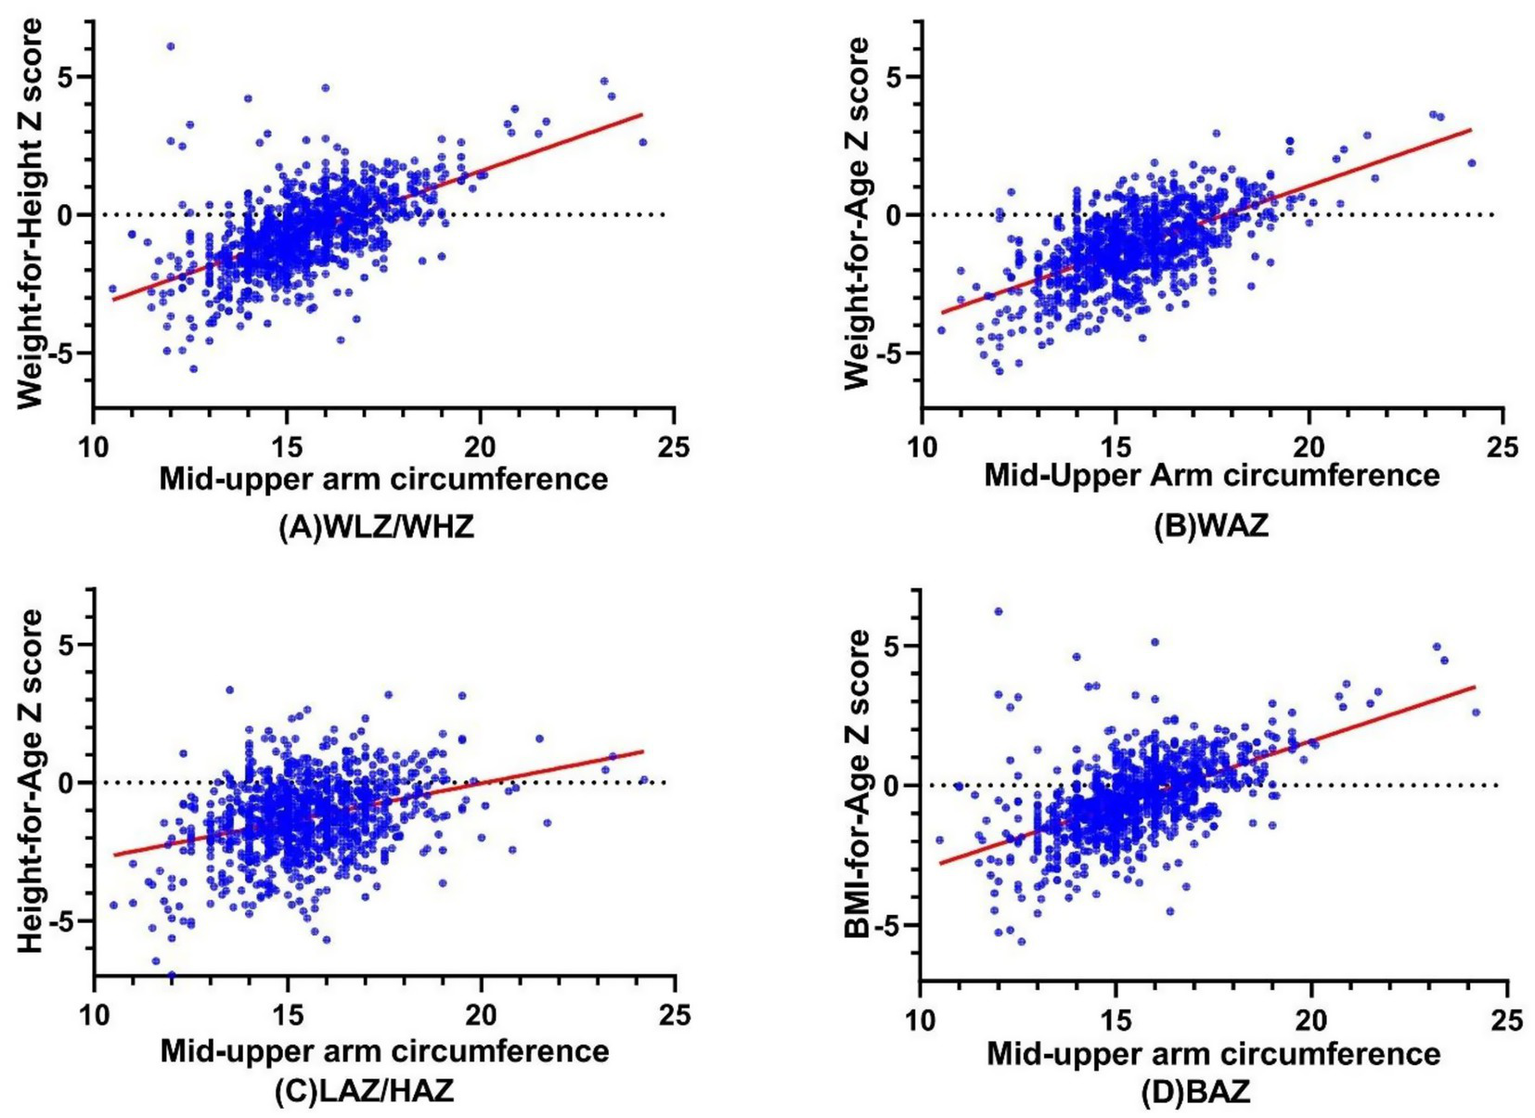
The Correlations between MUAC and (A) WLZ/WHZ, (B) WAZ, (C) LAZ/HAZ, and (D) BAZ. MUAC, Mid-Upper Arm circumference; WLZ, weight-for-length Z score; WHZ, weight-for-height Z score; WAZ, weight-for-age Z score; LAZ, length-for-age Z score; HAZ, height-for-age Z score; BAZ, BMI-for-age Z see.
The ability of MUAC to correctly identify malnutrition
ROC curves were conducted to assess the ability of MUAC to correctly predict malnutrition (mild undernutrition, moderate undernutrition, severe undernutrition, overweight, and obesity) (Figure 2). MUAC identified malnutrition with moderate accuracy (AUC ranged from 0.539 to 0.833).
Figure 2
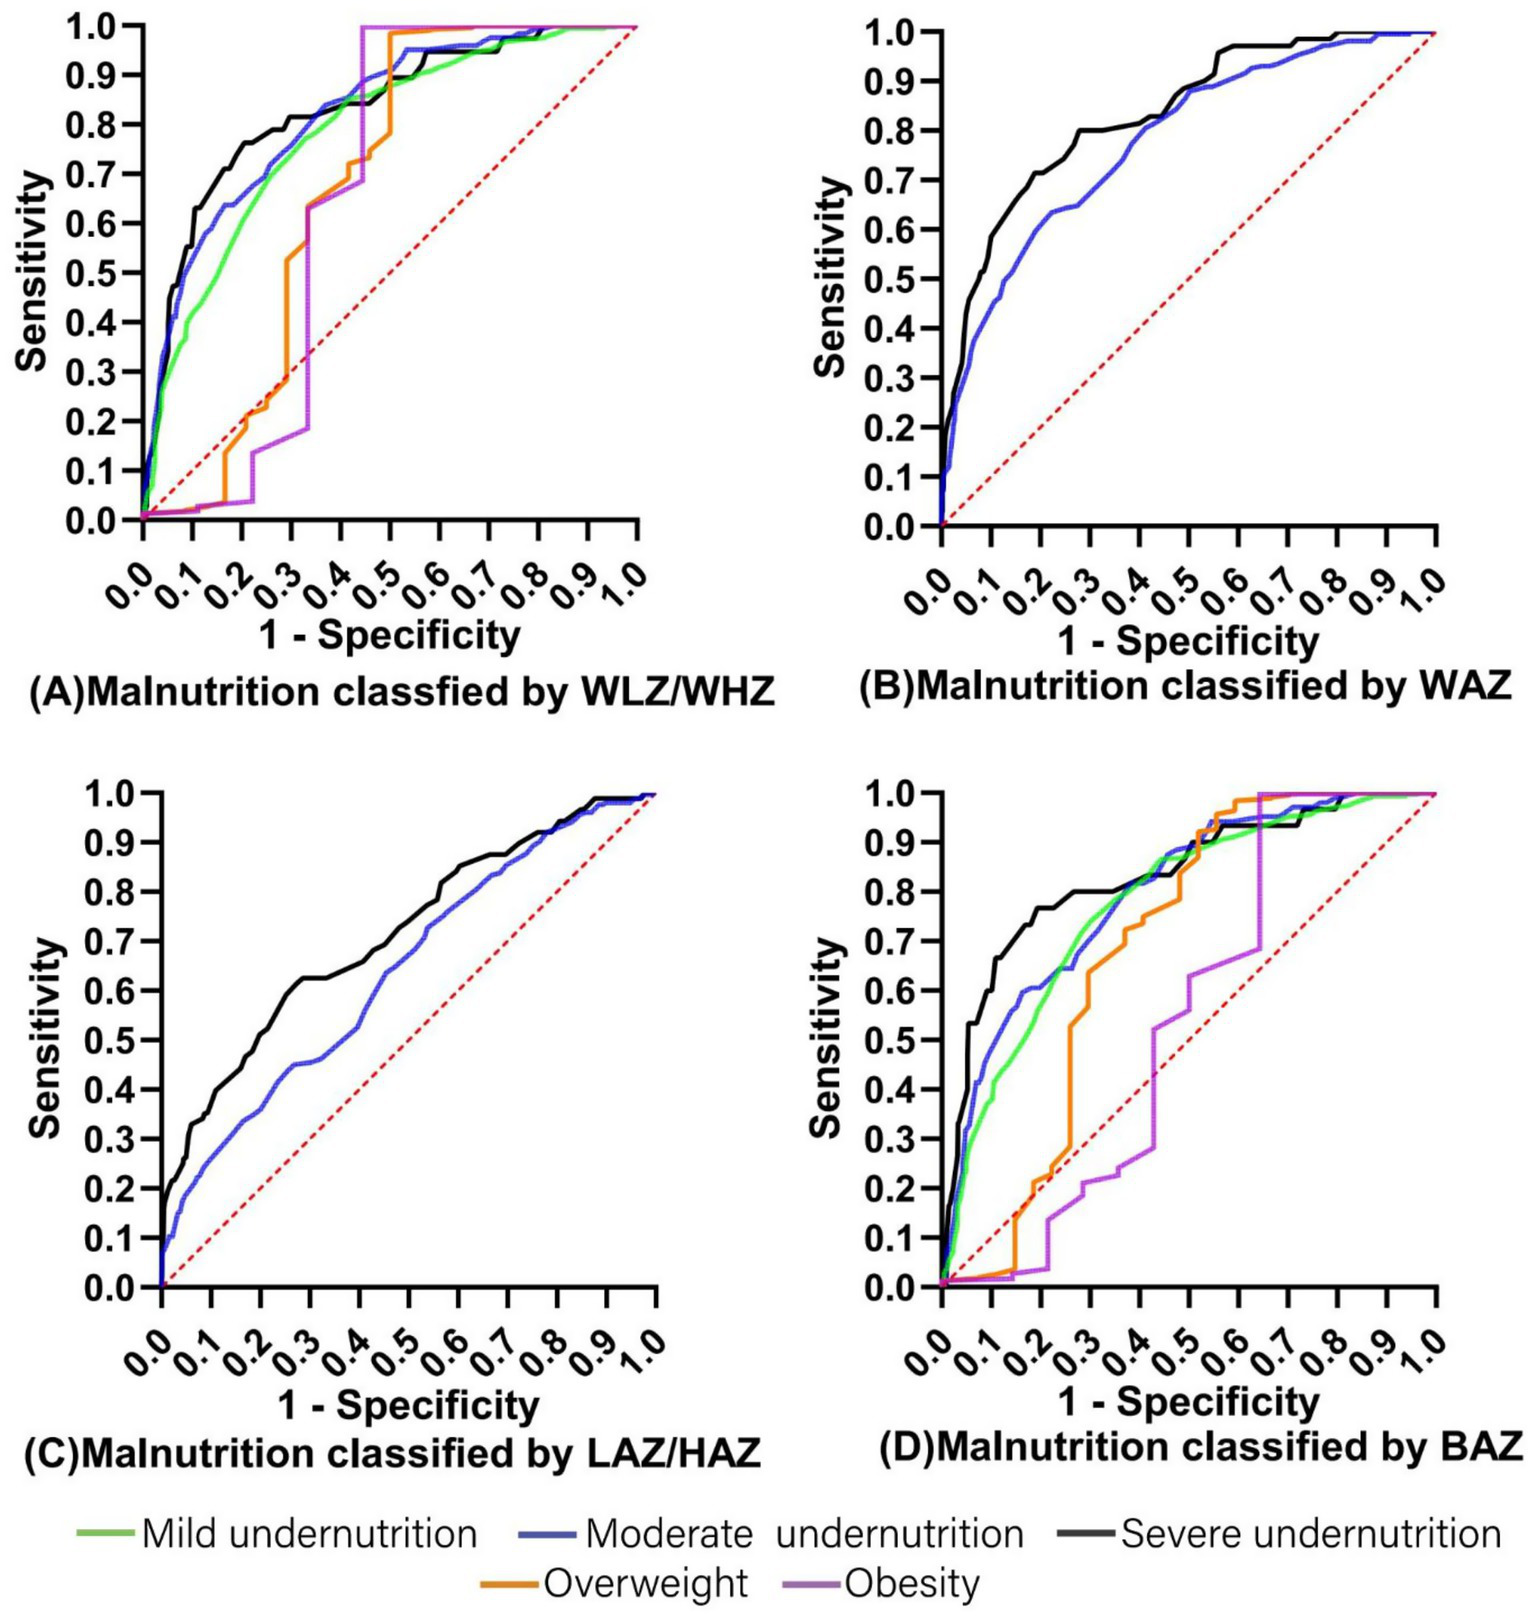
The ROC curves for MUAC prediction of malnutrition classified by (A) WLZ/WHZ, (B) WAZ, (C) LAZ/HAZ, and (D) BAZ. MUAC, Mid-Upper Arm circumference; WLZ, weight-for-length Z score; WHZ, weight-for-height Z score; WAZ, weight-for-age Z score; LAZ, length-for-age Z score; HAZ, height-for-age Z score; BAZ, BMI-for-age Z score.
Table 5 shows the optimal MUAC cutoffs for predicting malnutrition classified by WLZ/WHZ, WAZ, LAZ/HAZ, and BAZ in children with CP aged 12–60 months. In order to effectively identify CP children with or at risk of malnutrition, the optimal MUAC cutoffs for mild undernutrition, moderate undernutrition, severe undernutrition, overweight, and obesity were 15.35 cm (AUC 0.785), 15.05 cm (AUC 0.797), 14.35 cm (AUC 0.830), 17.55 cm (AUC 0.688), and 20.4 cm (AUC 0.651), respectively. Besides, the results of 1,000 bootstrap resampling were consistent with the above findings, indicating the robustness of the identified cutoffs (Table 6).
Table 5
| Variables | Cutoff (cm) | Sensitivity, % | Specificity, % | False positive rates | AUC |
|---|---|---|---|---|---|
| WLZ/WHZ | |||||
| Severe wasting | 14.35 | 79.4 | 76.3 | 0.237 | 0.830 |
| Moderate wasting | 14.55 | 77.6 | 67.7 | 0.323 | 0.822 |
| Mild wasting | 15.35 | 67.1 | 77.1 | 0.229 | 0.785 |
| Overweight | 18.95 | 50 | 98.5 | 0.015 | 0.669 |
| Obesity | 20.40 | 55.6 | 99.7 | 0.003 | 0.651 |
| WAZ | |||||
| Severe underweight | 14.35 | 81.1 | 71.4 | 0.286 | 0.833 |
| Moderate underweight | 15.05 | 65.5 | 71.8 | 0.282 | 0.778 |
| LAZ/HAZ | |||||
| Severe stunning | 15.15 | 57.1 | 68.2 | 0.318 | 0.715 |
| Moderate stunning | 15.75 | 46.2 | 72.7 | 0.273 | 0.639 |
| BAZ | |||||
| Severe wasting | 14.25 | 79.4 | 76.3 | 0.233 | 0.832 |
| Moderate wasting | 15.05 | 61.7 | 81.7 | 0.183 | 0.797 |
| Mild wasting | 15.15 | 69.8 | 74.1 | 0.259 | 0.777 |
| Overweight | 17.55 | 48.1 | 92.1 | 0.079 | 0.688 |
| Obesity | 20.40 | 35.7 | 99.7 | 0.003 | 0.539 |
Optimal MUAC cutoff for malnutrition classified by WHZ, WAZ, HAZ, BAZ.
MUAC, Mid-Upper Arm circumference; WLZ, weight-for-length Z score; WHZ, weight-for-height Z score; WAZ, weight-for-age Z score; LAZ, length-for-age Z score; HAZ, height-for-age Z score; BAZ, BMI-for-age Z score.
Table 6
| Variables | AUC (95%CI) | Sensitivity (95%CI) | Specificity (95%CI) |
|---|---|---|---|
| WLZ/WHZ | |||
| Severe wasting | 0.83 (0.76 ~ 0.89) | 79.4 (50 ~ 89.5) | 76.3 (60.5 ~ 89.5) |
| Moderate wasting | 0.82 (0.78 ~ 0.86) | 83.4 (72.7 ~ 88.1) | 71.1 (50.0 ~ 84.2) |
| Mild wasting | 0.79 (0.76 ~ 0.81) | 67.1 (58.7 ~ 72.4) | 77.1 (69.5 ~ 81.1) |
| Overweight | 0.67 (0.52 ~ 0.82) | 50 (25 ~ 66.7) | 98.5 (53.8 ~ 100) |
| Obesity | 0.65 (0.37 ~ 0.92) | 55.6 (11.1 ~ 88.9) | 62.9 (1.8 ~ 100) |
| WAZ | |||
| Severe underweight | 0.83 (0.78 ~ 0.88) | 81.1 (60.7 ~ 87.2) | 68.6 (58.5 ~ 80) |
| Moderate underweight | 0.78 (0.75 ~ 0.81) | 78.9 (63.4 ~ 83.1) | 62 (51.8 ~ 68.5) |
| LAZ/HAZ | |||
| Severe stunning | 0.72 (0.66 ~ 0.77) | 72.7 (51.5 ~ 80) | 59.1 (47.7 ~ 70.5) |
| Moderate stunning | 0.64 (0.60 ~ 0.68) | 46.2 (34.5 ~ 50.6) | 70.8 (62.1 ~ 77.9) |
| BAZ | |||
| Severe wasting | 0.83 (0.75 ~ 0.91) | 80.7 (49.3 ~ 90.8) | 79.7 (59.9 ~ 90) |
| Moderate wasting | 0.80 (0.75 ~ 0.84) | 61.7 (50.9 ~ 64.8) | 81.7 (64.4 ~ 88.5) |
| Mild wasting | 0.78 (0.75 ~ 0.81) | 69.8 (61.9 ~ 73.9) | 74.1 (59.5 ~ 79.1) |
| Overweight | 0.69 (0.54 ~ 0.82) | 48.1 (29.6 ~ 66.7) | 92.1 (64.2 ~ 100) |
| Obesity | 0.54 (0.33 ~ 0.72) | 35.7 (0 ~ 57.1) | 99.7 (24.8 ~ 100) |
Bootstrap-based validation (1,000 resamples) of MUAC diagnostic accuracy.
MUAC, Mid-Upper Arm circumference; WLZ, weight-for-length Z score; WHZ, weight-for-height Z score; WAZ, weight-for-age Z score; LAZ, length-for-age Z score; HAZ, height-for-age Z score; BAZ, BMI-for-age Z score.
Table 7 shows the predictive value of the optimal MUAC cutoffs for preschoolers with CP across GMFCS levels I–III and IV–V. It shows that the optimal MUAC cutoffs have good predictive value for both undernutrition and overnutrition in preschoolers with CP at GMFCS levels I to III. However, for children at GMFCS levels IV and V, the cutoff values show good predictive value only for undernutrition.
Table 7
| GMFCS level | Nutritional status | Sensitivity, % | Specificity, % | PPV, % | NPV, % |
|---|---|---|---|---|---|
| I ~ V | Mild undernutrition | 69.6 | 69.57 | 70.34 | 68.82 |
| Moderate undernutrition | 59.57 | 65.58 | 47.77 | 75.42 | |
| Severe undernutrition | 56.64 | 81.8 | 29.91 | 93.22 | |
| Overweight | 48 | 92 | 14.12 | 98.47 | |
| Obesity | 38.46 | 99.57 | 55.56 | 99.14 | |
| I ~ III | Mild undernutrition | 69.72 | 70.26 | 63.67 | 75.64 |
| Moderate undernutrition | 54.91 | 66.60 | 36.68 | 80.74 | |
| Severe undernutrition | 42.21 | 84.35 | 14.04 | 96.00 | |
| Overweight | 64.71 | 90.73 | 15.49 | 98.99 | |
| Obesity | 62.50 | 99.54 | 62.50 | 99.54 | |
| IV&V | Mild undernutrition | 69.43 | 66.25 | 83.23 | 47.32 |
| Moderate undernutrition | 64.90 | 61.48 | 67.59 | 58.59 | |
| Severe undernutrition | 64.00 | 73.74 | 48.00 | 84.39 | |
| Overweight | 12.50 | 95.05 | 7.14 | 97.30 | |
| Obesity | 0 | 99.63 | 0 | 98.16 |
Sensitivity and specificity of the optimal MUAC cutoffs in preschoolers with CP across different GMFCS levels.
PPV, positive predictive value; NPV, negative predictive value.
Discussion
MUAC is an extensively used tool to identify malnutrition, especially in resource-limited set-ups, and an essential indicator of associated mortality risk (31, 32). This study explored the use of MUAC and sought to identify the optimal cutoff values in outpatient preschoolers with CP aged 12–60 months.
Our results indicated that the MUAC cutoffs recommended by WHO seem inapplicable to children with CP. Compared to WLZ/WHZ, WAZ, LAZ/HAZ, and BAZ, the specificity and NPV of current MUAC cutoffs were excellent. However, the sensitivity and PPV were not good, indicating that the WHO-recommended MUAC cutoffs missed a substantial proportion of children with CP who suffered from undernutrition. WHO-recommended MUAC cutoffs identified fewer children with malnutrition because MUAC is just a single measurement of anthropometry, and the standard WHO cutoff values are not stratified by age or sex, whereas Z-scores are.
The correlations between MUAC with Z scores, MUAC and WLZ/WHZ, WAZ, and BAZ were more relevant than with LAZ/HAZ. This may be explained by MUAC measuring the sum of bone, muscle, and fat in the midpoint of the upper arm, which are more affected by weight than height. MUAC is closely related to weight, while segmental lengths, especially tibia length, are highly correlated with height (33, 34). Thus, MUAC may be unsuitable for screening malnutrition identified by HAZ, namely stunting.
The ESPGHAN working group highlighted five “red flags” for detecting undernutrition in children with neurological impairment: (1) physical signs of malnutrition (e.g., pressure-related skin lesions, poor peripheral circulation), (2) WAZ < −2, (3) triceps skinfold thickness (TSF) below the 10th percentile for age and sex, (4) mid-upper arm fat or muscle area (AMA) below the 10th percentile, and (5) faltering growth and/or failure to thrive (35). In outpatient settings, these “red flag” indicators may face practical challenges: anthropometric measures such as TSF and AMA require specialized equipment, trained personnel, and cooperative patients, which can be difficult in children with CP. In contrast, MUAC offers a simple, quick, and non-invasive alternative that is easy to perform in busy clinical and requires minimal training. Considering that the WHO-recommended MUAC cutoffs may underestimate the prevalence of undernutrition in children with CP, we seek to optimized the MUAC cutoffs to potentially improve the screening sensitivity and better identify those with malnutrition. Our previous study reported that malnutrition prevalence in children with CP was about 57.6%, comprising 50.8% undernutrition (14.77% mild, 23.89% moderate, 12.16% severe) and 6.8% overnutrition (6). The optimal MUAC cutoffs we determined achieved higher sensitivity than the WHO-recommended cutoffs. For mild undernutrition, the optimal MUAC cut-offs demonstrated balanced sensitivity and specificity (about 69%), with a PPV (70.3%) exceeding the pre-test probability. For overweight and obesity, low PPVs reflected the lower pre-test probability (6.8%), whereas NPVs >98% indicate high effectiveness in excluding excessive nutritional status. Overall, the optimal MUAC cut-offs appear to be a useful tool for screening malnutrition in preschoolers with CP in outpatient clinics.
With respect to the prediction of undernutrition classified by Z scores, the results of this study indicated that the optimal MUAC cutoffs might be 15.35, 15.05, and 14.35 cm for mild, moderate, and severe undernutrition, respectively. We found the optimal cutoffs slightly higher than those previously reported in typical developing Cambodian children by Fiorentino et al. (36). The difference can be explained by the fact that we calculated the optimal cutoff based on the data from all participants aged 12–60 months, while Fiorentino et al. split the participants into two age groups. Additionally, a considerable proportion of the children in this study were preterm, male, and low birth weight (37). Although the cutoffs in the two studies are slightly different, the present evidence suggests that an increase in the current cutoff values may improve the predictability of MUAC.
Additionally, the optimal MUAC cutoffs that we established showed low sensitivity for predicting overnutrition in preschoolers with CP at GMFCS levels IV and V. This may be due to the low proportion of overnourished children with CP at GMFCS levels IV and V in our sample. However, this situation is consistent with the distribution of malnutrition categories among children with CP, where the proportion of overnutrition is much lower than that of undernutrition (6). What is more, with the severity increases, children with CP are more likely to have additional comorbidities, which further hinder energy accumulation (6). Therefore, larger-sample studies are needed to validate the effectiveness of the optimal MUAC cutoffs that we identified or to establish more accurate MUAC cutoffs for predicting overnutrition in children with CP.
Being overweight or obese can negatively affect CP children’s rehabilitation management and social life. To the best of our knowledge, this is the first study that explored the ability of MUAC to identify overnutrition in children with CP (18). A small number of studies demonstrated that MUAC is a reliable tool for identifying over nutrition in typically developing children (19, 38). Talma et al. (39) enrolled children aged 2 to 18 in their study but only proposed the MUAC Z score cutoffs for overweight and obesity. Previous studies found the MUAC cutoff values for children over 5 years old with overnutrition (ranging from 19.05 to 29.8 cm), which are higher than the optimal cutoff value in this study (19, 40, 41). With the optimal cutoffs in our study, 9.37% of children were in overnutrition when only 2.13 and 2.45% were indicated by WHZ and BAZ. This can be explained by the WHO growth charts considering gender and age in months. Thus, more studies are needed to determine the optimal cutoffs that predict overnutrition in different age groups.
The main contribution of the study is that we evaluated the ability of WHO-recommended MUAC cutoffs for nutrition screening among children with CP and determined the most appropriate cutoffs for detecting undernutrition as well as overnutrition in outpatient CP children aged between 12 and 60 months. It is important to provide early, effective nutrition management and growth monitoring for children with CP since malnutrition is one of the common co-occurring conditions. Compared to standard questionnaires, such as Subjective Global Nutritional Assessment (42), MUAC, an objective measurement, is more convenient and reliable. The optimal MUAC cutoffs we found in this study could be used in busy clinics to identify children at risk of malnutrition.
The main limitation of this study is that we did not conduct a finer stratification for MUAC cutoffs since the cross-sectional design led to unequal allocation of participants in terms of sex, age, GMFCS levels, and EDACS/Mini-EDACS levels. And we did not explore whether birth conditions of children with CP affect the MUAC cutoffs, such as gestational age and birth weight. Besides, CP is often accompanied by epilepsy, intellectual disability, and feeding and swallowing disorders (43, 44) that may adversely affect an individual’s nutritional status. However, the influence of comorbidities on MUAC cutoffs was not the focus of this study. Moreover, MUAC may be unsuitable for screening overnutrition because there is no more accurate measurement to determine body composition, especially body fat, than the BMI-for-age Z score. Additionally, this study lacks external validation, which may limit the generalizability of the proposed MUAC cut-offs.
Conclusion
MUAC is a potentially valuable tool for nutrition screening in children with CP aged 12 to 60 months. Further studies are needed to establish the MUAC cutoffs among children with CP over 5 years old and to verify whether there are differences related to the severity of motor and swallowing dysfunction.
Statements
Data availability statement
The raw data supporting the conclusions of this article will be made available by the authors, without undue reservation.
Ethics statement
The studies involving humans were approved by the Ethics Committee of Guangzhou Women and Children’s Medical Center (GWCMC) (approval number: 2020-29,602). The studies were conducted in accordance with the local legislation and institutional requirements. Written informed consent for participation in this study was provided by the participants’ legal guardians/next of kin.
Author contributions
HZ: Writing – review & editing, Formal analysis, Writing – original draft. TP: Writing – original draft, Formal analysis. MW: Writing – original draft, Formal analysis. JZ: Data curation, Writing – review & editing. YZ: Writing – original draft, Validation. WL: Writing – original draft, Visualization. DF: Writing – original draft, Visualization. SQ: Writing – original draft, Investigation. YuaZ: Validation, Writing – original draft. QL: Writing – original draft, Validation. YunZ: Writing – original draft, Data curation. LM: Writing – original draft, Visualization. JLi: Writing – original draft, Project administration. JLu: Formal analysis, Writing – original draft. HT: Project administration, Writing – original draft, Investigation. LH: Methodology, Writing – review & editing, Conceptualization, Writing – original draft, Project administration. KX: Methodology, Writing – review & editing, Writing – original draft, Conceptualization, Funding acquisition.
Funding
The author(s) declare that financial support was received for the research and/or publication of this article. This study was supported by STI 2030-Major Projects (No. 2021ZD0200500), the Natural Science Foundation of Guangdong Province (No. 2025A1515010379 and 2024A1515012920), the Featured Clinical Technique of Guangzhou (No. 2023C-TS59), Guangzhou Municipal Science and Technology Project (No. 2024A03J01274 and 2023A03J0919), and Plan on enhancing scientific research in Guangzhou Medical University (No. GMUCR2024-02020). The funders played no role in the design, conduct, or reporting of this study.
Acknowledgments
We would like to thank all children and their parents who participated in this study, Lingxia Sun (MS, RD, CNSC) and Ling Chen (MD, Nanjing Maternity and Child Health Care Hospital) for their valuable advice, and Nestlé Health Science (China) Ltd. for the support of meeting and training.
Conflict of interest
The authors declare that the research was conducted in the absence of any commercial or financial relationships that could be construed as a potential conflict of interest.
Generative AI statement
The authors declare that no Gen AI was used in the creation of this manuscript.
Any alternative text (alt text) provided alongside figures in this article has been generated by Frontiers with the support of artificial intelligence and reasonable efforts have been made to ensure accuracy, including review by the authors wherever possible. If you identify any issues, please contact us.
Publisher’s note
All claims expressed in this article are solely those of the authors and do not necessarily represent those of their affiliated organizations, or those of the publisher, the editors and the reviewers. Any product that may be evaluated in this article, or claim that may be made by its manufacturer, is not guaranteed or endorsed by the publisher.
References
1.
Cieza A Causey K Kamenov K Hanson SW Chatterji S Vos T . Global estimates of the need for rehabilitation based on the global burden of disease study 2019: a systematic analysis for the global burden of disease study 2019. Lancet. (2021) 396:2006–17. doi: 10.1016/S0140-6736(20)32340-0
2.
Li N Zhou P Tang H He L Fang X Zhao J et al . In-depth analysis reveals complex molecular aetiology in a cohort of idiopathic cerebral palsy. Brain. (2022) 145:119–41. doi: 10.1093/brain/awab209
3.
Bharti N Dwivedi AK Gupta S Singh AK Sharma B Khan IA . A cross-sectional study examining the relationship between malnutrition and gross motor function in cerebral palsy. Cureus. (2024) 16:e55753. doi: 10.7759/cureus.55753
4.
Chanie ES Moges N Baye FD Mekonnen GB Fekadie MM Bazezew LY et al . Estimate the burden of malnutrition among children with cerebral palsy in sub-Saharan Africa: a systematic review with meta-analysis. Sci Rep. (2024) 14:6494. doi: 10.1038/s41598-024-55730-1
5.
Khatun R Bin SM Khatun MR Benzir M Islam MR Ahmed S et al . Nutritional status of children with neurodevelopmental disorders: a cross-sectional study at a tertiary-level hospital in northern Bangladesh. BMC Nutr. (2024) 10:61. doi: 10.1186/s40795-024-00863-9
6.
Zhao Y Tang H Peng T Li J Liu L Fu C et al . Relationship between nutritional status and severity of cerebral palsy: a multicentre cross-sectional study. J Rehabil Med. (2023) 55:m367. doi: 10.2340/jrm.v55.4395
7.
Reyes FI Salemi JL Dongarwar D Magazine CB Salihu HM . Prevalence, trends, and correlates of malnutrition among hospitalized children with cerebral palsy. Dev Med Child Neurol. (2019) 61:1432–8. doi: 10.1111/dmcn.14329
8.
Zhao Y He L Peng T Liu L Zhou H Xu Y et al . Nutritional status and function after high-calorie formula vs. Chinese food intervention in undernourished children with cerebral palsy. Front Nutr. (2022) 9:960763. doi: 10.3389/fnut.2022.960763
9.
Ng ZM Lin JB Khoo PC Rajadurai VS Chan D Ong HT et al . Causes, functional outcomes and healthcare utilisation of people with cerebral palsy in Singapore. Ann Acad Med Singap. (2021) 50:111–8. doi: 10.47102/annals-acadmedsg.2020489
10.
Miele MJ Souza RT Calderon IM Feitosa FE Leite DF Rocha FE et al . Maternal nutrition status associated with pregnancy-related adverse outcomes. Nutrients. (2021) 13:2398. doi: 10.3390/nu13072398
11.
Pohlhausen S Uhlig K Kiesswetter E Diekmann R Heseker H Volkert D et al . Energy and protein intake, anthropometrics, and disease burden in elderly home-care receivers--a cross-sectional study in Germany (ErnSIPP study). J Nutr Health Aging. (2016) 20:361–8. doi: 10.1007/s12603-015-0586-9
12.
Sarpong SA Sarpong AK Lee Y . A model for determining predictors of the MUAC in acute malnutrition in Ghana. Int J Environ Res Public Health. (2021) 18:3792. doi: 10.3390/ijerph18073792
13.
World Health Organization . WHO child growth standards and the identification of severe acute malnutrition in infants and children: a joint statement by the World Health Organization and the United Nations children’s. Geneva: World Health Organization (2009).
14.
Becker P Carney LN Corkins MR Monczka J Smith E Smith SE et al . Consensus statement of the academy of nutrition and dietetics/American Society for Parenteral and Enteral Nutrition: indicators recommended for the identification and documentation of pediatric malnutrition (undernutrition). Nutr Clin Pract. (2015) 30:147–61. doi: 10.1177/0884533614557642
15.
Aydin K . A multicenter cross-sectional study to evaluate the clinical characteristics and nutritional status of children with cerebral palsy. Clin Nutr ESPEN. (2018) 26:27–34. doi: 10.1016/j.clnesp.2018.05.002
16.
Huysentruyt K Geeraert F Allemon H Prinzie P Roelants M Ortibus E et al . Nutritional red flags in children with cerebral palsy. Clin Nutr. (2020) 39:548–53. doi: 10.1016/j.clnu.2019.02.040
17.
Jahan I Muhit M Al IM Ghose R Chhetri AB Badawi N et al . Nutritional status of children with cerebral palsy in Gorkha, Nepal: findings from the Nepal cerebral palsy register. Nutrients. (2021) 13:2537. doi: 10.3390/nu13082537
18.
Sørensen SJ Brekke G Kok K Sørensen JL Born AP Mølgaard C et al . Nutritional screening of children and adolescents with cerebral palsy: a scoping review. Dev Med Child Neurol. (2021) 63:1374–81. doi: 10.1111/dmcn.14981
19.
Sisay BG Hassen HY Jima BR Atlantis E Gebreyesus SH . The performance of mid-upper arm circumference for identifying children and adolescents with overweight and obesity: a systematic review and meta-analysis. Public Health Nutr. (2022) 25:607–16. doi: 10.1017/S1368980022000143
20.
Ruiz BM Cieri ME Butler C Cuestas E . Development of equations and software for estimating weight in children with cerebral palsy. Dev Med Child Neurol. (2021) 63:860–5. doi: 10.1111/dmcn.14857
21.
Oftedal S Davies PS Boyd RN Stevenson RD Ware RS Keawutan P et al . Body composition, diet, and physical activity: a longitudinal cohort study in preschoolers with cerebral palsy. Am J Clin Nutr. (2017) 105:369–78. doi: 10.3945/ajcn.116.137810
22.
Sung KH Chung CY Lee KM Cho BC Moon SJ Kim J et al . Differences in body composition according to gross motor function in children with cerebral palsy. Arch Phys Med Rehabil. (2017) 98:2295–300. doi: 10.1016/j.apmr.2017.04.005
23.
Palisano RJ Rosenbaum P Bartlett D Livingston MH . Content validity of the expanded and revised gross motor function classification system. Dev Med Child Neurol. (2008) 50:744–50. doi: 10.1111/j.1469-8749.2008.03089.x
24.
Palisano R Rosenbaum P Walter S Russell D Wood E Galuppi B . Development and reliability of a system to classify gross motor function in children with cerebral palsy. Dev Med Child Neurol. (1997) 39:214–23. doi: 10.1111/j.1469-8749.1997.tb07414.x
25.
Sellers D Mandy A Pennington L Hankins M Morris C . Development and reliability of a system to classify the eating and drinking ability of people with cerebral palsy. Dev Med Child Neurol. (2014) 56:245–51. doi: 10.1111/dmcn.12352
26.
Tschirren L Bauer S Hanser C Marsico P Sellers D van Hedel H . The eating and drinking ability classification system: concurrent validity and reliability in children with cerebral palsy. Dev Med Child Neurol. (2018) 60:611–7. doi: 10.1111/dmcn.13751
27.
de Onis M Onyango AW Van den Broeck J Chumlea WC Martorell R . Measurement and standardization protocols for anthropometry used in the construction of a new international growth reference. Food Nutr Bull. (2004) 25:S27–36. doi: 10.1177/15648265040251S104
28.
Stevenson RD . Use of segmental measures to estimate stature in children with cerebral palsy. Arch Pediatr Adolesc Med. (1995) 149:658–62. doi: 10.1001/archpedi.1995.02170190068012
29.
Popkin BM Corvalan C Grummer-Strawn LM . Dynamics of the double burden of malnutrition and the changing nutrition reality. Lancet. (2020) 395:65–74. doi: 10.1016/S0140-6736(19)32497-3
30.
WHO Multicentre Growth Reference Study Group . WHO child growth standards based on length/height, weight and age. Acta Paediatr Suppl. (2006) 450:76–85. doi: 10.1111/j.1651-2227.2006.tb02378.x
31.
Dailey-Chwalibóg T Freemark M Muehlbauer M Roberfroid D Kemokai IA Mostak MR et al . Clinical and biochemical markers of risk in uncomplicated severe acute malnutrition. Pediatrics. (2021) 147:e2020027003. doi: 10.1542/peds.2020-027003
32.
Isanaka S Hanson KE Frison S Andersen CT Cohuet S Grais RF . MUAC as the sole discharge criterion from community-based management of severe acute malnutrition in Burkina Faso. Matern Child Nutr. (2019) 15:e12688. doi: 10.1111/mcn.12688
33.
Kong CK Tse PW Lee WY . Bone age and linear skeletal growth of children with cerebral palsy. Dev Med Child Neurol. (1999) 41:758–65. doi: 10.1017/s0012162299001528
34.
Mokhy MS Jamaluddin R Ismail AR Sulaiman N Adznam S Ismail IH et al . Validated predictive equations based on tibial length in estimating height for children with cerebral palsy for 2-18 years, across all GMFCS levels. J Nutr Sci. (2021) 10:e108. doi: 10.1017/jns.2021.101
35.
Romano C van Wynckel M Hulst J Broekaert I Bronsky J Dall'Oglio L et al . European Society for Paediatric Gastroenterology, Hepatology and nutrition guidelines for the evaluation and treatment of gastrointestinal and nutritional complications in children with neurological impairment. J Pediatr Gastroenterol Nutr. (2017) 65:242–64. doi: 10.1097/MPG.0000000000001646
36.
Fiorentino M Sophonneary P Laillou A Whitney S de Groot R Perignon M et al . Current MUAC cut-offs to screen for acute malnutrition need to be adapted to gender and age: the example of Cambodia. PLoS One. (2016) 11:e146442. doi: 10.1371/journal.pone.0146442
37.
Novak I Morgan C Adde L Blackman J Boyd RN Brunstrom-Hernandez J et al . Early, accurate diagnosis and early intervention in cerebral palsy: advances in diagnosis and treatment. JAMA Pediatr. (2017) 171:897–907. doi: 10.1001/jamapediatrics.2017.1689
38.
Ranasinghe P Jayawardena R Gamage N Pujitha WV Hills AP . The range of non-traditional anthropometric parameters to define obesity and obesity-related disease in children: a systematic review. Eur J Clin Nutr. (2021) 75:373–84. doi: 10.1038/s41430-020-00715-2
39.
Talma H van Dommelen P Schweizer JJ Bakker B Kist-van HJ Chinapaw J et al . Is mid-upper arm circumference in Dutch children useful in identifying obesity?Arch Dis Child. (2019) 104:159–65. doi: 10.1136/archdischild-2017-313528
40.
Nitika N . Discriminatory ability of mid-upper arm circumference in identifying overweight and obese adolescents: findings from the comprehensive national nutrition survey, India. Indian J Public Health. (2021) 65:269–74. doi: 10.4103/ijph.IJPH_54_21
41.
Shinsugi C Gunasekara D Takimoto H . Use of mid-upper arm circumference (MUAC) to predict malnutrition among Sri Lankan schoolchildren. Nutrients. (2020) 12:168. doi: 10.3390/nu12010168
42.
Peng T Zhao Y Fu C Huang S Zhou H Li J et al . A study of validity and reliability for subjective global nutritional assessment in outpatient children with cerebral palsy. Nutr Neurosci. (2022) 25:2570–6. doi: 10.1080/1028415X.2021.1990463
43.
Hollung SJ Bakken IJ Vik T Lydersen S Wiik R Aaberg KM et al . Comorbidities in cerebral palsy: a patient registry study. Dev Med Child Neurol. (2020) 62:97–103. doi: 10.1111/dmcn.14307
44.
Saini AG Sankhyan N Malhi P Ahuja C Khandelwal N Singhi P . Dyskinetic cerebral palsy in children: clinical perspectives on common comorbidities and health-related quality of life. J Autism Dev Disord. (2024). doi: 10.1007/s10803-024-06467-3
Summary
Keywords
cerebral palsy, malnutrition, undernutrition, overnutrition, mid-upper arm circumference, cutoffs, preschoolers
Citation
Zhou H, Peng T, Wei M, Zhang J, Zhao Y, Le W, Fan D, Qiu S, Zheng Y, Lin Q, Zheng Y, Ma L, Zhang J, Li J, Lu J, Tang H, He L and Xu K (2025) Validity and predictability of mid-upper arm circumference for nutrition screening in outpatient preschoolers with cerebral palsy. Front. Nutr. 12:1609032. doi: 10.3389/fnut.2025.1609032
Received
09 April 2025
Accepted
21 August 2025
Published
05 September 2025
Volume
12 - 2025
Edited by
Karla Danielly Ribeiro, Federal University of Rio Grande do Norte, Brazil
Reviewed by
Gonca Kılıç Yıldırım, Eskişehir Osmangazi University, Türkiye
Xueying Zhang, Yangzhou University, China
Nafiye Urganci, Şişli Hamidiye Etfal Education and Research Hospital, Türkiye
Updates
Copyright
© 2025 Zhou, Peng, Wei, Zhang, Zhao, Le, Fan, Qiu, Zheng, Lin, Zheng, Ma, Zhang, Li, Lu, Tang, He and Xu.
This is an open-access article distributed under the terms of the Creative Commons Attribution License (CC BY). The use, distribution or reproduction in other forums is permitted, provided the original author(s) and the copyright owner(s) are credited and that the original publication in this journal is cited, in accordance with accepted academic practice. No use, distribution or reproduction is permitted which does not comply with these terms.
*Correspondence: Kaishou Xu, xksyi@126.com
†These authors have contributed equally to this work and share first authorship
Disclaimer
All claims expressed in this article are solely those of the authors and do not necessarily represent those of their affiliated organizations, or those of the publisher, the editors and the reviewers. Any product that may be evaluated in this article or claim that may be made by its manufacturer is not guaranteed or endorsed by the publisher.