 Ziyuan Li
 Tangchen Yin
 Yijing Chen2
- 1Department of Nursing, School of Health and Nursing, Wuxi Taihu University, Wuxi, China
- 2Department of Pathology, Kunshan Hospital of Traditional Chinese Medicine, Suzhou, China
Background: Relative fat mass (RFM) is a newly established anthropometric measurement that offers an alternative method for assessing body fat. Osteoarthritis (OA) is a widespread public health issue, with existing evidence identifying obesity as a notable risk factor for the OA development. This study aimed to examine the potential correlation between RFM and OA within a nationally representative population.
Methods: This study employed data collected from the National Health and Nutrition Examination Survey (NHANES) from 2007 to 2018. Weighted logistic regression models were performed to assess the relationship between RFM and OA. Furthermore, the predictive efficacy of various adiposity indicators for OA was examined through receiver operating characteristic (ROC) curve analysis, allowing for comparisons of area under the curve (AUC) values.
Results: The study cohort comprised 28,535 participants from the NHANES dataset. The analytical results indicated significant positive associations between RFM and OA. Stratified analyses revealed notable effect modifications based on age and diabetes status concerning the RFM-OA relationship. Comparative ROC analysis indicated RFM exhibited a superior capability for predicting OA prediction (AUC values: 0.646) compared with traditional obesity metrics.
Conclusion: The findings demonstrated a significant positive correlation between RFM and OA, indicating that higher RFM levels are associated with increased risk of OA. ROC analyses reinforced the diagnostic value of RFM for OA, with its predictive performance exceeding that of conventional adiposity metrics.
Introduction
Osteoarthritis (OA) is a prevalent musculoskeletal disorder, characterized by alterations in articular cartilage, subchondral bone remodeling, and osteophyte formation (1). Additionally, OA progression is characterized by concomitant synovitis and degenerative changes in periarticular tissues, including meniscal degeneration, tendinopathy, and fibrotic transformation of the infrapatellar fat pad (IFP). Studies have demonstrated progressive IFP volume loss and structural fibrosis in end-stage OA, establishing IFP remodeling as a hallmark pathological feature of advanced disease (2). It is estimated that over 590 million people worldwide are affected by OA, with its prevalence progressively increasing with age (3). Moreover, OA is a direct cause of substantial joint pain, leading to functional limitations and emerging as a primary contributor to disability (4, 5). Its significant individual and societal impacts are particularly pronounced among older adults (6). However, the pathogenesis of OA remains inadequately understood. Recent findings have demonstrated OA was closely associated with sociodemographic factors such as age, sex, and socioeconomic status, (7) as well as case-related factors including genetic susceptibility and synovial inflammation (8). Given its high prevalence and consequential effects, the identification of risk factors for OA is of paramount importance.
Obesity is a metabolic disorder characterized by an imbalance between caloric intake and expenditure, leading to excessive body fat deposition. Although the intricacies of the relationship between OA and obesity have not been fully clarified, prior studies have documented a significant correlation between knee osteoarthritis (KOA) and obesity (9). Excessive weight gain may further exacerbate the stress on the knee joint, leading to further joint degradation (10). Meanwhile, the function of adipose tissue should not be overlooked. During metabolic regulation, adipose tissue converts surplus energy into fatty acids and glycerol and releases adipokines (11, 12), thereby contributing to systemic chronic inflammation. Recent studies have illustrated that obesity promotes the production of adipokines, which subsequently contribute to the development of osteoarthritis (13, 14).
The Body mass index (BMI) remains the predominant metric for evaluating obesity, with a threshold of BMI ≥ 30 denoting obesity. Nevertheless, BMI exhibits certain limitations in accurately reflecting obesity, as it fails to differentiate effectively between muscle and fat mass (15). Individuals with identical BMI values can possess varying distributions of body fat (16). Recently, researchers have explored more precise anthropometric indicators of obesity, including the Body Shape Index, the Body Roundness Index, and Relative Fat Mass (RFM). RFM has emerged as a promising measure that provides a more precise estimation of total body fat percentage in contrast to conventional metrics. It is calculated using a straightforward formula based on height and waist circumference, making it a practical tool for both clinical application and research settings (17). RFM has demonstrated significant associations with various health conditions, including stroke (18), depression (19) and type 2 diabetes (20).
However, limited research has investigated the potential link between RFM and OA. Considering the accuracy of RFM in predicting health outcomes and the established correlation between OA and obesity, we hypothesized that RFM might also be associated with OA. This study utilized information obtained from the National Health and Nutrition Examination Survey (NHANES) database to assess the potential relationship between RFM and OA.
Methods
Study design and study population
Data were sourced from the NHANES database spanning the years 2007 to 2018, as these cycles contained relevant information concerning obesity and OA. Conducted by the Centers for Disease Control and Prevention (CDC), NHANES is a population-based surveillance system that collects comprehensive health data of individuals in the United States through cross-sectional surveys. All participants provided written informed consent prior to data collection. A total of 59,842 participants were initially recruited for the study, with the exclusion criteria detailed in Figure 1: (1) individuals aged ≤ 20 years (n = 25,072); (2) participants lacking complete RFM (n = 3,426) and OA data (n = 2,628); and (3) participants with incomplete data on covariates, including alcohol consumption, hypertension, BMI, education level, smoking, marital status, cardiovascular disease (CVD), and other variables (n = 181). After applying these criteria, 28,535 participants were included in the final analysis.
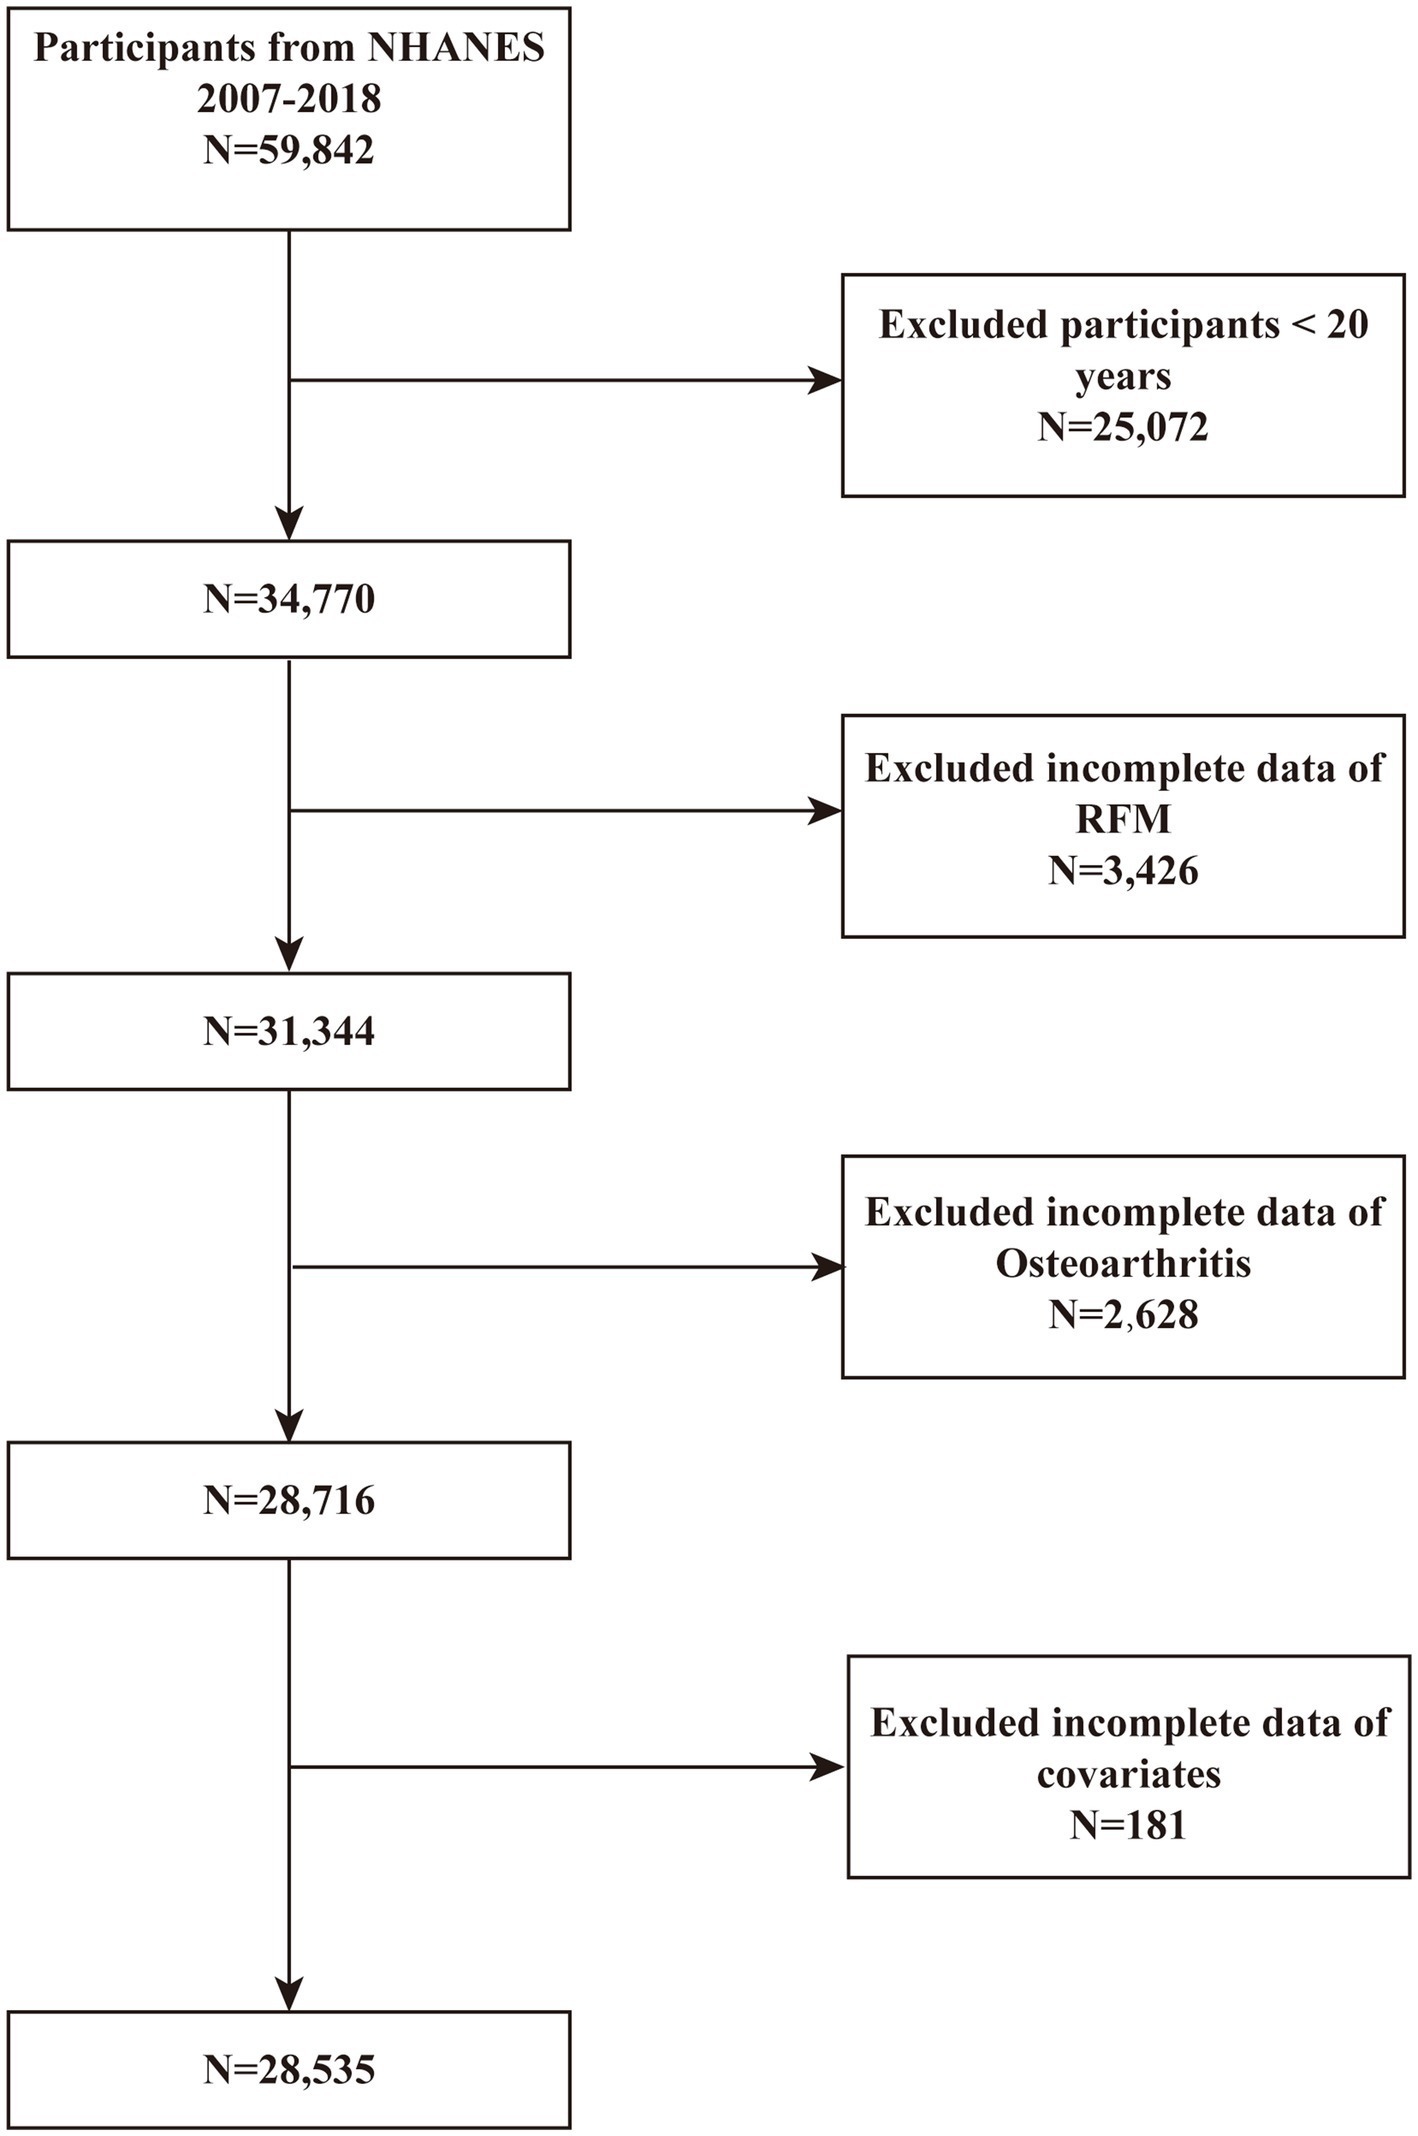
Figure 1. The selection process of subjects from the 2007–2018 NHANES database.
Definition of RFM
RFM was calculated using the following formula: RFM = 64 − (20 × Height / Waist Circumference) + (12 × Gender), where gender is coded as 1 for females and 0 for males (17). Height and waist were all available in the database, as measured by trained professionals at the Mobile Examination Center (MEC).
Additionally, we investigated the relationship between WHTR, BMI, WT, and WAIST and cardiorenal syndrome. WHTR = waist (cm)/height(cm). BMI = weight(kg)/height(m)2. The body weight (WT) was measured by trained health professionals at the Mobile Examination Center (MEC).
Definition of OA evaluation
Information on OA diagnosis was collected through the NHANES medical conditions questionnaire. Participants were asked whether a doctor or other healthcare professional had diagnosed them with arthritis. Those who answered “yes” were further classified into OA. If the answer was “No,” the respondents were classified as non-arthritis individuals. Participants who reported “osteoarthritis” were classified as having osteoarthritis. Responses indicating “rheumatoid arthritis” or “other” were considered non-osteoarthritis. Exiting studies have established strong concordance between self-reported OA and clinically diagnostic OA (21).
Covariates
In our study, several potential covariates were considered to assess their influence on the association between obesity and OA. Covariates in our study comprised demographic variables: age, sex, race, education level and marital status. Health-related variables included diabetes, hypertension, smoking status, drinking status, BMI, CVD, and stroke. Smoking status was classified as no and yes. Drinking status was categorized as no and yes. Specific information on covariates can be found in Supplementary Table 1.
Statistical analysis
To ensure that the study population is nationally representative, sample-specific weights (WTMEC2YR), stratification (SDMVSTRA), and clustering (SDMVPSU) were incorporated into the analysis. For the combined survey cycles, the two-year weights for each cycle were divided by six to generate new weights for the six-year combined dataset. Continuous variables were summarized using weighted means ± standard deviations, while categorical variables were presented as frequencies and weighted percentages. The evaluation of continuous variables utilized weighted t-tests, whereas weighted chi-square tests were utilized for categorical variables to identify statistical disparities among groups. Furthermore, multivariable logistic regression analysis was conducted to investigate the potential association between RFM and OA. To further investigate this relationship, RFM was stratified into quartiles. The analysis incorporated three distinct models: the crude model (which did not adjust for covariates), a partially adjusted model (Model 1, accounting for age, sex, and race), and a fully adjusted model (Model 2). Subgroup analyses, stratified by age, sex, race, education level, marital status, drinking status, smoking status, diabetes, hypertension, cardiovascular disease and stroke, were conducted to explore the relationship between RFM and OA across different populations. The interaction test in this study was conducted by constructing a Generalized Linear Model (GLM) including interaction terms, which is more appropriate for comparing complex models. Additionally, Receiver Operating Characteristic (ROC) curves were conducted to quantify the predictive validity of obesity indicators for OA, comparing their respective areas under the curve (AUC) values. All statistical analyses in this research were conducted utilizing R (version 4.2.0) and EmpowerStats 4.2.1 All statistical analyses used two-tailed tests with statistical significance defined as p < 0.05.
Results
Baseline characteristics
A total of 28,535 participants were included in this study. The differences in clinical characteristics between the OA and non-OA groups are presented in Table 1. The mean age of the participants was 48.20 years, with 49.07% male and 50.93% female. RFM was significantly higher in OA patients compared to non-OA individuals (39.44 vs. 34.98, p < 0.0001). Additionally, sociodemographic factors (age, sex, race, education level, marital status) and health behaviors (smoking status, drinking status), along with BMI were observed substantial between-group differences (p < 0.0001). Compared to non-OA individuals, those with OA showed statistically significant increases in prevalence across chronic diseases. (CVD: 16.78% vs. 6.13%; DM: 20.66% vs. 10.75%; hypertension: 60.08% vs. 30.15%; Stroke: 6.70% vs. 2.69%; vigorous physical activity: 13.09% vs. 24.60%; moderate physical activity: 37.48% vs. 41.60%).

Table 1. Baseline characteristic of participants.
The association between RFM and OA
Three models to study the association between RFM and OA were used in this analysis: an unadjusted model (Model 1), a model adjusted for core demographics: age, sex and race (Model 2), and a fully adjusted model incorporating disease-related factors based on Model 2 (Model 3). The results from the multivariable logistic regression models (Model 3) are comprehensively presented in Figure 2, demonstrating the association between RF and OA. When RFM was analyzed as a continuous variable, a positive correlation with OA was observed in all models. In Model 3, after adjusting for age, sex, race, education level, marital status, drinking status, smoking status, diabetes, hypertension, cardiovascular disease, and stroke, the association between RFM and OA remained highly significant (OR = 1.05; 95% CI: 1.04–1.07). To further investigate this relationship, RFM was stratified into quartiles. The analysis revealed that in Model 3, participants in the highest RFM quartile demonstrated significantly greater OA prevalence than those in the lowest quartile (OR = 2.51; 95% CI: 1.91–3.31), with a significant trend across quartiles (P for trend < 0.0001) (see Table 2).
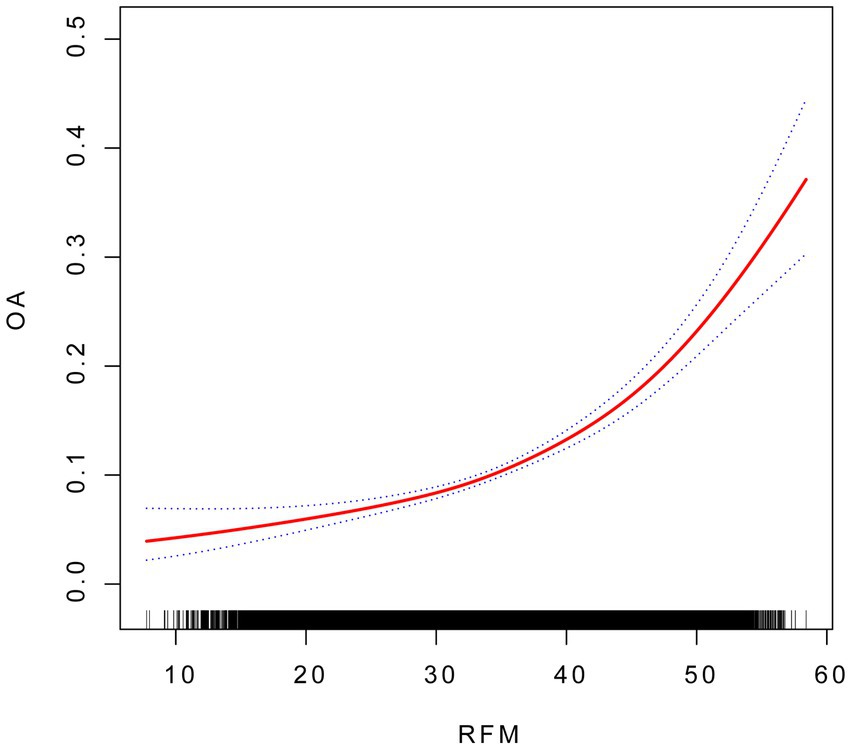
Figure 2. The association between RFM and OA. Smooth curve fitting for the association between RFM and OA. The solid red line represents the smooth curve fit between variables.
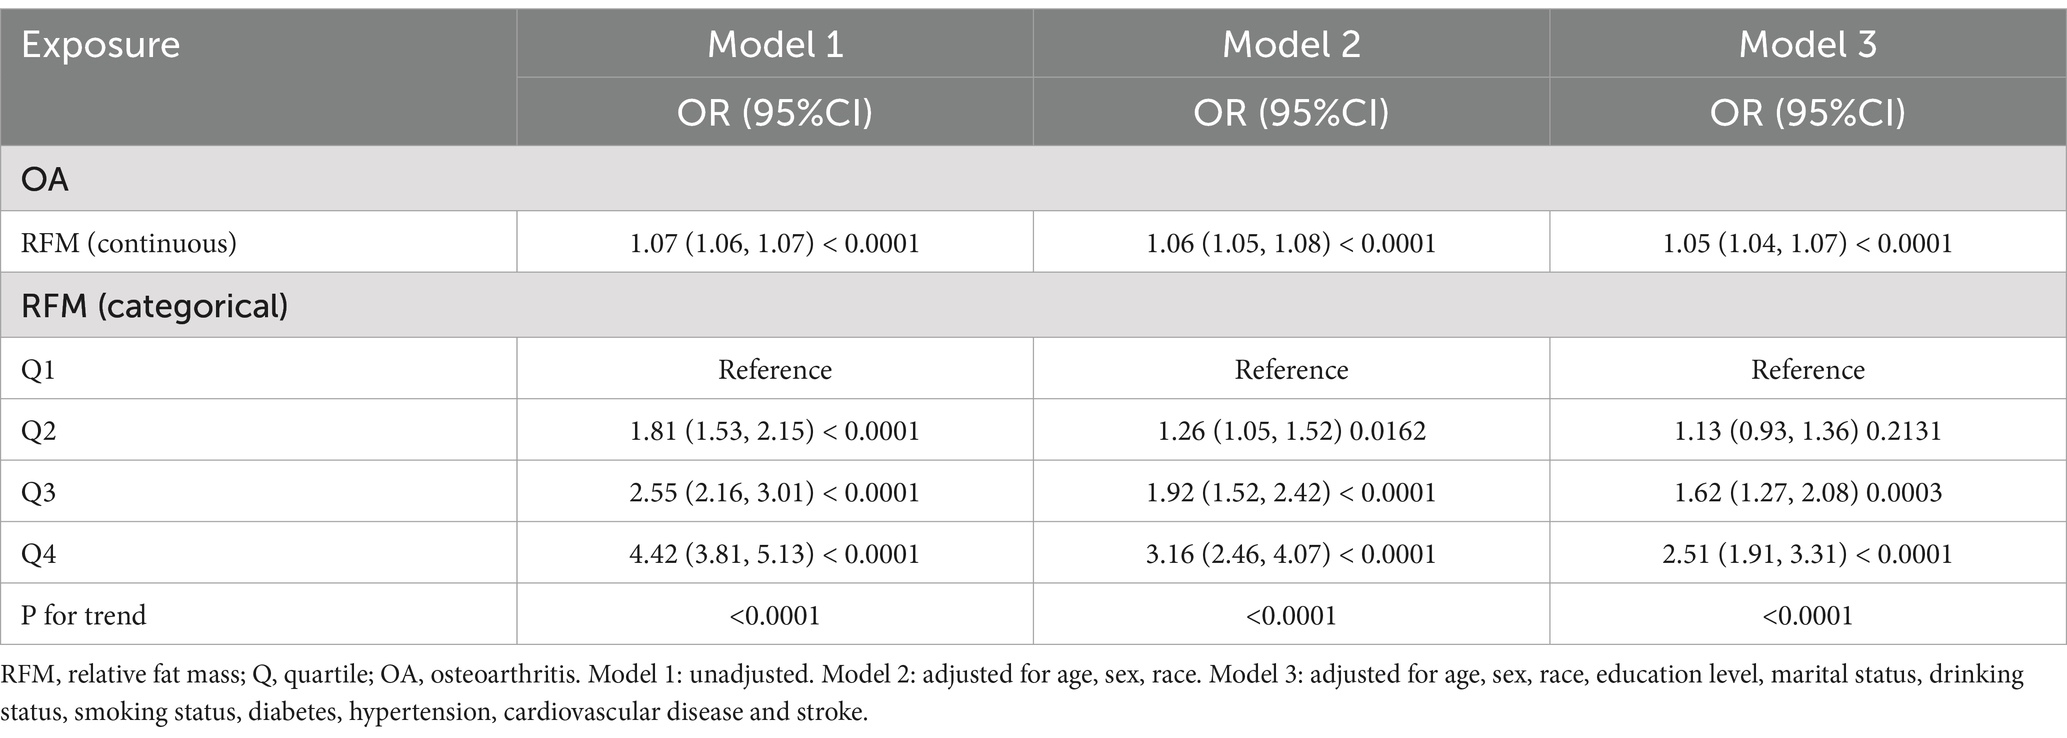
Table 2. Weighted multivariate logistic regression analysis of RFM and OA.
The threshold effect analysis revealed a statistically significant difference between the linear and piecewise linear regression models (p < 0.001). As shown in Table 3, the identified inflection point was 31.67. Below this threshold, the impact of RFM on OA risk was relatively modest, with each unit increase in RFM associated with a 2% increase in risk. However, above this threshold, the effect became substantially stronger, with each unit increase in RFM corresponding to a 7% increase in OA risk.
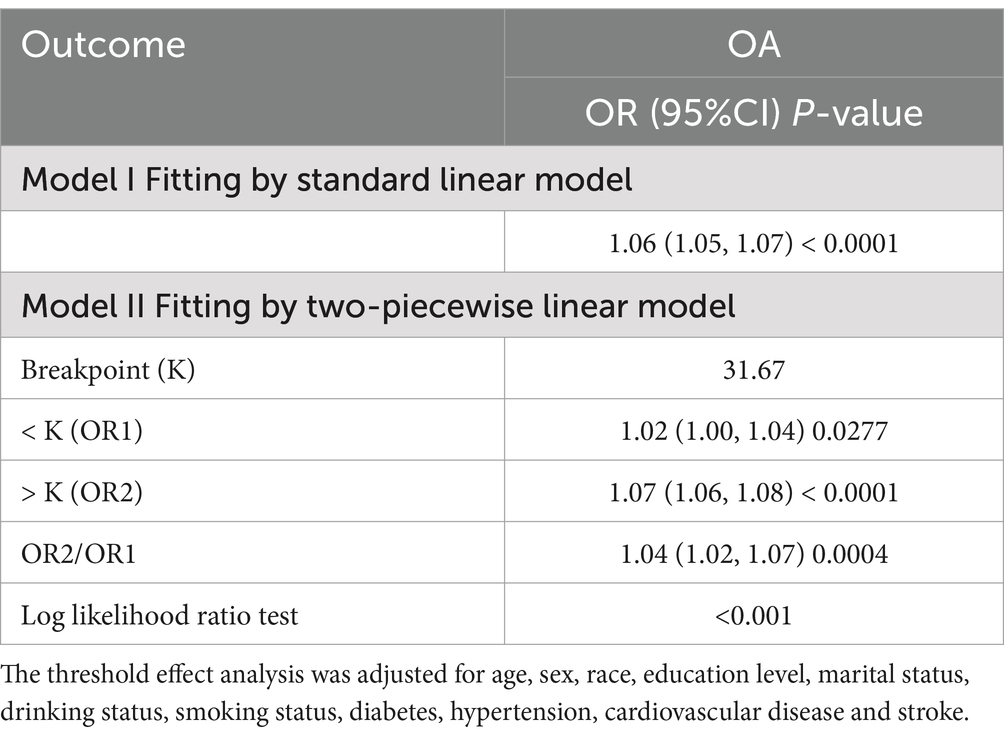
Table 3. Threshold effect analysis of the association of RFM with OA.
Subgroup analysis
To evaluate the robustness of the association between RFM and OA, we conducted subgroup analyses stratified by variables including age group, sex, smoking status, and the presence of hypertension, diabetes, CVD and stroke, with appropriate adjustments made for relevant confounding factors. As evidenced in Table 4, a consistently significant positive association between RFM and OA was observed across all subgroups. The interaction analysis revealed that age and diabetes significantly influenced the relationship between RFM and OA (P for interaction < 0.05). The smoothed fitting curves for other groups can be found in the Supplementary materials.
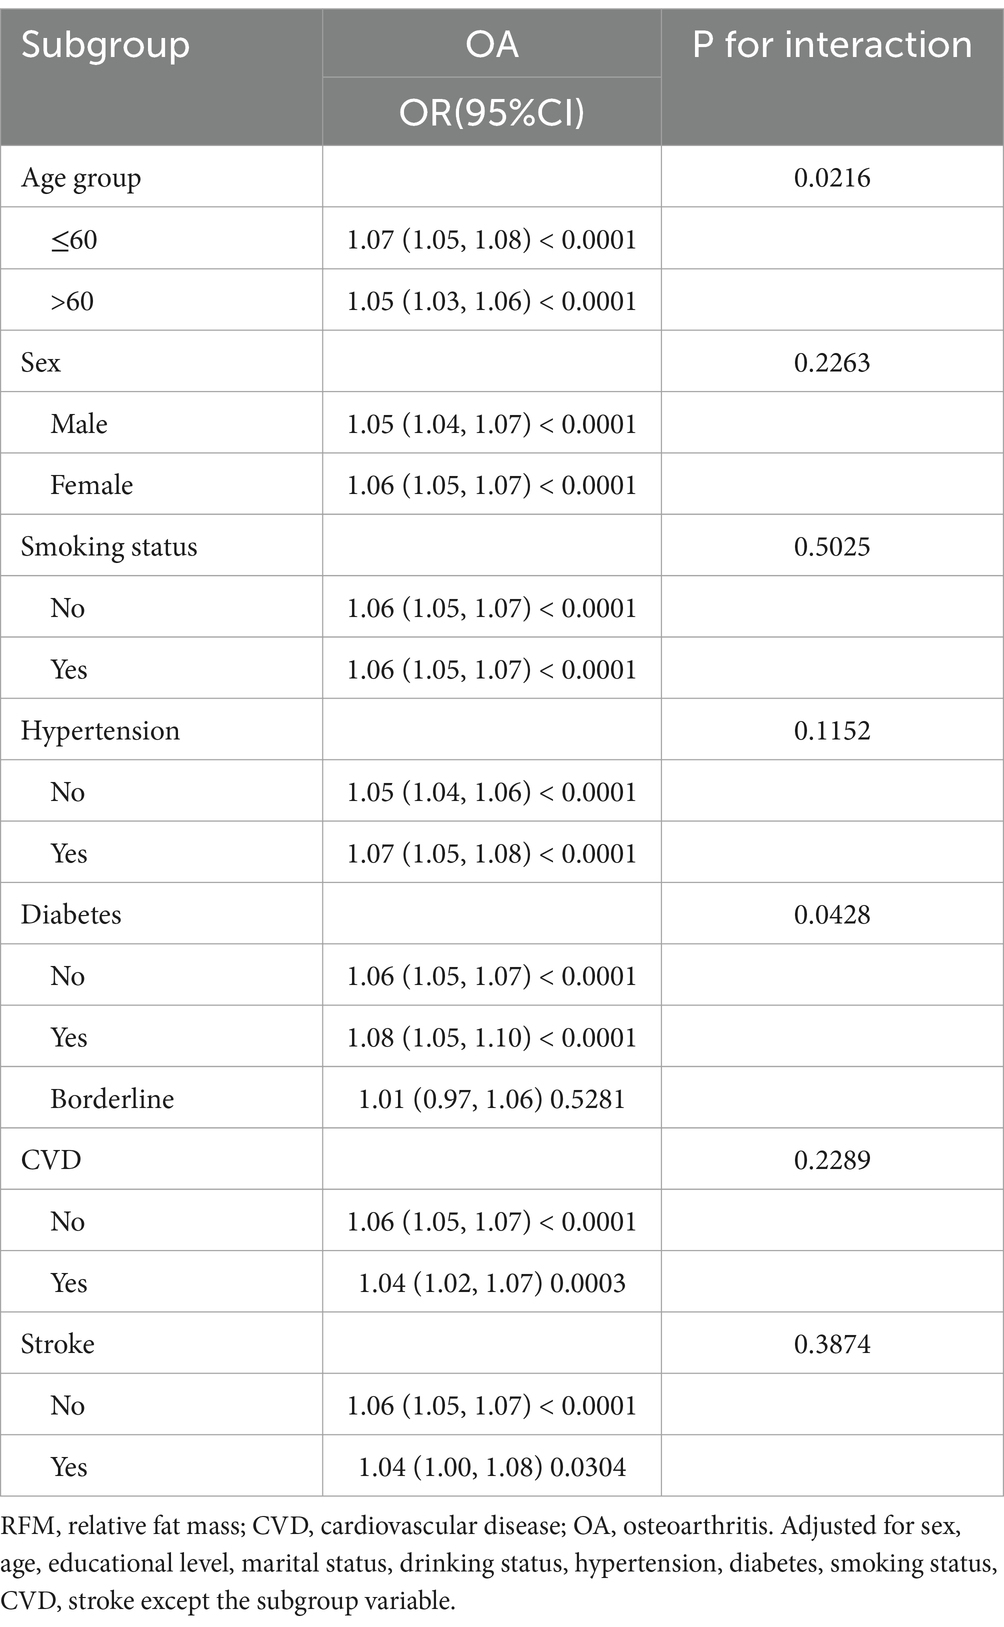
Table 4. Subgroup analysis of the association between RFM and OA.
We conducted smooth curve fitting to explore the association between RFM and OA across different age groups. The analysis was adjusted for age, sex, race, education level, marital status, drinking status, smoking status, diabetes, hypertension, cardiovascular disease, and stroke (see Figure 3).
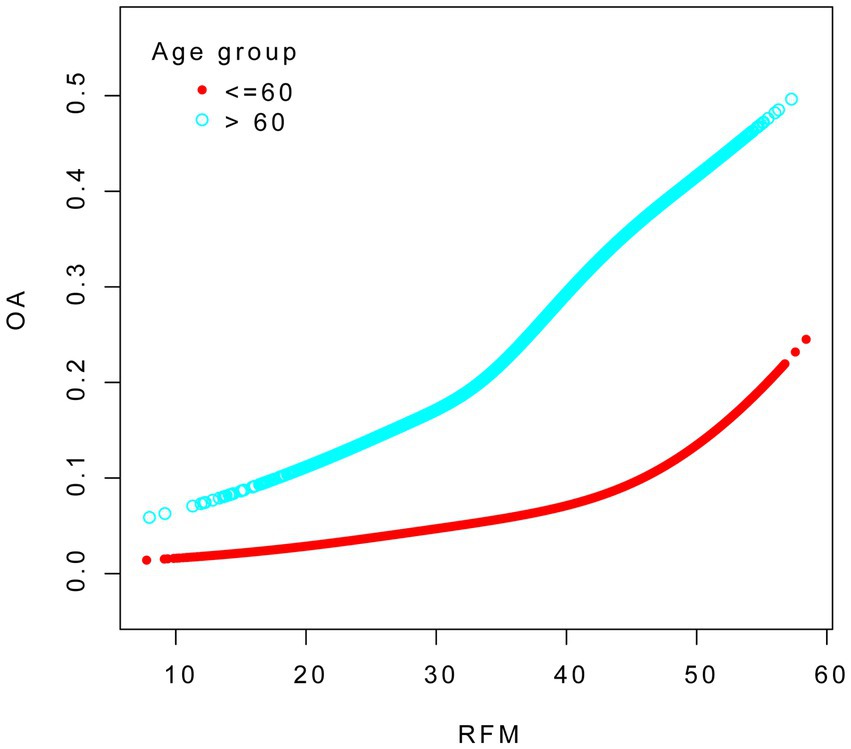
Figure 3. The association between RFM and OA in the strata for age.
We conducted smooth curve fitting to explore the association between RFM and OA across different diabetes groups. The analysis was adjusted for age, sex, race, education level, marital status, drinking status, smoking status, diabetes, hypertension, cardiovascular disease, and stroke (see Figure 4).

Figure 4. The association between RFM and OA in the strata for diabetes.
ROC analysis
Table 5 demonstrated the diagnostic performance of five different obesity indicators for OA assessment. The results showed that RFM provided superior discriminative ability and accuracy in predicting OA compared to other obesity indicators, including WAIST, BMI, waist-to-height ratio (WTHR), and WT, with area under the curve (AUC) values of 0.646 (see Figure 5).
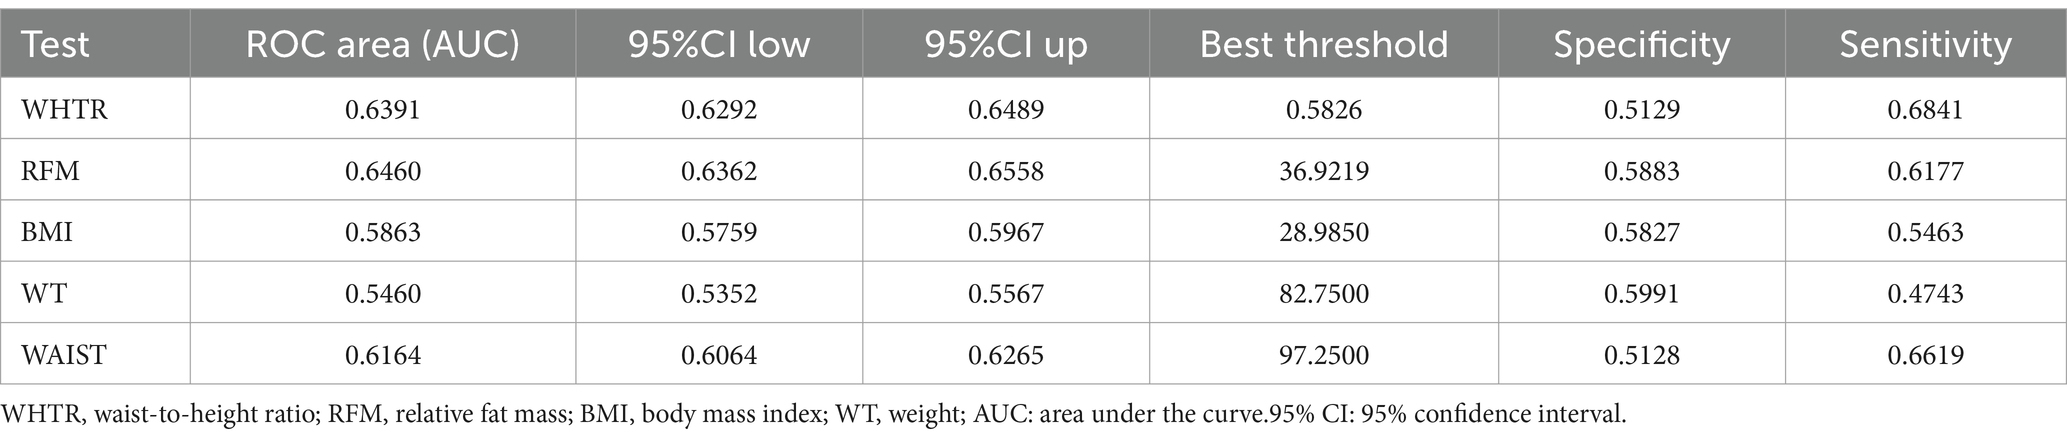
Table 5. The adiposity indicators for predicting OA.
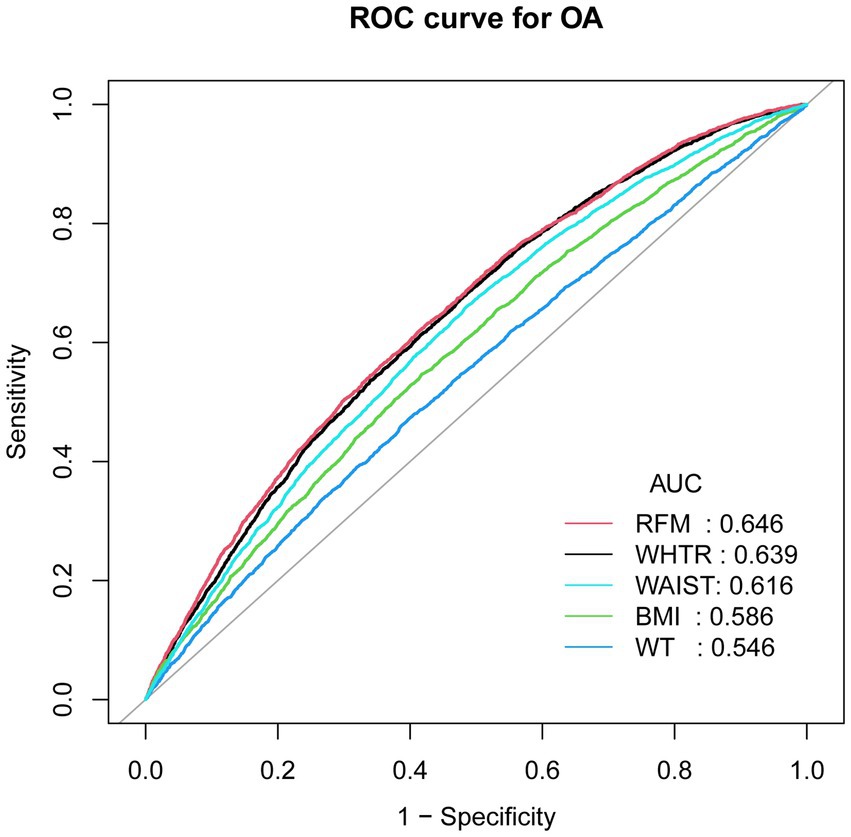
Figure 5. ROC curves and the AUC values of five obesity indicators (RFM, WHTR, WAIST, BMI and WT) in diagnosing OA.
Discussion
This study primarily aimed to examine the association between RFM and OA in a nationally representative sample. In this cross-sectional study encompassing 28,535 participants, those with OA exhibited markedly elevated RFM levels compared to non-OA individuals, even after adjusting for confounding factors. Subgroup analyses and interaction tests consistently demonstrated a positive correlation between RFM and OA across all examined subgroups. The ROC analysis further indicated that RFM may serve as a more reliable predictor of OA relative to other anthropometric measures, including WWI, BMI, WT, and WTHR, exhibiting superior discriminative capability for OA evaluation. This study highlights the clinical utility of RFM as a predictive biomarker, highlighting that increased levels of RFM are linked to a higher prevalence of OA.
Given the widespread nature of both obesity and OA, which negatively impact individual health and quality of life while also presenting a considerable public health challenge, understanding this relationship is crucial. Notably, obesity is a well-established risk factor for OA, particularly concerning knee osteoarthritis and hip osteoarthritis. Our findings demonstrated that even after adjusting for the most comprehensive covariates in Model 3, there remained a significant positive association between RFM and the risk of OA, regardless of whether RFM was treated as a continuous or categorical variable. Notably, the OR for the highest RFM quartile (Q4) decreases across models—from 4.42 in Model 1, to 3.16 in Model 2, and to 2.51 in Model 3—suggesting that demographic and metabolic factors may partially mediate the observed association. Previous studies using logistic regression analysis have also confirmed that higher levels of RFM were significantly associated with an increased risk of OA (22). A case–control study involving 400 participants demonstrated a significant positive association between obesity and KOA incidence, with obese participants (BMI ≥ 25 kg/m2) exhibiting an elevated disease risk compared to normal-weight (23). Moreover, A population-based cohort study revealed that both overweight and obesity significantly increase the likelihood of developing osteoarthritis in the hands, hips, and knees (24). Notably, KOA exhibited a dose–response relationship with increasing BMI (24). In addition, a cross-sectional survey of Brazil’s obese population revealed a substantially elevated prevalence of self-reported joint pain, as well as hip and knee osteoarthritis (25).
Furthermore, various adiposity metrics beyond BMI including waist circumference (WC) and Weight-Adjusted Waist Index (WWI), demonstrate notable correlations with OA risk. A study conducted among the adult in the United States indicated that higher WWI values were significantly associated with greater OA risk (26). Another study also revealed a significant positive relationship between WWI and OA prevalence, suggesting that higher WWI values were associated with an elevated OA risk (21). A cross-sectional analysis identified a significant relationship between KOA and WC, revealing a particularly pronounced association in males with a WC > 102 cm and females with WC > 88 cm (27). In addition, a comprehensive study in South Korea validated that increased WC was associated with a increased risk of OA (28). RFM appears to represent a more reliable measure for evaluating obesity-OA associations in comparison to conventional metrics. Unlike BMI, RFM provides a more precise evaluation of body fat distribution and has shown a stronger correlation with DXA-measured adiposity indices (17, 29, 30). Moreover, our findings indicate that RFM demonstrates superior predictive performance compared to other obesity indicators, including WHTR, BMI, WT and WAIST. Consistent with our findings, a cross-sectional study involving 81 young Brazilian men also demonstrated that RFM has a stronger association with body fat compared to BMI (30). Similarly, another cross-sectional study showed that RFM demonstrated superior predictive performance for gallstones compared to WHTR, based on area under the ROC curve (AUC) analysis (0.696 VS 0.674) (31). In our study, individuals in Q4 (the highest RFM group) also exhibit a significantly greater risk of developing OA. Given the identified RFM threshold, regular monitoring of RFM may be beneficial from a public health perspective. Early identification of individuals approaching or exceeding this inflection point could facilitate timely interventions, thereby contributing to the prevention of obesity-related conditions such as osteoarthritis and promoting overall health. In addition, patients should be encouraged to engage in regular physical activity, maintain a healthy weight, and strive to keep their RFM within an optimal range, which may help reduce the incidence of OA.
Our study elucidated the complex interplay between obesity and OA. The analysis revealed that each 1-unit increase in RFM was associated with a 5% greater risk of OA. As evident from the RFM formula, waist circumference is the only modifiable variable. Based on the average height for males and females, we estimate that a 1-unit change in RFM corresponds approximately to a 3 cm change in waist circumference for individuals near the risk threshold (waist circumference >102 cm for males and >88 cm for females) (32). For individuals with higher waist circumferences, the same 1-unit change in RFM may correspond to approximately a 4 cm change in waist circumference. These findings suggest that monitoring and managing RFM—particularly through waist circumference control—may serve as an important preventive strategy for OA. Subgroup analyses revealed significant association between RFM and OA, with particularly pronounced variations across age and in participants with versus without diabetes. Age is a well-established risk factor for OA pathogenesis. With advancing age, articular cartilage undergoes progressive dehydration and chondrocyte depletion, contributing to structural degeneration (33). The age-associated chronic low-grade inflammatory state (inflammaging) also exacerbates OA progression through multiple pathways: enhanced antigenic exposure due to cartilage breakdown, accelerated cellular senescence in chondrocytes, and endocrine dysfunction affecting joint homeostasis (34). Moreover, age-related degeneration impacts all articular tissues, with the IFP exhibiting progressive fibrotic transformation and volume reduction (35). Accumulating evidence indicates that metabolic abnormalities induced by diabetes can alter the extracellular matrix components of cartilage cells (36). Moreover, it has been reported that nearly half of patients with DM suffer from various forms of arthritis (37).
Our research incorporates several important strengths. First, the large sample size (N = 28,535) significantly enhances the statistical power and reliability of the findings. Second, comprehensive subgroup analyses and adjustment for potential confounding factors improve the validity of the results. Third, RFM offers greater clinical applicability compared to alternative metrics due to its straightforward measurement process. Nevertheless, some limitations should be acknowledged. The cross-sectional design precludes causal inferences regarding the association between RFM and OA. Although we adjusted for multiple confounding variables, residual confounding from unmeasured factors remains possible. Additionally, while the NHANES provides nationally representative data for the United States, the external validity of findings may be constrained when considering populations with different demographic or clinical characteristics.
Conclusion
RFM was significantly associated with OA in the U. S. population. Compared to other obesity indicators, RFM offers superior practicality due to its ease of measurement, suggesting its potential utility in clinical OA assessment. However, prospective cohort studies are necessary to establish a more definitive causal relationship between RFM and OA.
Data availability statement
The original contributions presented in the study are included in the article/Supplementary material, further inquiries can be directed to the corresponding authors.
Ethics statement
The studies involving humans were approved by National Center for Health Statistics Ethics Review Board of the U.S. CDC. The studies were conducted in accordance with the local legislation and institutional requirements. The participants provided their written informed consent to participate in this study.
Author contributions
ZL: Methodology, Visualization, Writing – original draft. TY: Data curation, Supervision, Writing – original draft. YC: Investigation, Software, Writing – review & editing. JH: Data curation, Writing – review & editing. YJ: Conceptualization, Funding acquisition, Supervision, Writing – review & editing. WD: Funding acquisition, Writing – review & editing.
Funding
The author(s) declare that no financial support was received for the research and/or publication of this article.
Conflict of interest
The authors declare that the research was conducted in the absence of any commercial or financial relationships that could be construed as a potential conflict of interest.
Correction note
A correction has been made to this article. Details can be found at: 10.3389/fnut.2025.1659839.
Generative AI statement
The authors declare that no Gen AI was used in the creation of this manuscript.
Any alternative text (alt text) provided alongside figures in this article has been generated by Frontiers with the support of artificial intelligence and reasonable efforts have been made to ensure accuracy, including review by the authors wherever possible. If you identify any issues, please contact us.
Publisher’s note
All claims expressed in this article are solely those of the authors and do not necessarily represent those of their affiliated organizations, or those of the publisher, the editors and the reviewers. Any product that may be evaluated in this article, or claim that may be made by its manufacturer, is not guaranteed or endorsed by the publisher.
Supplementary material
The Supplementary material for this article can be found online at: https://www.frontiersin.org/articles/10.3389/fnut.2025.1610950/full#supplementary-material
Footnotes
References
1. Kwon, HM, Yang, I-H, Park, KK, Cho, B-W, Byun, J, and Lee, W-S. Cigarette smoking and knee osteoarthritis in the elderly: data from the Korean National Health and nutritional examination survey. Exp Gerontol. (2020) 133:110873. doi: 10.1016/j.exger.2020.110873
2. Fontanella, CG, Belluzzi, E, Pozzuoli, A, Scioni, M, Olivotto, E, Reale, D, et al. Exploring anatomo-morphometric characteristics of infrapatellar, suprapatellar fat pad, and knee ligaments in osteoarthritis compared to post-traumatic lesions. Biomedicines. (2022) 10:1369. doi: 10.3390/biomedicines10061369
3. Ding, Y, Liu, X, Chen, C, Yin, C, and Sun, X. Global, regional, and national trends in osteoarthritis disability-adjusted life years (DALYs) from 1990 to 2019: a comprehensive analysis of the global burden of disease study. Public Health. (2024) 226:261–72. doi: 10.1016/j.puhe.2023.10.030
4. O'Neill, TW, McCabe, PS, and McBeth, J. Update on the epidemiology, risk factors and disease outcomes of osteoarthritis. Best Pract Res Clin Rheumatol. (2018) 32:312–26. doi: 10.1016/j.berh.2018.10.007
5. Montero, A, Mulero, J-F, Tornero, C, Guitart, J, and Serrano, M. Pain, disability and health-related quality of life in osteoarthritis—joint matters: an observational, multi-specialty trans-national follow-up study. Clin Rheumatol. (2016) 35:2293–305. doi: 10.1007/s10067-016-3248-3
6. Loeser, RF. Aging and osteoarthritis. Curr Opin Rheumatol. (2011) 23:492–6. doi: 10.1097/BOR.0b013e3283494005
7. Prieto-Alhambra, D, Judge, A, Javaid, MK, Cooper, C, Diez-Perez, A, and Arden, NK. Incidence and risk factors for clinically diagnosed knee, hip and hand osteoarthritis: influences of age, gender and osteoarthritis affecting other joints. Ann Rheum Dis. (2014) 73:1659–64. doi: 10.1136/annrheumdis-2013-203355
8. Olivotto, E, Trisolino, G, Belluzzi, E, Lazzaro, A, Strazzari, A, Pozzuoli, A, et al. Macroscopic synovial inflammation correlates with symptoms and cartilage lesions in patients undergoing arthroscopic partial meniscectomy: a clinical study. J Clin Med. (2022) 11:4330. doi: 10.3390/jcm11154330
9. Park, D, Park, YM, Ko, SH, Hyun, KS, Choi, YH, Min, DU, et al. Association of general and central obesity, and their changes with risk of knee osteoarthritis: a nationwide population-based cohort study. Sci Rep. (2023) 13:3796. doi: 10.1038/s41598-023-30727-4
10. Salih, S, and Sutton, P. Obesity, knee osteoarthritis and knee arthroplasty: a review. BMC Sports Sci Med Rehabil. (2013) 5:25. doi: 10.1186/2052-1847-5-25
11. Kershaw, EE, and Flier, JS. Adipose tissue as an endocrine organ. J Clin Endocrinol Metabol. (2004) 89:2548–56. doi: 10.1210/jc.2004-0395
12. Vázquez-Vela, MEF, Torres, N, and Tovar, AR. White adipose tissue as endocrine organ and its role in obesity. Arch Med Res. (2008) 39:715–28. doi: 10.1016/j.arcmed.2008.09.005
13. Xie, C, and Chen, Q. Adipokines: new therapeutic target for osteoarthritis? Curr Rheumatol Rep. (2019) 21:1–9. doi: 10.1007/s11926-019-0868-z
14. Ilia, I, Nitusca, D, and Marian, C. Adiponectin in osteoarthritis: pathophysiology, relationship with obesity and presumptive diagnostic biomarker potential. Diagnostics. (2022) 12:455. doi: 10.3390/diagnostics12020455
15. Ross, R, Neeland, IJ, Yamashita, S, Shai, I, Seidell, J, Magni, P, et al. Waist circumference as a vital sign in clinical practice: a consensus statement from the IAS and ICCR working group on visceral obesity. Nat Rev Endocrinol. (2020) 16:177–89. doi: 10.1038/s41574-019-0310-7
16. Piché, ME, Poirier, P, Lemieux, I, and Després, JP. Overview of epidemiology and contribution of obesity and body fat distribution to cardiovascular disease: an update. Prog Cardiovasc Dis. (2018) 61:103–13. doi: 10.1016/j.pcad.2018.06.004
17. Woolcott, OO, and Bergman, RN. Relative fat mass (RFM) as a new estimator of whole-body fat percentage ─ a cross-sectional study in American adult individuals. Sci Rep. (2018) 8:10980. doi: 10.1038/s41598-018-29362-1
18. Zheng, Y, Huang, C, Jin, J, Zhao, Y, Cui, H, and Wei, C. Association between stroke and relative fat mass: a cross-sectional study based on NHANES. Lipids Health Dis. (2024) 23:354. doi: 10.1186/s12944-024-02351-2
19. Zhu, X, Yue, Y, Li, L, Zhu, L, Cai, Y, and Shu, Y. The relationship between depression and relative fat mass (RFM): a population-based study. J Affect Disord. (2024) 356:323–8. doi: 10.1016/j.jad.2024.04.031
20. Wang, D, Chen, Z, Wu, Y, Ren, J, Shen, D, Hu, G, et al. Association between two novel anthropometric measures and type 2 diabetes in a Chinese population. Diabetes Obes Metab. (2024) 26:3238–47. doi: 10.1111/dom.15651
21. Wang, X, Xie, L, and Yang, S. Association between weight-adjusted-waist index and the prevalence of rheumatoid arthritis and osteoarthritis: a population-based study. BMC Musculoskelet Disord. (2023) 24:595. doi: 10.1186/s12891-023-06717-y
22. Ren, X, Wang, J, Wang, J, Wang, G, Ren, H, Xu, P, et al. Association between conicity index (C-index), relative fat mass (RFM), and osteoarthritis (OA): evidence from NHANES 2003-2018. Lipids Health Dis. (2025) 24:140. doi: 10.1186/s12944-025-02558-x
23. Khan, B, Khan, OY, Zehra, S, Azhar, A, and Fatima, S. Association between obesity and risk of knee osteoarthritis. Pak J Pharm Sci. (2020) 33:295–8. doi: 10.36721/PJPS.2020.33.1.SUP.295-298.1
24. Reyes, C, Leyland, KM, Peat, G, Cooper, C, Arden, NK, and Prieto-Alhambra, D. Association between overweight and obesity and risk of clinically diagnosed knee, hip, and hand osteoarthritis: a population-based cohort study. Arthritis Rheumatol. (2016) 68:1869–75. doi: 10.1002/art.39707
25. Pacca, DM, De-Campos, GC, Zorzi, AR, Chaim, EA, and De-Miranda, JB. Prevalence of joint pain and osteoarthritis in obese brazilian population. ABCD. (2018) 31:e1344. doi: 10.1590/0102-672020180001e1344
26. Li, X, Huang, P, Wang, H, Hu, Z, Zheng, S, Yang, J, et al. Relationship between weight-adjusted waist index (WWI) and osteoarthritis: a cross-sectional study using NHANES data. Sci Rep. (2024) 14:28554. doi: 10.1038/s41598-024-80151-5
27. Vasilic-Brasnjevic, S, Marinkovic, J, Vlajinac, H, Vasiljevic, N, Jakovljevic, B, Nikic, M, et al. Association of body mass index and waist circumference with severity of knee osteoarthritis. Acta Reumatol Port. (2016) 41:226–31.
28. Kim, JE, Huh, Y, Lee, JH, Kim, S, Kim, HJ, Park, HJ, et al. Association of body mass index and waist circumference with osteoarthritis among Korean adults: a nationwide study. Korean J Family Med. (2024) 45:157–63. doi: 10.4082/kjfm.23.0178
29. Wang, L, Cao, S, and Song, G. The role of relative fat mass in gallstone risk assessment: findings from the NHANES 2017-2020 survey. Front Nutr. (2025) 12:1575524. doi: 10.3389/fnut.2025.1575524
30. Corrêa, CR, Formolo, NPS, Dezanetti, T, Speretta, GFF, and Nunes, EA. Relative fat mass is a better tool to diagnose high adiposity when compared to body mass index in young male adults: a cross-section study. Clin Nutr ESPEN. (2021) 41:225–33. doi: 10.1016/j.clnesp.2020.12.009
31. Lin, X, Lin, H, Xu, J, Yang, S, and Miao, L. Relative fat mass as a predictor of gallstones: insights from national health and nutrition examination survey data. Lipids Health Dis. (2025) 24:78. doi: 10.1186/s12944-025-02480-2
32. Brumpton, B, Langhammer, A, Romundstad, P, Chen, Y, and Mai, XM. General and abdominal obesity and incident asthma in adults: the HUNT study. Eur Respir J. (2013) 41:323–9. doi: 10.1183/09031936.00012112
33. Sacitharan, PK. Ageing and osteoarthritis. Biochem Cell Biol Ageing. (2019) 91:123–59. doi: 10.1007/978-981-13-3681-2_6
34. Greene, MA, and Loeser, RF. Aging-related inflammation in osteoarthritis. Osteoarthr Cartil. (2015) 23:1966–71. doi: 10.1016/j.joca.2015.01.008
35. Wang, MG, Seale, P, and Furman, D. The infrapatellar fat pad in inflammaging, knee joint health, and osteoarthritis. NPJ Aging. (2024) 10:34. doi: 10.1038/s41514-024-00159-z
36. King, K, and Rosenthal, A. The adverse effects of diabetes on osteoarthritis: update on clinical evidence and molecular mechanisms. Osteoarthr Cartil. (2015) 23:841–50. doi: 10.1016/j.joca.2015.03.031
37. Cheng, YJ, Imperatore, G, Caspersen, CJ, Gregg, EW, Albright, AL, and Helmick, CG. Prevalence of diagnosed arthritis and arthritis-attributable activity limitation among adults with and without diagnosed diabetes: United States, 2008–2010. Diabetes Care. (2012) 35:1686–91. doi: 10.2337/dc12-0046
Keywords: RFM, NHANES, osteoarthritis, obesity, cross-sectional study
Citation: Li Z, Yin T, Chen Y, Huang J, Jiang Y and Deng W (2025) Association between relative fat mass and osteoarthritis in American adults. Front. Nutr. 12:1610950. doi: 10.3389/fnut.2025.1610950
Edited by:
Aaron Zefrin Fernandis, MSD International GmBH, SingaporeReviewed by:
Assunta Pozzuoli, University of Padua, ItalyDesiree Abdurrachim, Merck Sharp & Dohme Corp, Singapore
Copyright © 2025 Li, Yin, Chen, Huang, Jiang and Deng. This is an open-access article distributed under the terms of the Creative Commons Attribution License (CC BY). The use, distribution or reproduction in other forums is permitted, provided the original author(s) and the copyright owner(s) are credited and that the original publication in this journal is cited, in accordance with accepted academic practice. No use, distribution or reproduction is permitted which does not comply with these terms.
*Correspondence: Wei Deng, MTc3MDEyMjMwMTVAMTYzLmNvbQ==; Yuanyue Jiang, anl5ZGVnendAMTYzLmNvbQ==
†These authors have contributed equally to this work