 Ryota Wakayama
 Tao Yu
 Adam Drewnowski
 Satoshi Takasugi
 Tomohito Horimoto1
- 1Meiji Co., Ltd., Chuo City, Tokyo, Japan
- 2Center for Public Health Nutrition, University of Washington, Seattle, WA, United States
- 3Department of Nutrition and Health, Faculty of Nutritional Science, Sagami Women's University, Sagamihara, Kanagawa, Japan
Background: The Meiji Nutritional Profiling System (Meiji NPS) takes into account life-stage differences and addresses specific health challenges in different age groups in Japan.
Objectives: This study aimed to develop the Meiji NPS for younger (3–5 years) and older (6–11 years) children to encourage product reformulation and promote proper growth and development.
Methods: Meiji NPS scores for 1,091 foods listed in the Japanese Food Standard Composition Table were calculated and compared with nutrient profiles (NPs) for children developed by the WHO Regional Office for the Western Pacific or Nutrient-Rich Foods Index 9.3 (NRF9.3).
Results: For younger children, the Meiji NPS scores ranged from −442.3 to 423.9, and for older children, the Meiji NPS scores ranged from −265.5 to 386.5. The Meiji NPS scores showed significant differences (p < 0.001) between healthy and unhealthy foods, when classified according to the WHO NP model. There was also a strong correlation between the Meiji NPS and NRF9.3, validating the new NPS system (r = 0.73).
Conclusion: The Meiji NPS for younger and older children may provide a useful incentive for Japanese food manufacturers to produce healthier products.
1 Introduction
The World Health Organization (WHO) defines nutrient profiling (NP) as the science of classifying foods according to their nutritional composition (1). NP models are designed to capture the overall nutrient density of foods and are generally expressed in terms of nutrients per 100 kcal, 100 g, or per serving size (2). The selection of specific index nutrients is based on the health concerns and nutrient needs of the population (3–7). The main purpose of NP models is to improve diet quality, a vital component of health promotion and disease prevention (1).
The WHO specifies that NP models should address identified challenges in population health (1). One such challenge is the increasing prevalence of over-nutrition, which leads to obesity and overweight (8). Most NP models, including the one developed by the WHO for the Western Pacific region (9), penalize calories, added sugars, saturated fats, and salt. However, inadequate nutrition is still prevalent and can vary according to life stage. The Health Japan 21 report has emphasized the importance of a life-course approach for the Japanese population (10). Nutrition-related health challenges in Japan include inadequate nutrition among children, lifestyle-related diseases and thinness among young women (11–22), and nutrient deficits and frailty among older adults (23, 24).
The Meiji Nutritional Profiling System (NPS) is sensitive to life-stage differences in Japan (25–27). While the Meiji NPS for adults (≥12 years) and older adults (≥65 years) has already been developed, there is currently no NPS that addresses children's nutritional and health needs. Two health-related priorities were identified for younger (aged 3–5 years) and older (aged 6–11 years) children: ensuring adequate nutrition for optimal growth and development, which is crucial, and preventing childhood overweight and obesity, which are risk factors for future lifestyle-related diseases (10, 28–33). The proposed approach is to address health issues by creating NP models that are specific to each life stage.
Whereas many NP models, including the WHO model, are designed for consumer use, NP modeling can also provide value to the food industry. NP models have been used to support the front-of-pack (FOP) labels designed to steer children away from unhealthy foods (9, 34). By focusing on excess calories and nutrients to limit, these NP models justify restrictions on marketing and advertising targeted at children (5, 35). Nutrient profiling can also serve a complementary purpose, which may be even more valuable for global public health. Food manufacturers have used NP models to guide and benchmark product reformulation and to support the development of nutrient-rich foods (36–40). Product reformulation is the most valuable application of NP models in the food industry.
The present age-specific approach was used to develop a Meiji NPS for younger and older children, based on their nutrition needs. The Meiji NPS framework would then provide scientific support for product reformulation for each age group in Japan and thus improve the quality of the food supply. To the best of our knowledge, no previous NPS had listed the reformulation of food products for Japanese children as its main goal. This study focused on childhood nutrition to support optimal growth and development, as predictors of future good health. Food manufacturers may identify the Meiji NPS framework useful to develop healthier products.
2 Materials and methods
2.1 Scope of the Meiji NPS for children
The present study aimed to develop a version of the Meiji NPS that is age-sensitive and specifically tailored to the nutritional needs of younger (ages 3–5 years) and older (ages 6–11 years) children. The previously published (25) the Meiji NPS for adults and older adults is based on nutrients to encourage, food groups to encourage, and nutrients to limit. The ratios of each component were calculated relative to age-appropriate reference daily values (RDVs) (25). Consistent with the Nutri-Score and Health Star Rating, the Meiji NPS includes energy among the elements to be limited.
2.2 Selection of nutrients and food groups for the Meiji NPS for children
The new Meiji NPS for children was also based on nutrients to encourage, food groups to encourage, and nutrients to limit. Nutrients to encourage were protein, dietary fiber, calcium, iron, and vitamin D (25). These nutrients are important for children's growth and development (41–48) but are consumed by children in inadequate amounts, according to the Dietary Reference Intakes for Japan (2020) (11) and the 2019 National Health and Nutrition Survey (49). Nutrients to limit were energy, saturated fatty acids (SFAs), sugar (the sum of glucose, galactose, fructose, maltose, sucrose, and lactose), and salt equivalents. The WHO NP model included similar nutrients to limit (9). The food groups to encourage included dairy, fruits, vegetables, nuts, and legumes (25, 50). In Japan, school lunches provide balanced meals supplying the necessary nutrients (51, 52). However, given that there are ~160 school holidays in a year (53), the days without school lunches may adversely affect children's overall diet quality.
2.3 Algorithms of the Meiji NPS for children
The Meiji NPS is based on the Nutrient-Rich Foods Index 9.3 (NRF9.3), a well-established and validated NP model (54–56). The Meiji NPS has also been validated based on convergent and predictive validity in the Japanese population (25–27). The algorithms of the Meiji NPS for children are based on both NRF9.3 and the Meiji NPS for adults. The Meiji NPS for children calculates scores based on the ratios of nutrients to encourage, nutrients to limit, and food groups to encourage, relative to their RDVs per 100 g or per serving size (Equations 1, 2).
2.4 Age-appropriate RDVs
The Meiji NPS calculations per 100 g and serving size (25, 26) used RDVs for nutrients to encourage and those to limit. The RDVs were obtained from the Dietary Reference Intakes for Japan (11) and by the WHO recommendations (57, 58). RDVs for food groups to encourage in the Meiji NPS for adults were based on Health Japan 21 (59) and EAT-Lancet planetary health diet guidelines (60). For children, the current RDVs were calculated by adjusting the RDV of the energy set in the Meiji NPS for adults according to the children's energy needs. Specifically, the ratios were 46% for younger children (1,300 kcal/2,800 kcal, 46%) and 80% for older children (2,250 kcal/2,800 kcal, 80%). A 100% cap was not applied for nutrients to limit, consistent with the WHO NP model, which prioritizes nutrients to limit. The age-appropriate nutrient standards and 100% RDV caps are summarized in Table 1.
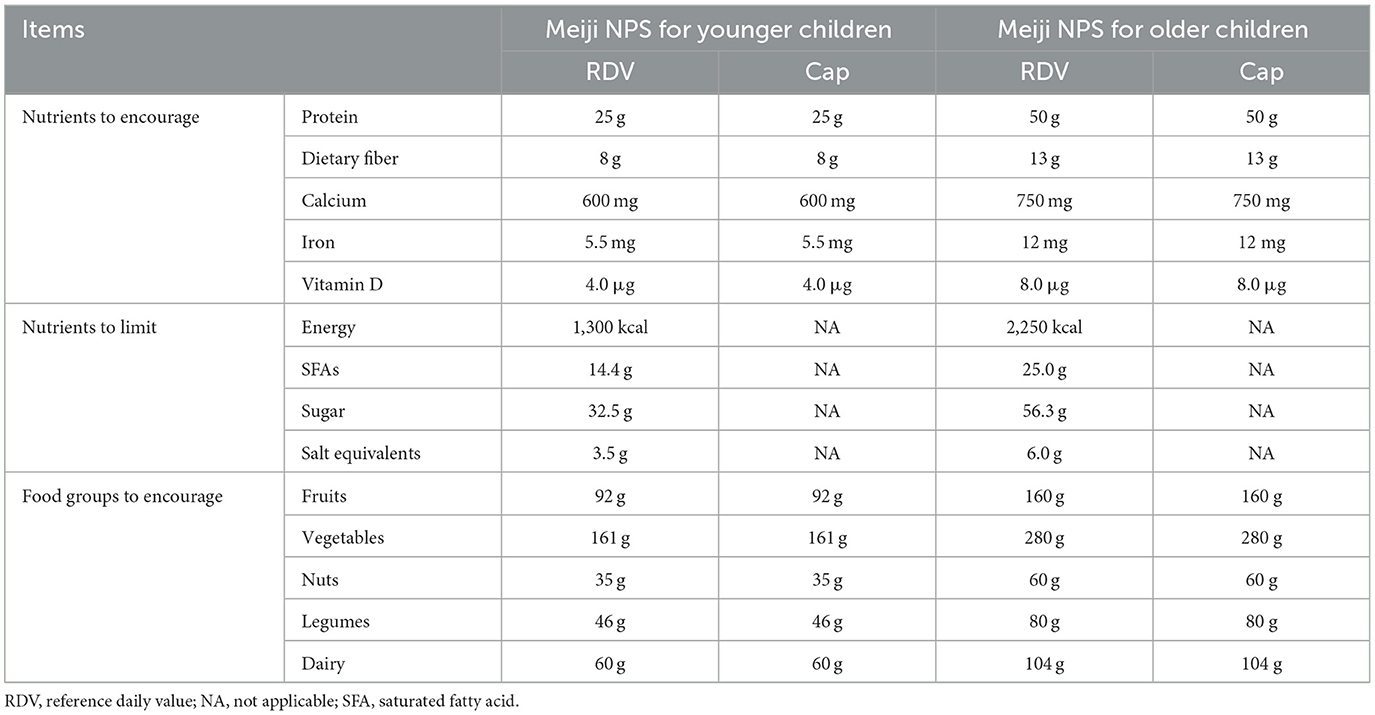
Table 1. RDVs and caps of the Meiji NPS for younger children and older children.
2.5 Serving size for younger and older children
There are no official government-mandated serving sizes in Japan. However, serving sizes, expressed as one or more edible quantities for a single food item, are summarized in “Ordinary serving values food composition tables” (61). Serving sizes for children were calculated by applying energy ratios to the serving sizes listed (46% for younger children and 80% for older children).
2.6 The WHO NP model
The WHO NP model is regarded as a critical tool for implementing restrictions on food marketing for children (9). It provides a means to distinguish the foods that are likely to be part of a healthy diet (“healthy”) from those that are not (“unhealthy”). Unhealthy foods are defined as those that may contribute to an excessive intake of energy, SFAs, transfats, sugar, and salt. The WHO NP model sets thresholds for total fat, total sugar, added sugar, non-sugar sweeteners (NSS), energy, SFAs, and sodium. Each food category had different thresholds, and foods that exceeded these thresholds were classified as unhealthy. For categories 1 (chocolate and sugar confectionery, energy bars, sweet toppings, and desserts), 2 (cakes, sweet biscuits and pastries, and other sweet bakery products and dry mixes), and 4c (energy drinks, tea, and coffee), no thresholds were set, as none of the foods in these categories should be marketed to children. Therefore, in this study, these foods were considered unhealthy. We classified foods from the Japanese Food Standard Composition Table (62) into food categories based on the WHO NP model, using the category names, examples, and customs tariff codes, provided in the WHO NP guidelines, and determined whether each food was healthy, according to the thresholds.
2.7 Nutrient composition database
The Japanese Food Standard Composition Table 2020 Edition (8th edition), published by the Ministry of Education, Culture, Sports, Science, and Technology, Japan (62), lists 2,478 food items. Energy and nutrient content are expressed per 100 g. After excluding prepared meals, a total of 2,428 food items were obtained. Many of these items had missing data, particularly regarding total sugar content. Following previous studies (63–65), we set the sugar content to zero in raw or minimally processed seafood and meat. Food items with missing data in other categories were excluded, as were food items for which no portion sizes (edible quantities) were available, leading to an analytical sample of 1,091 food items. Meiji NPS scores per serving size for each food item were determined using the median Meiji NPS scores per serving size. The food composition table does not include data on the contents of the food groups to encourage. We set the food groups to encourage to 100% based on food category names, following previous methods (25, 26). For food items with specific fruit proportions, we adhered to the indicated ratios.
2.8 Validation and statistical analysis
The medians and interquartile ranges (IQRs) are used to express the Meiji NPS scores. The convergent validity of the Meiji NPS for both children per 100 g was tested using the WHO NP model and NRF9.3. The WHO NP model classifies foods as healthy or unhealthy based on the following content per 100 g of nutrients to limit: total fat, SFAs, total sugars, added sugars, NSS, and sodium. Energy was also included in the analysis. The Japanese Food Standard Composition Table (62) does not include data on added sugars or NSS. For food categories with set thresholds for added sugars or NSS in the WHO NP model and those without thresholds for total sugars, we used the stricter thresholds for total sugars. The 1,091 food items were classified as either healthy or unhealthy according to the WHO NP model. The food items classified into the healthy and unhealthy groups are presented using boxplots or histograms for all the food categories in the food composition table, as well as each food category. The differences in the Meiji NPS scores for children between the WHO unhealthy and healthy food groups were assessed using the Wilcoxon test. Spearman's correlation test was used to compare the Meiji NPS scores (per both 100 g and serving size) along with the NRF9.3 scores. All statistical analyses were conducted using the R software version 4.3.1 (The R Foundation for Statistical Computing, Vienna, Austria). A p-value of < 0.05 was considered statistically significant.
3 Results
3.1 The Meiji NPS for children per 100 g and per serving size
The Meiji NPS scores for the children were calculated for each of the 1,091 food items with complete nutritional information (Table 2). The Meiji NPS scores per 100 g for younger children ranged from −442.3 to 423.9 and for older children from −265.5 to 386.5. The median Meiji NPS scores for younger and older children were 81.4 and 46.7, respectively. No food items were classified as sugars and sweeteners, owing to the lack of nutrient data. Thus, the central tendency of this food category was not available.
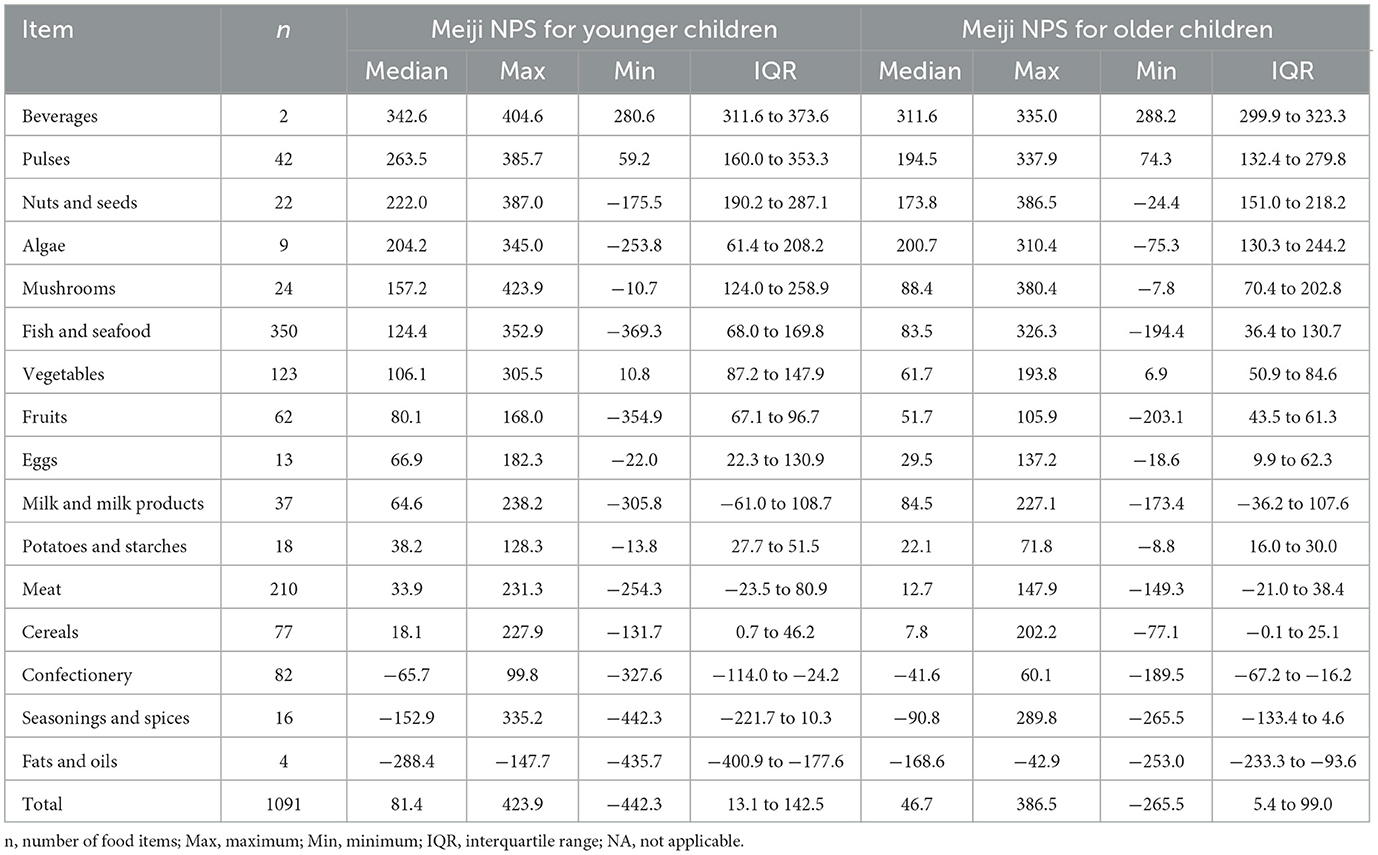
Table 2. Meiji NPS scores for younger and older children per 100 g by food category.
The Meiji NPS algorithm for younger and older children was used to calculate scores per serving size (Supplementary Table 1). Spearman's correlation coefficients between Meiji NPS per 100 g and NRF9.3 showed strong correlations of 0.734 and 0.733 for younger and older children, respectively (Supplementary Table 2) (66). An additional comparison between the Meiji NPS per serving size and NRF9.3 showed moderate correlations.
3.2 Comparing Meiji NPS for children to the WHO NP model by age group
Table 3 presents differences in Meiji NPS scores for foods classified as healthy or unhealthy based on the WHO NP model. The medians, means, standard deviations (SDs), and confidence intervals are provided for younger and older children. Significant differences were observed in Meiji NPS scores between foods classified as healthy and those classified as unhealthy by the WHO NP model. For younger children, the mean Meiji NPS scores for these two classes were 116.2 (healthy) and 21.8 (unhealthy; p < 0.001). Their median scores differed significantly (p < 0.001) between the two classes at 99.1 (healthy) and 14.4 (unhealthy). For older children, the mean Meiji NPS scores were 71.7 (healthy) and 29.5 (unhealthy) and the median Meiji NPS scores were 54.8 (healthy) and 5.6 (unhealthy), with a significant difference observed between the two groups (p < 0.001).
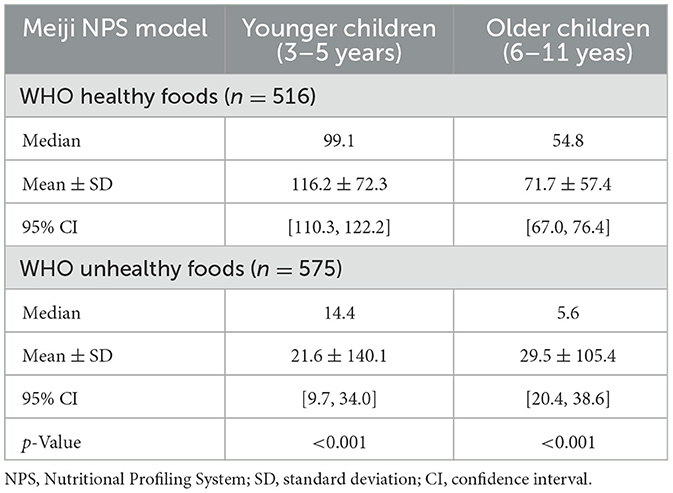
Table 3. Meiji NPS scores for foods classified by the WHO NP model as healthy and unhealthy.
Figures 1A, B show the distribution (histogram) of the Meiji NPS scores for foods classified by the WHO NP model as healthy and unhealthy, respectively, for younger (Figure 1A) and older children (Figure 1B). For younger children, the minimum Meiji NPS scores for healthy and unhealthy food items were −22.0 and −442.3, respectively. For older children, these minimum Meiji NPS scores were −18.6 (healthy) and −265.5 (unhealthy).
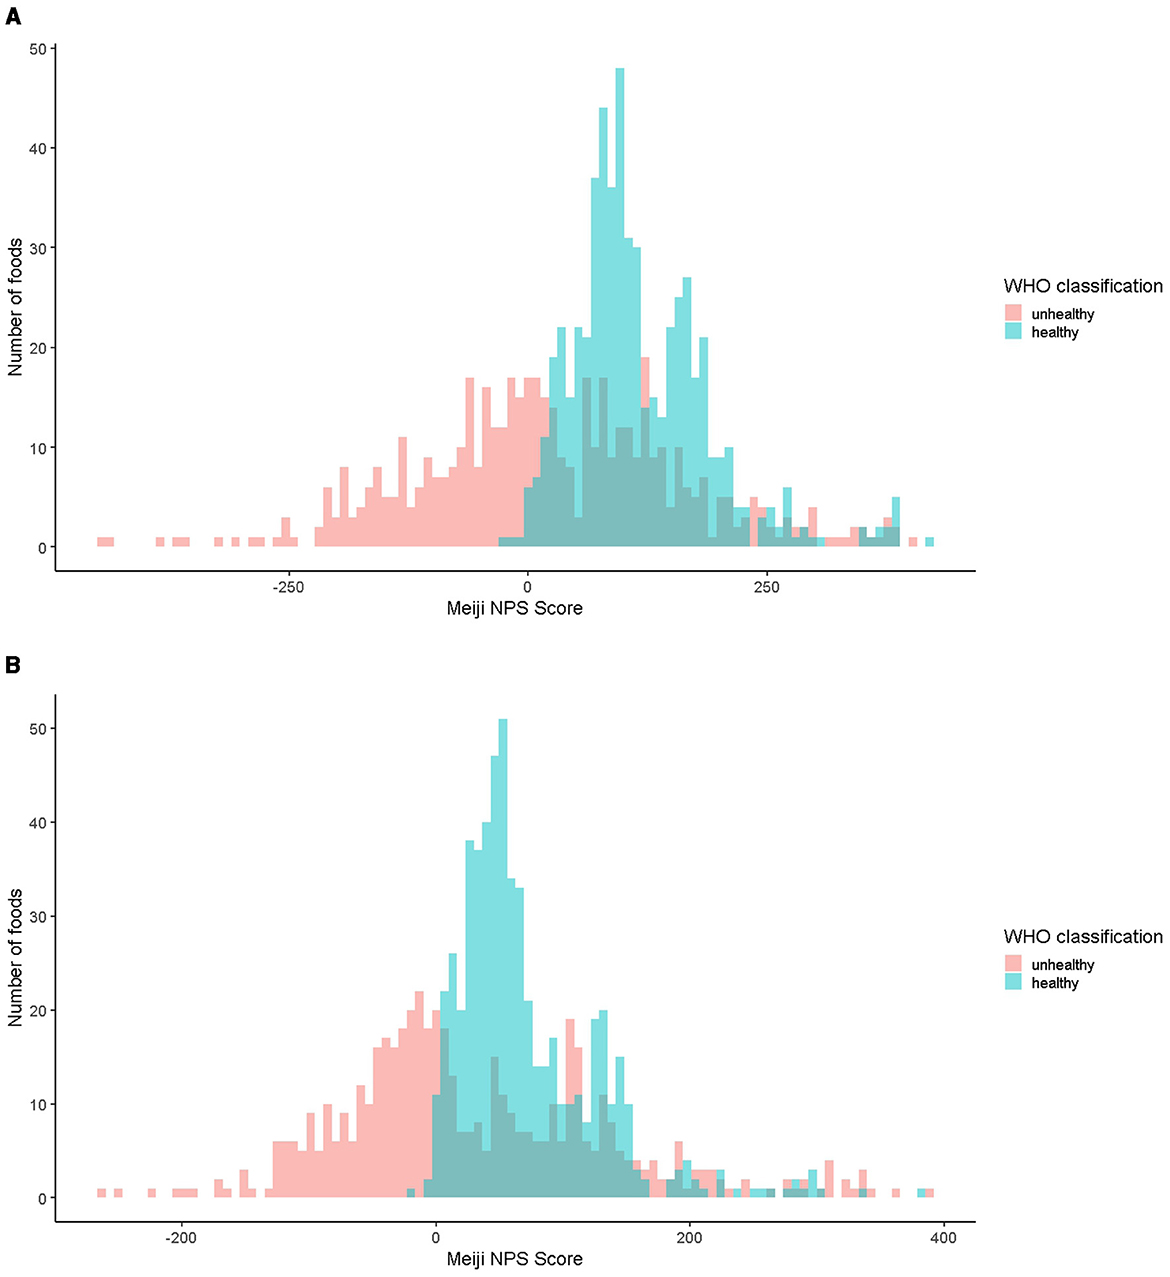
Figure 1. (A) Distribution of the Meiji NPS scores for younger children (histogram). (B) Distribution of the Meiji NPS scores for older children (histogram). Red indicates food items classified as unhealthy and blue as healthy. NPS, Nutritional Profiling System.
3.3 Comparing Meiji NPS to the WHO NP model by age group and food category
Figures 2, 3 show a comparison of the Meiji NPS for children with the WHO NP model by food category. Significant differences were observed in cereals, pulse vegetables, fruits, mushrooms, fish and seafood, and meat in the Meiji NPS for children (p < 0.05).
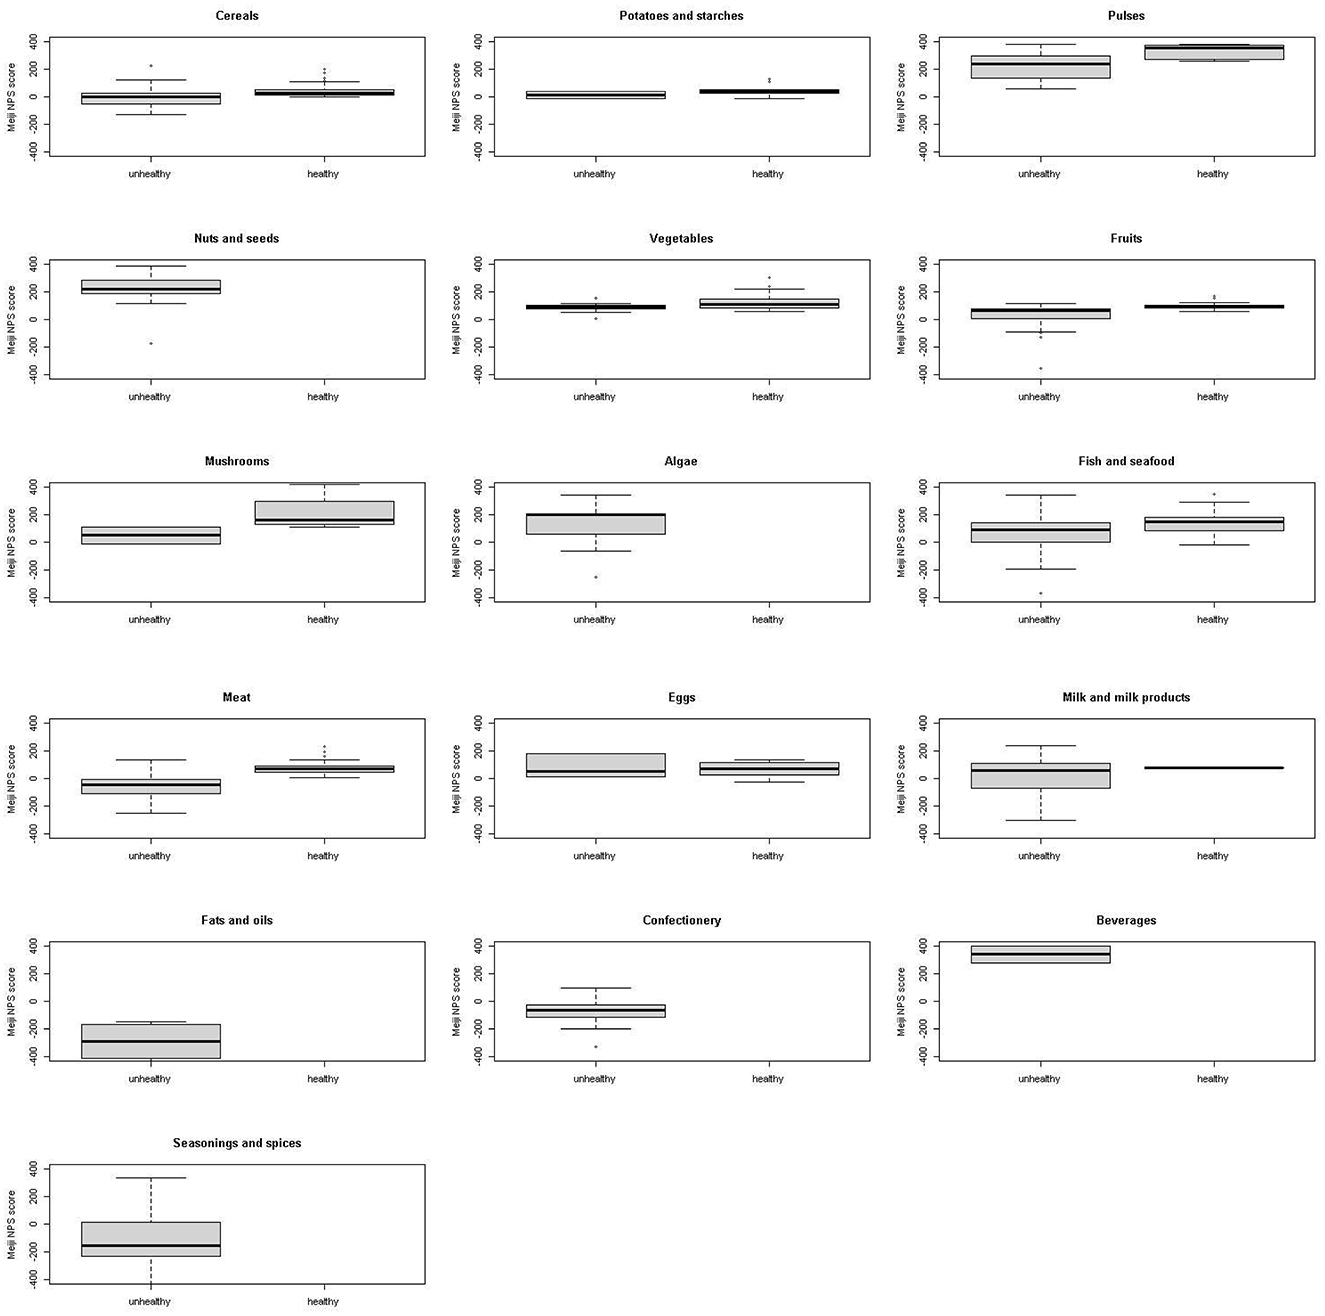
Figure 2. Meiji NPS (younger children) scores for foods classified by the WHO NP model as healthy or unhealthy by food category. Shown on the left of each graph are Meiji NPS scores for younger children for food items classified as unhealthy by the WHO NP model, while on the right are Meiji NPS scores for foods classified by the WHO NP model as healthy. No food items including nuts and seeds, algae, fats and oils, confectionery, and beverages were classified as healthy by the WHO NP model. NPS, Nutritional Profiling System.
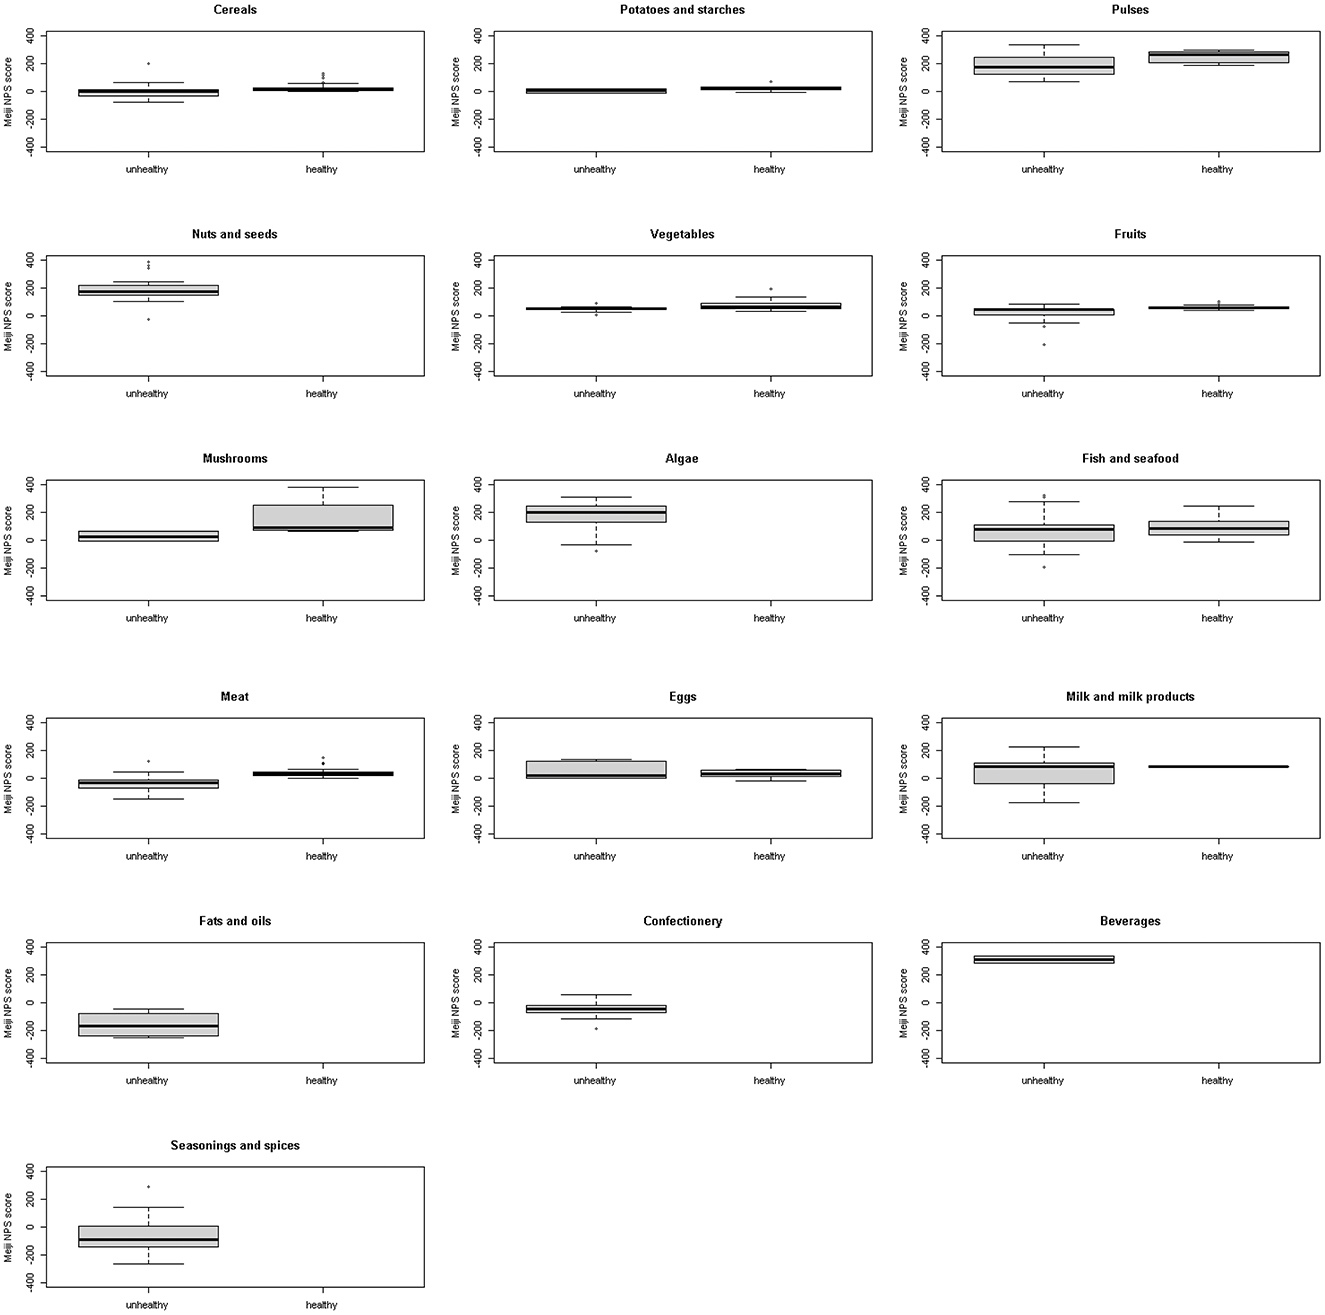
Figure 3. Meiji NPS (older children) scores for foods classified by the WHO NP model as healthy or unhealthy by food category. Shown on the left of each graph are NPS scores for foods classified by the WHO NP model as unhealthy and on the right MPS scores for foods classified by the WHO NP model as healthy. No food items including nuts and seeds, algae, fats and oils, confectionery, and beverages were classified as healthy by the WHO NP model. NPS, Nutritional Profiling System.
3.4 Comparing Meiji NPS for younger and older children to the NRF9.3 NP model
Figure 4 shows the scatter plots illustrating the correlation between the Meiji NPS for children and NRF9.3 scores, with data shown for both younger (Figure 4A) and older children (Figure 4B). Spearman's correlation coefficients for the Meiji NPS and NRF9.3 were 0.73 for both age groups (p < 0.001).
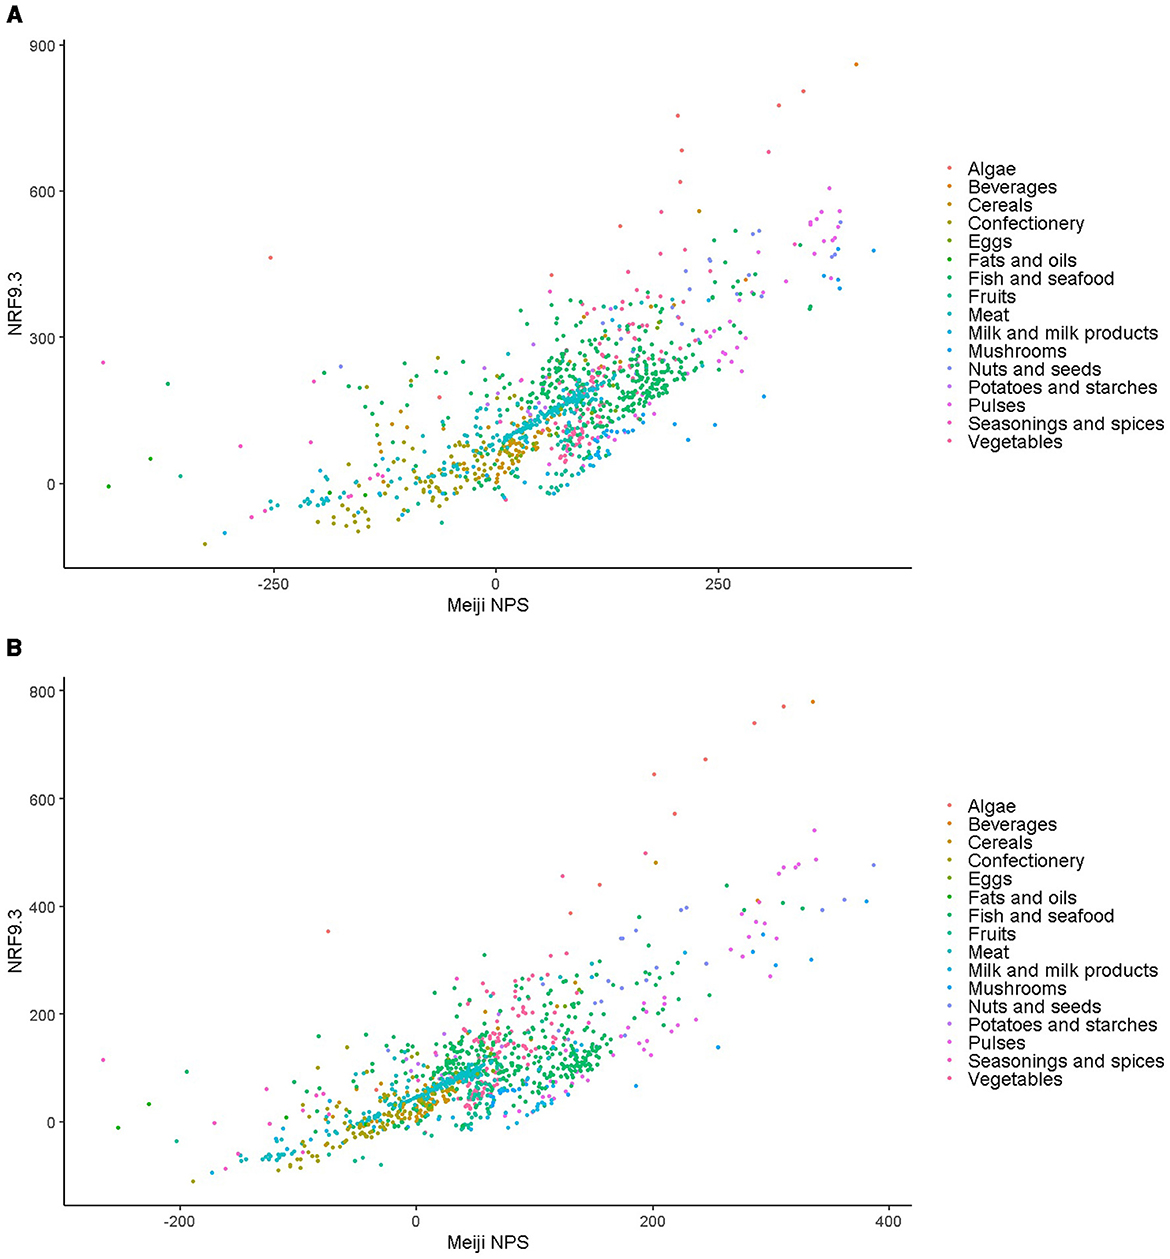
Figure 4. (A) Scatter plot of Meiji NPS and NRF9.3 scores for the same foods by age. Data are for the Meiji NPS model for younger children. (B) Scatter plot of Meiji NPS and NRF9.3 scores for the same foods by age. Data are for the Meiji NPS model for older children. NPS, nutritional profiling system; NRF9.3, Nutrient-Rich Foods Index 9.3.
4 Discussion
NP models, intended as the basis for FOP labels at the point of purchase, rarely address the ages of potential consumers. NP models need to address the nutritional needs of specific age groups if they are to serve as a useful benchmark for product reformulation. The first Meiji NPS for adults addressed the nutritional needs of adults and older adults (25). The present Meiji NPS for younger and older children incorporates nutrients essential for childhood development and growth. To our knowledge, this study is the first to assess the nutritional value of foods listed in the Japan Nutrient Composition Table specifically in the context of childhood nutrition. Two versions of the Meiji NPS were developed for younger and older children, with nutrient density calculated per 100 g and per serving size.
Continuous Meiji NPS scores for 1,091 foods were compared to the WHO food classification system, which categorizes foods as healthy and unhealthy. First, foods classified by the WHO NP model as healthy had significantly higher mean Meiji NPS scores than those classified as unhealthy. Based on the Meiji NPS, foods scoring higher than −22.0 for younger children or −18.6 for older children were more likely to align with the WHO's healthy classification (Figures 2, 4). However, there were major differences by food category. Nuts and seeds, algae, and beverages were classified by the WHO NP model as unhealthy. In contrast, nuts and seeds, algae, and beverages had above-median scores in both the Meiji NPS models (per 100 g). The Meiji NPS for older children produced above-median scores for milk and milk products. Dietary patterns that include milk and dairy products have beneficial effects on children's growth and development (67, 68) and lifestyle-related diseases (69–74). Pulses, vegetables, mushrooms, and fish and seafood received scores above the median Meiji NPS.
These discrepancies may be explained by differences in the composition of food groups. The Japanese food composition tables may be atypical. For example, the beverage category was composed of cocoa and green tea, both of which received high Meiji NPS scores. However, neither scoring system considered caffeine. One potential concern is that excessive caffeine intake can adversely affect the health, growth, and development of children (75–78). Similarly, the categories of nuts and seeds, algae, seasonings, and spices, classified as unhealthy by the WHO NP model, received high scores on the Meiji NPS. The consumption of nuts and seeds and algae has beneficial effects on growth and development, as well as on the risk of lifestyle-related diseases (70, 79, 80).
The basis of the calculations, 100 g or the serving size, affected the Meiji NPS scores. While using 100 g as reference quantity allows for a cross-sectional assessment, nutrient density calculated per serving size may be more comprehensible to the consumer (81). In the Meiji NPS for younger children, dairy and fruits scored below the median when calculated per 100 g but above the median when calculated per serving size. Dairy products and fruits are beneficial for the growth and development of children (67, 68, 82–84). The ability to use both evaluation methods for younger and older children is a strength of the Meiji NPS, allowing flexibility, depending on the context. Therefore, an evaluation that considers both per 100 g and serving size may be important.
This study has some limitations. First, not all food items were evaluated using the Meiji NPS for younger and older children because of missing data in the 2020 Japanese Food Standard Composition Table. Second, the book “Ordinary serving values food composition tables” (61) was used as reference for serving sizes in Japan. However, the serving sizes in the book do not reflect those of younger or older children. Instead, the study estimated serving sizes for younger and older children by adjusting adult serving sizes based on the energy ratios. Finally, an examination of the predictive validity is necessary to determine whether diets associated with high scores on the Meiji NPS for younger and older children are associated with better growth and development.
5 Conclusion
The new NPS for Japanese children was developed based on the Meiji NPS. Convergent validity of the Meiji NPS was confirmed by comparison with the WHO NP model and NRF9.3. However, some differences emerged between the Meiji NPS and the WHO NP model. The WHO NP model identified specific food groups that are subject to restriction on advertising. For example, the WHO NP model does not permit the marketing of children's food items classified as unhealthy, including nuts and seeds, algae, fats and oils, confectioneries, beverages, and seasonings and spices. However, this approach may not effectively support product reformulation efforts in Japan. In contrast, the Meiji NPS may be better suited to addressing the health needs of younger and older children in Japan. The NPS may also support Japanese food manufacturers in producing healthier products for children.
Data availability statement
The food composition data presented in this study are openly available in the Japanese Food Standard Composition Table 2020 Edition (8th Edition) at https://www.mext.go.jp/a_menu/syokuhinseibun/mext_01110.html. The ordinary serving values data presented in this study are available in the book “[Ordinary serving values food composition tables] jouyouryou shokuhin seibun hayami hyou (in Japanese)” published by Ishiyaku Publishers, Inc.
Author contributions
RW: Writing – original draft, Writing – review & editing, Conceptualization, Data curation, Formal analysis, Methodology, Project administration, Visualization. TY: Conceptualization, Methodology, Writing – review & editing. AD: Methodology, Writing – review & editing. ST: Methodology, Supervision, Writing – review & editing. TH: Writing – review & editing. CT: Writing – review & editing.
Funding
The author(s) declare that no financial support was received for the research and/or publication of this article.
Acknowledgments
RW would like to thank Keiko Kawahata, Teruyuki Noma, and Shinya Nagafuchi for their support during his work at Meiji Co., Ltd.
Conflict of interest
RW, TH, TY, and ST are full-time employees of Meiji Co., Ltd. AD and CT has academic consulting agreements with Meiji Co., Ltd. AD is the original developer of the Naturally Nutrient Rich (NNR) and the Nutrient Rich Food (NRF) nutrient profiling models and is or has been a member of scientific advisory panels for BEL, Lesaffre, Nestlé, Friesland Campina Institute, National Pork Board, and Carbohydrate Quality Panel supported by Potatoes USA. AD has worked with Ajinomoto, Ayanabio, FoodMinds, Kraft Heinz, Meiji, MS-Nutrition, National Dairy Council, Nutrition Impact LLC, Nutrition Institute, PepsiCo, Samsung, and Soremantec on quantitative ways to assess the nutrient density of foods.
Generative AI statement
The author(s) declare that Gen AI was used in the creation of this manuscript. During the preparation of this work, the author used Microsoft Copilot in order to achieve accurate expression of the content. After using this tool/service, the author reviewed and edited the content as needed and take full responsibility for the content of the publication.
Correction note
A correction has been made to this article. Details can be found at: 10.3389/fnut.2025.1650235.
Publisher's note
All claims expressed in this article are solely those of the authors and do not necessarily represent those of their affiliated organizations, or those of the publisher, the editors and the reviewers. Any product that may be evaluated in this article, or claim that may be made by its manufacturer, is not guaranteed or endorsed by the publisher.
Supplementary material
The Supplementary Material for this article can be found online at: https://www.frontiersin.org/articles/10.3389/fnut.2025.1611286/full#supplementary-material
References
1. Use of Nutrient Profile Models for Nutrition And Health Policies: Meeting Report on the Use of Nutrient Models in the WHO European Region. Geneva: WHO Regional Office for Europe (2021).
2. Drewnowski A, Maillot M, Darmon N. Should nutrient profiles be based on 100 g, 100 kcal or serving size? Eur J Clin Nutr. (2009) 63:898–904. doi: 10.1038/ejcn.2008.53
3. Drewnowski A, Fulgoni V 3rd. Nutrient profiling of foods: creating a nutrient-rich food index. Nutr Rev. (2008) 66:23–39. doi: 10.1111/j.1753-4887.2007.00003.x
4. Drewnowski A, Fulgoni VL 3rd. Nutrient density: principles and evaluation tools. Am J Clin Nutr. (2014) 99(Suppl):1223S−8S. doi: 10.3945/ajcn.113.073395
5. Drewnowski A. Uses of nutrient profiling to address public health needs: from regulation to reformulation. Proc Nutr Soc. (2017) 76:220–9. doi: 10.1017/S0029665117000416
6. Takebayashi J, Takimoto H, Okada C, Tousen Y, Ishimi Y. Development of a nutrient profiling model for processed foods in Japan. Nutrients. (2024) 16:3026. doi: 10.3390/nu16173026
7. Tousen Y, Takebayashi J, Okada C, Suzuki M, Yasudomi A, Yoshita K, et al. Development of a nutrient profile model for dishes in Japan version 1.0: a new step towards addressing public health nutrition challenges. Nutrients. (2024) 16:3012. doi: 10.3390/nu16173012
8. Obesity and overweight. World Health Organization. Available online at: https://www.who.int/news-room/fact-sheets/detail/obesity-and-overweight (accessed on April 8, 2025).
9. WHO Nutrient Profile Model for the Western Pacific Region. WHO West Pac Reg (2016). Available online at: https://iris.who.int/bitstream/handle/10665/252082/9789290617853-eng.pdf?sequence=1 (accessed June 3, 2025).
10. [Health Japan 21 (third term)] kenkou nihon 21 (in Japanese). Ministry of Health, Labour and Welfare. Available online at: https://www.mhlw.go.jp/stf/seisakunitsuite/bunya/kenkou_iryou/kenkou/kenkounippon21_00006.html (accessed June 6, 2025).
11. Overview of the dietary reference intakes for Japanese. (2020). Tokyo: Ministry of Health, Labour and Welfare. Available online at: https://www.mhlw.go.jp/content/10900000/000862500.pdf (accessed April 8, 2025).
12. Nutrition Policy in Japan to Leave No One Behind – for Achieving Sustainable Societies. Tokyo: Ministry of Health, Labour and Welfare (2020).
13. Hu FB. Diet strategies for promoting healthy aging and longevity: an epidemiological perspective. J Intern Med. (2024) 295:508–31. doi: 10.1111/joim.13728
14. GBD 2017 Diet Collaborators. Health effects of dietary risks in 195 countries, 1990–2017: a systematic analysis for the Global Burden of Disease Study 2017. Lancet. (2019) 393:1958–72. doi: 10.1016/S0140-6736(19)30041-8
15. Kadoya Y, Hara M, Takahari K, Ishida Y, Tamaki M. Disease control status and safety of telemedicine in patients with lifestyle diseases – a multicenter prospective observational study in Japan. Circ Rep. (2020) 2:351–6. doi: 10.1253/circrep.CR-20-0019
16. Fukasawa T, Tanemura N, Kimura S, Urushihara H. Utility of a specific health checkup database containing lifestyle behaviors and lifestyle diseases for employee health insurance in Japan. J Epidemiol. (2020) 30:57–66. doi: 10.2188/jea.JE20180192
17. Christian P, Smith ER. Adolescent undernutrition: global Burden, physiology, and nutritional risks. Ann Nutr Metab. (2018) 72:316–28. doi: 10.1159/000488865
18. Gallagher PG. Anemia in the pediatric patient. Blood. (2022) 140:571–93. doi: 10.1182/blood.2020006479
19. Nomura S, Sakamoto H, Ghaznavi C, Inoue M. Toward a third term of Health Japan 21 – implications from the rise in non-communicable disease burden and highly preventable risk factors. Lancet Reg Health West Pac. (2022) 21:100377. doi: 10.1016/j.lanwpc.2021.100377
20. Summary of the Report of the Committee Meeting on the Promotion of a Healthy and Sustainable Food Environment. Available online at: https://www.mhlw.go.jp/content/10900000/000836945.pdf (accessed April 8, 2025).
21. Strategic initiative for a healthy and sustainable food environment (HSFE). Available online at: https://sustainable-nutrition.mhlw.go.jp/en (accessed June 6, 2025).
22. Kurabayashi T, Nagai K, Morikawa K, Kamimura N, Yanase T, Hayashi K. Prevalence of osteoporosis and osteopenia assessed by densitometry in Japanese puerperal women. J Obstet Gynaecol Res. (2021) 47:1388–96. doi: 10.1111/jog.14694
23. Annual Report on the Ageing Society: Cabinet Office. (2021). Available online at: https://www8.cao.go.jp/kourei/english/annualreport/index-wh.html (accessed April 8, 2025).
24. Chang AY, Skirbekk VF, Tyrovolas S, Kassebaum NJ, Dieleman JL. Measuring population ageing: an analysis of the Global Burden of Disease Study 2017. Lancet Public Health. (2019) 4:e159–67. doi: 10.1016/S2468-2667(19)30019-2
25. Wakayama R, Drewnowski A, Horimoto T, Saito Y, Yu T, Suzuki T, et al. Development and validation of the Meiji Nutritional Profiling System (Meiji NPS) to address dietary needs of adults and older adults in Japan. Nutrients. (2024) 16:936. doi: 10.3390/nu16070936
26. Wakayama R, Drewnowski A, Horimoto T, Yu T, Saito Y, Suzuki T, et al. Development and validation of the Meiji Nutritional Profiling System per serving size. Nutrients. (2024) 16:2700. doi: 10.3390/nu16162700
27. Yu T, Zhang S, Wakayama R, Horimoto T, Tange C, Nishita Y, et al. The relationship between the dietary index based Meiji Nutritional Profiling System for adults and lifestyle-related diseases: a predictive validity study from the National Institute for Longevity Sciences-Longitudinal Study of Aging. Front Nutr. (2024) 11:1413980. doi: 10.3389/fnut.2024.1413980
28. Global Nutrition Targets 2025: Childhood Overweight Policy Brief. World Health Organization (2014). Available online at: https://iris.who.int/bitstream/handle/10665/149021/WHO_NMH_NHD_14.6_eng.pdf?sequence=2 (accessed April 8, 2025).
29. Mikkilä V, Räsänen L, Raitakari OT, Pietinen P, Viikari J. Consistent dietary patterns identified from childhood to adulthood: the cardiovascular risk in Young Finns Study. Br J Nutr. (2005) 93:923–31. doi: 10.1079/BJN20051418
30. Kaikkonen JE, Mikkilä V, Raitakari OT. Role of childhood food patterns on adult cardiovascular disease risk. Curr Atheroscler Rep. (2014) 16:443. doi: 10.1007/s11883-014-0443-z
31. Patterson E, Wärnberg J, Kearney J, Sjöström M. The tracking of dietary intakes of children and adolescents in Sweden over six years: the European Youth Heart Study. Int J Behav Nutr Phys Act. (2009) 6:91. doi: 10.1186/1479-5868-6-91
32. Katoch OR. Determinants of malnutrition among children: a systematic review. Nutrition. (2022) 96:111565. doi: 10.1016/j.nut.2021.111565
33. Wells JCK, Briend A, Boyd EM, Berkely JA, Hall A, Isanaka S, et al. Beyond wasted and stunted-a major shift to fight child undernutrition. Lancet Child Adolesc Health. (2019) 3:831–4. doi: 10.1016/S2352-4642(19)30244-5
34. WHO Regional Office for Europe Nutrient Profile Model, 2nd Edn. Geneva: WHO Regional Office for Europe (2023).
35. Labonté MÈ, Poon T, Gladanac B, Ahmed M, Franco-Arellano B, Rayner M, et al. Nutrient profile models with applications in government-led nutrition policies aimed at Health Promotion and noncommunicable disease prevention: a systematic review. Adv Nutr. (2018) 9:741–88. doi: 10.1093/advances/nmy045
36. Nijman CA, Zijp IM, Sierksma A, Roodenburg AJ, Leenen R, van den Kerkhoff C, et al. A method to improve the nutritional quality of foods and beverages based on dietary recommendations. Eur J Clin Nutr. (2007) 61:461–71. doi: 10.1038/sj.ejcn.1602548
37. Lehmann U, Charles VR, Vlassopoulos A, Masset G, Spieldenner J. Nutrient profiling for product reformulation: public health impact and benefits for the consumer. Proc Nutr Soc. (2017) 76:255–64. doi: 10.1017/S0029665117000301
38. Vlassopoulos A, Masset G, Charles VR, Hoover C, Chesneau-Guillemont C, Leroy F, et al. A nutrient profiling system for the (re)formulation of a global food and beverage portfolio. Eur J Nutr. (2017) 56:1105–22. doi: 10.1007/s00394-016-1161-9
39. Greenberg D, Drewnowski A, Black R, Weststrate JA, O'Shea M. A progressive nutrient profiling system to guide improvements in nutrient density of foods and beverages. Front Nutr. (2021) 8:774409. doi: 10.3389/fnut.2021.774409
40. Furuta C, Jinzu H, Cao L, Drewnowski A, Okabe Y. Nutrient profiling of Japanese dishes: the development of a novel Ajinomoto group nutrient profiling system. Front Nutr. (2022) 9:912148. doi: 10.3389/fnut.2022.912148
41. Arnesen EK, Thorisdottir B, Lamberg-Allardt C, Bärebring L, Nwaru B, Dierkes J, et al. Protein intake in children and growth and risk of overweight or obesity: a systematic review and meta-analysis. Food Nutr Res. (2022) 66:82242. doi: 10.29219/fnr.v66.8242
42. Bonjour JP, Ammann P, Chevalley T, Rizzoli R. Protein intake and bone growth. Can J Appl Physiol. (2001) 26(Suppl):S153–66. doi: 10.1139/h2001-050
43. Grantham-McGregor S, Baker-Henningham H. Review of the evidence linking protein and energy to mental development. Public Health Nutr. (2005) 8:1191–201. doi: 10.1079/PHN2005805
44. Hassevoort KM, Lin AS, Khan NA, Hillman CH, Cohen NJ. Added sugar and dietary fiber consumption are associated with creativity in preadolescent children. Nutr Neurosci. (2020) 23:791–802. doi: 10.1080/1028415X.2018.1558003
45. Ondrak KS, Morgan DW. Physical activity, calcium intake and bone health in children and adolescents. Sports Med. (2007) 37:587–600. doi: 10.2165/00007256-200737070-00003
46. Bueno AL, Czepielewski MA. The importance for growth of dietary intake of calcium and vitamin D. J Pediatr. (2008) 84:386–94. doi: 10.2223/JPED.1816
47. Greer FR, Krebs NF, American Academy of Pediatrics Committee on Nutrition. Optimizing bone health and calcium intakes of infants, children, and adolescents. Pediatrics. (2006) 117:578–85. doi: 10.1542/peds.2005-2822
48. Hermoso M, Vucic V, Vollhardt C, Arsic A, Roman-Viñas B, Iglesia-Altaba I, et al. The effect of iron on cognitive development and function in infants, children and adolescents: a systematic review. Ann Nutr Metab. (2011) 59:154–65. doi: 10.1159/000334490
49. National Health and Nutrition Survey. Ministry of Health, Labour and Welfare. Available online at: https://www.nibiohn.go.jp/eiken/kenkounippon21/en/eiyouchousa/ (accessed June 6, 2025).
50. Wakayama R, Takasugi S, Honda K, Kanaya S. Application of a two-dimensional mapping-based visualization technique: nutrient-value-based food grouping. Nutrients. (2023) 15:5006. doi: 10.3390/nu15235006
51. Ishida H. The history, current status, and Future Directions of the School Lunch Program in Japan. Eiyougakuzashi. (2018) 76(Suppl):S2–11. doi: 10.5264/eiyogakuzashi.76.S2
52. School Lunches: The Key to Children's Health and Prosperity. The Government of Japan. Available online at: https://www.japan.go.jp/kizuna/_userdata/pdf/2021/winter2021/school_lunches.pdf (accessed June 6, 2025).
53. [Results of FY 2022 Survey on Curriculum Organization and Implementation at Public Elementary and Junior High Schools]. Reiwa 4nendo kouritsu shou chuu gakkou tou ni okeru kyouiku katei no hensei jisshi joukyou chousa (in Japanese). Ministry of Education, Culture, Sports, Science, and Technology. Available online at: https://www.mext.go.jp/a_menu/shotou/new-cs/1415063_00001.htm (accessed June 6, 2025).
54. Drewnowski A. Defining nutrient density: development and validation of the nutrient rich foods index. J Am Coll Nutr. (2009) 28:421S−6S. doi: 10.1080/07315724.2009.10718106
55. Zhai J, Ma B, Lyu Q, Guo L, Khatun P, Liang R, et al. Validation of the nutrient-rich foods index estimated by 24-h dietary recall method among adults in Henan Province of China. Public Health Nutr. (2022) 25:1–9. doi: 10.1017/S1368980022000465
56. Murakami K, Livingstone MBE, Fujiwara A, Sasaki S. Application of the Healthy Eating Index-2015 and the Nutrient-Rich Food Index 9.3 for assessing overall diet quality in the Japanese context: different nutritional concerns from the US. PLoS ONE. (2020) 15:e0228318. doi: 10.1371/journal.pone.0228318
57. Saturated Fatty Acid and Trans-fatty Acid Intake for Adults and Children [WHO guideline]. World Health Origanization (2023). Available online at: https://www.who.int/publications/i/item/9789240073630 (accessed on April 8, 2025).
58. Guideline: Sugars Intake for Adults and Children. World Health Organization (2015). Available online at: https://www.who.int/publications/i/item/9789241549028 (accessed April 8, 2025).
59. [Targets of Healthy Japan 21] Kenkou Nihon 21 Mokuhyouchi Ichiran (in Japanese): Ministry of Health. Labour and Welfare. (2000). Available online at: https://www.mhlw.go.jp/www1/topics/kenko21_11/t2a.html (accessed April 8, 2025).
60. Beal T, Ortenzi F, Fanzo J. Estimated micronutrient shortfalls of the EAT-Lancet planetary health diet. Lancet Planet Health. (2023) 7:e233–7. doi: 10.1016/S2542-5196(23)00006-2
61. The Japanese Clinical Nutrition Association. [Ordinary Serving Values Food Composition Tables] Jouyouryou Shokuhin Seibun Hayami Hyou (in Japanese), 3rd Edn. Tokyo: Ishiyaku Publishers, Inc. (2006). p. 553.
62. Standard Tables of Food Composition in Japan − 2020, 8th rev Edn. Report of the Subdivision on Resources The Council for Science and Technology. Tokyo: Ministry of Education, Culture, Sports, Science, and Technology (2020).
63. Yuri Yokoyama TY, Tada Y, Okada E, Takebayashi J, Takimoto H, Ishimi Y. A study on the characteristics of nutrient profile models in other countries for the development of a Japanese nutrient profile model. Jpn J Nutr Diet. (2021) 79:162–73. doi: 10.5264/eiyogakuzashi.79.162
64. Merchant AT, Dehghan M. Food composition database development for between country comparisons. Nutr J. (2006) 5:2. doi: 10.1186/1475-2891-5-2
65. Pennington JAT. Food composition databases for bioactive food components. J Food Compos Anal. (2002) 15:419–34. doi: 10.1006/jfca.2002.1073
66. Schober P, Boer C, Schwarte LA. Correlation coefficients: appropriate use and interpretation. Anesth Analg. (2018) 126:1763–8. doi: 10.1213/ANE.0000000000002864
67. Tan L, Shi G, Ge Y, Cui N, Huang S, Weng S, et al. Dietary patterns and bone density among school-aged children: a cross-sectional study in China. Eur J Nutr. (2024) 64:1. doi: 10.1007/s00394-024-03526-4
68. Liao X, Chen S, Su M, Zhang X, Wei Y, Liang S, et al. The relationship between dietary pattern and bone mass in school-age children. Nutrients. (2022) 14:3752. doi: 10.3390/nu14183752
69. Liberali R, Kupek E, Assis MAA. Dietary patterns and childhood obesity risk: a systematic review. Child Obes. (2020) 16:70–85. doi: 10.1089/chi.2019.0059
70. Ren Y, Feng Y, Wang Q, Qu P, Luo S, Huang D, et al. Analysis of dietary patterns on cardiovascular risks in children: from a cross-sectional and a longitudinal study. Public Health. (2023) 220:35–42. doi: 10.1016/j.puhe.2023.04.018
71. Dietary Guidelines Advisory Committee DPS, USDA. Nutrition Evidence Systematic Reviews. Dietary Patterns and Risk of Cardiovascular Disease: A Systematic Review. Alexandria, VA: United States Department of Agriculture Nutrition Evidence Systematic Review (2020).
72. Martin-Calvo N, Chavarro JE, Falbe J, Hu FB, Field AE. Adherence to the Mediterranean dietary pattern and BMI change among US adolescents. Int J Obes. (2016) 40:1103–8. doi: 10.1038/ijo.2016.59
73. Asghari G, Yuzbashian E, Mirmiran P, Hooshmand F, Najafi R, Azizi F. Dietary Approaches to Stop Hypertension (DASH) dietary pattern is associated with reduced incidence of metabolic syndrome in children and adolescents. J Pediatr. (2016) 174:178–84.e1. doi: 10.1016/j.jpeds.2016.03.077
74. Boushey C, Ard J, Bazzano L, Heymsfield S, Mayer-Davis E, Sabaté J, et al. Dietary Patterns and Growth, Size, Body Composition, and/or Risk of Overweight or Obesity: A Systematic Review. Alexandria, VA: United States Department of Agriculture Nutrition Evidence Systematic Review (2020). doi: 10.52570/NESR.DGAC2020.SR0101
75. Torres-Ugalde YC, Romero-Palencia A, Román-Gutiérrez AD, Ojeda-Ramírez D, Guzmán-Saldaña RME. Caffeine consumption in children: innocuous or deleterious? A systematic review. Int J Environ Res Public Health. (2020) 17:2489. doi: 10.3390/ijerph17072489
76. Kika J, Jakubczyk K, Ligenza A, Maciejewska-Markiewicz D, Szymczykowska K, Janda-Milczarek K. Matcha green tea: chemical composition, phenolic acids, caffeine and fatty acid profile. Foods. (2024) 13:1167. doi: 10.3390/foods13081167
77. Franco R, Oñatibia-Astibia A, Martínez-Pinilla E. Health benefits of methylxanthines in cacao and chocolate. Nutrients. (2013) 5:4159–73. doi: 10.3390/nu5104159
78. Rios-Leyvraz M, Bochud M, Tabin R, Genin B, Russo M, Rossier MF, et al. Monitoring caffeine intake in children with a questionnaire and urine collection: a cross-sectional study in a convenience sample in Switzerland. Eur J Nutr. (2020) 59:3537–43. doi: 10.1007/s00394-020-02187-3
79. López-Gil JF, Martínez-Vizcaíno V, Amaro-Gahete FJ, Medrano M, Pascual-Morena C, Álvarez-Bueno C, et al. Nut consumption and academic performance among adolescents: the EHDLA study. Eur J Nutr. (2023) 62:289–98. doi: 10.1007/s00394-022-02985-x
80. Wolters M, Joslowski G, Plachta-Danielzik S, Standl M, Müller MJ, Ahrens W, et al. Dietary patterns in primary school are of prospective relevance for the development of body composition in two German pediatric populations. Nutrients. (2018) 10:1442. doi: 10.3390/nu10101442
81. Mandle J, Tugendhaft A, Michalow J, Hofman K. Nutrition labelling: a review of research on consumer and industry response in the global South. Glob Health Action. (2015) 8:25912. doi: 10.3402/gha.v8.25912
82. van den Hooven EH, Heppe DH, Kiefte-de Jong JC, Medina-Gomez C, Moll HA, Hofman A, et al. Infant dietary patterns and bone mass in childhood: the Generation R Study. Osteoporos Int. (2015) 26:1595–604. doi: 10.1007/s00198-015-3033-1
83. Golley RK, Smithers LG, Mittinty MN, Emmett P, Northstone K, Lynch JW. Diet quality of UK infants is associated with dietary, adiposity, cardiovascular, and cognitive outcomes measured at 7–8 years of age. J Nutr. (2013) 143:1611–7. doi: 10.3945/jn.112.170605
Keywords: nutrient profiling, World Health Organization, nutrient-rich food index, growth, development, children, Japanese diet
Citation: Wakayama R, Yu T, Drewnowski A, Takasugi S, Horimoto T and Tsutsumi C (2025) Development and validation of the Meiji Nutritional Profiling System for children. Front. Nutr. 12:1611286. doi: 10.3389/fnut.2025.1611286
Received: 14 April 2025; Accepted: 21 May 2025;
Published: 17 June 2025; Corrected: 09 July 2025.
Edited by:
Karuna Singh, Sharda University, IndiaReviewed by:
Mario Juan Simirgiotis, Austral University of Chile, ChileRenu Khedkar, Amity University, India
Bushra Shaida, Jamia Hamdard University, India
Copyright © 2025 Wakayama, Yu, Drewnowski, Takasugi, Horimoto and Tsutsumi. This is an open-access article distributed under the terms of the Creative Commons Attribution License (CC BY). The use, distribution or reproduction in other forums is permitted, provided the original author(s) and the copyright owner(s) are credited and that the original publication in this journal is cited, in accordance with accepted academic practice. No use, distribution or reproduction is permitted which does not comply with these terms.
*Correspondence: Ryota Wakayama, cnlvdXRhLndha2F5YW1hQG1laWppLmNvbQ==