 Paloma Aparecida Anastacio Barros*
 Juliana de Paula Matos
 Michele Bittencourt RodriguesRenata Júlia da Costa
 Paula Martins Horta
- Programa de Pós-graduação em Nutrição e Saúde – Universidade Federal de Minas Gerais, Belo Horizonte, Brazil
Objective: To analyze digital marketing trends of Brazil’s leading meal delivery application (MDA) company on Facebook (FB) and Instagram (IG) from 2011 to 2022.
Methods: This exploratory, longitudinal, and mixed-methods study examined a 10% sample of all posts published by this company during the study period. Posts were analyzed in terms of food categories, media and connectivity features, and advertising themes.
Results: The company predominantly promoted unhealthy foods, frequently employing persuasive digital marketing strategies. While this pattern was consistent across both platforms, IG posts were more visually engaging and interactive, making greater use of brand elements, hashtags, conversations, emoticons, user interaction, and company tagging (all p < 0.001). In contrast, FB posts more commonly included external links. Twelve distinct advertising themes were identified. They reflected a broad and diverse range of marketing strategies, encompassing brand promotion, user engagement, contextual appeals, technological features, social responsibility, and other themes. IG posts more frequently featured themes such as entertainment and social interaction, consumption stimulus, application differentials, public figure endorsements, and social and corporate responsibility (all p < 0.05). Conversely, the theme of communication and news was more prevalent on FB. Longitudinal analysis revealed that the company adapted its content over time, refining its use of media tools and thematic strategies in response to evolving digital marketing.
Conclusion: The company primarily advertised unhealthy foods on both social media, leveraging persuasive techniques and marketing strategies. These practices may hinder public health efforts to reduce the consumption of unhealthy foods.
1 Introduction
Meal delivery apps (MDAs) are online platforms that manage meal ordering by connecting food establishments with consumers (1). Accessible via internet-enabled devices, these apps allow users to browse menus, read reviews, place orders, and receive meals conveniently anywhere (1). MDAs play a significant role in enhancing food accessibility and availability, thereby influencing population dietary patterns (1, 2).
The use of MDAs has grown substantially worldwide, particularly among younger populations attracted by convenience, practicality, and time efficiency (1, 3, 4). By 2024, global use of online food delivery services had surpassed 2.5 billion users (5), with Brazil accounting for approximately 80 million users (6).
Previous studies have documented the widespread availability of meals with low nutritional quality and high energy density on these platforms across diverse global settings (7–16). This trend has raised concerns among public health authorities (1), as frequent consumption of ultra-processed foods has been linked to overweight, obesity, and chronic noncommunicable diseases (17, 18).
To promote their services, expand market reach, and retain customers, MDA companies have heavily invested in digital marketing strategies, particularly through social media (1). Social media platforms are defined as technological ecosystems that connect individuals, businesses, organizations, and institutions (19). According to media richness theory, organizations and consumers utilize multiple media channels to communicate (20). These platforms enable companies to reach large audiences, foster interaction and engagement, and advertise products and services effectively (21, 22). Moreover, digital channels allow for high-volume information dissemination and reduce the perceived cost of information search. They also facilitate knowledge exchange and provide rapid, tailored feedback, thereby influencing consumer decision-making (20).
In Brazil, social media is among the most widely used online activities, especially among younger individuals (23). Facebook (FB) and Instagram (IG) are two of the most prominent platforms, with approximately 154 million and 113 million users, respectively (23). These platforms serve distinct functions: FB emphasizes user profiles and social connections, whereas IG focuses on visual content dissemination, with user interactions primarily driven by shared interests and content affinity (22, 24). These differences have prompted companies to develop platform-specific marketing strategies (22).
Although some studies have explored the digital marketing strategies of MDA companies, only three have monitored their social media activities, primarily in the context of the COVID-19 pandemic (25, 26, 27). In Australia, the United Kingdom, and the United States, IG posts by MDA companies included links, images, brand elements, and content related to pandemic response efforts, including corporate social responsibility actions (25). In Brazil, researchers observed changes in the advertising strategies of three major MDA companies on IG when comparing posts from the early months of the pandemic to the preceding six months (26). Specifically, there was a decline in food imagery particularly of ultra-processed products and an increased focus on messages related to corporate responsibility and public health (26). Another Brazilian study analyzed 137 posts from three MDA companies across FB, IG, and YouTube during the pandemic, finding that approximately 58% featured unhealthy foods, with content centered on branding, COVID-19 information, and corporate social responsibility (27).
The present study aims to build on this body of research by conducting the first comprehensive analysis of digital marketing trends by Brazil’s leading MDA company on social media between 2011 and 2022. The findings will enhance understanding of how this company utilizes different platforms and may inform regulatory discussions regarding the promotion of unhealthy foods in digital environments.
2 Methods
2.1 Outline of the study and company profile
This was an exploratory, longitudinal, and mixed-methods study. Exploratory studies have been used to assess digital marketing strategies on food company social media platforms (28), particularly given the dynamic nature and limited prior research in this field. The mixed-methods approach (qualitative and quantitative) permits a more comprehensive assessment of advertising content. Content analysis, previously employed in other studies on food marketing in social media (29, 30), allows for the identification of specific strategies, platform-exclusive features, and company behavior.
The company analyzed was founded in 2011 in Brazil and has since become the national leader in the online food delivery sector, operating in more than 1,700 cities (31). As of January 2023, it reported 65 million monthly orders, over 300,000 registered restaurants, and more than 1.5 million monthly app downloads (31).
2.2 Data collection and variable organization
The dataset included all posts published by the company on FB (n = 3,153) and IG (n = 1,838) in Brazil. Data were collected using Fanpage Karma, an automated tool that retrieved each post and its engagement metrics (likes, comments, and shares). The tool exported the data in Excel format. Posts were categorized by publication date and engagement metrics. The number of followers on each platform was also recorded in December 2022.
To ensure feasibility, a 10% stratified random sample was drawn. Strata were defined by year and month, ensuring proportional representation across the study period. This subsample (n = 325 FB; n = 187 IG) was analyzed to identify food images, based on predefined categories: traditional meals (e.g., rice, beans, meat, salad), fruits, greens, and vegetables (FGV) (e.g., fruit salad, vegetable soup), healthy snacks (e.g., fruit pancakes), healthy beverages (e.g., fresh orange juice), unhealthy snacks (e.g., hamburgers, pizza), alcoholic beverages (e.g., beer), ultra-processed beverages (e.g., soft drinks) and other foods not classified above. These categories were adapted from prior research on the food environment in MDAs in Brazil and are consistent with the Brazilian Dietary Guidelines and the NOVA classification system (8, 13, 14, 32) (Table 1).
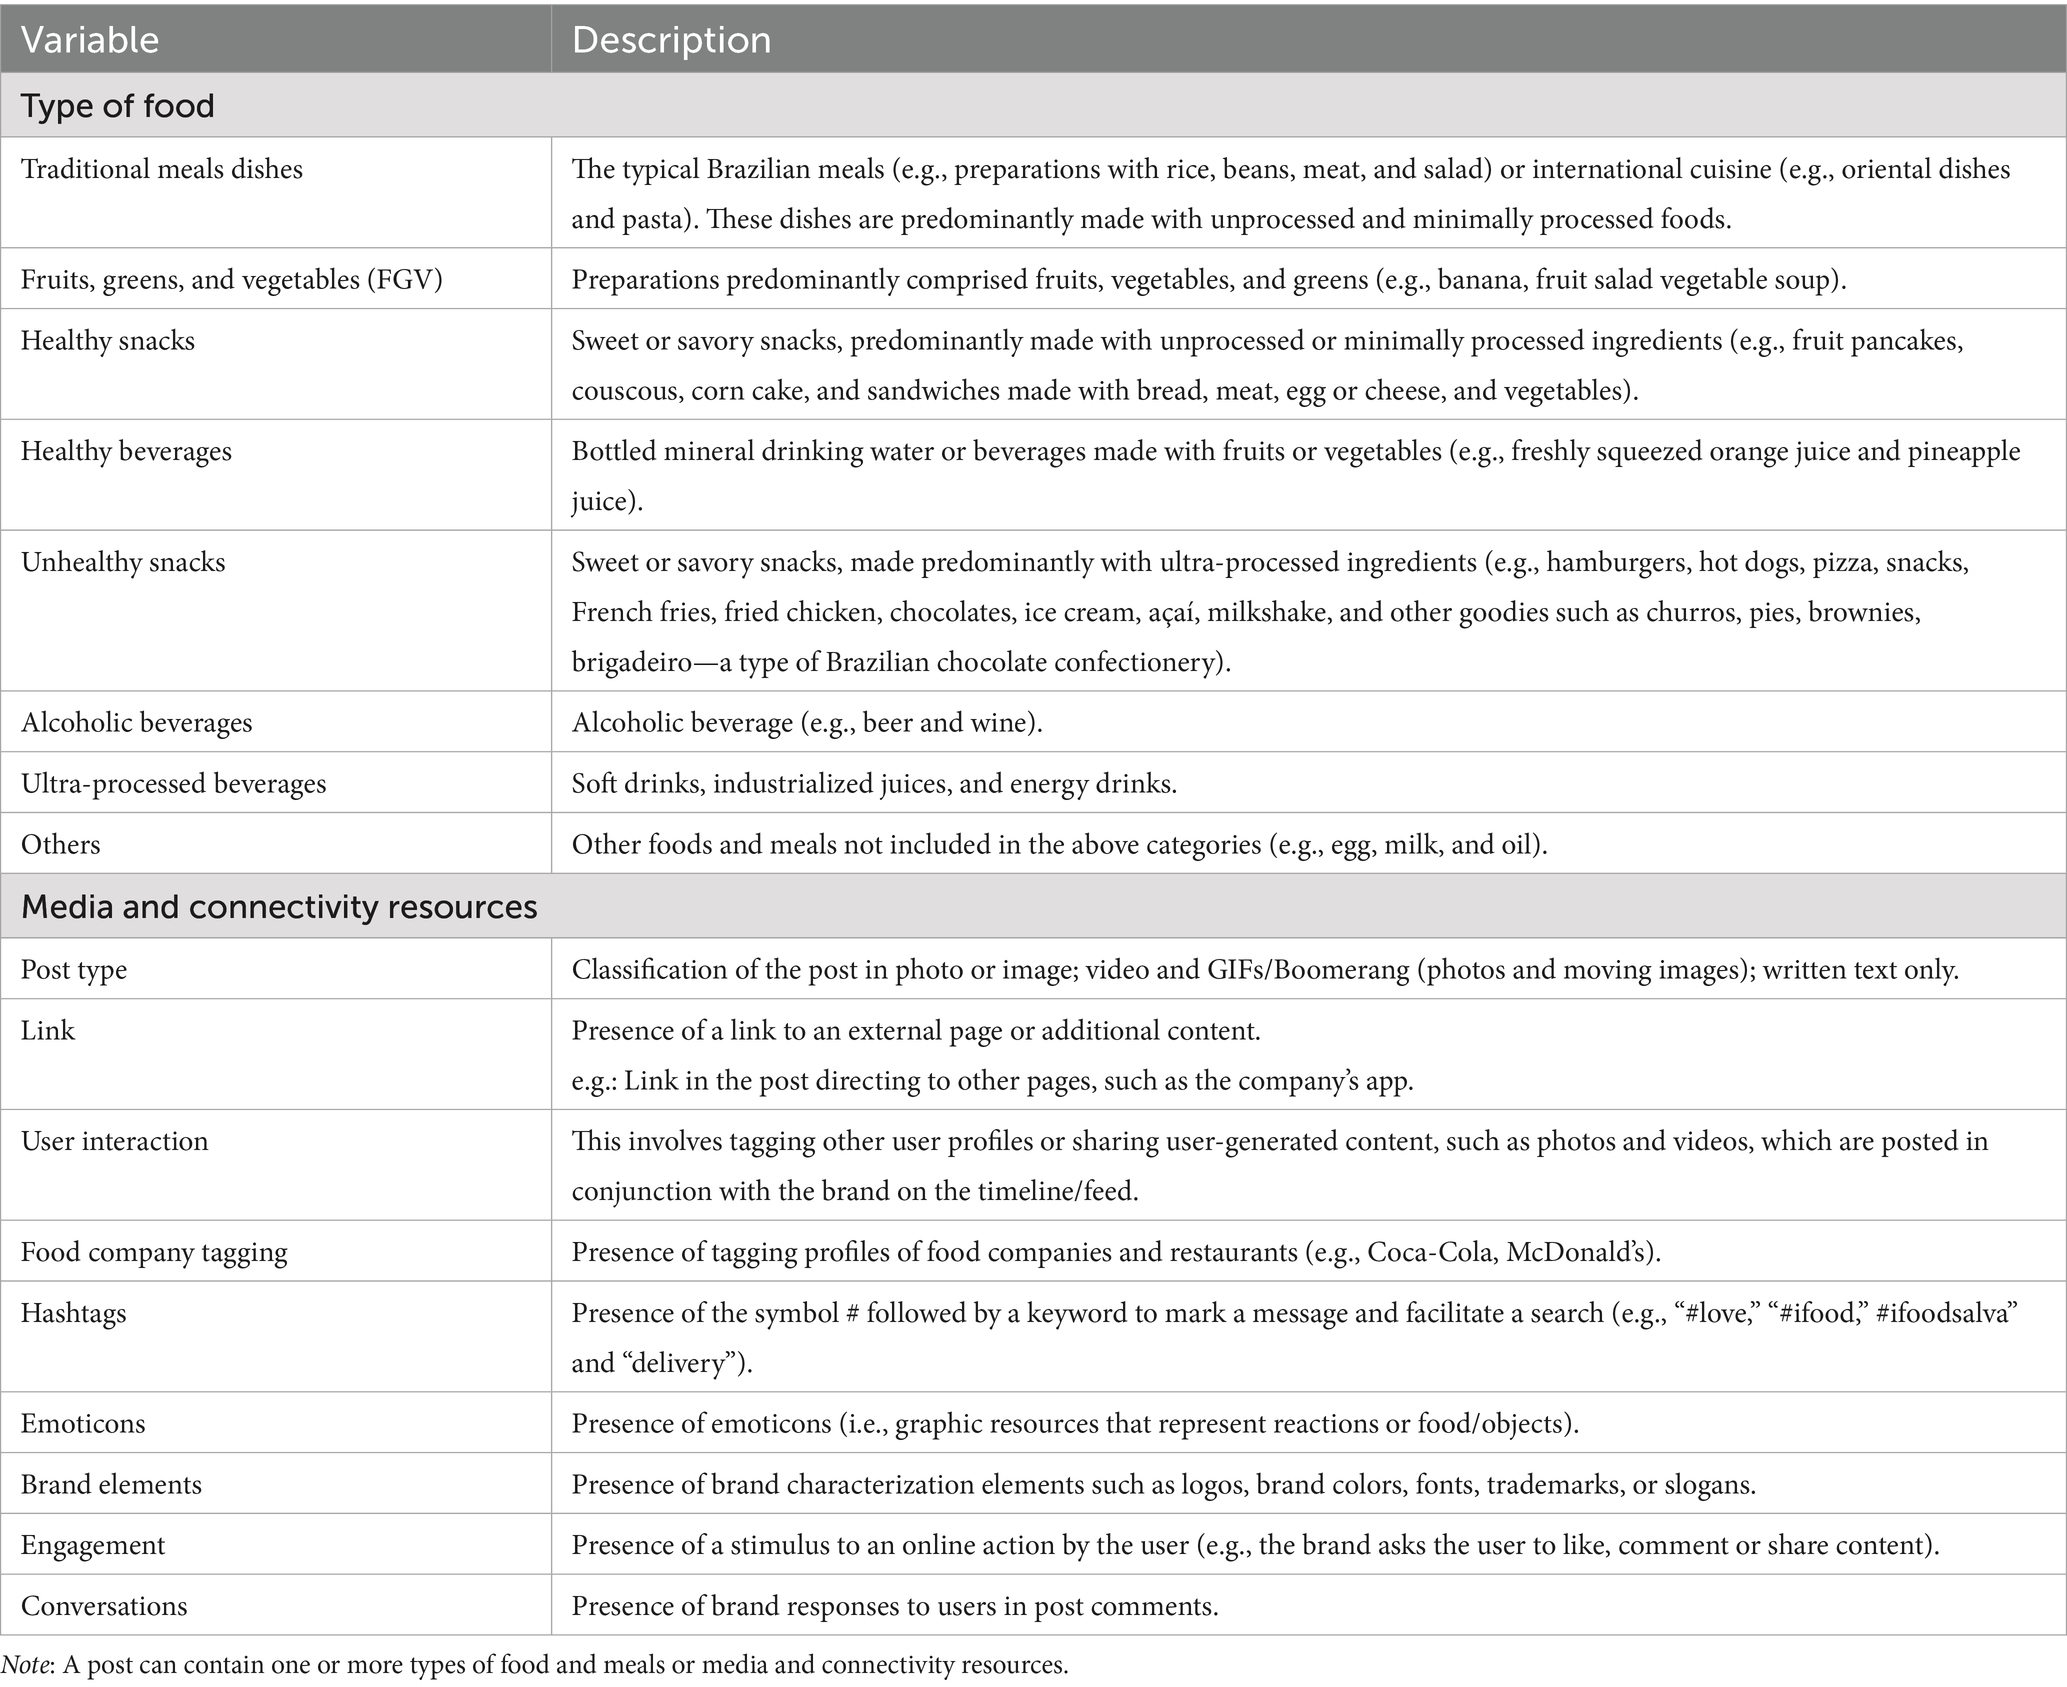
Table 1. Criteria used to classify food types, meals, and media/connectivity elements in posts by the leading meal delivery app company on Facebook and Instagram in Brazil.
The same subsample was analyzed for media and connectivity elements, including: type of post, external links, user interaction, company tagging, hashtags, emoticons, brand elements, engagement, and conversation prompts. A structured protocol was developed based on prior literature on digital food marketing practices (13–14, 25, 29–30, 33–34) (Table 1). Due to the subjectivity in identifying some variables, the full protocol was applied by the lead researcher. A second researcher independently coded 10% of the subsample, resulting in a 97% inter-rater agreement rate, ensuring reliability and consistency.
To analyze visual and textual content, a thematic analysis was conducted, following Braun and Clarke’s method (35). This qualitative approach enables the identification, analysis, interpretation, and reporting of explicit and implicit themes. It is valued for its flexibility, accessibility, and ability to synthesize large datasets (35).
Four trained researchers conducted the analysis on a 10% post subsample (separately for each platform) through seven steps:
i. pre-analysis: two researchers initiated the process by conducting an initial analysis and took notes of the principal themes (messages and appeals) present in each post.
ii. generating initial codes: carried out by the main researcher, who systematically coded the pre-analysis of the annotated data and categorized the relevant information for each code. This step resulted in 47 initial codes for FB and 38 for IG;
iii. searching for categories: the main researcher organized the codes into potential categories, including all relevant data for each potential category. This step resulted in 18 categories for FB and 16 for IG;
iv. review of categories: after reviewing the coded data and categories, a thematic ‘map’ was generated for analysis and discussed by all researchers. This step refined the categories and totaled a set of 12 categories for both FB and IG;
v. treatment of categories: two researchers carried out a general analysis of all categories to enhance their specificity and establish precise definitions and labels. Subsequently, these categories were discussed among a group of three researchers.
vi. interpretation of results: two researchers independently analyzed the posts according to the categories found in the previous steps;
vii. analysis of the consistency of interpretation results: all results were compared (93.8% agreement rate) and disagreements were verified by a third researcher.
2.3 Data analysis
In the full sample (n = 3,153 FB; n = 1,838 IG), the total number of likes, comments, and shares per year was aggregated and visualized through line graphs for each platform.
In the subsample (n = 325 FB; n = 187 IG), the frequency of food categories, media/connectivity features, and thematic categories was calculated for each year and platform. Differences between platforms were tested using Pearson’s Chi-square test, with a 5% significance level. Analyses were conducted using Stata software, version 14.
For the same subsample, longitudinal trends in the presence of food categories, media and connectivity elements, and thematic content were described using trendline graphs by year and platform, based on relative frequencies.
3 Results
As of December 2022, the company had 2,196,422 followers on FB and 2,162,738 on IG (data not shown in the figure). The company’s FB page, created in 2011, reached its peak volume of posts in 2022 (n = 651). The IG account, launched in 2015, also registered its highest posting activity in 2022, with 853 posts (Figure 1A).
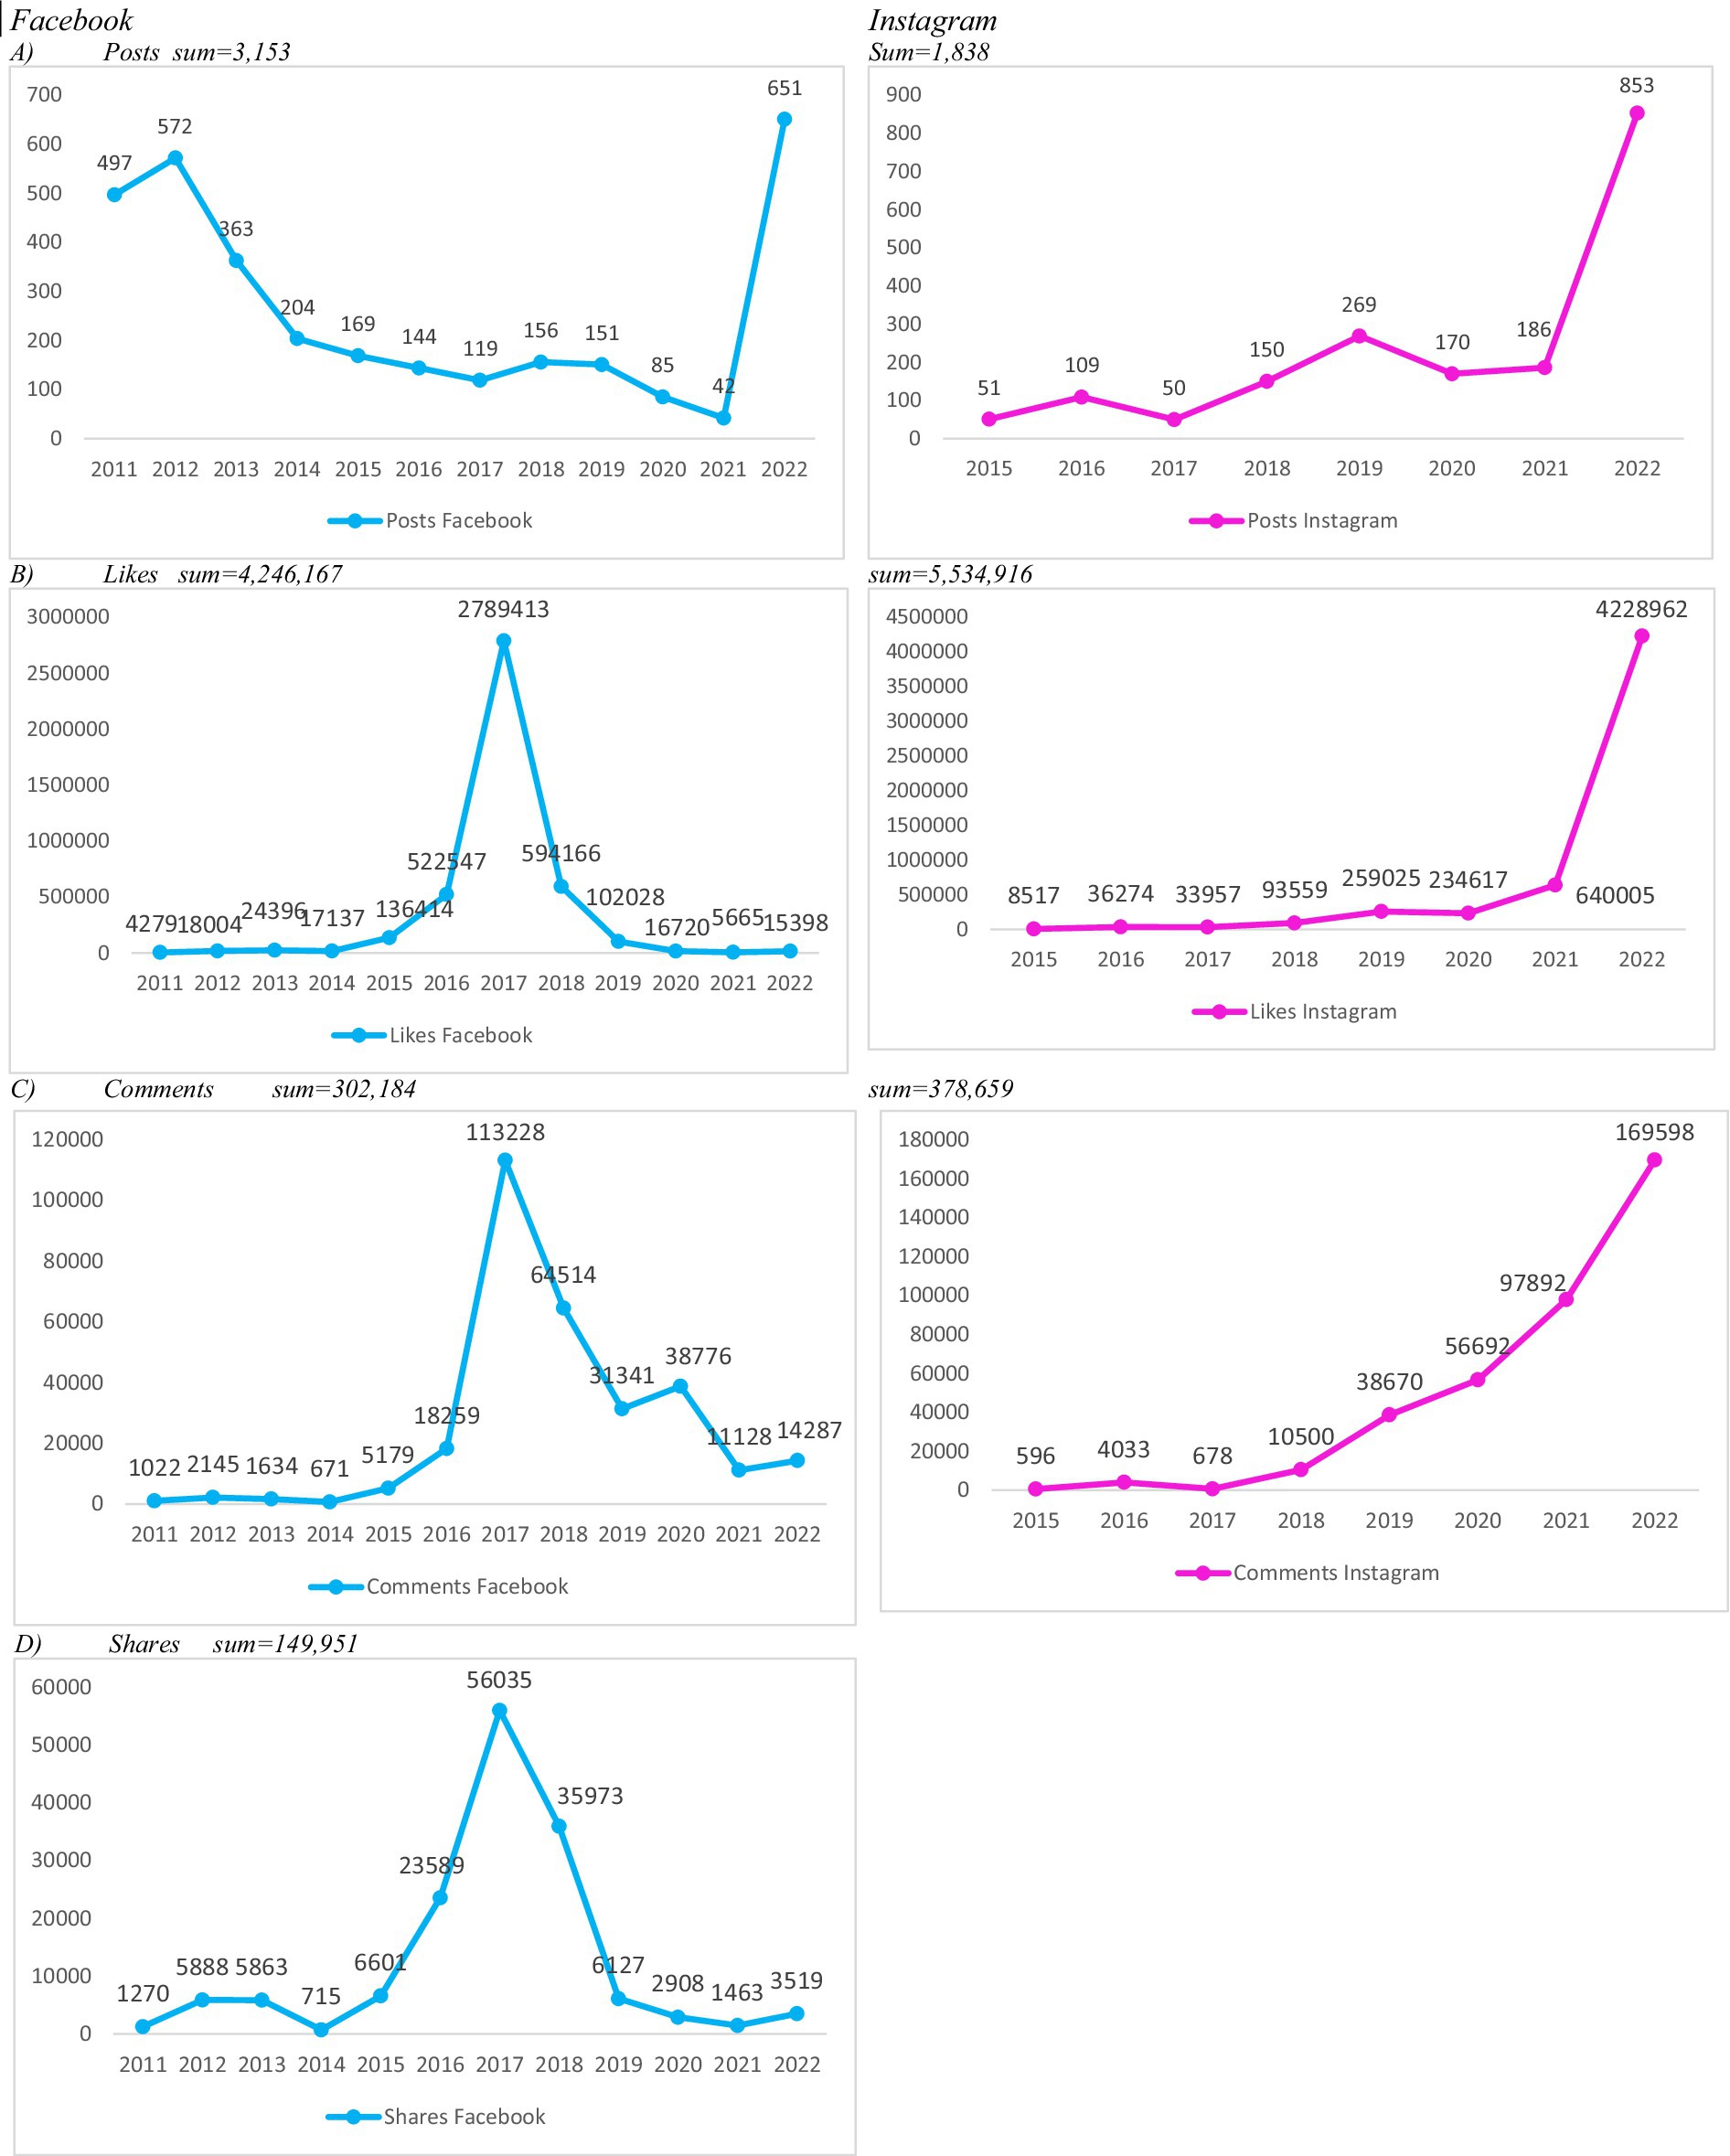
Figure 1. Number of posts by the main meal delivery app company on Facebook and Instagram in Brazil and number of interactions received, 2011–2022.
Throughout the study period, FB showed a general decline in posting frequency, despite a temporary surge in 2022. In contrast, IG exhibited a steady increase in the number of posts over time (Figure 1A). Cumulatively, FB posts received 4,246,167 likes, while IG posts garnered 5,534,916 likes (Figure 1B). Similarly, total comments amounted to 302,184 on FB and 378,659 on IG (Figure 1C). Data on shares were available only for FB, totaling 149,951 (Figure 1D).
The highest levels of engagement on FB occurred in 2017, with 2,789,413 likes, 113,228 comments, and 56,035 shares. On IG, peak engagement was observed in 2022, with 4,228,962 likes and 169,598 comments. Overall, FB interaction data between 2011 and 2022 did not display a clear upward or downward trend, except for the notable spike in 2017. Conversely, IG showed a consistent upward trajectory in both publication volume and user engagement. These patterns are illustrated in Figures 1A–D.
In the analyzed subsample, food images appeared in 68.6% of FB posts and 67.9% of IG posts, with no statistically significant difference between platforms (p = 0.870) (data not shown in the table). Unhealthy snacks were the most frequently featured food category, appearing in 60.1% of FB posts and 67.7% of IG posts (p = 0.156). Traditional meals were more frequently depicted on FB (43.9%) than on IG (33.1%) (p = 0.046). In contrast, ultra-processed beverages appeared more often on IG (11.8%) than on FB (4.5%) (p = 0.010). On both platforms, posts featuring FGV, healthy snacks, or healthy beverages accounted for less than 11% of the content (Table 2).
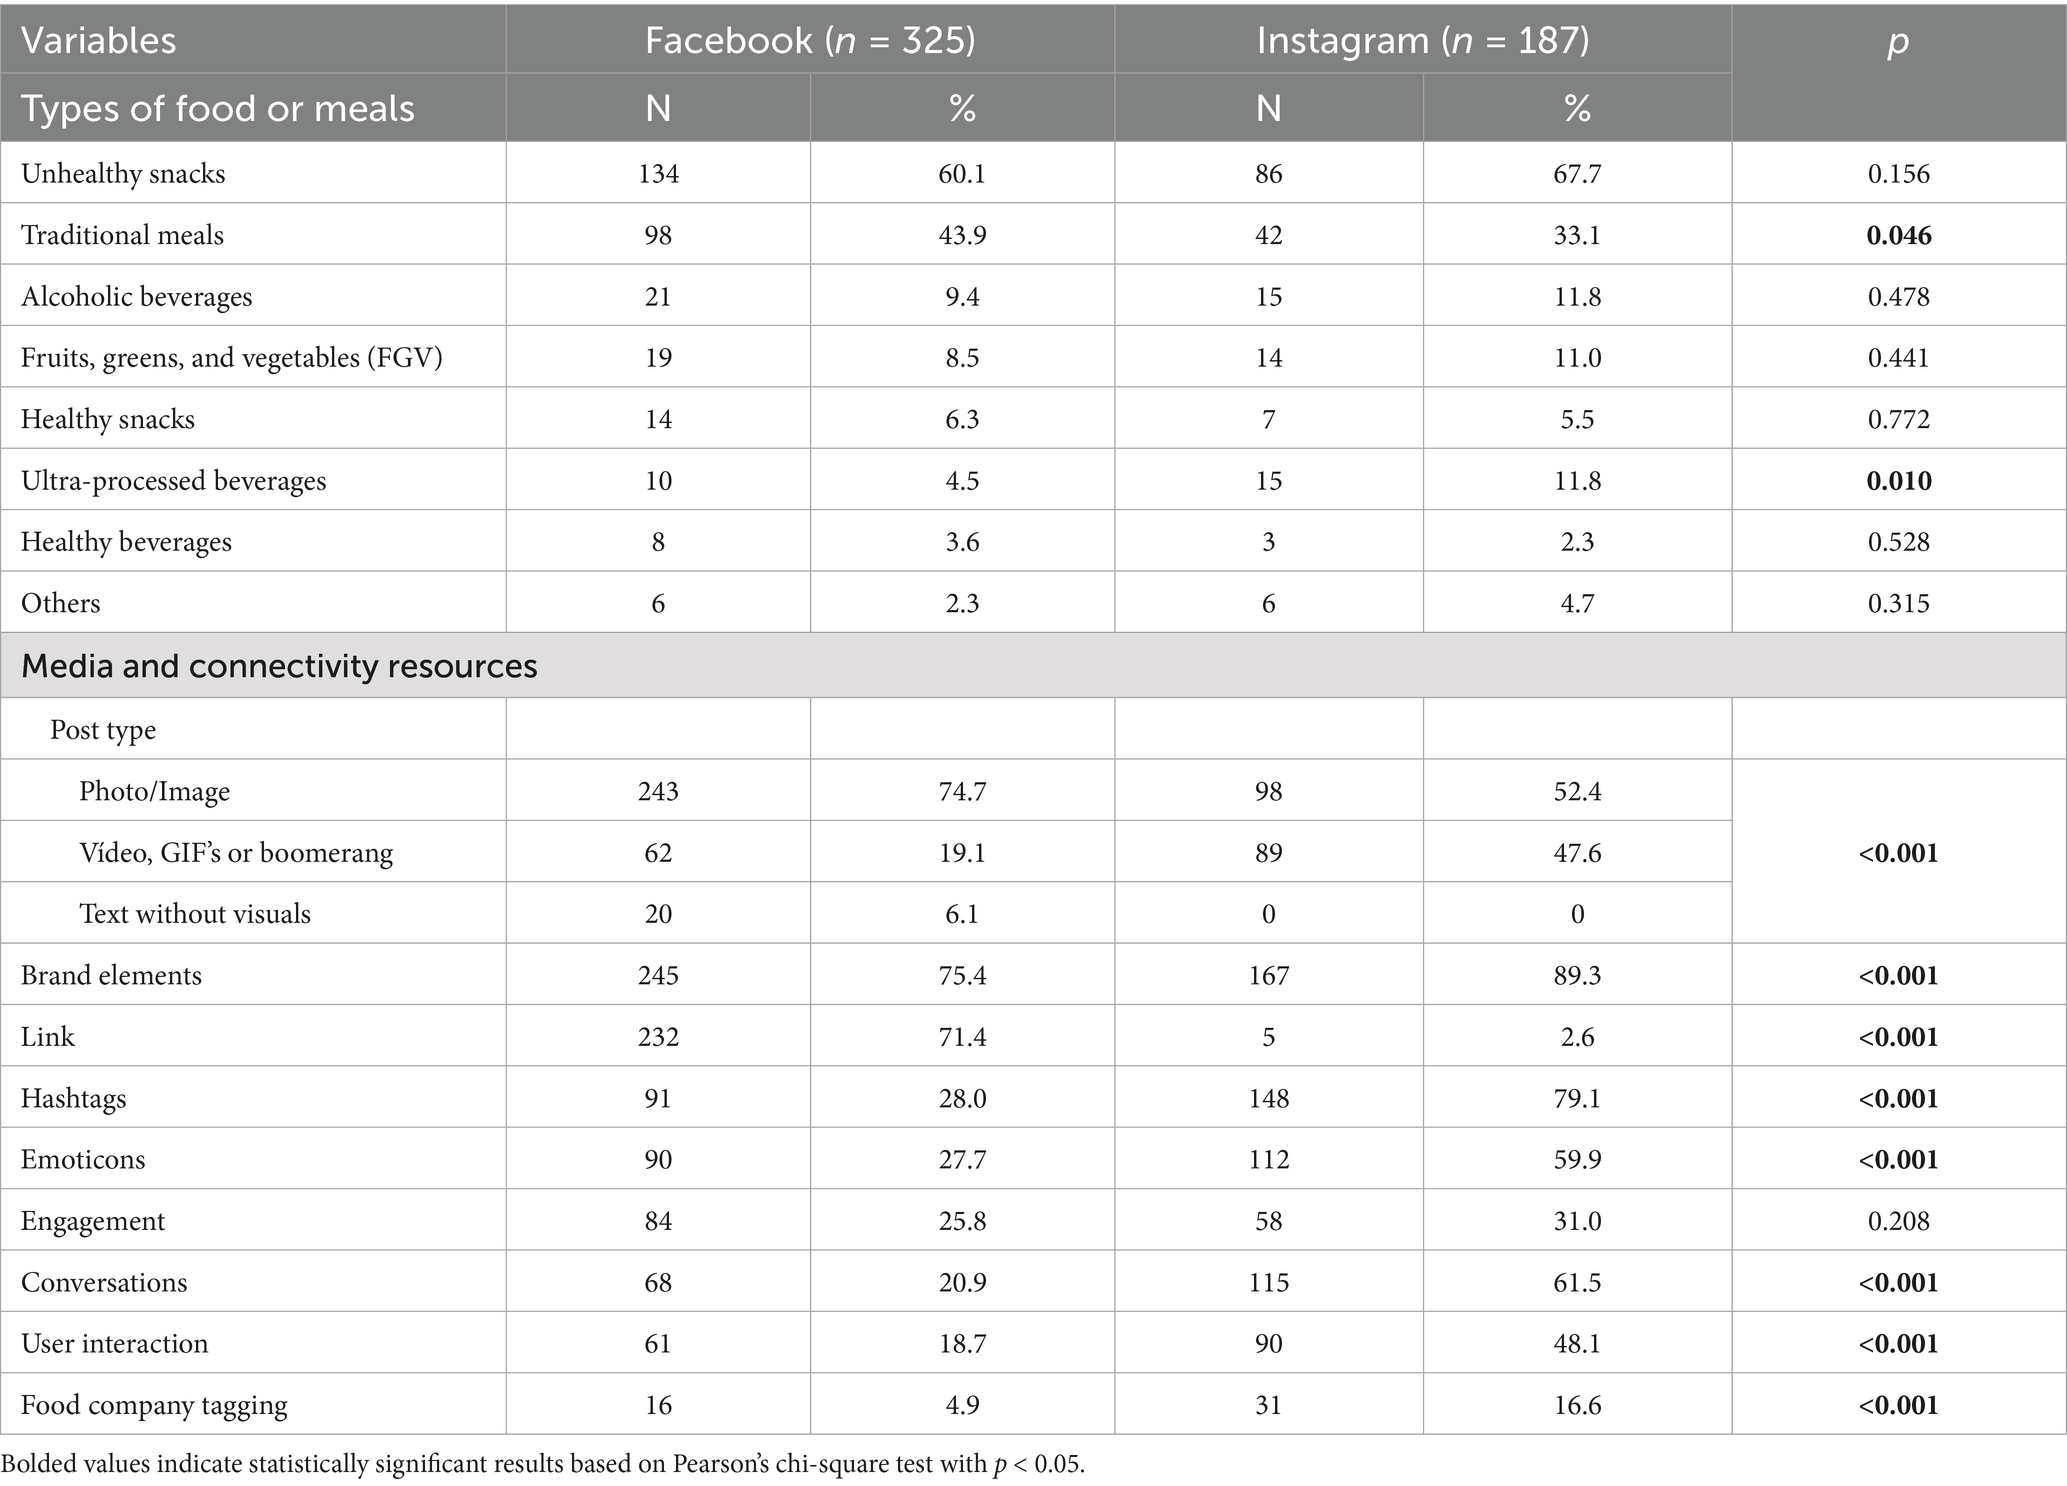
Table 2. Types of food, meals, and media/connectivity resources present in posts by the leading meal delivery app company on Facebook and Instagram in Brazil, 2011–2022.
Longitudinal analysis revealed a general decline in the use of food images on FB posts from 2014 onward and on IG from 2017 onward. However, both platforms showed an upward trend in such images starting in 2020 (Figure 2A). Regarding specific food categories, no clear pattern emerged for traditional meals on FB, while IG posts showed a downward trend over time (Figure 2B). The frequency of posts featuring alcoholic beverages remained relatively stable across both platforms, with a notable increase in 2021 (Figure 2B).
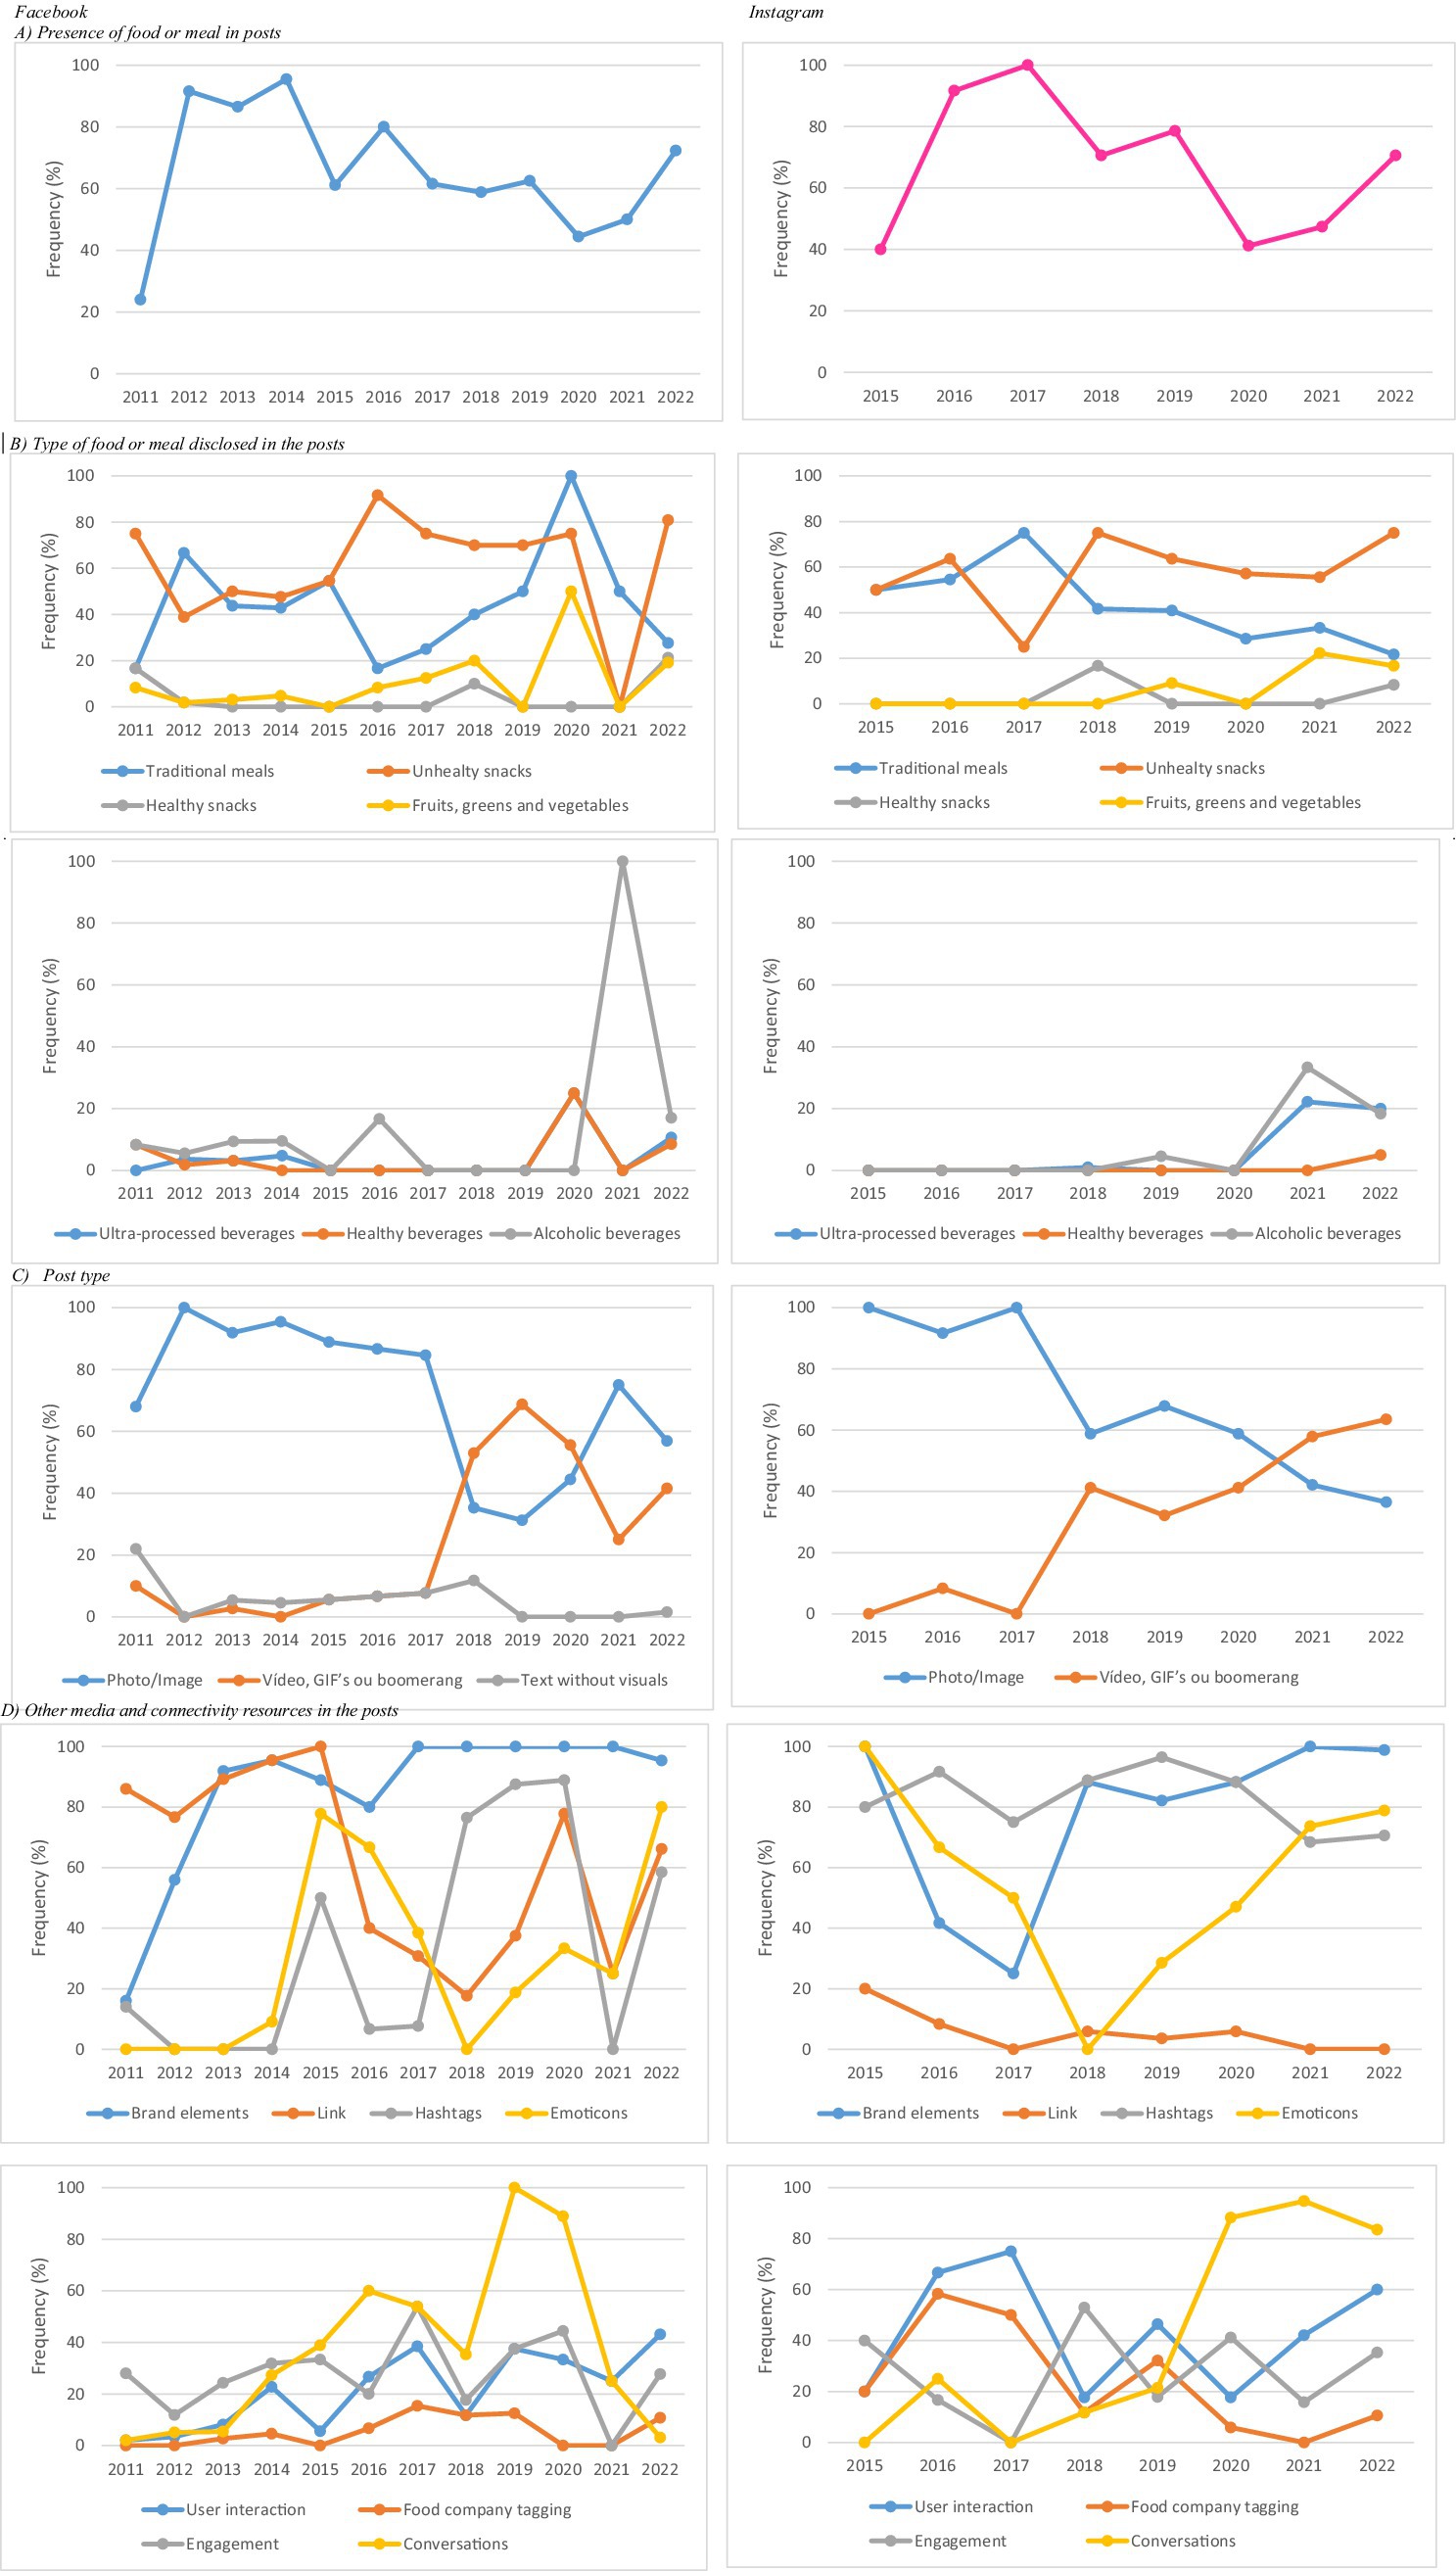
Figure 2. Longitudinal analysis of food types and media/connectivity resources in posts by the leading meal delivery app company on Facebook and Instagram in Brazil, 2011–2022.
Analysis of media and connectivity resources revealed significant differences between social media platforms (p < 0.001). IG posts more frequently featured dynamic visual content (such as videos, GIFs, or boomerangs) compared to FB (47.6% vs. 19.1%). In contrast, FB posts relied predominantly on static images (74.7% vs. 52.4% on IG), with text-only posts observed exclusively on this platform (6.1%). FB also exhibited a higher prevalence of links (71.4% vs. 2.6% on IG; p < 0.001). Conversely, IG posts more often incorporated brand elements (89.3% vs. 75.4%), hashtags (79.1% vs. 28.0%), conversational content (61.5% vs. 20.9%), and emoticons (59.9% vs. 27.7%) (all p < 0.001). Interaction features were also more common on IG, including user engagement (48.1% vs. 18.7%) and tagging of food companies (16.6% vs. 4.9%) (p < 0.001; Table 2).
Regarding trends in media and connectivity resources over time, dynamic formats such as videos, GIFs, and boomerangs increased on both platforms from 2017 onwards, while photo/image posts declined on IG (Figure 2C). The use of links fluctuated on FB, whereas it remained consistently low on IG (Figure 2D). Hashtag use was more frequent and consistent on IG throughout the period, while on FB it followed a less regular pattern (Figure 2D). Emoticon use declined on both platforms between 2015 and 2018, followed by an increase in 2019. Conversations became more frequent on IG posts from 2017 onward, while their presence declined on FB after 2019. In contrast, company tagging decreased on IG over time and remained stable on FB (Figure 2D). Examples of posts illustrating these features are provided in Supplementary Material 1.
Content analysis identified 12 thematic categories, as detailed in Table 3. The most prevalent themes on both platforms were brand institutional characteristics (69.2% on FB vs. 75.9% on IG; p = 0.105) and sensory appeals (54.7% on FB vs. 54.0% on IG; p = 0.868). The former encompassed posts highlighting brand identity through slogans, brand colors, or corporate initiatives, such as the campaigns “Living on Delivery” and “One Year of Free iFood.” The sensory category included content emphasizing food attributes like texture and visual appeal, often employing vivid language and imagery designed to trigger cravings.
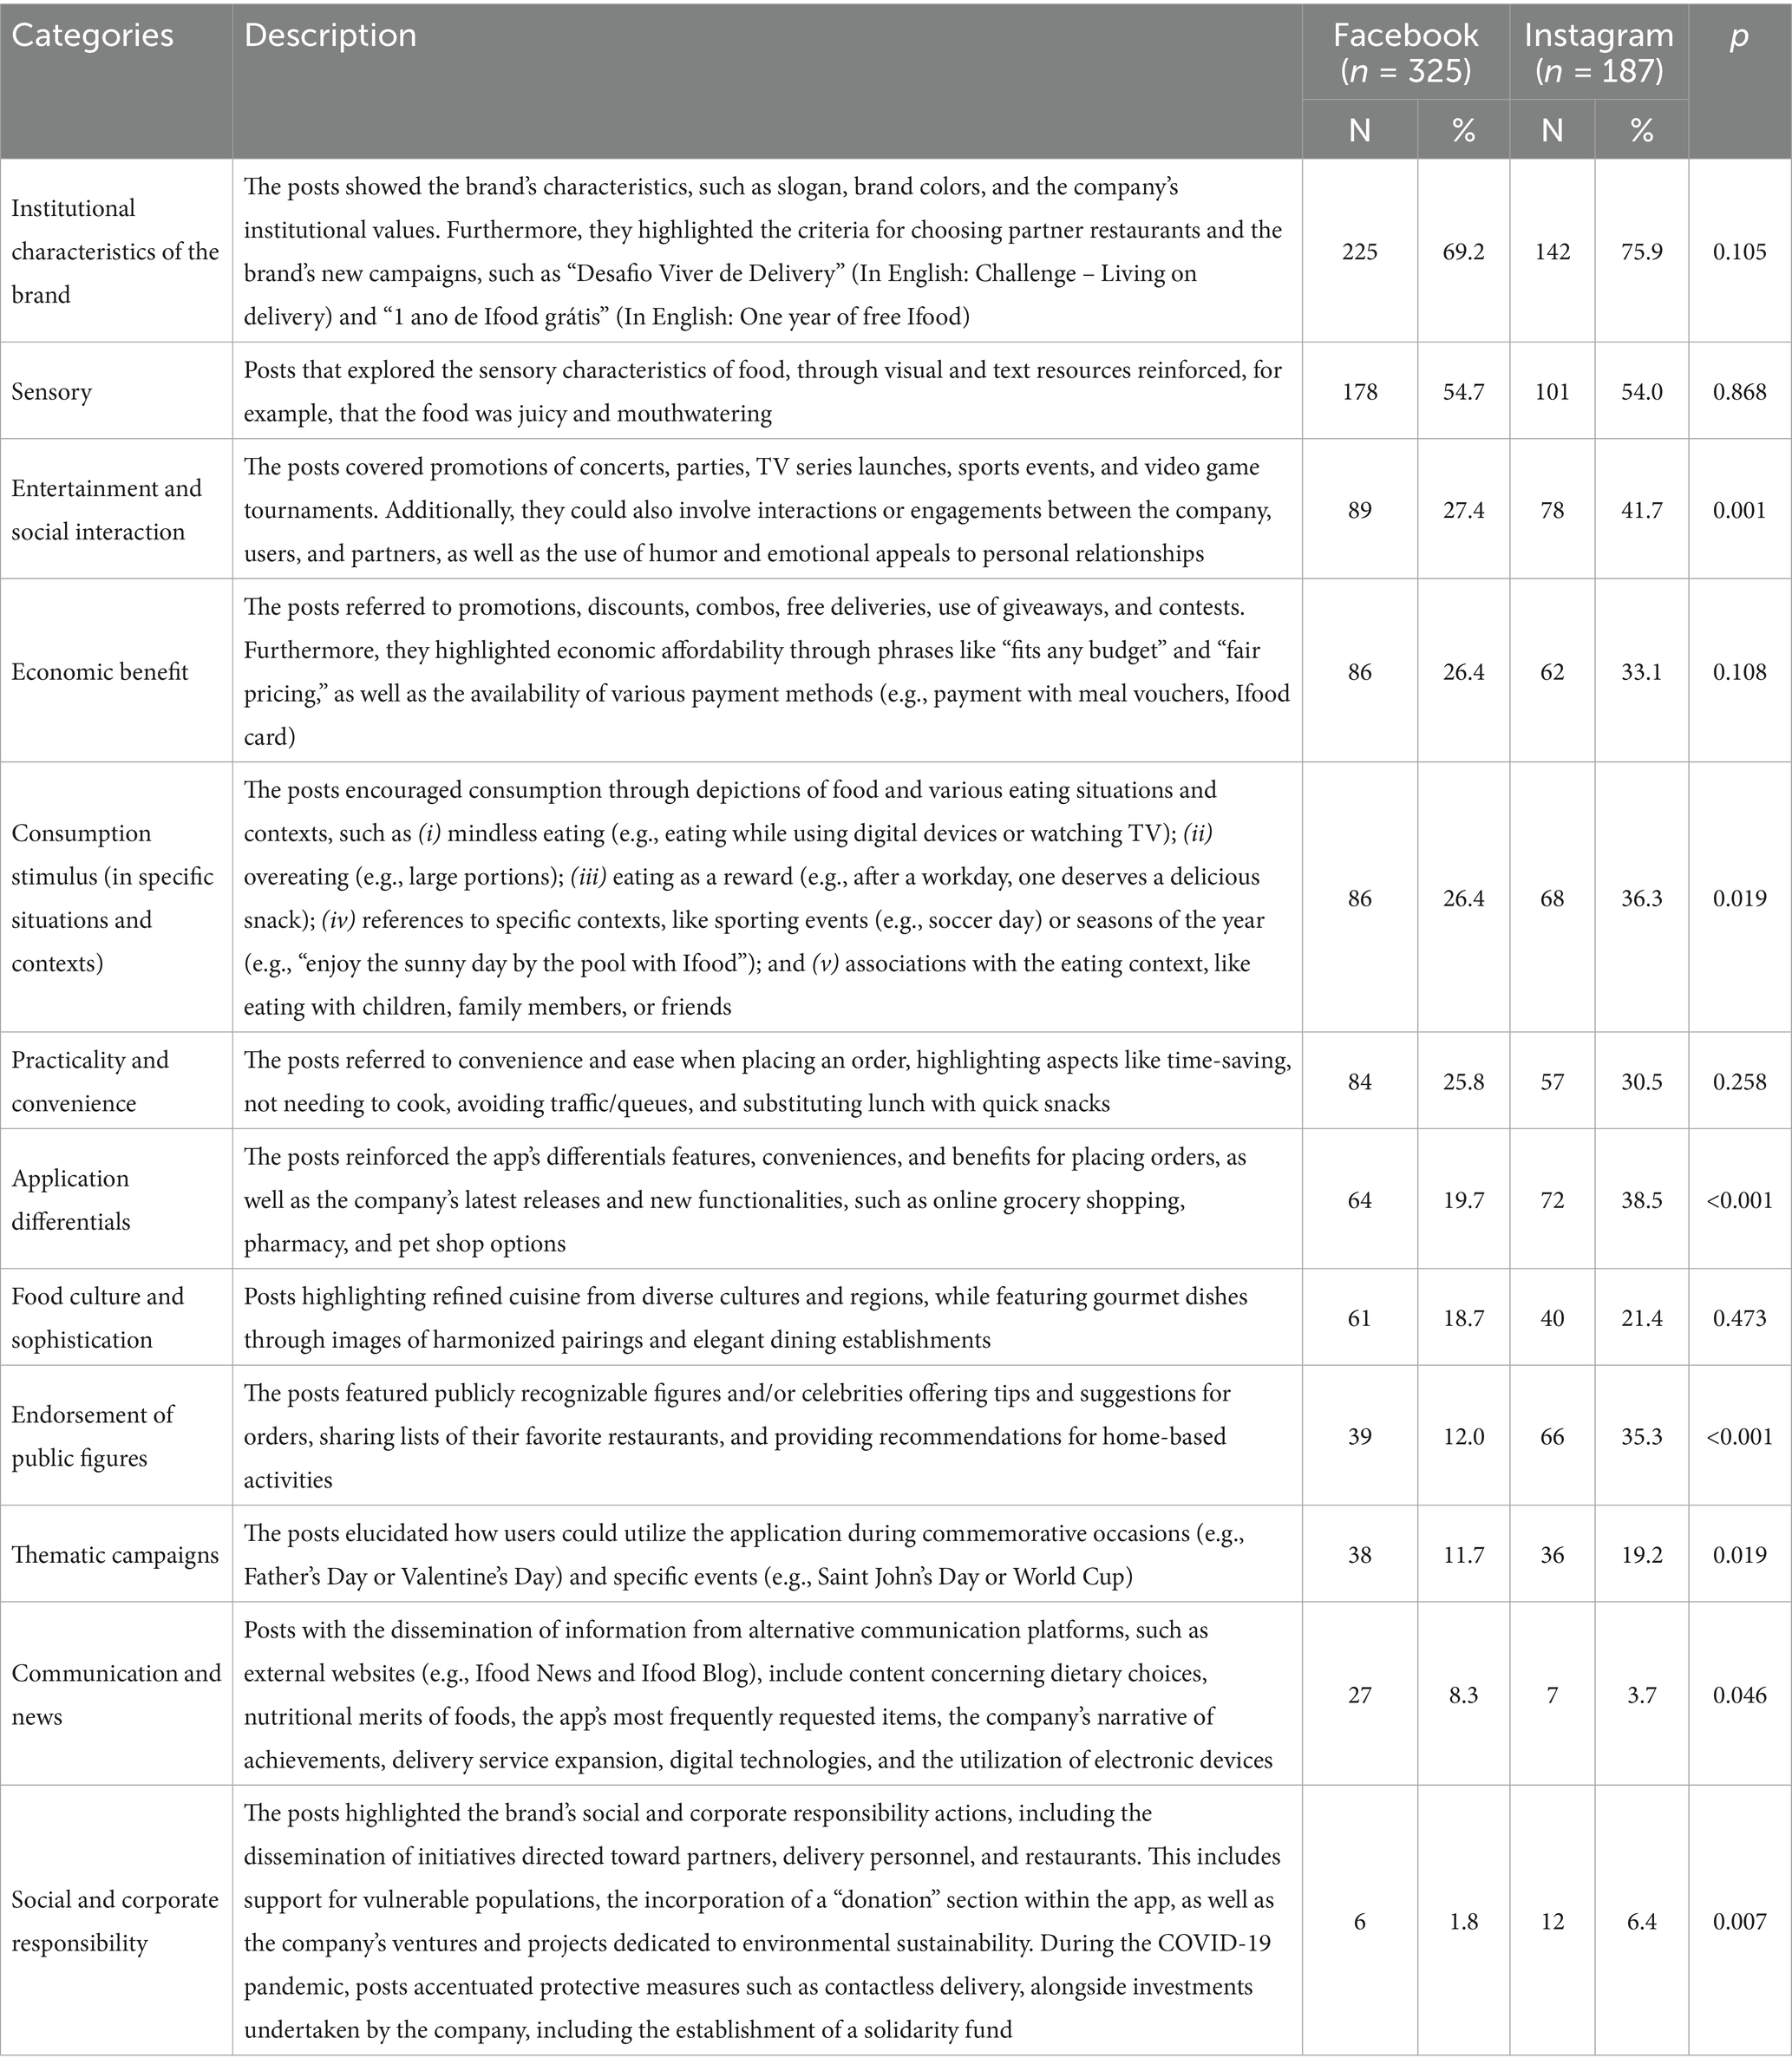
Table 3. Description of thematic categories in posts by the leading meal delivery app company on Facebook and Instagram in Brazil, 2011–2022.
Several themes appeared significantly more frequently on IG than on FB, reflecting distinct communication strategies. One of the most prominent was entertainment and social interaction (41.7% on IG vs. 27.4% on FB; p = 0.001), encompassing posts that promoted concerts, parties, TV series, sports, and events. These often featured interactions between the company, users, and partners, employing humor and emotional appeals related to personal relationships. The theme consumption stimulus in specific situations and contexts (36.3% on IG vs. 26.4% on FB; p = 0.019) included posts portraying various eating scenarios: (i) mindless eating (e.g., while watching TV); (ii) overeating (e.g., large portions); (iii) eating as a reward (e.g., after work); (iv) references to specific events (e.g., soccer matches); and (v) social eating contexts, such as meals with family or friends. The category application differentials (38.5% on IG vs. 19.7% on FB; p < 0.0001) highlighted app-related benefits (ease, speed, and variety) as well as new services, including grocery delivery, pharmacy access, and pet-related products. Endorsement of public figures (35.3% on IG vs. 12.0% on FB; p < 0.0001) was notably more frequent on IG, where celebrities and influencers promoted meals, recommended restaurants, or suggested at-home activities. These endorsements aimed to foster trust and emotional connection through familiar personalities.
The themes themed campaigns (19.2% on IG vs. 11.7% on FB; p = 0.019) and social and corporate responsibility (6.4% on IG vs. 1.8% on FB; p = 0.007) were also more prevalent IG. Themed campaigns referred to posts aligned with commemorative dates (e.g., Valentine’s Day) or major events (e.g., the World Cup). Posts under social and corporate responsibility, particularly during the COVID-19 pandemic, emphasized protective measures (e.g., contactless delivery) and highlighted the company’s involvement in solidarity initiatives, sustainability actions, support for delivery workers, and food donations. Other themes, although not statistically different between platforms, were still relevant. Economic benefit (33.1% on IG vs. 26.4% on FB; p = 0.108) included posts offering discounts, meal combos, and free delivery. Practicality and convenience focused on the app’s ease of use and time-saving advantages, frequently positioning delivery as an alternative to home cooking. Food culture and sophistication (21.4% on IG vs. 18.7% on FB; p = 0.473) encompassed content promoting gourmet or refined dishes, often paired with curated combinations and references to regional or international cuisines.
Only the category communication and news appeared more frequently on FB than on IG (8.3% vs. 3.7%; p = 0.046). Posts in this category often redirected users to external sources, such as the company’s blog, where content included nutritional information, benefits of specific foods (e.g., ice cream), and rankings of the most frequently ordered items on the app (Table 3). Examples of each thematic category are provided in Supplementary Material 2.
An analysis of thematic categories over time reveals distinct trends across platforms. On FB, institutional characteristics of the brand showed a generally upward trajectory, except for a marked decline in 2016. On IG, this theme initially declined but grew steadily from 2017 to 2020, maintaining high frequency through 2022. The category entertainment and social interaction followed a defined pattern on IG, with a decline between 2015 and 2017, followed by consistent growth—distinct from the trend observed on FB. The themes consumption stimulus in specific situations and contexts, practicality and convenience, and application differentials remained relatively stable on FB but showed increasing frequency on IG over time. The category endorsement of public figures was introduced in 2015 on FB and in 2016 on IG. Social and corporate responsibility was the most recent theme to emerge, first appearing on FB in 2018 and gaining prominence on IG from 2020 onward. Finally, communication and news remained stable on FB and was used on IG for the first time only in 2022 (Figure 3).
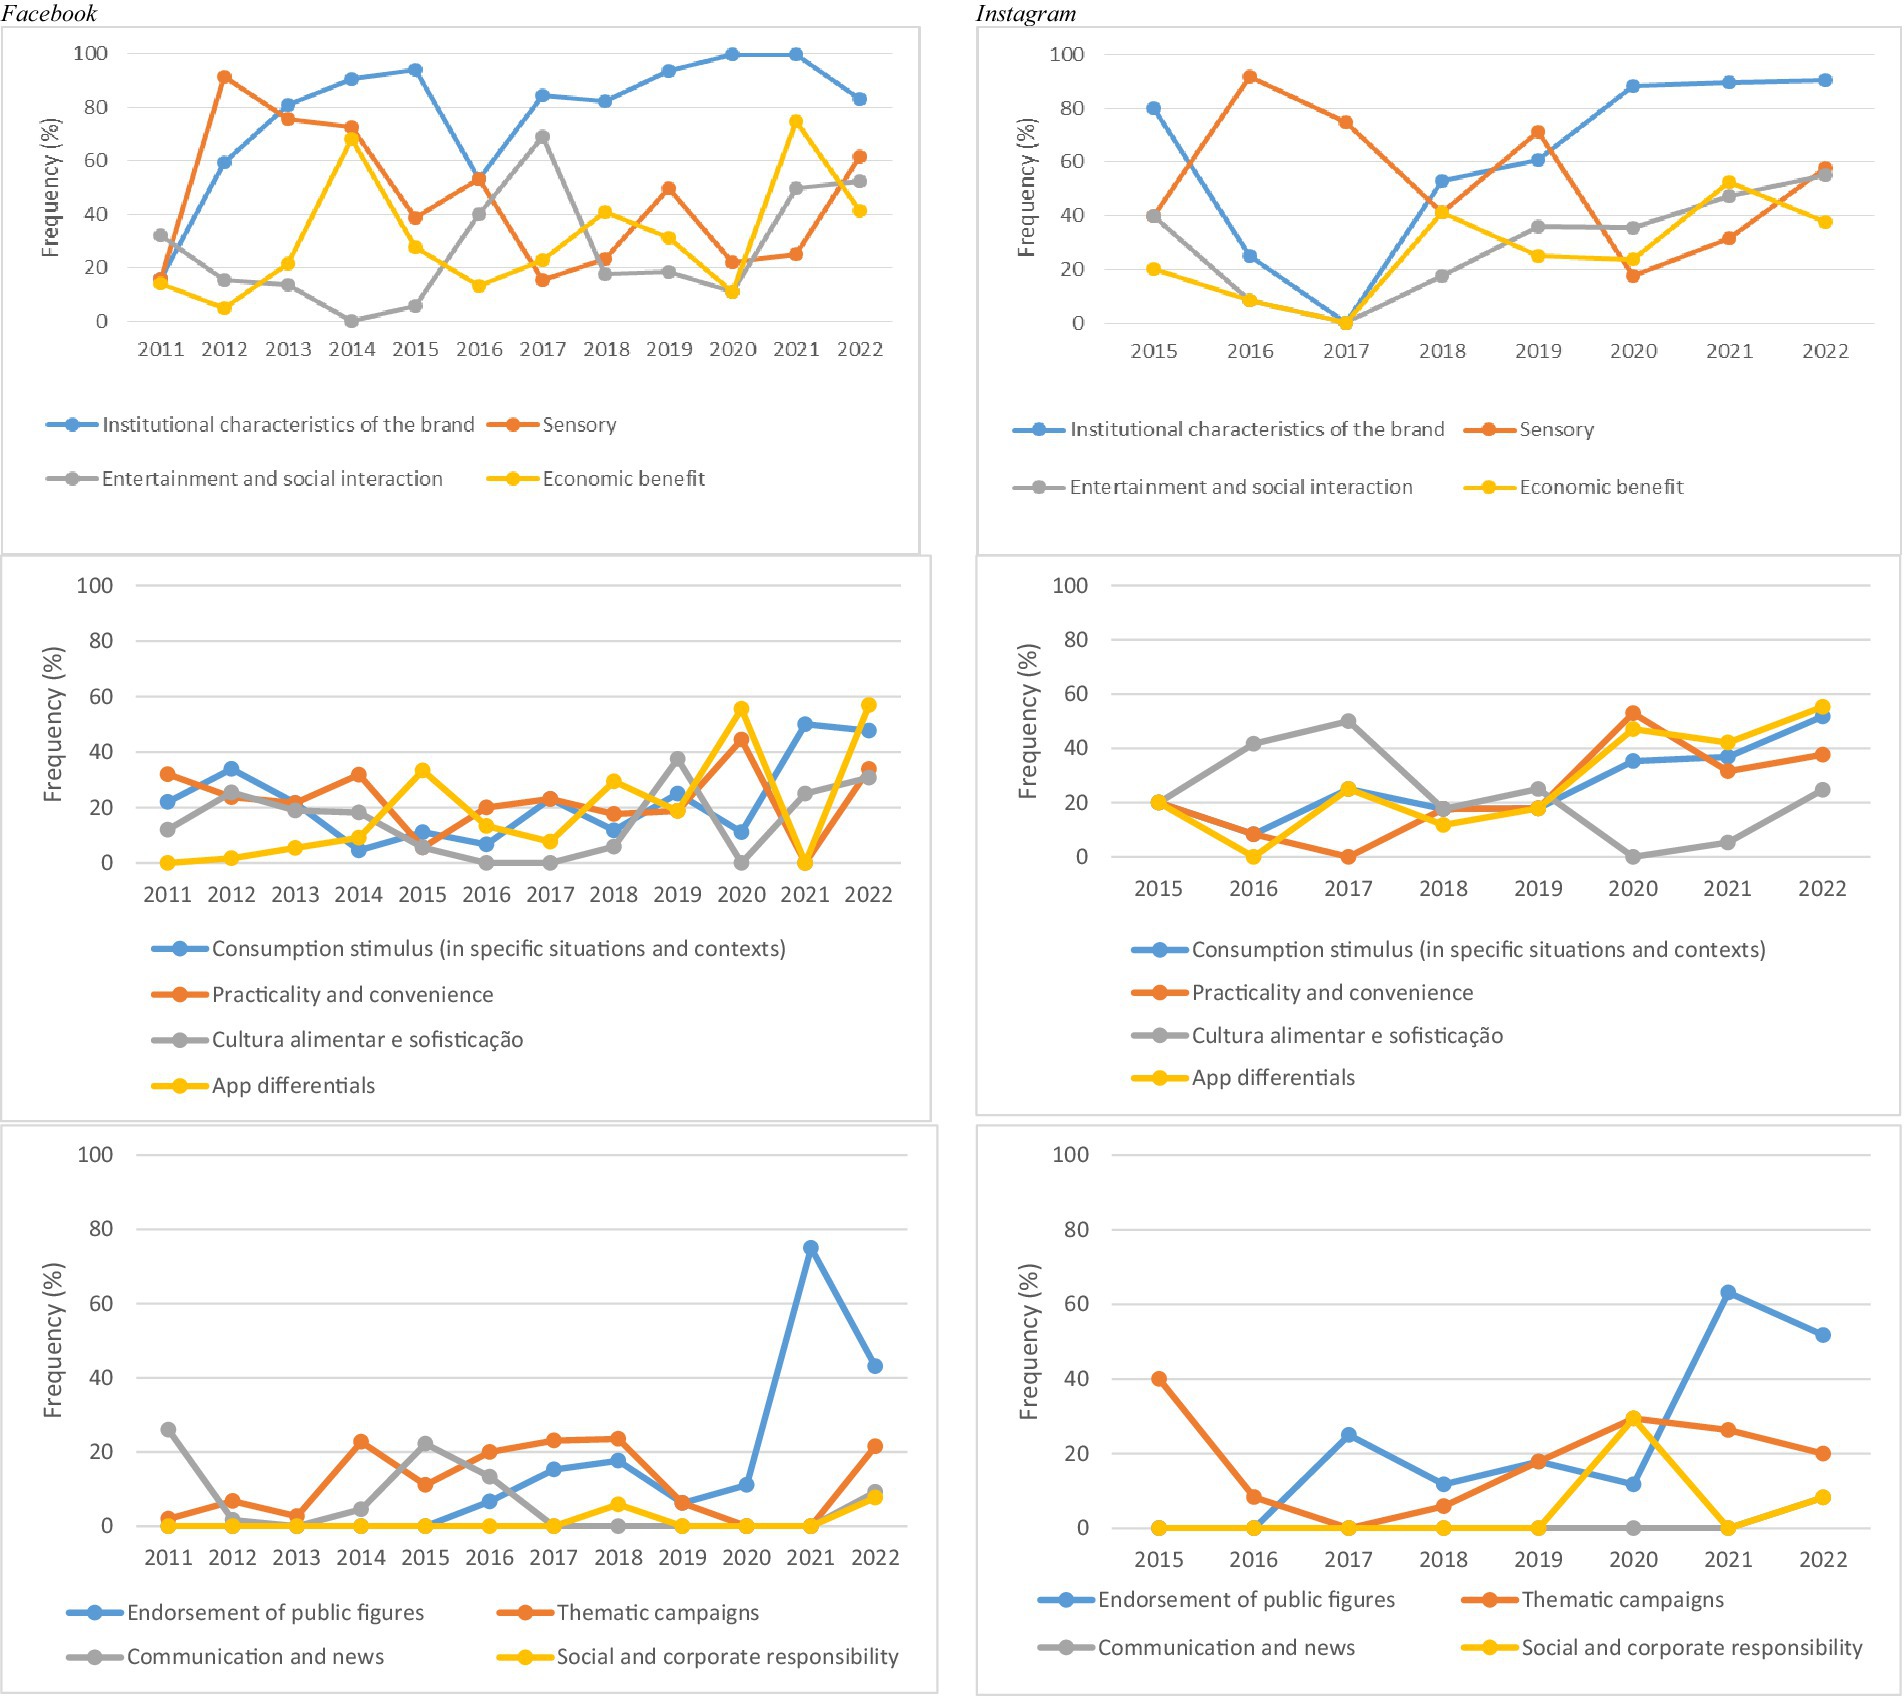
Figure 3. Longitudinal analysis of thematic categories in posts by the leading meal delivery app company on Facebook and Instagram in Brazil, 2011–2022.
4 Discussion
This study described, for the first time, the digital marketing content of the largest MDA company in Brazil on FB and IG, covering the period from 2011 to 2022. The findings show that the company consistently used social media platforms to promote its services through posts predominantly featuring unhealthy foods, marked by high interactivity and persuasive appeal.
The intensive use of digital marketing strategies by unhealthy food companies has raised significant public health concerns, as widespread exposure to such content may negatively affect health (28, 36). Among young people (12 to 30 years old), the most active users of digital media, exposure to this type of marketing increases the acceptability of unhealthy products and reduces the perceived risks of their consumption (21). Although evidence regarding adults remains limited (36), food companies have targeted this group with substantial volumes of digital marketing in several countries (37).
The predominance of posts promoting unhealthy products such as sweetened drinks, ice cream, and candy contrasts sharply with the limited promotion of FGV, healthy snacks, and beverages. This underscores the role of social media as a powerful tool for promoting foods offered by MDA establishments. Two studies, one cross-sectional (14) and one longitudinal (8), reported that over 50% of menu items available on MDAs in a Brazilian capital were unhealthy, including ultra-processed foods (8, 14).
Over the years, advertising patterns have shifted. Since 2014 on FB and 2017 on IG, there was a decline in food image posts. The COVID-19 pandemic likely influenced the company to realign its advertising strategy, incorporating more health-related content alongside the promotion of MDA offerings (38).
Another notable shift was the increased presence of alcoholic beverages in the company’s posts from 2020 onward. This trend coincides with the onset of the COVID-19 pandemic and a marked rise in alcohol consumption among the Brazilian population. Data from the Surveillance of Risk and Protective Factors for Chronic Diseases by Telephone Survey (VIGITEL) indicate that 2020 recorded the highest proportion of Brazilian adults reporting excessive alcohol consumption (20.9%) (39). A recent scoping review has highlighted concerns about the availability of alcoholic beverages via MDAs, especially given the insufficient enforcement of age restrictions (40). While conventional food and beverage establishments in Brazil explicitly prohibit the sale of alcohol to individuals under 18 years of age, the platform studied facilitates this practice. Customers purchasing alcoholic beverages on the platform are required only to confirm their age (“Yes, I am over 18 years of age”) before completing the transaction.
Comparing the two platforms, IG promoted more ultra-processed beverages and fewer traditional meals than FB. This aligns with user demographics: in 2020, 35% of Brazilian IG users were aged 18–29, while only 15% were 50 or older (41). On FB, these figures were 30 and 18%, respectively (41). In Brazil, younger individuals tend to have less healthy diets (42). Thus, the food profile promoted by the company on IG may be unintentionally reinforcing unhealthy eating habits among young people.
Furthermore, the company’s choice of communication platform is shaped not only by technical features but also by user attitudes, prior experience, platform knowledge, and social context (20, 43–44). These factors may help explain the company’s distinct engagement strategies across platforms. In terms of media and connectivity resources, the use of brand elements stood out on both platforms. This is a common strategy in food marketing on social media and is also widespread among MDA companies (45, 25–27). Consistent brand elements support consumer recognition and help build long-term relationships between companies and audiences. According to Maity et al. brand elements act as symbolic representations of the company and influence both platform choice and communication style (43).
Visually rich posts such as images, videos, GIFs, and boomerangs, were more common than purely textual content, especially on IG and in recent years. IG’s tools (e.g., transitions, audio, visual effects) make it easier to create short, engaging videos, which are well-suited to capturing attention through dynamic content (46, 47). According to Media Richness Theory (20, 43–44), IG qualifies as a “rich medium”: it enables immediate feedback, combines multiple cues (video, audio, visuals), and conveys emotion effectively. This aligns with the preferences of younger users, who are drawn to fast-paced, visually stimulating content. In contrast, FB may be considered a “leaner” medium, less stimulating but more conducive to memory retention through linear, text-based interaction. Based on this, richer media may drive short-term engagement with minimal cognitive effort, while leaner media may enhance long-term brand recall. This suggests platform-specific strategies: on IG, brands may prioritize volume, interactivity, and visual impact; on FB, they may focus on message clarity and reinforcing brand identity (20, 43–44).
The company also used features designed for digital interaction, such as hashtags, emoticons, user tagging, engagement prompts, and conversations, especially on IG. Hashtags increase visibility beyond followers; emoticons add emotion or context; tagging supports the spread of user-generated content without requiring explicit advertising disclosure. Engagement prompts (like calls for likes, shares, or comments) amplify message reach. Conversations offer a channel for the company to hear user experiences and feedback. Tagging other food companies in a post fosters collaboration and broadens the ad’s target audience. These tools highlight IG’s strength in enabling interactive, emotionally resonant, and high-reach marketing campaigns (48). In contrast, FB’s more static environment may be better suited for strategic messaging aimed at an older, more passive audience. Once again, Media Richness Theory helps explain these choices: platforms are not neutral but are differently suited to particular types of communication and audiences (20, 43).
The thematic analysis revealed 12 categories. Many reflect common dimensions of food marketing across different media types. For example, studies on television advertising often track sensory appeals, consumption stimuli—such as usage suggestions or targeted recommendations (e.g., for children)—and economic benefits, including contests, price discounts, or loyalty programs (49). Other similarities between traditional and digital media include the use of public figure endorsements and thematic campaigns tied to events or commemorative dates (49).
Other themes identified were specific to the digital environment. Notably, entertainment and social interaction and communication and news reflect the interactive nature of social media content. Prior research has shown that this includes the use of media tools, such as apps, games, links, hashtags, and emoticons, as well as strategies to promote user interaction, like liking, commenting, sharing, or downloading content (45).
Our study also revealed themes characteristic of MDA services. The theme practicality and convenience aligns with contemporary lifestyles marked by long working hours and the pursuit of efficiency, particularly in domestic tasks (1). The appeal of meal delivery without leaving home and the ease of kitchen organization help explain the popularity of these posts (1). The theme application differentials refers to the promotion of new app features and user benefits during the ordering process. These functionalities stem from major technological investments by MDAs, including artificial intelligence, and are personalized using user data—such as browsing history, order patterns, timing, location, and device used (1). The theme food culture and sophistication also emerged in the posts, reflecting the inclusion of “haute cuisine” restaurants in the platform, aimed at a higher-income (50).
Another recurring theme was social and corporate responsibility, often highlighted during the COVID-19 pandemic (51, 52). Initiatives included food donations to vulnerable populations and messages promoting environmental sustainability, such as financial support for protecting Brazilian biomes (31). While these actions address relevant social and environmental issues, they also serve as strategic marketing tools (53). They help build a positive brand image, shape consumer preferences (54), and may reduce the perceived harm of certain products—ultimately encouraging the consumption of items that pose potential health risks (28, 54).
Regarding thematic differences between platforms, we observed that the company used FB mainly for informative or news-oriented content, while IG featured a wider range of themes. Voorveld et al. highlight that consumer engagement and advertising on social media vary according to contextual factors and personal interactions within each platform (24). FB is structured around user profiles, supporting relationship-building and personalized messaging. IG, on the other hand, is centered on creative content and the communal sharing of topics of interest (22, 24).
Based on the findings of the study, two main perspectives emerge: (i) monitoring MDA marketing: our results highlight the need to standardize and improve monitoring methods for MDA marketing in the digital environment. This includes evaluating the types of foods advertised, using platform-specific tools, and adopting qualitative approaches to better understand marketing strategies. Such efforts must consider the unique characteristics of each social media platform. And (ii) advancing the regulatory agenda: currently, Brazil lacks legal restrictions on digital food marketing by MDAs. Given the nature of these marketing strategies and their role in promoting unhealthy eating habits, consumer protection laws and regulations that ensure healthy eating should be expanded to cover this area.
This study has some limitations. It analyzed only one MDA company; however, this company dominates the Brazilian market (31). Additionally, the analysis focused solely on official social media posts, excluding other communication channels and personalized advertising formats. These include artificial intelligence powered tools and algorithms that track consumer behavior to tailor content (1, 16).
Despite these limitations, the study has notable strengths. It is the first to examine an MDA company’s performance across two distinct social media platforms over a 12-year period. This extended timeframe allows for comparison of diverse advertising tactics based on each platform’s unique features. The mixed-methods approach, combining qualitative and quantitative analyses, enabled a comprehensive evaluation of food types, social media tools, and thematic content in the advertisements.
In sum, the findings provide insight into how this company skillfully uses social media to promote less healthy foods and beverages. It employs contemporary, dynamic, and highly persuasive marketing strategies that engage the audience directly, responding to their needs while adapting to shifting societal values and evolving social and economic dynamics. The use of social media by MDA platforms has the potential to reshape dietary patterns and reinforce the consumption of ultra-processed foods and alcoholic beverages. This convergence of factors may make these digital spaces harmful to public health. Therefore, rigorous measures, such as regulating these platforms and their marketing strategies are essential to foster healthier food environments.
Data availability statement
The raw data supporting the conclusions of this article will be made available by the authors, without undue reservation. Requests to access these datasets should be directed to the corresponding author.
Author contributions
PB: Data curation, Writing – original draft, Conceptualization, Investigation, Writing – review & editing, Methodology, Formal analysis. JM: Formal analysis, Data curation, Writing – review & editing, Methodology, Writing – original draft. MR: Methodology, Investigation, Data curation, Writing – review & editing, Formal analysis, Writing – original draft. RC: Writing – original draft, Investigation, Writing – review & editing, Methodology. PH: Supervision, Writing – review & editing, Data curation, Visualization, Conceptualization, Writing – original draft.
Funding
The author(s) declare that financial support was received for the research and/or publication of this article. PAAB was supported by a scholarship from the Minas Gerais Research Foundation (FAPEMIG), Brazil (grant number 5.24/2021) and Pró-reitoria de Pesquisa da Universidade Federal de Minas Gerais (PRPq/UFMG) (grant 02/2025).
Conflict of interest
The authors declare that the research was conducted in the absence of any commercial or financial relationships that could be construed as a potential conflict of interest.
Generative AI statement
The authors declare that no Gen AI was used in the creation of this manuscript.
Correction note
This article has been corrected with minor changes. These changes do not impact the scientific content of the article.
Publisher’s note
All claims expressed in this article are solely those of the authors and do not necessarily represent those of their affiliated organizations, or those of the publisher, the editors and the reviewers. Any product that may be evaluated in this article, or claim that may be made by its manufacturer, is not guaranteed or endorsed by the publisher.
Supplementary material
The Supplementary material for this article can be found online at: https://www.frontiersin.org/articles/10.3389/fnut.2025.1620348/full#supplementary-material
References
1. World Health Organization. Regional Office for Europe. Slide to order: a food systems approach to meals delivery apps: WHO European Office for the Prevention and Control of noncommunicable diseases. World Health Organization. Regional Office for Europe. (2021). https://apps.who.int/iris/handle/10665/350121. Licença: CC BY-NC-SA 3.0 IGO
2. Pigatto, G, Machado, JGdCF, Negreti, AdS, and Machadoi, LM. Analysis of online food delivery companies in Brazil. Br Food J Bingley: Emerald Group Publishing Ltd. (2017) 119:639–57. doi: 10.1108/BFJ-05-2016-0207
3. Botelho, LV, Cardoso, LO, and Canella, DS. COVID-19 and the digital food environment in Brazil: reflections on the pandemic's influence on the use of food delivery apps. Cad Saude Publica. (2020) 36:e00148020. doi: 10.1590/0102-311X00148020
4. Maimaiti, M, Zhao, X, Jia, M, Ru, Y, and Zhu, S. How we eat determines what we become: opportunities and challenges brought by food delivery industry in a changing world in China. Eur J Clin Nutr. (2018) 72:1282–6. doi: 10.1038/s41430-018-0191-1
5. Statista. Number of users of the online food delivery market worldwide from 2018 to 2028, by segment. Available online at: https://www.statista.com/forecasts/891088/online-food-delivery-users-by-segment-worldwide (Accessed in November 2022).
6. Statista. Number of users of online food delivery services in Brazil from 2017 to 2028, by segment. Available online at: https://www.statista.com/forecasts/1135443/brazil-online-food-delivery-users-by-segment (Accessed in November 2022).
7. Brar, K, and Minaker, LM. Geographic reach and nutritional quality of foods available from mobile online food delivery service applications: novel opportunities for retail food environment surveillance. BMC Public Health. (2021) 21. Published 2021 Mar 6:458. doi: 10.1186/s12889-021-10489-2
8. Horta, PM, Souza, JPM, and Mendes, LL. Food promoted on an online food delivery platform in a Brazilian metropolis during the COVID-19 pandemic: a longitudinal analysis. Public Health Nutr. (2022) 25:1–23. doi: 10.1017/S1368980022000489
9. Dai, X, Wu, L, and Hu, W. Nutritional quality and consumer health perception of online delivery food in the context of China. BMC Public Health. (2022) 22:2132. doi: 10.1186/s12889-022-14593-9
10. Norriss, D, Crossin, R, Curl, A, Bidwell, S, Clark, E, Pocock, T, et al. Food outlet access and the healthiness of food available 'on-demand' via meal delivery apps in New Zealand. Nutrients. (2022) 14:4228. doi: 10.3390/nu14204228
11. Partridge, SR, Gibson, AA, Roy, R, Malloy, JA, Raeside, R, Jia, SS, et al. Junk food on demand: a cross-sectional analysis of the nutritional quality of popular online food delivery outlets in Australia and New Zealand. Nutrients. (2020) 12:3107. doi: 10.3390/nu12103107
12. Poelman, MP, Thornton, L, and Zenk, SN. A cross-sectional comparison of meal delivery options in three international cities. Eur J Clin Nutr. (2020) 74:1465–73. doi: 10.1038/s41430-020-0630-7
13. Horta, PM, Souza, JPM, Rocha, LL, and Mendes, LL. Digital food environment of a Brazilian metropolis: food availability and marketing strategies used by delivery apps. Public Health Nutr. (2021) 24:544–8. doi: 10.1017/S1368980020003171
14. Horta, PM, Matos, JP, and Mendes, LL. Digital food environment during the coronavirus disease 2019 (COVID-19) pandemic in Brazil: an analysis of food advertising in an online food delivery platform. Br J Nutr. (2021) 126:767–72. doi: 10.1017/S0007114520004560
15. Stephens, J, Miller, H, and Militello, L. Food delivery apps and the negative health impacts for Americans. Front Nutr. (2020) 7:14. Published 2020 Feb 20. doi: 10.3389/fnut.2020.00014
16. Bates, S, Reeve, B, and Trevena, H. A narrative review of online food delivery in Australia: challenges and opportunities for public health nutrition policy. Public Health Nutr. (2023) 26:262–72. doi: 10.1017/S1368980020000701
17. Pagliai, G, Dinu, M, Madarena, MP, Bonaccio, M, Iacoviello, L, and Sofi, F. Consumption of ultra-processed foods and health status: a systematic review and meta-analysis. Br J Nutr. (2021) 125:308–18. doi: 10.1017/S0007114520002688
18. Monteiro, CA, Cannon, G, Moubarac, JC, Levy, RB, Louzada, MLC, and Jaime, PC. The UN decade of nutrition, the NOVA food classification and the trouble with ultra-processing. Public Health Nutr. (2018) 21:5–17. doi: 10.1017/S1368980017000234
19. Appel, G, Grewal, L, Hadi, R, and Stephen, AT. The future of social media in marketing. J Acad Mark Sci. (2020) 48:79–95. doi: 10.1007/s11747-019-006951
20. Ishii, K, Lyons, MM, and Carr, SA. Revisiting media richness theory for today and future. Hum Behav Emerg Technol. (2019) 1:124–131. doi: 10.1002/hbe2.138
21. Buchanan, L, Kelly, B, Yeatman, H, and Kariippanon, K. The effects of digital marketing of unhealthy commodities on young people: a systematic review. Nutrients. (2018) 10:148. doi: 10.3390/nu10020148
22. Zhu, YQ, and Chen, HG. Social media and human need satisfaction: implications for social media marketing. Bus Horiz. (2015) 58:335–45. ISSN 0007-6813. doi: 10.1016/j.bushor.2015.01.006
23. Statista. Number of users of selected social media platforms in Brazil from 2017 to 2027, by platform. Available online at: https://www.statista.com/statistics/1346220/social-media-users-brazil-by-platform/ (Accessed in December 2022).
24. Voorveld, HAM, van Noort, G, Muntinga, DG, and Bronner, F. Engagement with social media and social media advertising: the differentiating role of platform type. J Advert. (2018) 47:38–54. doi: 10.1080/00913367.2017.1405754
25. Jia, SS, Raeside, R, Redfern, J, Gibson, AA, Singleton, A, and Partridge, SR. #SupportLocal: how online food delivery services leveraged the COVID-19 pandemic to promote food and beverages on Instagram. Public Health Nutr. (2021) 24:4812–22. doi: 10.1017/S1368980021002731
26. Botelho, LV, Freitas, JV, Camara, AOD, de Almeida, IF, Gonçalves, TS, Horta, PM, et al. Digital marketing of online food delivery services in a social media platform before and during COVID-19 pandemic in Brazil. Public Health Nutr. (2023) 26:1–11. doi: 10.1017/S1368980022002191
27. Rodrigues, MB, Matos, JP, and Horta, PM. Food delivery apps took advantage of the first phase of the Covid-19 pandemic in Brazil. Demetra (Internet) 14 October 2024 [cited 29 May 2025]; 19:e73696. Available online at: https://www.e-publicacoes.uerj.br/demetra/article/view/73696 (Accessed in April 2022).
28. Ares, G, Natero, V, Gugliucci, V, Machín, L, Alcaire, F, de León, C, et al. Health-washing of ultraprocessed products on Instagram: prevalence and strategies in an emerging market. J Nutr Educ Behav. (2023) 55:815–22. doi: 10.1016/j.jneb.2023.09.001
29. Bragg, MA, Pageot, YK, Amico, A, Miller, AN, Gasbarre, A, Rummo, PE, et al. Fast food, beverage, and snack brands on social media in the United States: an examination of marketing techniques utilized in 2000 brand posts. Pediatr Obes. (2020) 15:e12606. doi: 10.1111/ijpo.12606
30. Vassallo, AJ, Kelly, B, Zhang, L, Wang, Z, Young, S, and Freeman, B. Junk food marketing on Instagram: content analysis. JMIR Public Health Surveill. (2018) 4:e54. Published 2018 Jun 5. doi: 10.2196/publichealth.9594
31. Ifood institucional. Available online at: https://institucional.ifood.com.br/
32. BRAZIL. Ministry of Health. (2014). Food guide for the Brazilian population. Brasília. Available online at: https://bvsms.saude.gov.br/bvs/publicacoes/guia_alimentar_populacao_brasileira_2ed.pdf
33. Brownbill, AL, Miller, CL, and Braunack-Mayer, AJ. The marketing of sugar-sweetened beverages to young people on Facebook. Aust N Z J Public Health. (2018) 42:354–60. doi: 10.1111/1753-6405.12801
34. Kelly, B, Vandevijvere, S, Freeman, B, and Jenkin, G. New media but same old tricks: food marketing to children in the digital age. Curr Obes Rep. (2015) 4:37–45. doi: 10.1007/s13679-014-0128-5
35. Braun, V, and Clarke, V. Using thematic analysis in psychology. Qual Res Psychol. (2006) 3:77–101. doi: 10.1191/1478088706qp063oa
36. World Health Organization. Food marketing exposure and power and their associations with food-related attitudes, beliefs and behaviours: a narrative review. Geneva: World Health Organization (2022) Licence: CC BY-NC-SA 3.0 IGO.
37. Nieto, C, Jáuregui, A, Contreras-Manzano, A, Potvin Kent, M, Sacks, G, White, CM, et al. Adults' exposure to unhealthy food and beverage marketing: a multi-country study in Australia, Canada, Mexico, the United Kingdom, and the United States. J Nutr. (2022) 152:25S–34S. doi: 10.1093/jn/nxab449
38. Rodrigues, MB, Matos, JP, and Horta, PM. The COVID-19 pandemic and its implications for the food information environment in Brazil. Public Health Nutr. (2021) 24:321–6. doi: 10.1017/S1368980020004747
39. Brazil. Ministry of Health. Health Surveillance Secretariat. Department of Health Analysis and Noncommunicable Disease Surveillance. Vigitel Brasil 2006-2020: smoking and alcohol abuse. Surveillance of risk and protective factors for chronic diseases by telephone survey: estimates on the frequency and sociodemographic distribution of smoking and alcohol abuse in the capitals of the 26 Brazilian states and the Federal District between 2006 and 2020/Ministry of Health, Secretariat of Surveillance in Health, Department of Health Analysis and Noncommunicable Disease Surveillance – Brasília: Ministry of Health. (2022),
40. Duthie, C, Pocock, T, Curl, A, Clark, E, Norriss, D, Bidwell, S, et al. Online on-demand delivery services of food and alcohol: a scoping review of public health impacts. SSM Popul Health. (2023) 21:101349. doi: 10.1016/j.ssmph.2023.101349
41. Statista. Distribution of leading social media platform users in Brazil as of May 2022, by age group. Available online at: https://www.statista.com/statistics/1332416/brazil-social-media-apps-users-age-group/ (Accessed in December 2022).
42. Louzada, MLDC, Cruz, GLD, Silva, KAAN, et al. Consumption of ultra-processed foods in Brazil: distribution and temporal evolution 2008-2018. Rev Saude Publica. (2023) 57:1–13. doi: 10.11606/s1518-8787.2023057004744
43. Maity, M, Dass, M, and Kumar, P. The impact of media richness on consumer information search and choice. J Bus Res. (2018) 87:36. doi: 10.1016/j.jbusres.2018.02.003
44. Wang, Z. Media richness and continuance intention to online learning platforms: the mediating role of social presence and the moderating role of need for cognition. Front Psychol. (2022) 13:950501. doi: 10.3389/fpsyg.2022.950501
45. Matos, JP, Rodrigues, MB, Duarte, CK, and Horta, PM. A scoping review of observational studies on food and beverage advertising on social media: a public health perspective. Int J Environ Res Public Health. (2023) 20:3615 2023 Feb 17. doi: 10.3390/ijerph20043615
46. Kusumasondjaja, S. The roles of message appeals and orientation on social media brand communication effectiveness: an evidence from Indonesia. Asia Pac J Mark Logist. (2018) 30:1135–58. doi: 10.1108/APJML-10-2017-0267
47. Instagram. (2023). Reels. Create, share and watch short, fun videos. Available online at: https://about.instagram.com/pt-br/features/reels.
48. Ifood Partners. (2023). Available online at: https://blog-parceiros.ifood.com.br/redes-sociais-para-restaurantes/
49. Kelly, B. INFORMAS protocol: food promotion module: food marketing—television protocol. The University of Auckland. J Contrib. (2017) v1:1–36. doi: 10.17608/k6.auckland.5664706.v1
50. Ifood Gourmet. (2023). The gastronomic experience. Available online at: https://guia-gourmet.ifood.com.br/
51. Tsai, KA, Cassidy, O, Arshonsky, J, Bond, S, Del Giudice, IM, and Bragg, MA. COVID-washing in US food and beverage marketing on Twitter: content analysis. JMIR Form Res. (2022) 6:e37642 2022 Oct 14. doi: 10.2196/37642
52. Antúnez, L, Alcaire, F, Brunet, G, Bove, I, and Ares, G. COVID-washing of ultra-processed products: the content of digital marketing on Facebook during the COVID-19 pandemic in Uruguay. Public Health Nutr. (2021) 24:1142–52. doi: 10.1017/S1368980021000306
53. Pantani, D, Peltzer, R, Cremonte, M, Robaina, K, Babor, T, and Pinsky, I. The marketing potential of corporate social responsibility activities: the case of the alcohol industry in Latin America and the Caribbean. Addiction. (2017) 112:74–80. doi: 10.1111/add.13616
Keywords: social media, marketing, mobile applications, processed food, advertisement
Citation: Barros PAA, de Paula Matos J, Rodrigues MB, da Costa RJ and Horta PM (2025) Food digital marketing on social media: trends and strategies of Brazil’s leading meal delivery app. Front. Nutr. 12:1620348. doi: 10.3389/fnut.2025.1620348
Edited by:
Olutosin Ademola Otekunrin, University of Ibadan, NigeriaReviewed by:
Majid Hajifaraji, National Nutrition and Food Technology Research Institute, IranMuji Gunarto, Universitas Bina Darma, Indonesia
Marius Calin Chereches, George Emil Palade University of Medicine, Pharmacy, Sciences and Technology of Târgu Mureş, Romania
Halder Yandry Loor Zambrano, Technical University of Manabi, Ecuador
Copyright © 2025 Barros, de Paula Matos, Rodrigues, da Costa and Horta. This is an open-access article distributed under the terms of the Creative Commons Attribution License (CC BY). The use, distribution or reproduction in other forums is permitted, provided the original author(s) and the copyright owner(s) are credited and that the original publication in this journal is cited, in accordance with accepted academic practice. No use, distribution or reproduction is permitted which does not comply with these terms.
*Correspondence: Paloma Aparecida Anastacio Barros, bnV0cmlwYWxvbWFiYXJyb3NAZ21haWwuY29t