 Xiaona Che
 Xinqi Li
 Lin Na
 Yunfei Sun1
 Xin Xue
- 1Department of Cardiology, The Second Hospital of Jilin University, Changchun, China
- 2Department of Cardiology, Xi’an International Medical Center Hospital, Xi’an, China
- 3Clinical Laboratory, The Second Hospital of Jilin University, Changchun, China
Background: Gut microbiota’s role in hypertension is emerging, but systematic studies on microbiota-linked dietary indices (DI-GM, BGMS, UGMS) remain limited.
Methods: This study leveraged data from the National Health and Nutrition Examination Survey (NHANES) database spanning 1999–2020. A cross-sectional study design was employed to gather baseline information from 41,193 adult participants aged 20 years and older, encompassing sociodemographic characteristics and health-related factors. To investigate the associations between DI-GM, BGMS, UGMS, and the prevalence of hypertension, weighted logistic regression models, restricted cubic spline (RCS) analysis with three knots (positioned at the 10, 50, and 90th percentiles of the independent variables), and subgroup analyses were performed.
Results: The study findings demonstrate that both DI-GM and BGMS are significantly and inversely associated with the prevalence of hypertension. Specifically, each one-unit increase in DI-GM was linked to a 4% reduction in hypertension risk (OR = 0.96, 95% CI: 0.94–0.98, p < 0.001), and each one-unit increase in BGMS was associated with a 5% decrease in hypertension risk (OR = 0.95, 95% CI: 0.92–0.97, p < 0.001). Further RCS analysis demonstrated a linear relationship between DI-GM and BGMS with hypertension risk. Additionally, subgroup analyses stratified by age, gender, BMI, and diabetes status exhibited robust results (P for interaction >0.05).
Conclusion: DI-GM and BGMS exhibit significant inverse associations with hypertension prevalence, with BGMS displaying a stronger protective effect. No significant relationship was identified between UGMS and hypertension.
Introduction
Hypertension is one of the leading causes of death and disability globally, accounting for approximately 9.4 million deaths annually (1, 2). According to existing literature, in 2010, approximately 31.1% of the global adult population—equivalent to 1.39 billion individuals—was affected by hypertension, with the global prevalence of the disease continuing to rise steadily (3). Studies have demonstrated that dietary modifications can significantly reduce the incidence of hypertension, as the absorption and metabolism of nutrients are substantially influenced by the gut microbiota and its metabolites (4). Current evidence indicates that both the composition of the gut microbiota and its associated metabolites play a pivotal role in the initiation and progression of cardiovascular diseases (5–7). Consequently, the gut microbiome is increasingly recognized as a potential target for novel therapeutic strategies aimed at preventing and managing hypertension.
Diet represents a critical environmental determinant that significantly shapes the compositional profile of the gut microbiota (8). In nutritional epidemiology, dietary indices serve as essential tools for quantifying dietary patterns (9, 10). Among the most widely used indices are the Healthy Eating Index (HEI), the Alternative Healthy Eating Index (aHEI), the Mediterranean Diet Score (MDS), and the DASH Diet (Dietary Approaches to Stop Hypertension) (11). While these indices effectively evaluate the relationship between dietary quality and health outcomes, their correlations with gut microbiota α/β diversity metrics exhibit heterogeneity (12–14). Unlike traditional dietary evaluation indicators (such as HEI, DASH), the Dietary Index for Gut Microbiota (DI-GM) systematically assesses the regulatory effects of 14 food/nutrient categories (10 beneficial components and 4 restricted components), enabling quantitative analysis of the health status of the gut microbiota.
This study leverages data from the National Health and Nutrition Examination Survey (NHANES) spanning 1999–2020, employing a cross-sectional study design to investigate the association between the dietary index for the microbiota and its components and the risk of hypertension. The aim is to provide scientific evidence supporting precise nutritional interventions for hypertension management.
Methods
Data source
Data were extracted from the National Health and Nutrition Examination Survey (NHANES) database, which annually surveys approximately 5,000 individuals nationwide. NHANES conducted 11 cycles of surveys between 1999 and 2020. NHANES has received ethical approval from the CDC’s research ethics review board [NHANES 1999–2004: Protocol #98–12; NHANES 2005–2010; Protocol #2005–06; NHANES 2011–2020: Protocol #2011–17, #2018–01 (Effective beginning October 26, 2017)]. NHANES ensures participant rights protection through informed written consent. For further details regarding the ethical review and consent procedures of NHANES, please refer to https://www.cdc.gov/nchs/nhanes/. The inclusion criteria for our study were as follows: adults aged 20 years or older with complete data on hypertension and the Dietary Intake Index for Gut Microbiota (DI-GM) (see Figure 1). A total of 41,193 individuals satisfied these criteria and were included in the analysis.
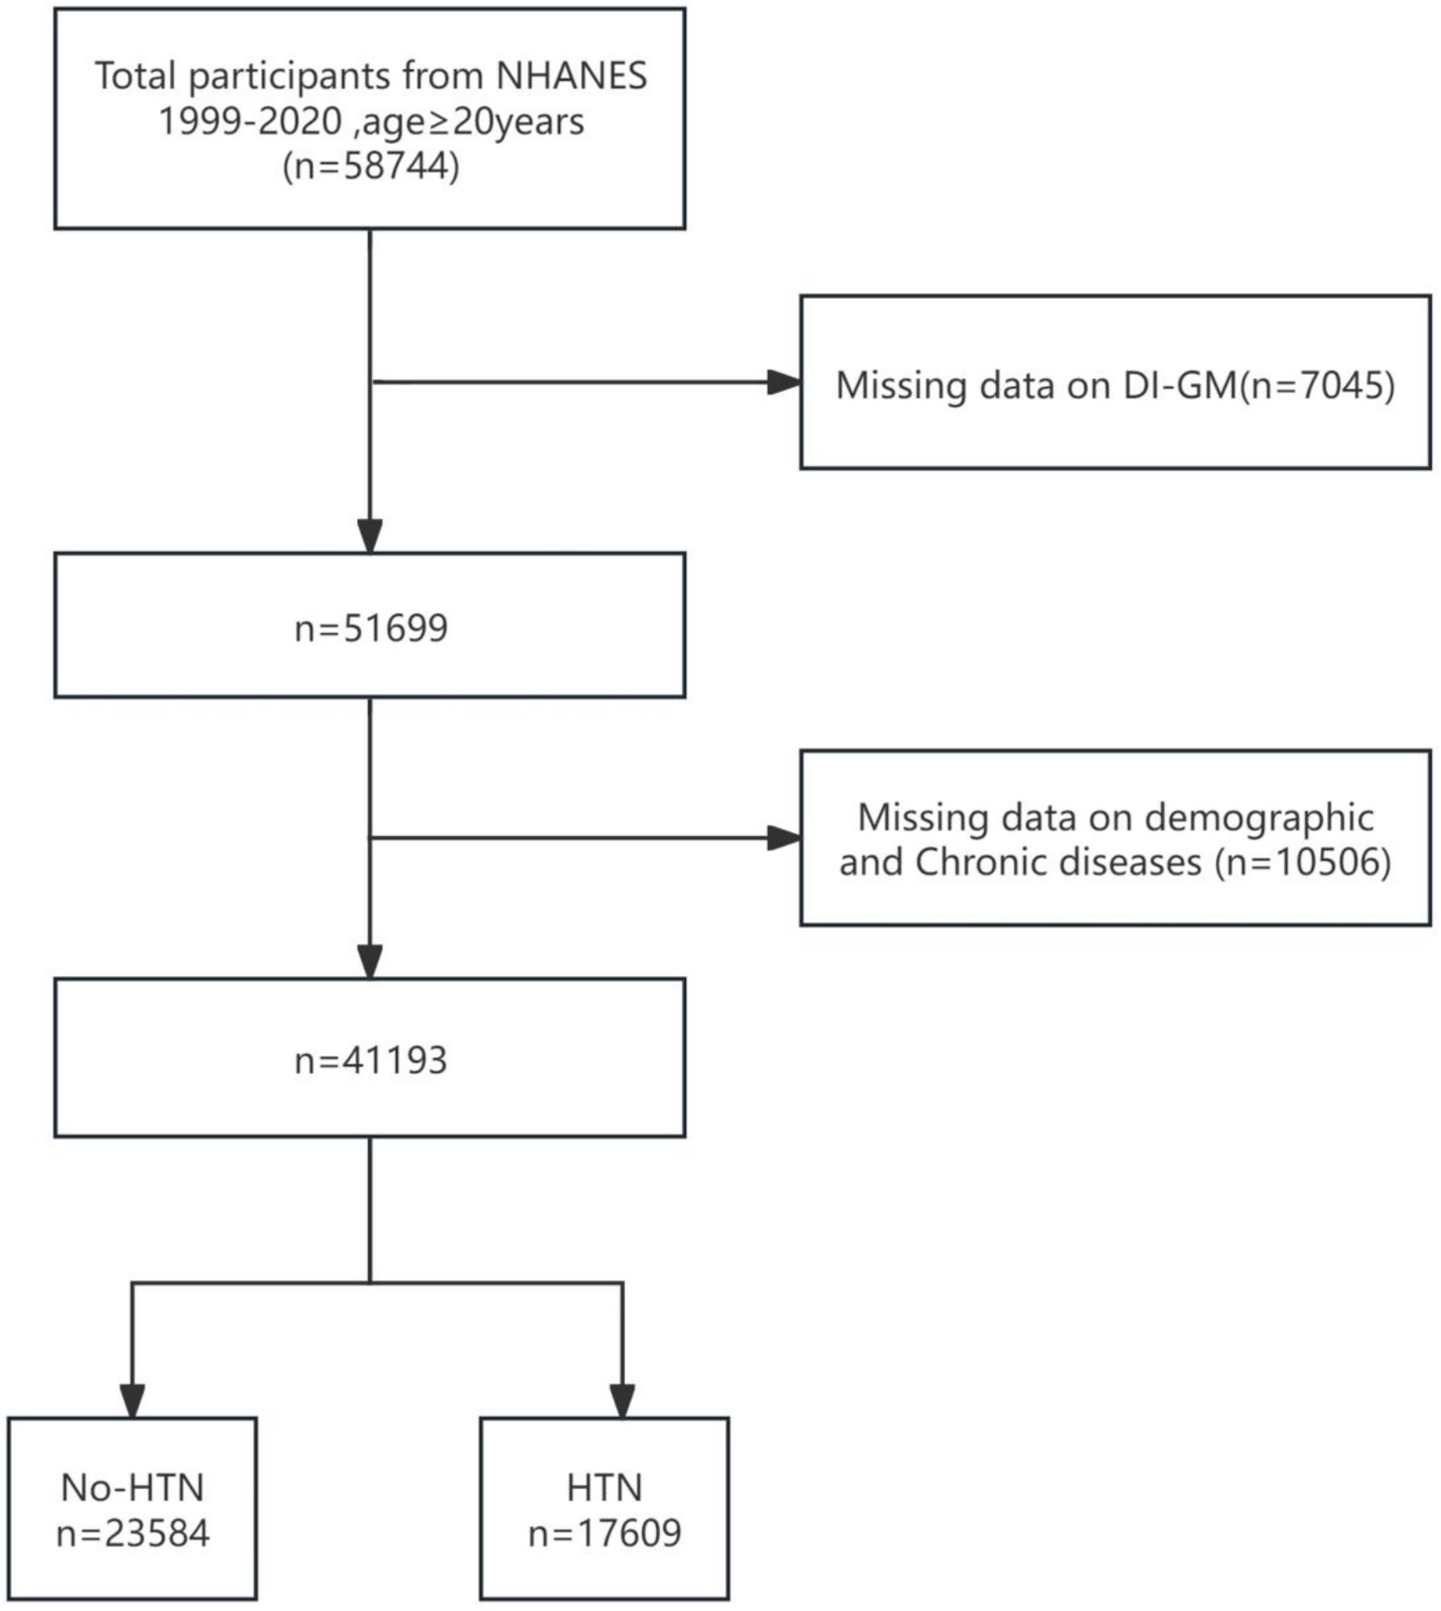
Figure 1. Flow chart of data filtering.
Dietary index for gut microbiota
In this study, the scoring system developed by Kase et al. was utilized to calculate the Dietary Index for Gut Microbiota (DI-GM). This index is based on 14 food groups or nutrients that serve as components of DI-GM. Specifically, fermented dairy products, chickpeas, soybeans, whole grains, fiber, cranberries, avocados, broccoli, coffee, and green tea are classified as beneficial components, whereas red meat, processed meat, refined grains, and high-fat diets (≥40% energy derived from fat) are categorized as detrimental components. The DI-GM scores were calculated using the 24-h dietary recall data collected during the National Health and Nutrition Examination Survey (NHANES) in the United States between 1999 and 2020. For beneficial foods, a score of one is assigned if their intake reaches or exceeds the gender-specific median (the gender-specific median of the NHANES); otherwise, the score is 0. Conversely, for detrimental foods, a score of 0 is assigned if their intake reaches or exceeds the gender-specific median (or if fat intake constitutes ≥40% of total energy); otherwise, the score is one. The total DI-GM score ranges from 0 to 14 points, with beneficial foods contributing up to 10 points (Beneficial DI-GM, BGMS) and detrimental foods contributing up to four points (Detrimental DI-GM, UGMS) (8).
Hypertension
According to the hypertension definition established by NHANES (National Health and Nutrition Examination Survey in the United States), hypertension is defined as: a self-reported physician diagnosis of hypertension, a systolic blood pressure (SBP) of ≥140 mmHg, a diastolic blood pressure (DBP) of ≥90 mmHg, or current use of antihypertensive medication (15).
Covariates
Age and body mass index (BMI) are regarded as continuous variables. The gender of the participants is divided into two groups: male and female. Racial/ethnic classification includes non-Hispanic White, non-Hispanic Black, Mexican Americans, other Hispanics, and others. Marital status is classified into two categories: married or living with a partner, and unmarried, widowed, divorced or separated. Educational background is classified based on the “Adult Education Attainment Survey Questionnaire” for people aged 20 and above, covering the following categories: not having completed 9 years of compulsory education, not obtaining a diploma from nine to 12 years of education, graduating from high school or having equivalent qualifications, some university education or associate degree, graduating from university or higher education. Poverty income ratio is classified into low income (<1.30), middle income (1.30–3.49), and high income (≥3.50). Smoking status is recorded as never smoking, former smoker and current smoker. Drinking situation is classified as never drinking, former drinker and current drinker. The assessed health status includes cardiovascular diseases (CVD) (present or absent), diabetes (present or absent), and hyperlipidemia (present or absent). Furthermore, the diagnosis of cardiovascular diseases (CVD) was based on self-reported physician diagnoses obtained through individual interviews using standardized medical condition questionnaires. Participants were asked, “Has a doctor or other health professional ever told you that you have congestive heart failure, coronary heart disease, myocardial infarction, or stroke?” An affirmative response to any of these conditions was considered as an indication of CVD. Hyperlipidemia was diagnosed if any of the following criteria were met: (1) current use of lipid-lowering medications; (2) elevated triglyceride levels (≥150 mg/dL); or (3) high cholesterol levels [total cholesterol ≥200 mg/dL, low-density lipoprotein cholesterol (LDL-C) ≥ 130 mg/dL, or high-density lipoprotein cholesterol (HDL-C) < 40 mg/dL]. Diabetes diagnosis was determined based on the following criteria: (1) self-reported physician diagnosis; (2) glycated hemoglobin (HbA1c) level >6.5%; (3) fasting blood glucose ≥7.0 mmol/L; (4) random or 2-h post-load glucose level during an oral glucose tolerance test ≥11.1 mmol/L; or (5) current use of antidiabetic medications or insulin. For more detailed information on the measurement of covariates, please visit the NHANES website.1
Statistical analysis
Given the inclusion of hematological variables in our study, Mobile Examination Center (MEC) weights were applied. Specifically, for the periods 1999–2000 and 2001–2002, the weight calculation formula was wtmec4yr × 2 ÷ (11.625); for 2003–2018, it was wtmec2yr ÷ (11.625); and for 2017–2020, the formula was WTMECPRP × 1.625 ÷ (11.625) (16).
Respondents were categorized into two groups based on their hypertension status: the non-hypertension group (No-HTN) and the hypertension group (HTN). For continuous variables, data were described using weighted means (mean ± standard error), and differences between groups were assessed using the Wilcoxon rank-sum test tailored for complex survey designs. Categorical variables were presented as counts (n) and weighted percentages (%), with analyses conducted using the Rao-Scott chi-square test. Additionally, a weighted logistic regression model was constructed to examine the associations of DI-GM, BGMS, and UGMS with the risk of hypertension. Results were reported as odds ratios (ORs) with 95% confidence intervals (CIs). Specifically, Model 1 adjusted only for age; Model 2 further adjusted for gender, race/ethnicity, poverty-income ratio (PIR), marital status, and education level; Model 3 extended Model 2 by incorporating additional covariates, including smoking status, alcohol consumption, body mass index (BMI), cardiovascular diseases (CVD), hyperlipidemia, and diabetes. Based on the compositional analysis of BGMS and UGMS, no significant multicollinearity was observed between the two variables. In Model 3, when analyzing BGMS (or UGMS), UGMS (or BGMS) was included as an additional covariate to account for potential confounding. All regression analyses incorporated survey weights, and continuous covariates with non-normal distributions were transformed using weighted quartile-based methods. To assess the robustness of the observed associations, pre-specified weighted subgroup analyses were performed, stratified by age, gender, BMI, and diabetes status, with interactions between subgroups evaluated using likelihood ratio tests. Furthermore, subgroup analyses based on UGMS were conducted for BGMS. Nonlinear relationships between DI-GM, BGMS, and UGMS with hypertension risk were explored using restricted cubic splines (RCS) with power constraints. All statistical analyses were conducted using R statistical software (version 4.2.2,2 R Foundation) and the WinStat statistical analysis platform (version 2.1, Beijing, China).
Results
Baseline characteristics
This study included a total of 58,744 participants aged 20 years or older from the National Health and Nutrition Examination Survey (NHANES) database, with data spanning the period from 1999 to 2020. Among these, 7,045 participants were excluded due to missing DI-GM (diet and metabolism-related data). A total of 10,506 participants were excluded due to incomplete demographic and chronic disease-related information, which included 9,032 participants excluded for missing data on age, race, marital status, education level, poverty income ratio (PIR), smoking, alcohol consumption, or body mass index (BMI), as well as an additional 1,204 participants excluded due to missing data on specific chronic conditions, including hypertension, cardiovascular disease, hyperlipidemia, and diabetes. Ultimately, 41,193 participants who met the inclusion criteria were enrolled in the study. Figure 1 presents the participant selection flowchart. Table 1 summarizes the baseline characteristics of the study population. Statistical analyses identified significant differences across several variables, including age, race/ethnicity, poverty-income ratio (PIR), educational attainment, smoking status, alcohol consumption, body mass index (BMI), and the presence of various chronic conditions (e.g., cardiovascular disease, hyperlipidemia, and diabetes).
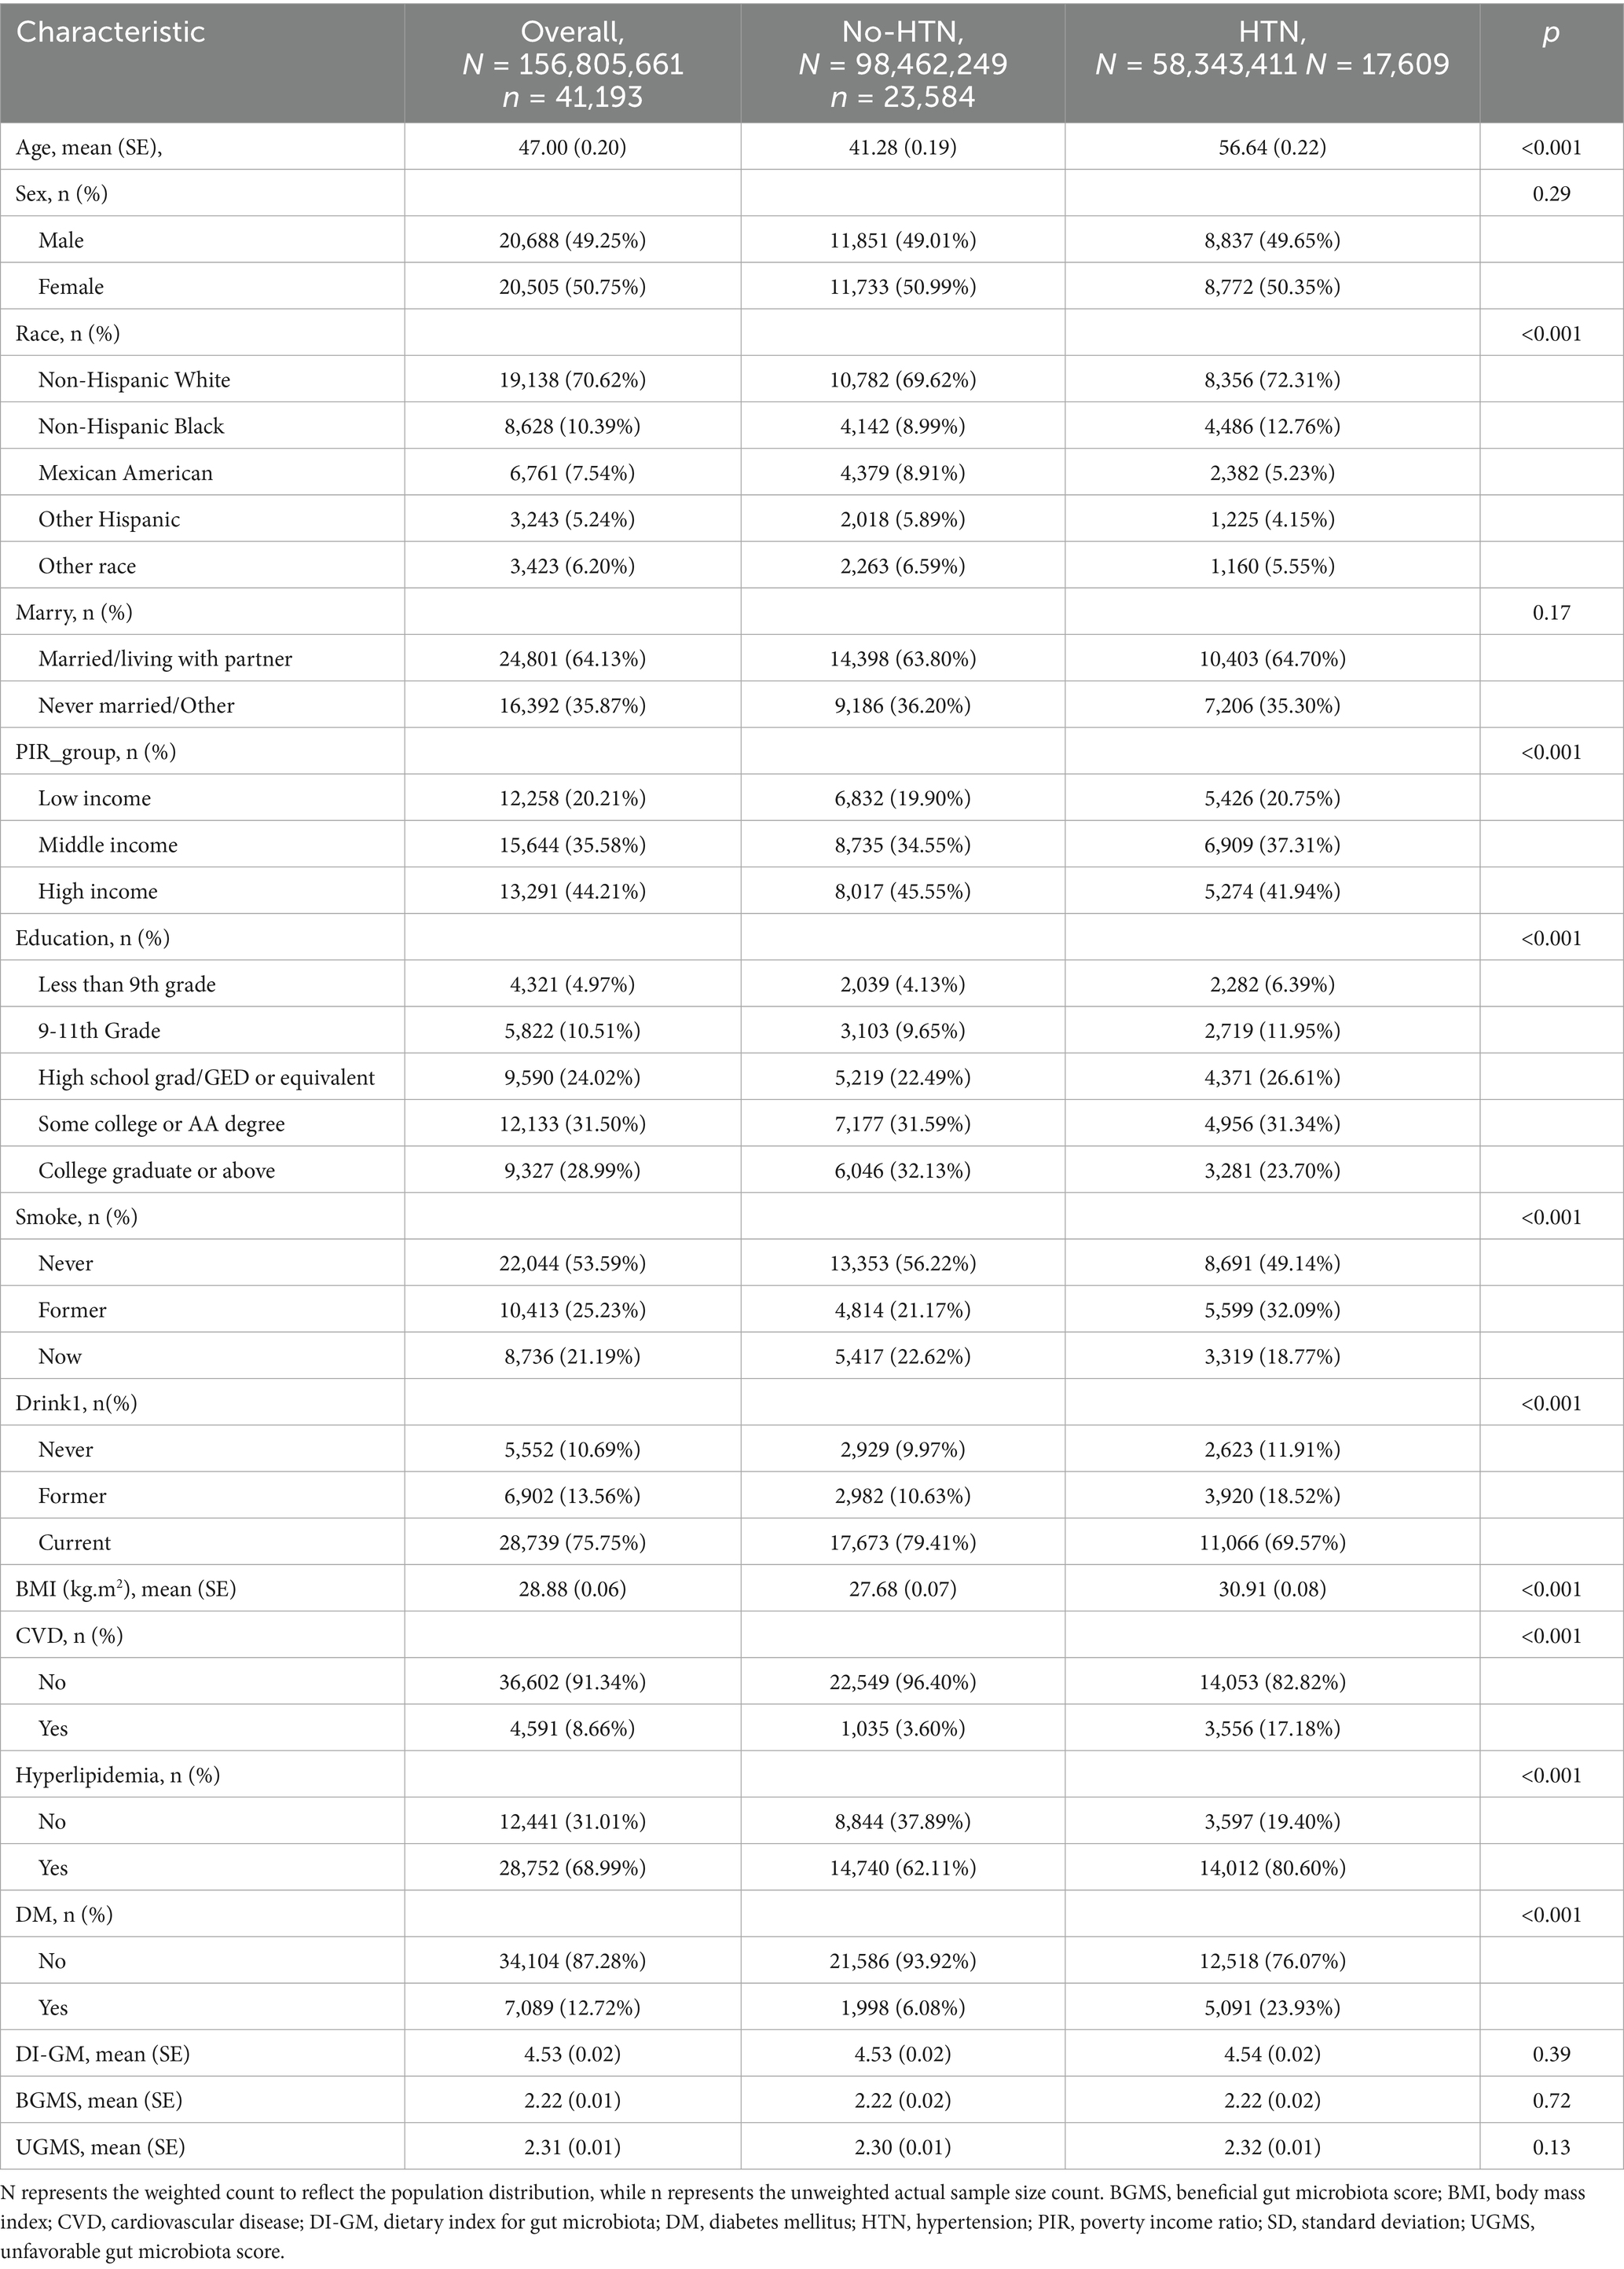
Table 1. The weighted fundamental clinical characteristics of participants in the hypertension and non-hypertension groups.
The relationship between DI-GM, BGMS, and UGMS and the risk of hypertension
To evaluate the independent association between DI-GM and its subgroups (BGMS and UGMS) with the risk of hypertension, we constructed a multivariable weighted logistic regression model to examine their relationships (see Table 2). Table 2 summarizes the results of the multivariable weighted regression analyses for DI-GM, BGMS, and UGMS in relation to hypertension. To ensure robustness, we sequentially adjusted for potential confounding factors using three progressively adjusted models. Specifically, Model 1 included adjustment for age only; Model 2 further adjusted for gender, race/ethnicity, poverty-income ratio (PIR), marital status, and education level; and Model 3 extended Model 2 by incorporating additional covariates, including smoking status, alcohol consumption, body mass index (BMI), and comorbidities such as cardiovascular disease, hyperlipidemia, and diabetes. Additionally, when analyzing the association between BGMS (or UGMS) and hypertension risk, UGMS (or BGMS) was included as a covariate to account for potential confounding. The results indicated that, after adjusting for all potential confounders, both DI-GM and BGMS levels were significantly and inversely associated with the risk of hypertension. Specifically, each one-unit increase in DI-GM was associated with a 4% reduction in hypertension risk (OR = 0.96, 95% CI: 0.94–0.98, p < 0.001), while each one-unit increase in BGMS was linked to a 5% decrease in hypertension risk (OR = 0.95, 95% CI: 0.92–0.97, p < 0.001). Notably, the protective effect of BGMS appeared slightly stronger than that of DI-GM, as reflected by the lower odds ratio. In contrast, no statistically significant association was found between UGMS levels and the risk of hypertension (p = 0.249).
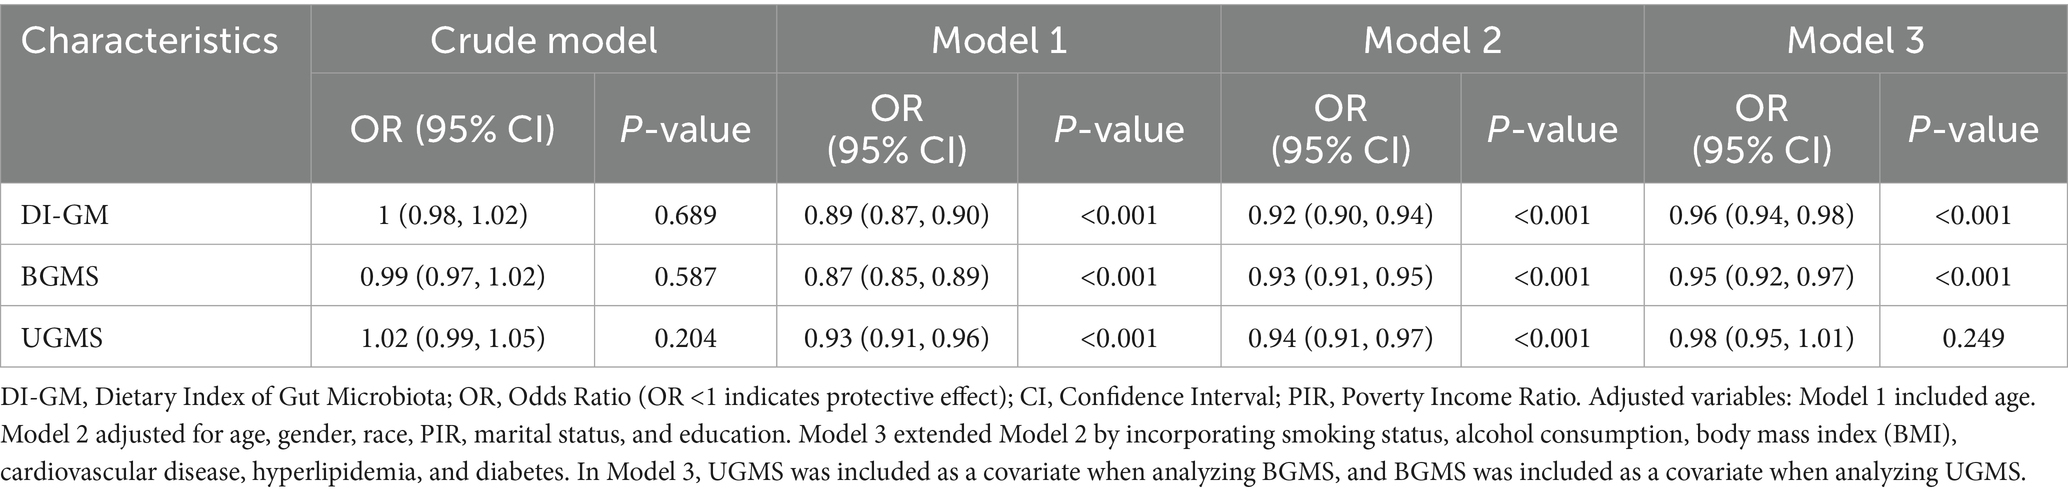
Table 2. Relationship between DI-GM and the risk of hypertension.
Analysis of the dose–response relationship between DI-GM, BGMS, and UGMS and hypertension
The dose–response relationship between DI-GM and its subgroups (BGMS and UGMS) and the risk of hypertension was systematically assessed using multivariable-adjusted restricted cubic spline (RCS) analysis (see Figure 2). The results demonstrated a significant linear association, with an inverse trend observed between DI-GM levels and the risk of hypertension (overall p = 0.001). Similarly, for the subgroup BGMS, a significant negative linear relationship was identified, indicating that as BGMS levels increased, the risk of hypertension significantly decreased (overall p < 0.001). In contrast, no significant dose–response relationship was observed between UGMS levels and the risk of hypertension (overall p > 0.05).
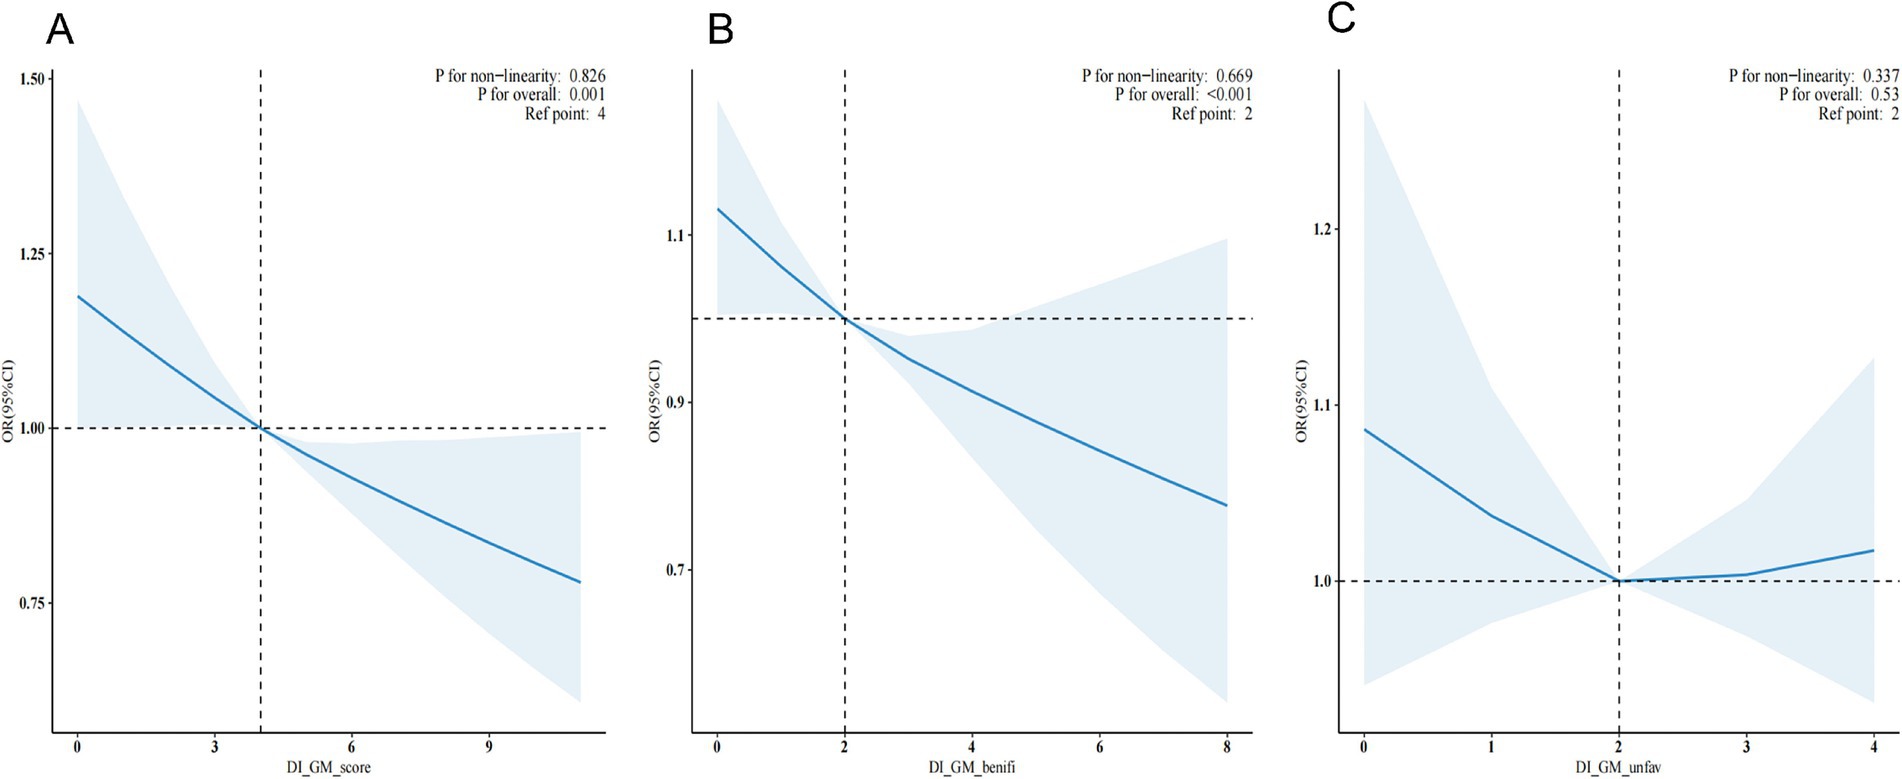
Figure 2. Restricted cubic spline plots depicting the additive interaction between DI-GM (A), BGMS (B), UGMS (C) and hypertension.
Subgroup analysis of DI-GM, BGMS, and the risk of hypertension
Subgroup analyses were performed to evaluate whether the associations of DI-GM and BGMS with hypertension were modified by specific factors (see Figure 3). After adjusting for potential confounding variables, stratified analyses were conducted across age groups (<35 years and ≥35 years), gender, BMI categories (<24 and ≥24), and diabetes status (present or absent). The results indicated that the protective effects of DI-GM and BGMS remained consistent across all subgroups, with no statistically significant interactions observed (all interaction p > 0.05). Additionally, in the subgroup analysis for BGMS, further stratification by UGMS was included, with UGMS categorized into two groups based on its score (≤1 and >1). The findings indicated that in the subgroup with a UGMS score of ≤1, the association between BGMS and hypertension risk was not statistically significant (p > 0.05).
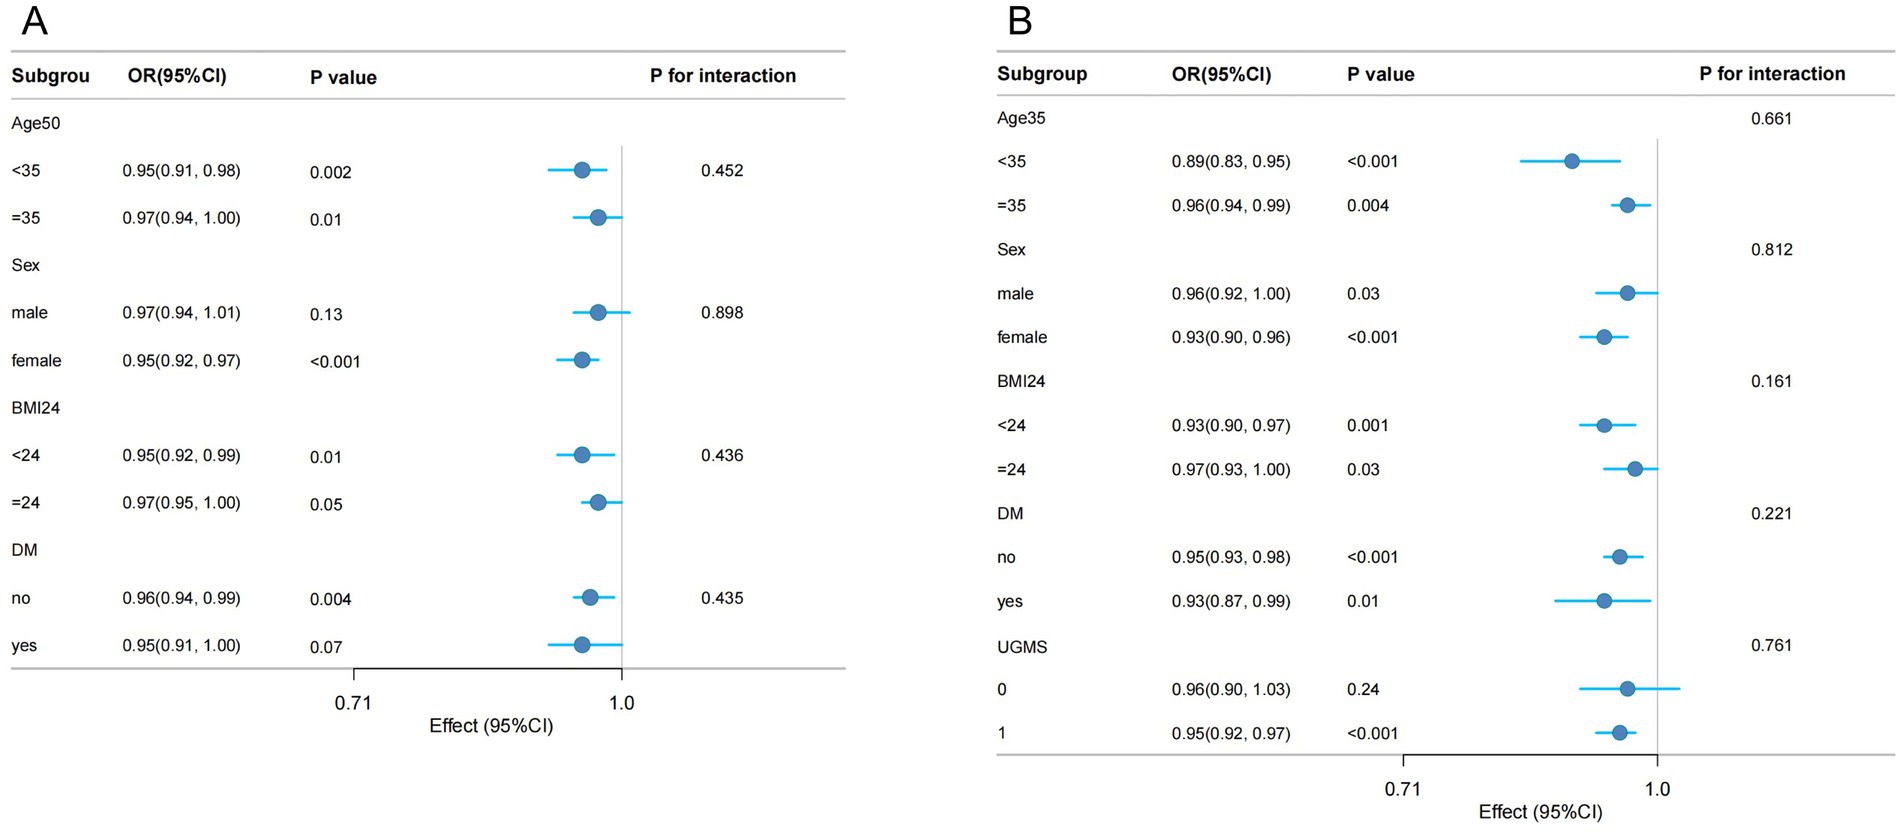
Figure 3. Forest plot of weighted subgroup analysis examining the association between DI-GM (A), BGMS (B), and hypertension.
Discussion
This study, utilizing data from the National Health and Nutrition Examination Survey (NHANES) conducted in the United States between 1999 and 2020, employed a cross-sectional research design to systematically evaluate the associations of the Dietary Index for Gut Microbiota (DI-GM), its beneficial component (Beneficial Gut Microbiota Score, BGMS), and its unfavorable component (Unfavorable Gut Microbiota Score, UGMS) with the risk of hypertension. After adjusting for demographic characteristics (age, gender, race/ethnicity), socioeconomic factors (poverty-income ratio, marital status, education level), lifestyle behaviors (smoking, alcohol consumption), and metabolic-related indicators [body mass index (BMI), history of cardiovascular disease, hyperlipidemia, and diabetes mellitus] using a multivariable logistic regression model, it was found that each one-unit increase in the DI-GM score was associated with a significant 4% reduction in the risk of hypertension (OR = 0.96, 95% CI: 0.94–0.98, p < 0.001). Similarly, each one-unit increase in the BGMS score was associated with a 5% decrease in the risk of hypertension (OR = 0.95, 95% CI: 0.92–0.97, p < 0.001). These findings suggest that both DI-GM and BGMS exert clear protective effects against hypertension, with BGMS, as the core component of DI-GM, demonstrating a stronger independent protective effect. In contrast, no statistically significant association was observed between UGMS and the risk of hypertension (p > 0.05). Further subgroup analysis revealed that among individuals with a UGMS score ≤1, the protective effect of BGMS was attenuated by the influence of the UGMS dietary pattern, resulting in a relatively higher risk of hypertension. These results suggest that even when adhering to the BGMS dietary pattern, failure to adequately control the intake of harmful components—such as red meat, processed meat, refined grains, and high-fat diets (with a fat energy ratio ≥40%)—may still contribute to an elevated risk of hypertension. The results of this study not only confirm the value of the overall DI-GM score and the BGMS component in hypertension prevention but also highlight the complex interplay between dietary patterns and gut microbiota, providing new insights for precision nutritional interventions.
To the best of our knowledge, this study represents the first systematic investigation into the association between the dietary index for gut microbiota (DI-GM) and the risk of hypertension. Current evidence suggests that the pathophysiology of hypertension involves intricate interactions between genetic predispositions and environmental influences. However, genome-wide association studies (GWAS) indicate that genetic factors account for less than 5% of the variance in hypertension incidence (17). Conversely, modifiable lifestyle factors exert a more pronounced influence on blood pressure regulation. For example, changes in body mass index (BMI) and sodium intake can lead to approximate fluctuations of 5 mmHg in blood pressure levels (18). In terms of dietary determinants, extensive prospective cohort studies have demonstrated that dietary patterns rich in fruits and vegetables, with restricted consumption of sweets and refined grains, and prioritizing healthy fats and proteins, are associated with a significant reduction in hypertension risk. Notably, both the Mediterranean diet and the DASH (Dietary Approaches to Stop Hypertension) diet, renowned for their antihypertensive properties, have been extensively validated (19–21). The Mediterranean diet confers cardiovascular protection by enhancing the production of short-chain fatty acids (SCFAs), with its core components—predominantly plant-based foods supplemented with olive oil, moderate amounts of poultry and fish, and limited red meat—proven to effectively mitigate hypertension risk (22). This study specifically highlights the potential utility of the DI-GM score, which exhibits a robust positive correlation with the classical Mediterranean Diet Score (MDS) (r = 0.42, p < 0.0001) (23). These findings suggest that the DI-GM score, grounded in gut microbiota characteristics, may serve as a novel quantitative metric and intervention target for dietary strategies aimed at preventing hypertension.
Extensive research has demonstrated that dietary nutrient intake exerts a significant regulatory influence on the structure and functional activity of trillions of microorganisms residing in the human gut (24–28). A prospective cohort study conducted in the Chinese population revealed that, compared to healthy controls, patients with hypertension exhibited a marked reduction in intestinal microbiota diversity (29). Of greater significance, animal experiments utilizing fecal microbiota transplantation technology have provided direct evidence of the causal relationship between the intestinal microbiota and hypertension: when the intestinal microbiota from spontaneously hypertensive rats (SHRSP) was transplanted into normotensive Wistar-Kyoto (WKY) rats, the recipient rats displayed a substantial increase in blood pressure (30). Current evidence highlights significant differences in the composition of intestinal microbiota between hypertensive patients and healthy individuals. These differences are primarily characterized by: (1) a reduced abundance of short-chain fatty acid (SCFA)-producing bacteria, such as Roseburia and Faecalibacterium; and (2) an increased relative abundance of Gram-negative bacteria (5). Mechanistically, SCFAs, as key metabolites derived from the fermentation of dietary fiber by gut microbiota, regulate blood pressure via the “gut-vascular axis.” Specifically, after absorption into the circulatory system, SCFAs activate host receptors such as Olfr78 and Gpr41, thereby modulating blood pressure homeostasis through the regulation of renin secretion and vascular tone (31, 32). Conversely, lipopolysaccharide (LPS), a major component of the cell wall of Gram-negative bacteria and a potent endotoxin, may contribute to the development of hypertension through multiple pathophysiological mechanisms, including systemic inflammation, activation of the sympathetic nervous system, and neuroinflammation induction (5). In this study, the DI-GM scoring system was developed based on rigorous scientific evidence, with its components selected for their regulatory effects on intestinal microbiota diversity, SCFA production capacity, and the abundance of specific beneficial bacterial taxa (8).
Aging is a major independent risk factor for the development of hypertension. Epidemiological data from the Framingham Heart Study in the United States indicate that individuals aged 55–65 have a lifetime risk of developing hypertension as high as 90%. Among those aged 65–89, 87% of men and 93% of women with hypertension exhibit isolated systolic hypertension (33). Baseline analyses reveal that without adjustment for confounding factors such as age, the associations between DI-GM, BGMS, and UGMS and hypertension do not achieve statistical significance. However, in the multivariate weighted logistic regression model (Model 1), after adjusting solely for age, DI-GM and BGMS demonstrate significant statistical associations with hypertension (p < 0.001). Further subgroup analyses show that regardless of whether groups are divided at the age boundary of 35 (<35 years vs. ≥35 years), DI-GM and BGMS exhibit significant protective effects against hypertension.
The significant findings of this study not only enhance our understanding of the interaction mechanism among diet, gut microbiota, and hypertension but also represent a critical breakthrough in translating basic research into clinical application. The quantitative assessment tool and well-defined intervention targets developed in this study provide a robust scientific foundation for transforming hypertension prevention and control models, facilitating a transition from traditional “disease treatment” approaches to more advanced “health maintenance” strategies.
However, this study also has several limitations that warrant consideration. First, the cross-sectional design of the National Health and Nutrition Examination Survey (NHANES) database precludes the establishment of a definitive causal relationship. Future prospective cohort studies are needed to validate the temporal associations observed. Second, the DI-GM index is constructed based on intake data for 14 specific dietary components; any missing data for these components results in sample exclusion, which may introduce potential selection bias during the screening process. Furthermore, despite rigorous adjustment for multiple known confounding factors, residual confounding effects and the influence of unmeasured factors (e.g., genetic background) cannot be entirely ruled out. Finally, the reliance on self-reported dietary intake data and covariate information may introduce issues such as recall bias.
Conclusion
This study found a significant negative correlation between the dietary index of gut microbiota (DI-GM) and the risk of hypertension in adults over 20 years old. Among them, the protective effect of the dietary score of beneficial gut microbiota (BGMS) was more significant. These findings highlight the potential of diet intervention measures focusing on gut microbiota as a promising strategy for preventing hypertension.
Data availability statement
Publicly available datasets were analyzed in this study. This data can be found at: https://www.cdc.gov/nchs/nhanes/index.htm.
Ethics statement
The studies involving humans were approved by https://www.cdc.gov/nchs/nhanes/. The studies were conducted in accordance with the local legislation and institutional requirements. The participants provided their written informed consent to participate in this study.
Author contributions
XC: Formal analysis, Visualization, Data curation, Resources, Project administration, Validation, Investigation, Software, Methodology, Supervision, Writing – review & editing, Writing – original draft, Conceptualization. XL: Project administration, Conceptualization, Writing – review & editing. LN: Writing –review & editing, Investigation, Project administration. YS: Writing – review & editing, Methodology, Validation. ZK: Writing –review & editing, Investigation, Project administration. WC: Formal analysis, Writing – review & editing, Investigation, Project administration. JC: Formal analysis, Visualization, Validation, Investigation, Software, Methodology, Supervision, Writing – review & editing. XX: Formal analysis, Visualization, Validation, Investigation, Software, Methodology, Supervision, Writing – review & editing.
Funding
The author(s) declare that financial support was received for the research and/or publication of this article. This work was supported by the Jilin University Concept Verification Project Fund (23GNYZ04) and the China Postdoctoral Science Foundation (2020M670032ZX).
Acknowledgments
First, we would like to thank Xue Xin for his invaluable guidance and advice throughout the research process, as well as all the authors of this paper for their efforts and assistance. We also appreciate the financial support provided by Jilin University, which made this research possible.
Conflict of interest
The authors declare that the research was conducted in the absence of any commercial or financial relationships that could be construed as a potential conflict of interest.
Generative AI statement
The authors declare that no Gen AI was used in the creation of this manuscript.
Any alternative text (alt text) provided alongside figures in this article has been generated by Frontiers with the support of artificial intelligence and reasonable efforts have been made to ensure accuracy, including review by the authors wherever possible. If you identify any issues, please contact us.
Publisher’s note
All claims expressed in this article are solely those of the authors and do not necessarily represent those of their affiliated organizations, or those of the publisher, the editors and the reviewers. Any product that may be evaluated in this article, or claim that may be made by its manufacturer, is not guaranteed or endorsed by the publisher.
Footnotes
References
1. Baker, J, and Kimpinski, K. Role of melatonin in blood pressure regulation: an adjunct anti-hypertensive agent. Clin Exp Pharmacol Physiol. (2018) 45:755–66. doi: 10.1111/1440-1681.12942
2. Olczak, KJ, Taylor-Bateman, V, Nicholls, HL, Traylor, M, Cabrera, CP, and Munroe, PB. Hypertension genetics past, present and future applications. J Intern Med. (2021) 290:1130–52. doi: 10.1111/joim.13352
3. Mills, KT, Stefanescu, A, and He, J. The global epidemiology of hypertension. Nat Rev Nephrol. (2020) 16:223–37. doi: 10.1038/s41581-019-0244-2
4. Forman, JP, Stampfer, MJ, and Curhan, GC. Diet and lifestyle risk factors associated with incident hypertension in women. JAMA. (2009) 302:401–11. doi: 10.1001/jama.2009.1060
5. Verhaar, BJH, Prodan, A, Nieuwdorp, M, and Muller, M. Gut microbiota in hypertension and atherosclerosis: a review. Nutrients. (2020) 12. doi: 10.3390/nu12102982
6. Huynh, K. Microbial metabolites reduce SBP in patients with resistant hypertension. Nat Rev Cardiol. (2023) 20:140. doi: 10.1038/s41569-023-00840-y
7. Fadhillah, FS, Habibah, K, Juniarto, AZ, Sobirin, MA, Maharani, N, and Pramono, A. Diet and the gut microbiota profiles in individuals at risk of chronic heart failure - a review on the Asian population. Asia Pac J Clin Nutr. (2025) 34:141–52. doi: 10.6133/apjcn.202504_34(2).0001
8. Kase, BE, Liese, AD, Zhang, J, Murphy, EA, Zhao, L, and Steck, SE. The development and evaluation of a literature-based dietary index for gut microbiota. Nutrients. (2024) 16. doi: 10.3390/nu16071045
9. Gil, Á, Martinez de Victoria, E, and Olza, J. Indicators for the evaluation of diet quality. Nutr Hosp. (2015) 31:128–44. doi: 10.3305/nh.2015.31.sup3.8761
10. Steck, SE, and Murphy, EA. Dietary patterns and cancer risk. Nat Rev Cancer. (2020) 20:125–38. doi: 10.1038/s41568-019-0227-4
11. Wirt, A, and Collins, CE. Diet quality – what is it and does it matter? Public Health Nutr. (2009) 12:2473–92. doi: 10.1017/s136898000900531x
12. Maskarinec, G, Hullar, MAJ, Monroe, KR, Shepherd, JA, Hunt, J, Randolph, TW, et al. Fecal microbial diversity and structure are associated with diet quality in the multiethnic cohort adiposity phenotype study. J Nutr. (2019) 149:1575–84. doi: 10.1093/jn/nxz065
13. Bowyer, RCE, Jackson, MA, Pallister, T, Skinner, J, Spector, TD, Welch, AA, et al. Use of dietary indices to control for diet in human gut microbiota studies. Microbiome. (2018) 6:77. doi: 10.1186/s40168-018-0455-y
14. Cotillard, A, Cartier-Meheust, A, Litwin, NS, Chaumont, S, Saccareau, M, Lejzerowicz, F, et al. A posteriori dietary patterns better explain variations of the gut microbiome than individual markers in the American gut project. Am J Clin Nutr. (2022) 115:432–43. doi: 10.1093/ajcn/nqab332
15. Wu, M, Si, J, Liu, Y, Kang, L, and Xu, B. Association between composite dietary antioxidant index and hypertension: insights from NHANES. Clin Exp Hypertens. (2023) 45:2233712. doi: 10.1080/10641963.2023.2233712
16. Johnson, CL, Paulose-Ram, R, Ogden, CL, Carroll, MD, Kruszon-Moran, D, Dohrmann, SM, et al. National health and nutrition examination survey: analytic guidelines 1999–2010. Vital Health Stat 2. (2013) 161:1–24.
17. Giri, A, Hellwege, JN, Keaton, JM, Park, J, Qiu, C, Warren, HR, et al. Trans-ethnic association study of blood pressure determinants in over 750,000 individuals. Nat Genet. (2019) 51:51–62. doi: 10.1038/s41588-018-0303-9
18. Pazoki, R, Dehghan, A, Evangelou, E, Warren, H, Gao, H, Caulfield, M, et al. Genetic predisposition to high blood pressure and lifestyle factors: associations with midlife blood pressure levels and cardiovascular events. Circulation. (2018) 137:653–61. doi: 10.1161/circulationaha.117.030898
19. Dauchet, L, Kesse-Guyot, E, Czernichow, S, Bertrais, S, Estaquio, C, Péneau, S, et al. Dietary patterns and blood pressure change over 5-y follow-up in the SU.VI.MAX cohort. Am J Clin Nutr. (2007) 85:1650–6. doi: 10.1093/ajcn/85.6.1650
20. Schulze, MB, Hoffmann, K, Kroke, A, and Boeing, H. Risk of hypertension among women in the EPIC-Potsdam study: comparison of relative risk estimates for exploratory and hypothesis-oriented dietary patterns. Am J Epidemiol. (2003) 158:365–73. doi: 10.1093/aje/kwg156
21. Appel, LJ, Moore, TJ, Obarzanek, E, Vollmer, WM, Svetkey, LP, Sacks, FM, et al. A clinical trial of the effects of dietary patterns on blood pressure. DASH collaborative research group. N Engl J Med. (1997) 336:1117–24. doi: 10.1056/NEJM199704173361601
22. Guasch-Ferré, M, and Willett, WC. The Mediterranean diet and health: a comprehensive overview. J Intern Med. (2021) 290:549–66. doi: 10.1111/joim.13333
23. Liu, J, and Huang, S. Dietary index for gut microbiota is associated with stroke among US adults. Food Funct. (2025) 16:1458–68. doi: 10.1039/d4fo04649h
24. Wu, GD, Chen, J, Hoffmann, C, Bittinger, K, Chen, YY, Keilbaugh, SA, et al. Linking long-term dietary patterns with gut microbial enterotypes. Science. (2011) 334:105–8. doi: 10.1126/science.1208344
25. Muegge, BD, Kuczynski, J, Knights, D, Clemente, JC, González, A, Fontana, L, et al. Diet drives convergence in gut microbiome functions across mammalian phylogeny and within humans. Science. (2011) 332:970–4. doi: 10.1126/science.1198719
26. Duncan, SH, Belenguer, A, Holtrop, G, Johnstone, AM, Flint, HJ, and Lobley, GE. Reduced dietary intake of carbohydrates by obese subjects results in decreased concentrations of butyrate and butyrate-producing bacteria in feces. Appl Environ Microbiol. (2007) 73:1073–8. doi: 10.1128/aem.02340-06
27. Ley, RE, Turnbaugh, PJ, Klein, S, and Gordon, JI. Microbial ecology: human gut microbes associated with obesity. Nature. (2006) 444:1022–3. doi: 10.1038/4441022a
28. Walker, AW, Ince, J, Duncan, SH, Webster, LM, Holtrop, G, Ze, X, et al. Dominant and diet-responsive groups of bacteria within the human colonic microbiota. ISME J. (2011) 5:220–30. doi: 10.1038/ismej.2010.118
29. Li, J, Zhao, F, Wang, Y, Chen, J, Tao, J, Tian, G, et al. Gut microbiota dysbiosis contributes to the development of hypertension. Microbiome. (2017) 5:14. doi: 10.1186/s40168-016-0222-x
30. Adnan, S, Nelson, JW, Ajami, NJ, Venna, VR, Petrosino, JF, Bryan, RM Jr, et al. Alterations in the gut microbiota can elicit hypertension in rats. Physiol Genomics. (2017) 49:96–104. doi: 10.1152/physiolgenomics.00081.2016
31. Pluznick, JL. Microbial short-chain fatty acids and blood pressure regulation. Curr Hypertens Rep. (2017) 19:25. doi: 10.1007/s11906-017-0722-5
32. Raizada, MK, Joe, B, Bryan, NS, Chang, EB, Dewhirst, FE, Borisy, GG, et al. Report of the National Heart, Lung, and Blood Institute working group on the role of microbiota in blood pressure regulation: current status and future directions. Hypertension. (2017) 70:479–85. doi: 10.1161/hypertensionaha.117.09699
Keywords: dietary index, gut microbiota, gut microbiota dietary index, hypertension, National Health and Nutrition Examination Survey
Citation: Che X, Li X, Na L, Sun Y, Kong Z, Cui W, Chang J and Xue X (2025) Dietary index for gut microbiota and hypertension risk: a cross-sectional NHANES study. Front. Nutr. 12:1622058. doi: 10.3389/fnut.2025.1622058
Edited by:
Momodou W. Jallow, Regeneron Genetic Center, United StatesReviewed by:
Christos Ioannis Fragoulis, National and Kapodistrian University of Athens, GreeceAdriyan Pramono, Diponegoro University, Indonesia
Abubakar Nazir, King Edward Medical University, Pakistan
Ridwan Abiodun Alimi, University of Ilorin, Nigeria
Copyright © 2025 Che, Li, Na, Sun, Kong, Cui, Chang and Xue. This is an open-access article distributed under the terms of the Creative Commons Attribution License (CC BY). The use, distribution or reproduction in other forums is permitted, provided the original author(s) and the copyright owner(s) are credited and that the original publication in this journal is cited, in accordance with accepted academic practice. No use, distribution or reproduction is permitted which does not comply with these terms.
*Correspondence: Jing Chang, amNoYW5nQGpsdS5lZHUuY24=; Xin Xue, eHVleEBqbHUuZWR1LmNu
†These authors have contributed equally to this work