 Dan Xiang
 Li Yuan1
- 1Department of Endocrinology, Taikang Xianlin Drum Tower Hospital, Affiliated Hospital of Medical School, Nanjing University, Nanjing, China
- 2Department of Health Management Center, Taikang Xianlin Drum Tower Hospital, Affiliated Hospital of Medical School, Nanjing University, Nanjing, China
Objective: Metabolic phenotypes are linked to various metabolic diseases, but current classification methods have limitations. This study aims to directly cluster obese populations based on body composition and machine learning, enhancing understanding of lipid metabolism and disease associations.
Methods: A retrospective analysis included participants who underwent InBody examinations at Taikang Xianlin Drum Tower Hospital in 2023. Subjects were categorized into four phenotypes: MHNW, MHO, MUNW, and MUO, based on BMI and metabolic syndrome criteria. Correlations between InBody indexes and clinical data were analyzed. Machine learning cluster analysis identified subgroupings, and associations with metabolic diseases were examined.
Results: InBody indexes correlated strongly with medical history and lab results. Clustering classified males into two groups and females into three, with significant differences in age, weight, height, BMI, and InBody scores (all p < 0.001). The prevalence of hypertension and hyperlipidemia varied notably among male subgroups, while hypertension and diabetes showed significant differences among female subgroups.
Conclusion: The InBody-based clustering analysis showed males could be categorized into 2 subgroups while females could be classified into 3 subgroups, indicating that the population with a specific InBody clustering profile could be at higher risk of metabolic diseases.
Introduction
In recent years, with the rapid development of economics, obesity and overweight are becoming more prevalent and are currently two of the most common health and economic challenges (1). Moreover, several complications have been identified to have a strong association with overweight and obesity, including metabolic syndromes, cardiovascular disease, hypertension, and lung disease (2–5). However, there are many unhealthy people with normal weight and healthy people with increased body weight, therefore, many studies have pointed out the limitation of using solely overweight or body mass index (BMI) as risk factors, and metabolic phenotype has been proposed for better evaluation of people’s health status (6).
Body composition has been reported to be associated with various diseases, including obesity (7), diabetes (8), hypertension (9), and hyperurecemia (10). Therefore, accurate estimation of body composition is of great importance and in urgent need. Currently, dual-energy X-ray absorptiometry (DEXA), computed tomography (CT), and magnetic resonance imaging (MRI) are considered the gold standard of body component estimation (11, 12). However, the application of previously mentioned radiological examinations in the clinical scenario is limited by their inconvenience, and the presence of the bioimpedance analysis (BIA) method and the portable InBody equipment provides an effective replacement option for the traditional radiological tools. More importantly, the reliability and repeatability of BIA methods are widely validated in different cohorts and various BIA machines, which makes them more acceptable for clinical usage (13, 14). The outbreak of body composition data also facilitates the health assessment, Xia et al. showed that increased adiposity and decreased skeletal muscle mass are associated with desirable metabolic traits in Chinese adults with normal weight (15), Deng et al. also used anthropometric indices as tools for evaluating health (16). Those studies indicating that InBody indicators could be potential biomarkers compared to traditional indices.
Cluster analysis, as a machine learning-based method, has gained increasing popularity in the past few decades, and it could provide a new perspective for the understanding of populations with different traits. Ye proposed a K-means cluster method for the improved discrimination of newly-onset metabolic-associated fatty liver disease (17); Takeshita et al. clustered obesity patients into seven subgroups and indicated that some metabolically healthy obesity groups may require interventions (18). However, to the best of our knowledge, there is no study focused on cluster analysis based on body composition and related to metabolic phenotypes, which may provide new insight for the management of patients with different metabolic phenotypes.
Therefore, this study aims to analyze the performance of cluster analysis based on the InBody indexes in normal weight and obese participants, exploring the underlying relationship between cluster results and participants’ characteristics for the improved understanding of metabolic phenotypes in the Chinese population.
Materials and methods
Study population
In this retrospective study, subjects were drawn from the Hospital who visited the Health Management Center between January and December 2023. The inclusion criteria were: (1) patients who completed the InBody test; (2) age between 18 and 75 years. The exclusion criteria were patients without complete clinical data. This study was approved by the Ethics Committee of our hospital (Approval Number: LS202319), and informed consents were waived due to the retrospective nature of this study.
Data collection and definition
The demographic, hematological, medical history, and InBody test indices were collected from the medical history system. The demographic information, including age, sex, weight, height, systolic blood pressure, diastolic blood pressure, pulse rate, and body mass index, was calculated as weight/height2 (kg/m2). The medical history includes hypertension, diabetes, hyperlipidemia, coronary artery disease (CAD), coronary artery surgery, hyperuricemia, gout, urolithiasis, nephritis or nephrotic syndrome, diabetic nephropathy, hypothyroidism, fatty liver, and bone mineral density status. While the InBody test indexes include fat fraction (FF), visceral fat area (VFA), basal metabolic rate (BMR), Skeletal Muscle Mass Index (SMI), Fat-Free Mass Index (FFMI), Fat Mass Index (FMI), and the InBody score. The complete hematological data are shown in Table 1.
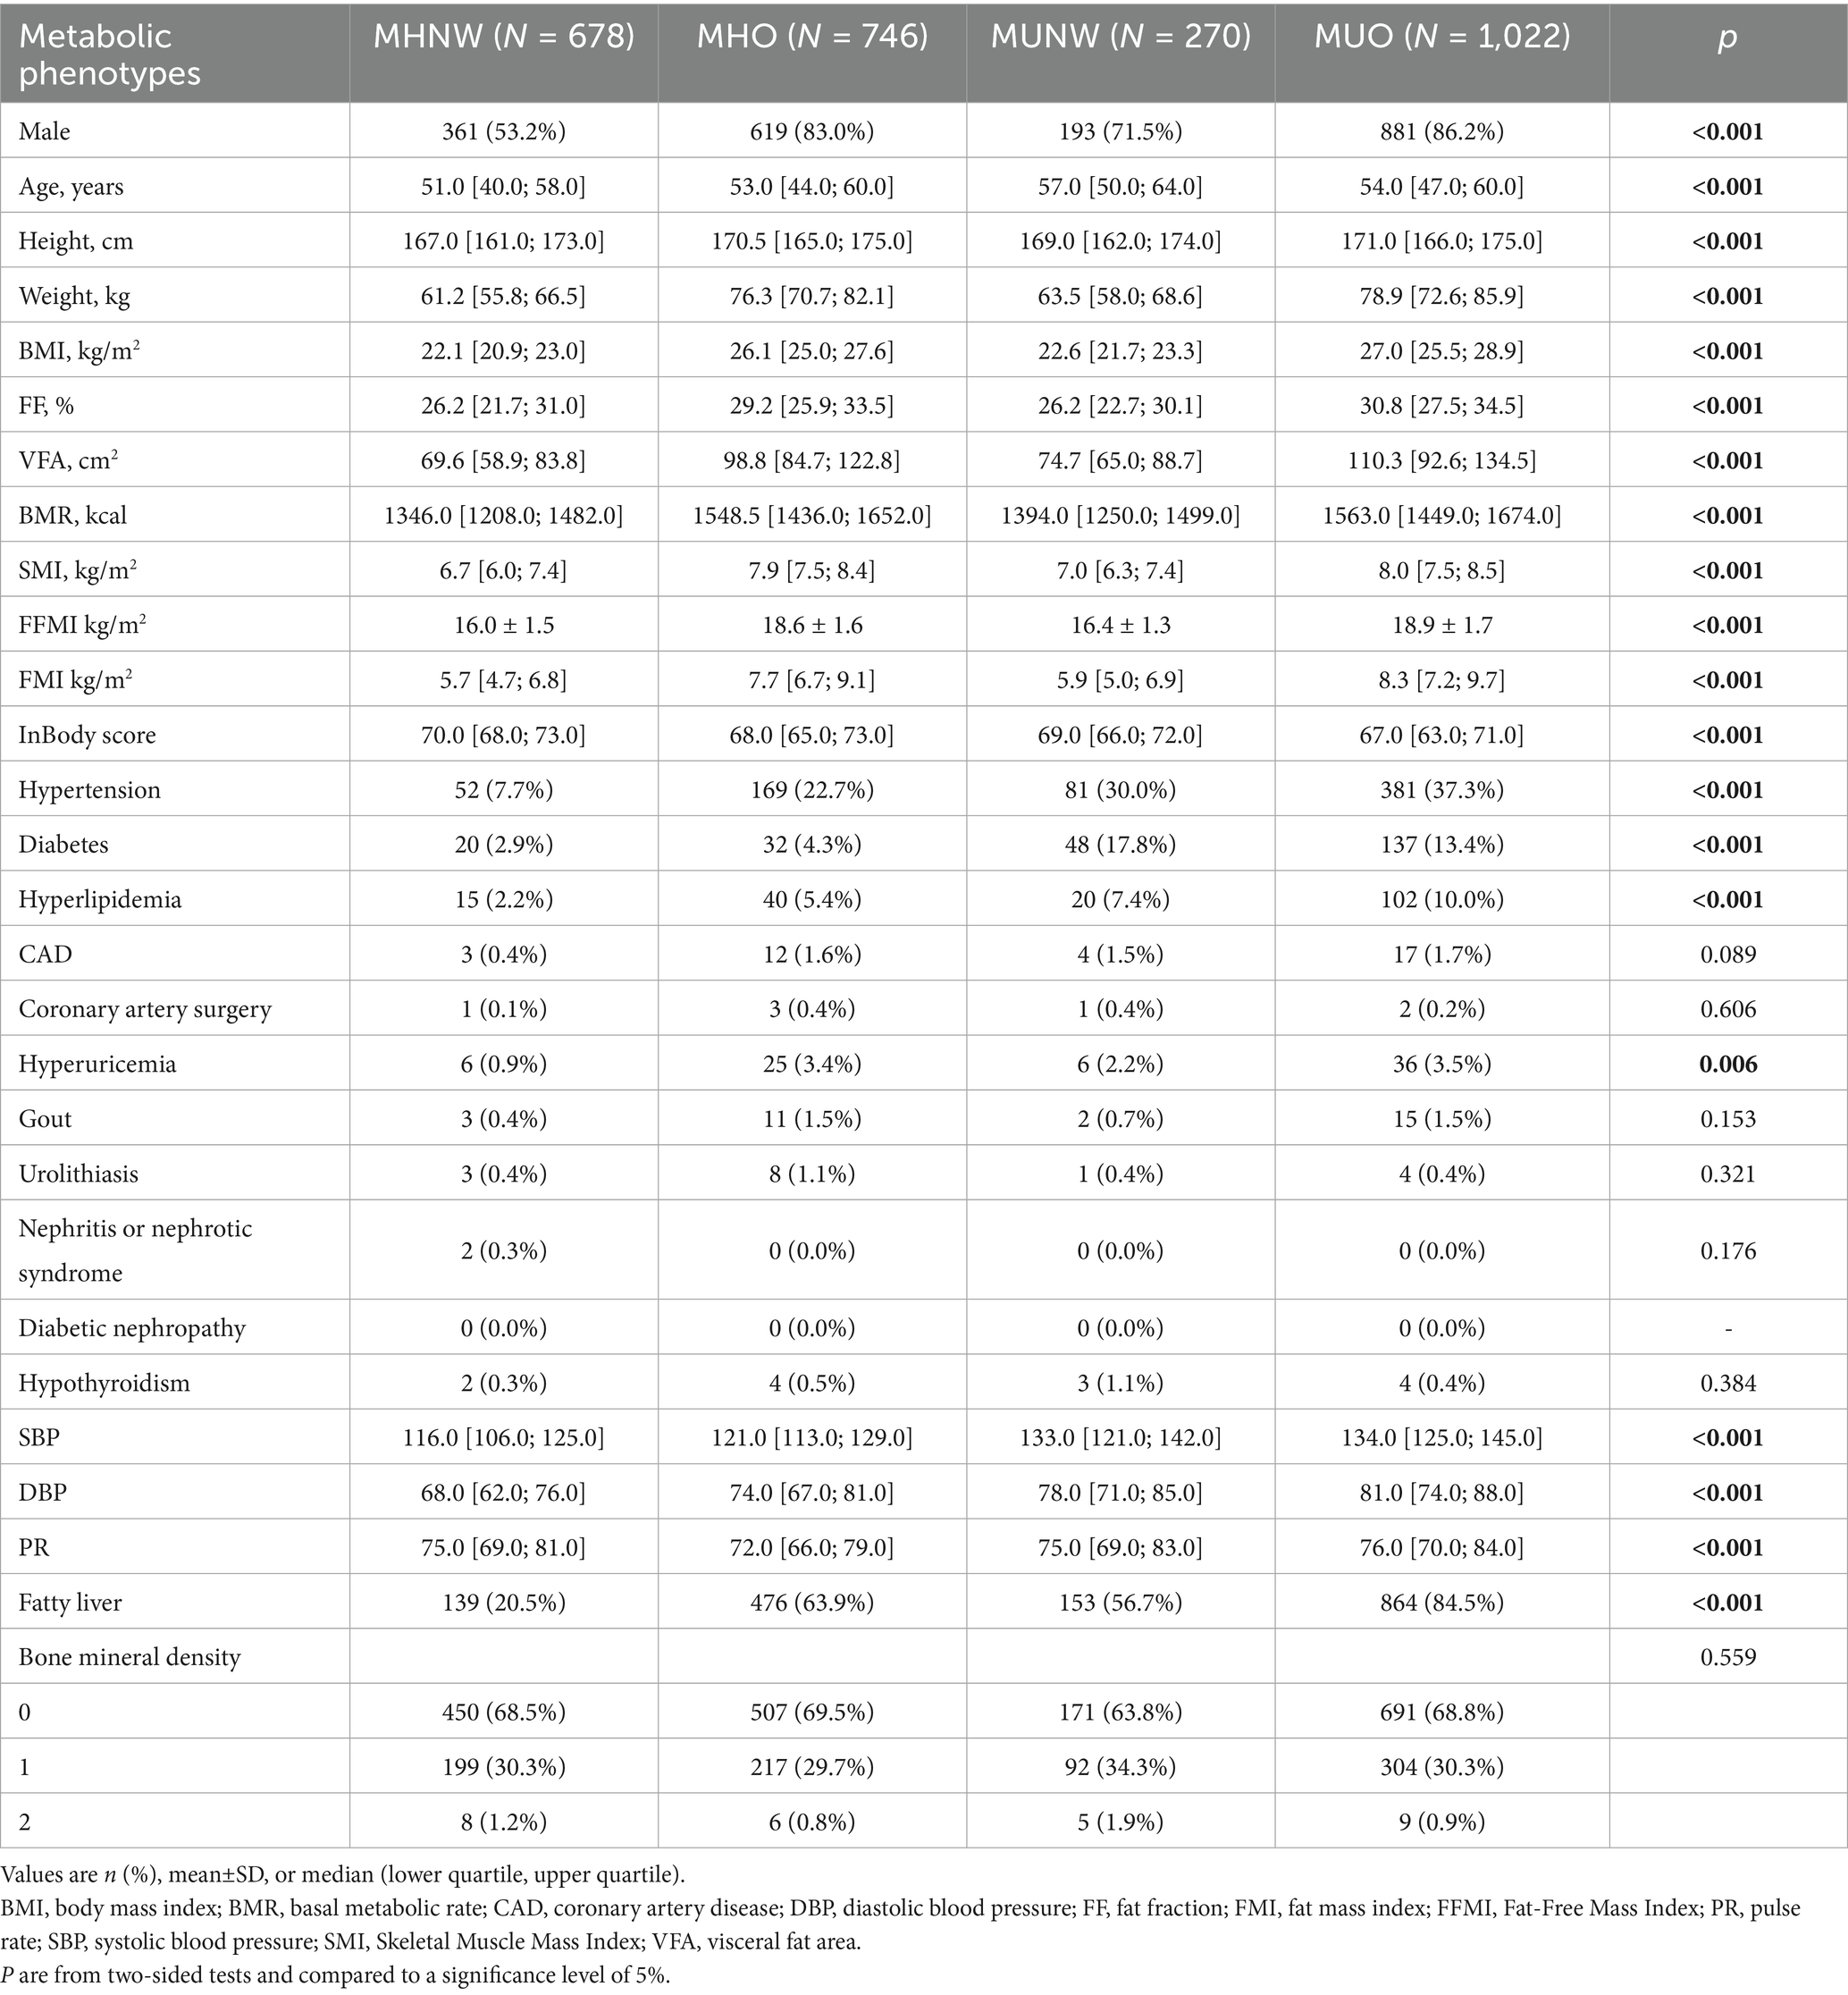
Table 1. Baseline characteristics of participants.
According to BMI status, participants were categorized into normal weight (BMI between 18.5 and 24 kg/m2) and overweight/obese (BMI ≥ 24 kg/m2). Participants with two or more of the following four components were considered metabolically unhealthy (1): increased BP: systolic blood pressure (SBP) ≥ 130 mmHg or diastolic blood pressure (DBP) ≥ 85 mmHg or use of antihypertensive drugs; (2) Abnormal glucose metabolism: Fasting blood glucose (FBG) ≥ 5.6 mmol/L or glycosylated hemoglobin (HbA1c) ≥ 6.0% or use of hypoglycemic drugs; (3) elevated triglycerides (TG) level: TG ≥ 1.7 mmol/L or use of lipid-lowering drugs; (4) Low high-density lipoprotein cholesterol (HDL-C) (HDL-C < 1.03 mmol/L for men or < 1.29 mmol/L for women) or use of lipid-lowering medications.
Based on the combination of BMI and metabolic status, the subjects were divided into four metabolic phenotypes: (1) metabolically healthy normal weight (MHNW, BMI between 18.5 and 23.9 kg/m2 and zero or one metabolic abnormality); (2) metabolically healthy overweight or obesity (MHO, BMI ≥ 24 kg/m2 and zero or one metabolic abnormality); (3) metabolically unhealthy normal weight (MUNW, BMI between 18.5 and 23.9 kg/m2 and two or more metabolic abnormalities); and (4) metabolically unhealthy overweight or obesity (MUO, BMI ≥ 24 kg/m2 and two or more metabolic abnormalities).
Statistical analysis
Statistical analysis was performed using R software (version 4.3.3). For continuous variables, normality tests were conducted, if the data follow a normal distribution, continuous variables are presented as mean ± SD and compared using Student’s t-test, while non-normally distributed variables are presented as median (inter-quartile range, IQR) and compared using the Mann–Whitney U test. Categorical variables are expressed as numbers and percentages, and the chi-squared (Χ2) test was used for comparison between groups. Spearman’s rank correlation method was used to analyze the relationship between indicators.
Cluster analysis was performed based on Age, Height, Weight, BMI, FF, VFA, BMR, SMI, FFMI, FMI, and InBody score in both male and female populations separately. Before clustering, the quantitative data are standardized according to the mean and standard deviation. In SPSS version 26.0, the TwoStep clustering method is used to perform cluster analysis on the standardized data with a mean of 0 and a standard deviation of 1. No dimensionality reduction was performed, and clustering was performed in the original space. The first step of the TwoStep clustering method is to estimate the optimal number of clusters based on the silhouette coefficient of 0.4, and the second step is hierarchical clustering. The analysis uses log-likelihood as the distance metric and uses the Schwarz-Bayesian criterion for clustering, with the number of clusters ranging from 2 to 15. And the best number of clusters was automatically decided by the algorithm.
A prediction model was developed based on the metabolic phenotype and clustering results in male and female subgroups, with the presence of underlying diseases as the outcome. The area under the curve was used to evaluate the model’s performance.
Results
Participants characteristics
A total of 3,589 participants were initially enrolled. However, only 2,716 patients with complete data were categorized into MHNW, MHO, MUNW, and MUO groups. After comparison, we found that all demographic characteristics and InBody examination indices were significantly different among the four groups (p < 0.001), and only 5 (ALB/GLB, LDL-C, TSH, FT4, and AFP) out of 30 hematological indicators were not significantly different among the four metabolic subgroups. As for medical history data, the prevalence of hypertension, diabetes, hyperuricemia, and fatty liver was lower in MHNW participants (all p < 0.05) (Table 1; Supplementary Table 1).
Correlation analysis
The correlation analysis between weight, height, BMI, body indexes, and other patients’ characteristics is shown in Table 2; Supplementary Table 2. The results also revealed that only Cr (r = 0.054, p = 0.001), ALB/GLB (r = 0.126, p < 0.001), and HDL-C (r = 0.106, p < 0.001) showed a positive association with InBody score, which is the most commonly used InBody index.
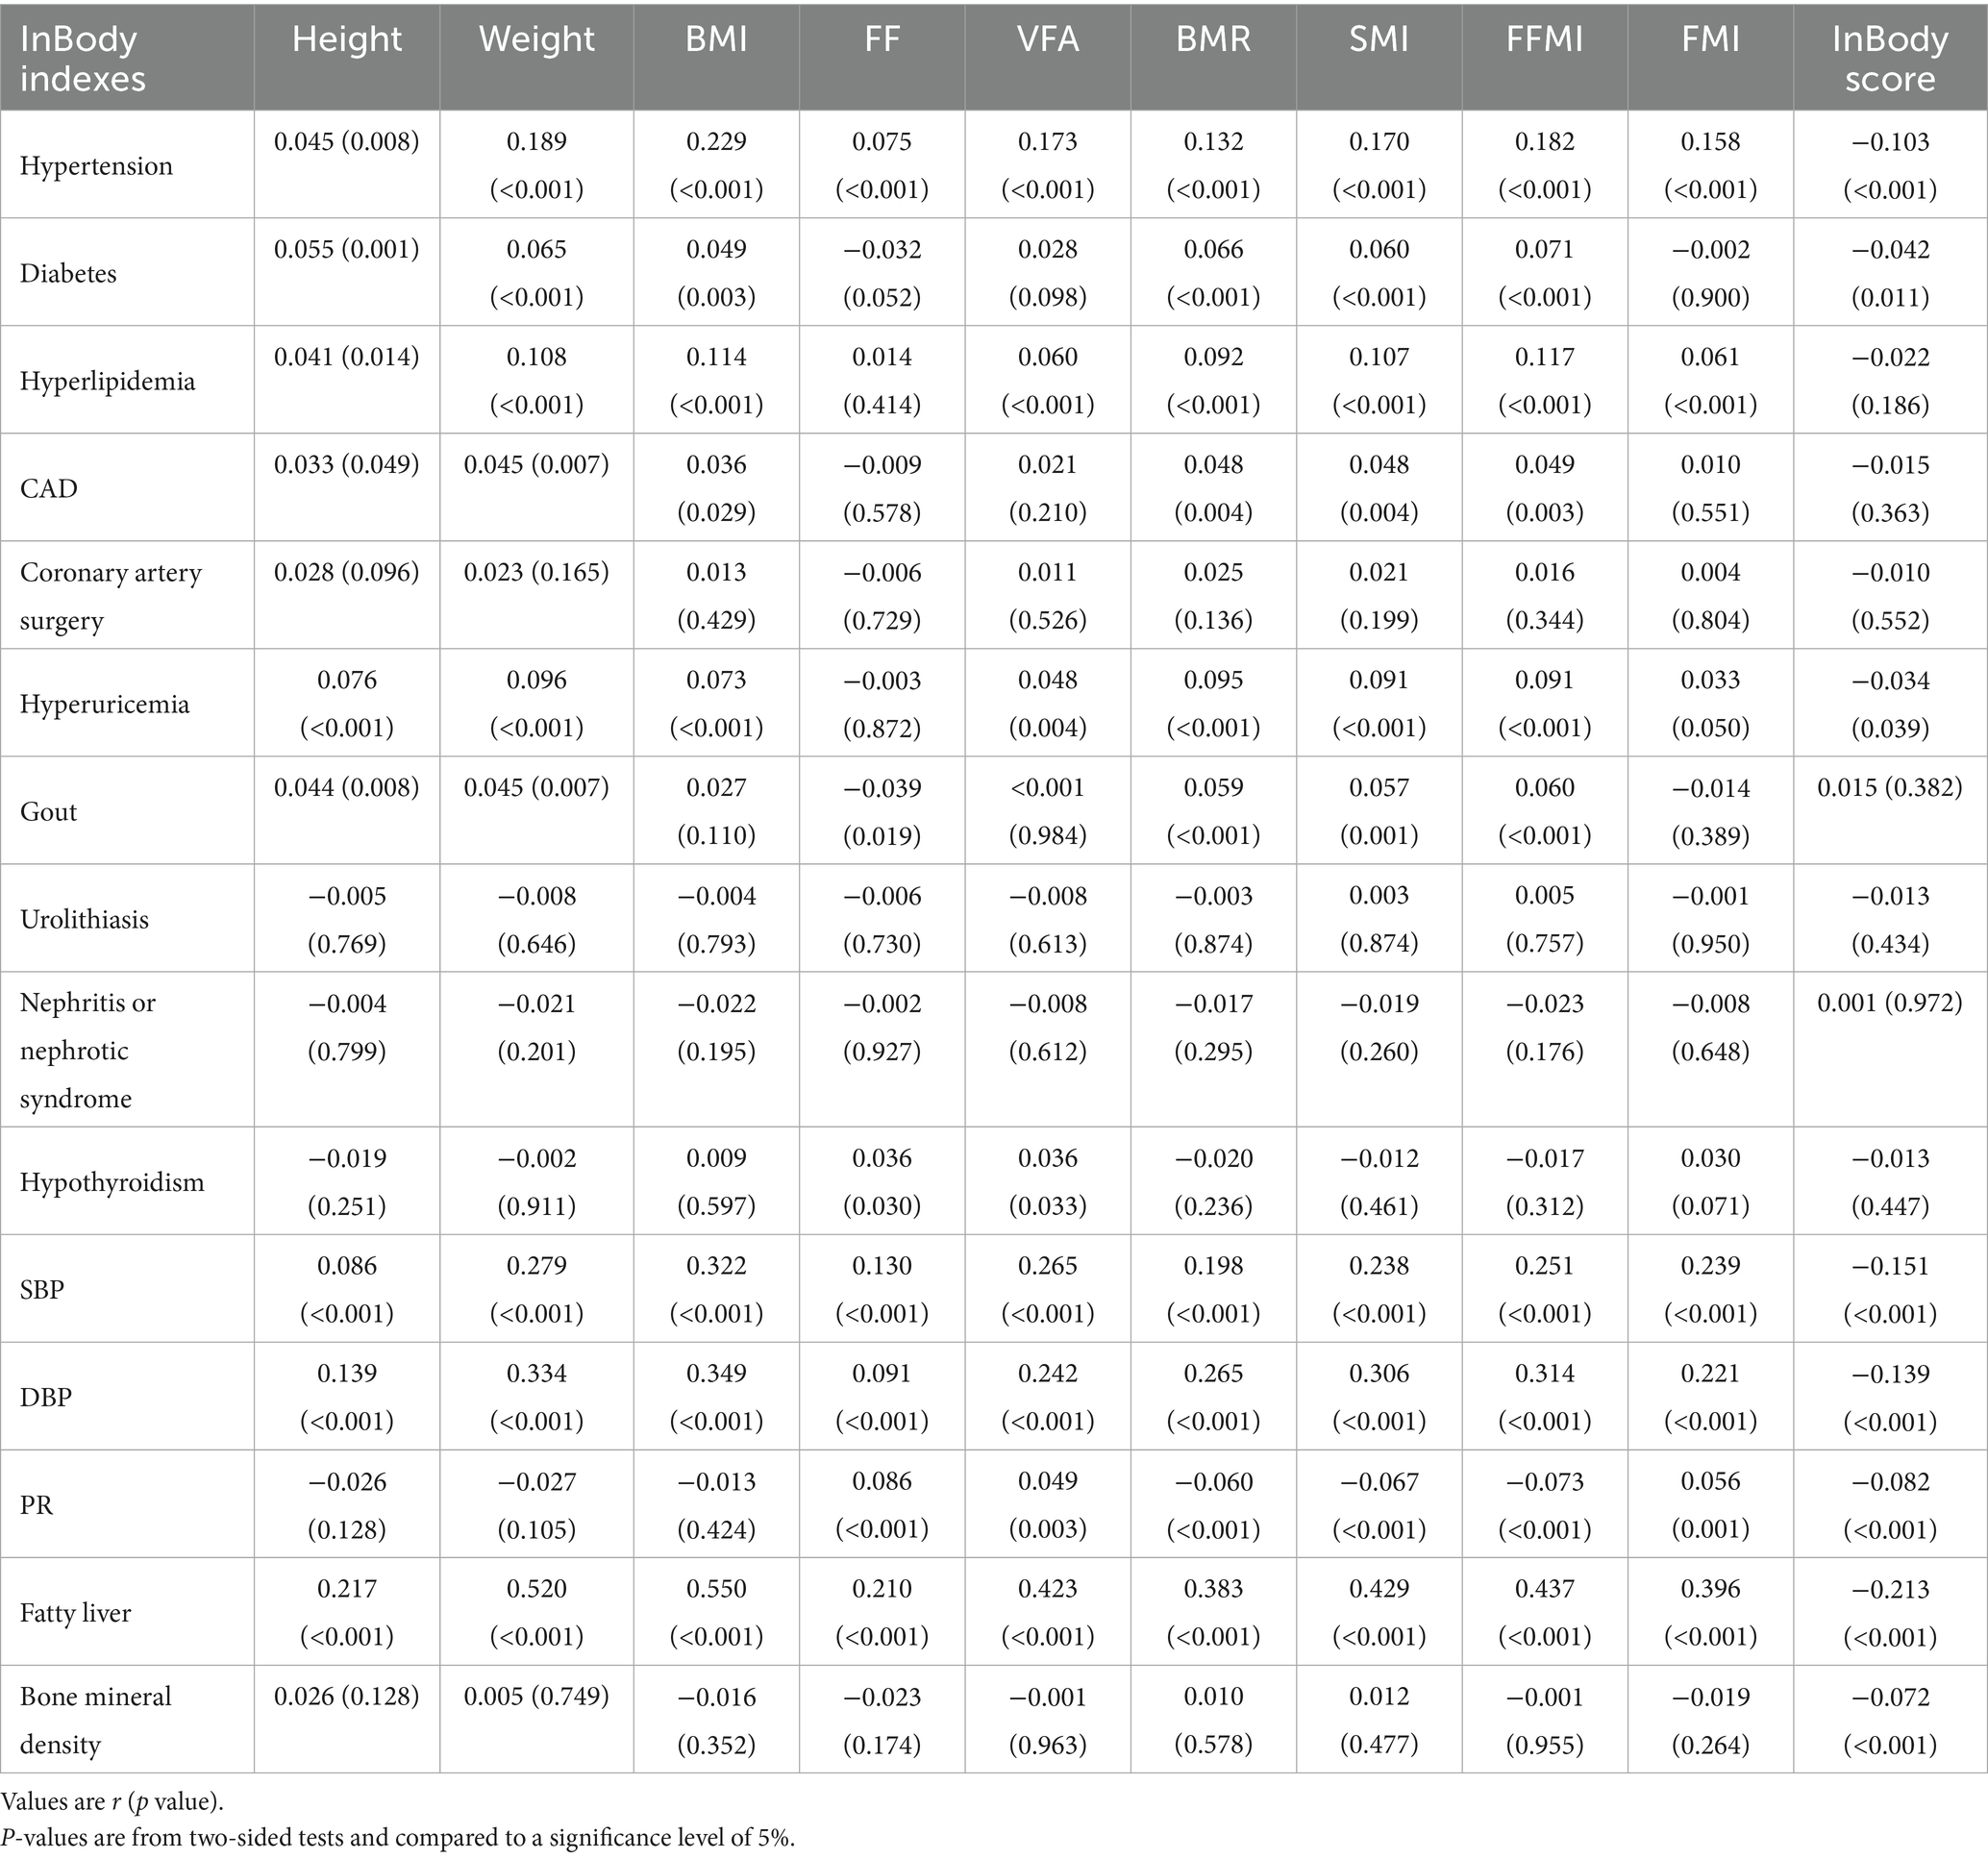
Table 2. Correlations between InBody indexes and patient characteristics.
Clustering analysis
For male participants, the whole cohort was split into two subgroups after clustering (Supplementary Table 3), and the feature importance and distribution of features are shown in Figure 1. The participants in cluster 2 were significantly higher, heavier, and showed higher BMI (all p < 0.001). The FF, VFA, BMR, SMI, FFMI, and FMI were also significantly higher (all p < 0.001) in cluster 2 participants, with the lower InBody score (68.0 [63.0; 73.0] vs. 69.0 [66.0; 73.0], p < 0.001), indicating the patients in cluster were under a worse metabolic status (Table 3).
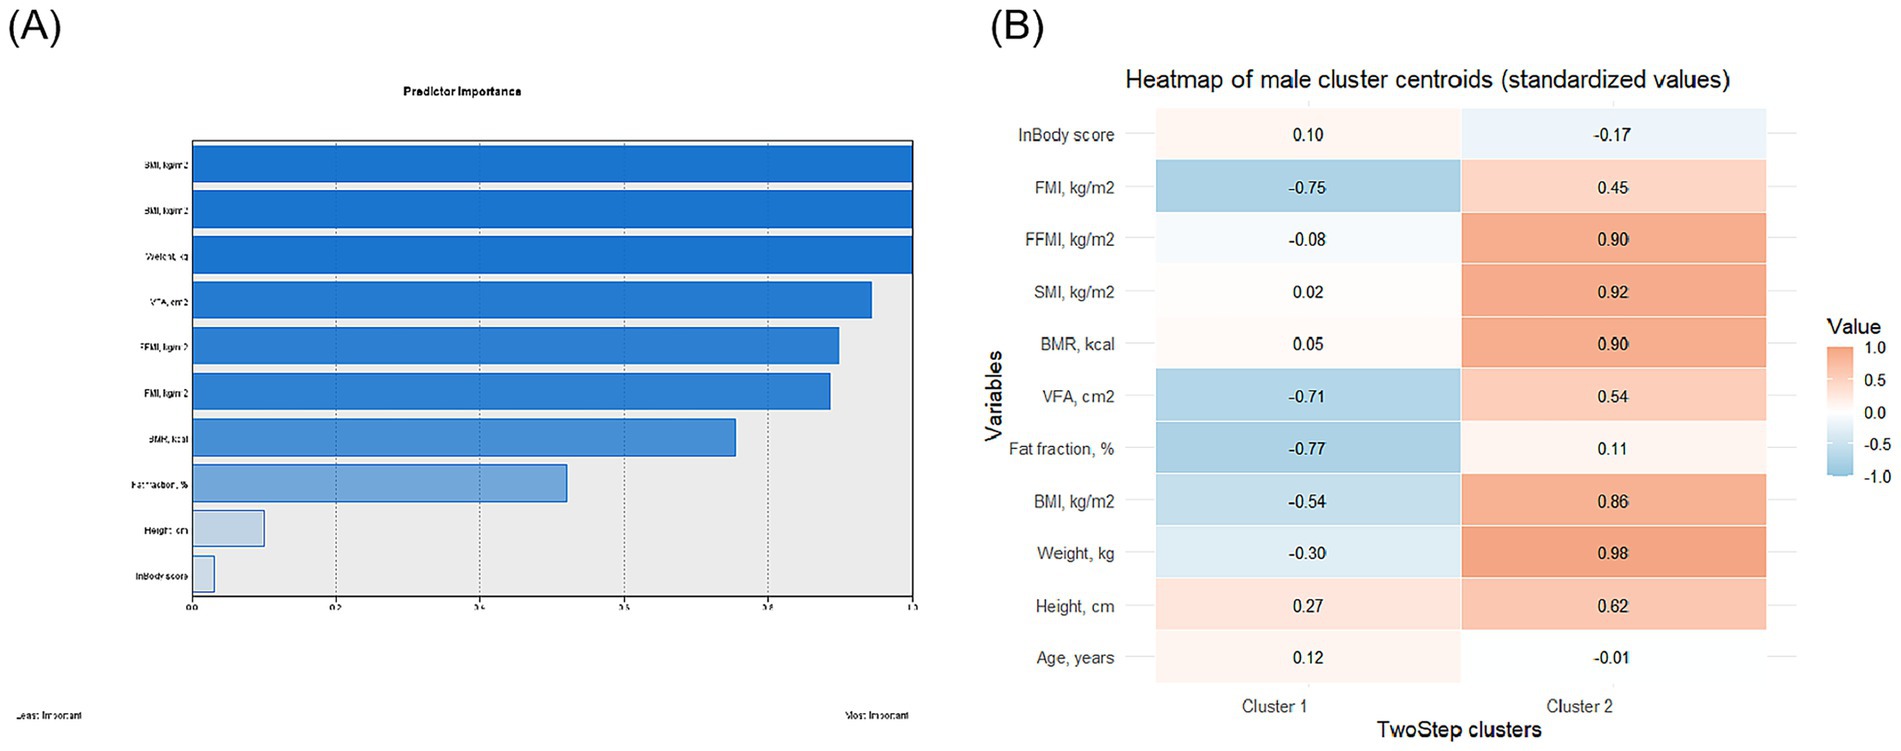
Figure 1. Visualization of feature importance (A) and distribution (B) in male participants.
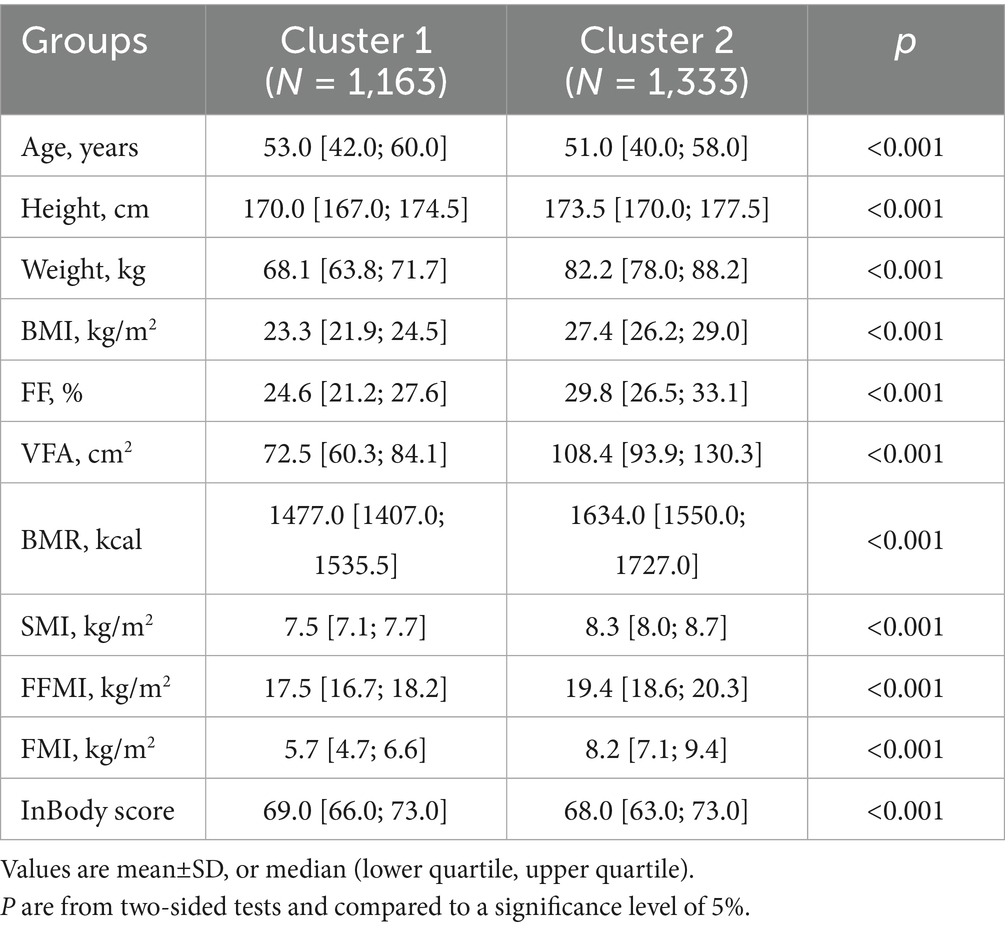
Table 3. Clustering analysis in male participants.
The female participants were clustered into three subgroups (Supplementary Table 4), and the feature importance and distribution of features are shown in Figure 2. Similar to participants in male subgroups, there were significant differences in characteristics across participants in the three clusters regarding age, height, weight, and BMI (all p < 0.001). Moreover, the three female subgroups also showed a significant difference regarding the InBody score (cluster 1:72.0 [70.0; 75.0]; cluster 2: 69.0 [66.0; 71.0]; and cluster 3: 65.5 [62.0; 69.0], p < 0.001). Specifically, similar to male participants, across the three clusters, with the InBody score decreased, the FF, VFA, BMR, SMI, FFMI, and FMI increased accordingly (all p < 0.001) (Table 4).
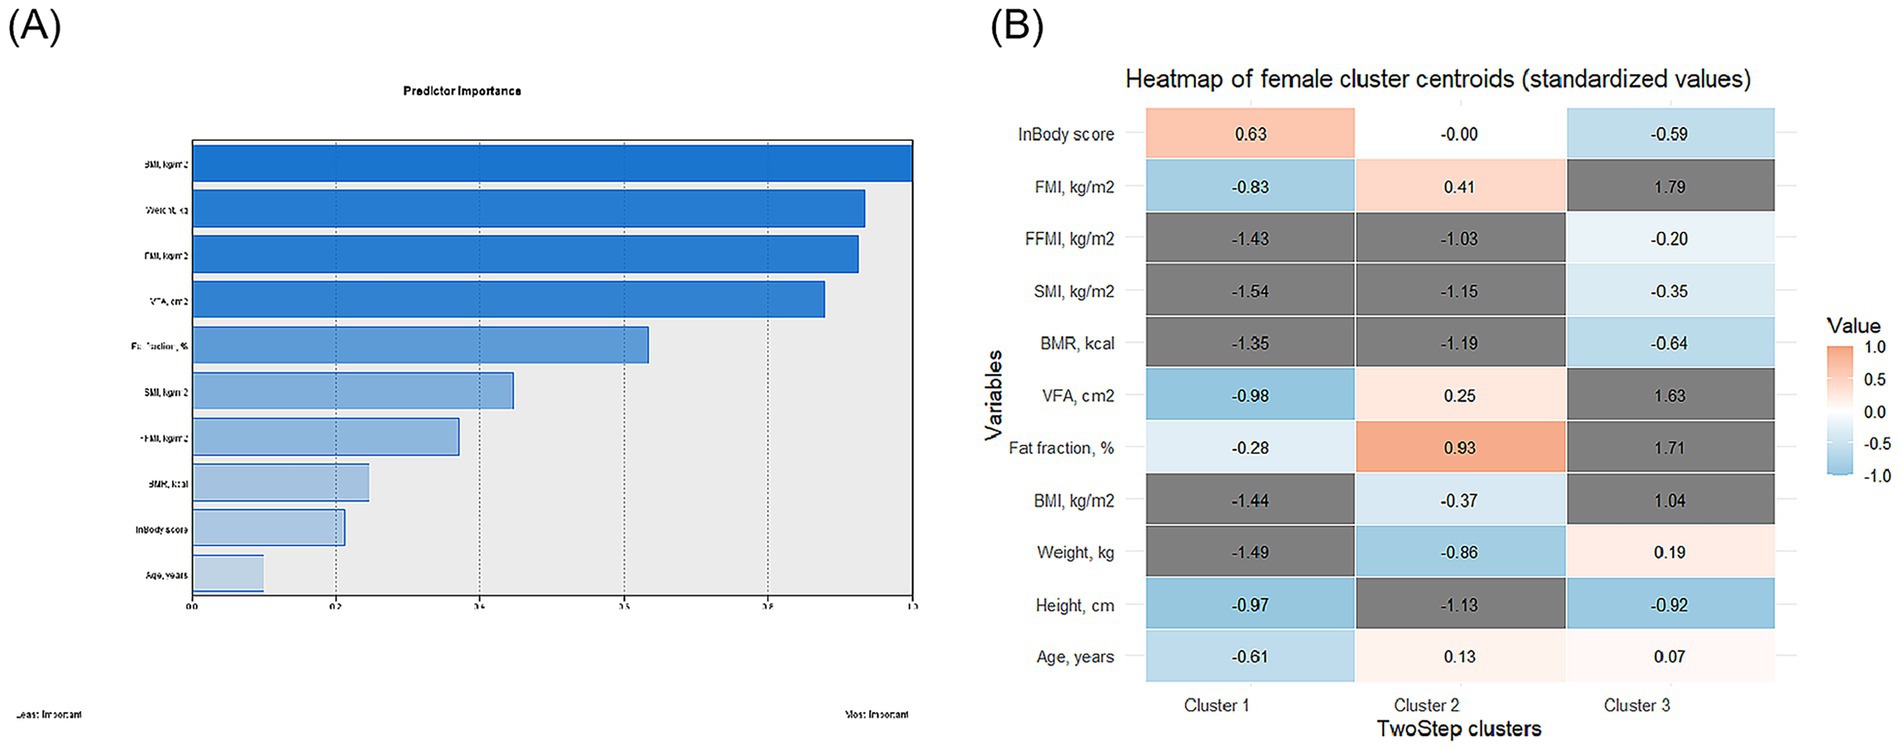
Figure 2. Visualization of feature importance (A) and distribution (B) in female participants.
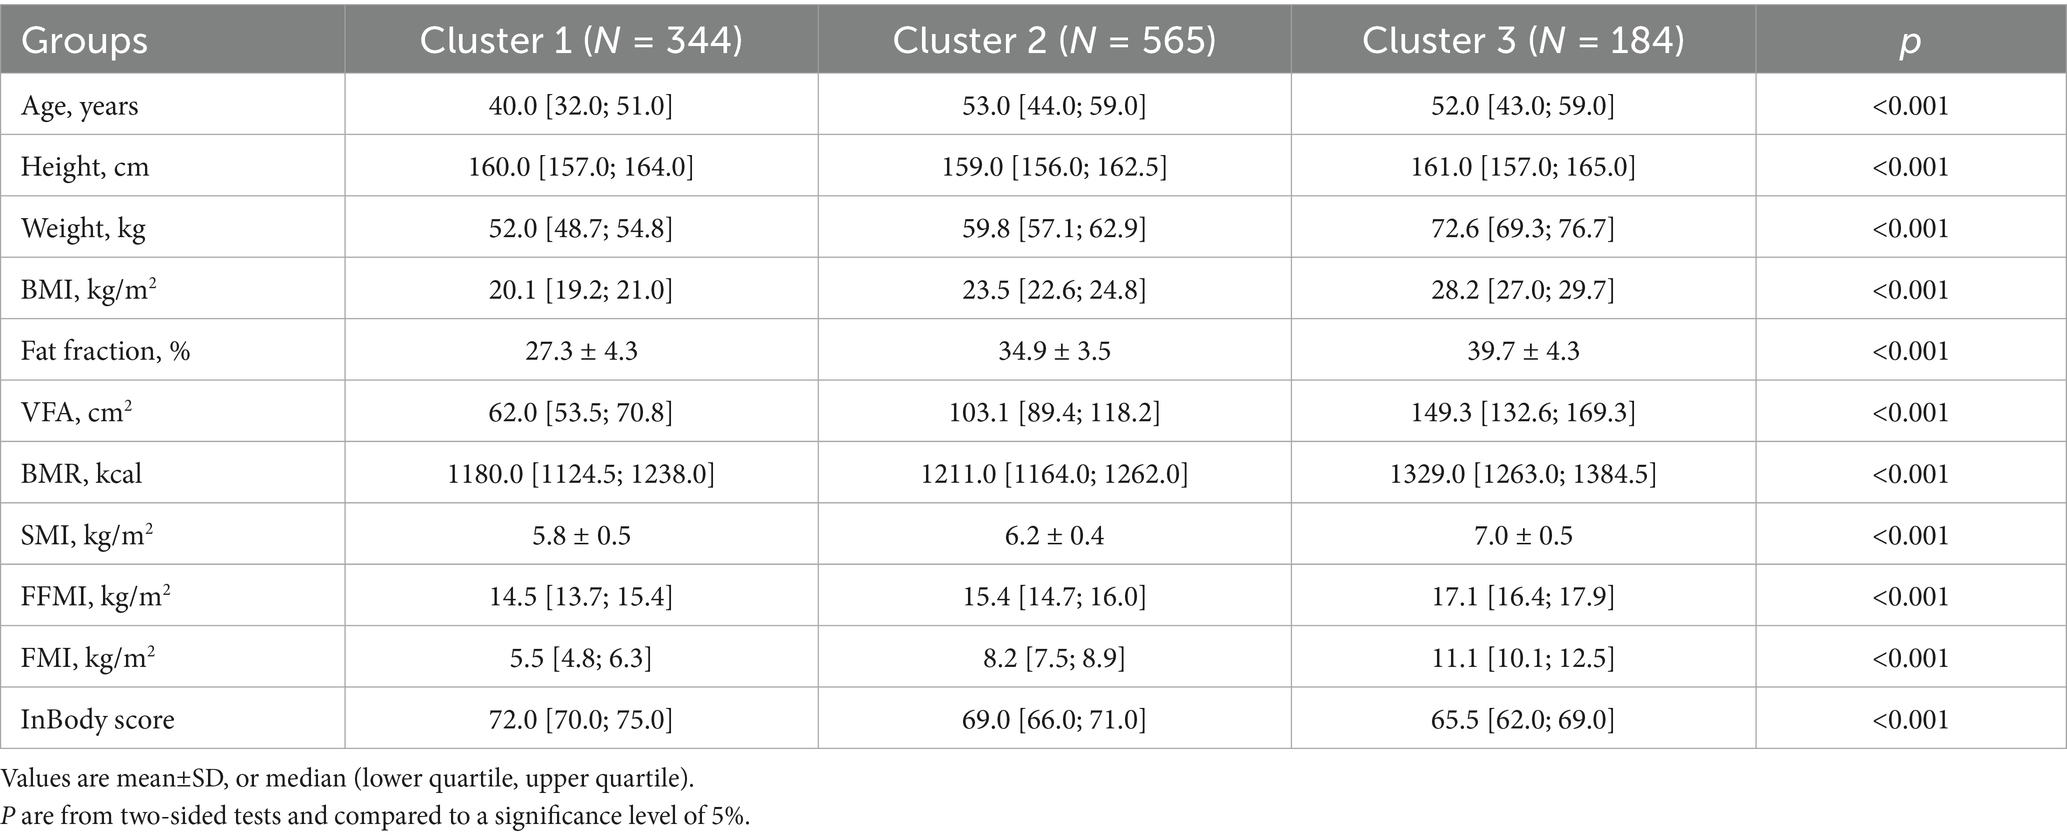
Table 4. Clustering analysis in female participants.
After taking clustering results and metabolic phenotypes into consideration simultaneously, we found that most male patients in cluster 2 were overweight or obese (99.6%), and the MUO took the largest proportion (61.2%), while among cluster 1 male participants, the distribution of patients with four metabolic phenotypes was relatively close. 39.1, 19.8, 21.0, and 20.2% for MHNW, MHO, MUNW, and MUO, respectively (Table 5).
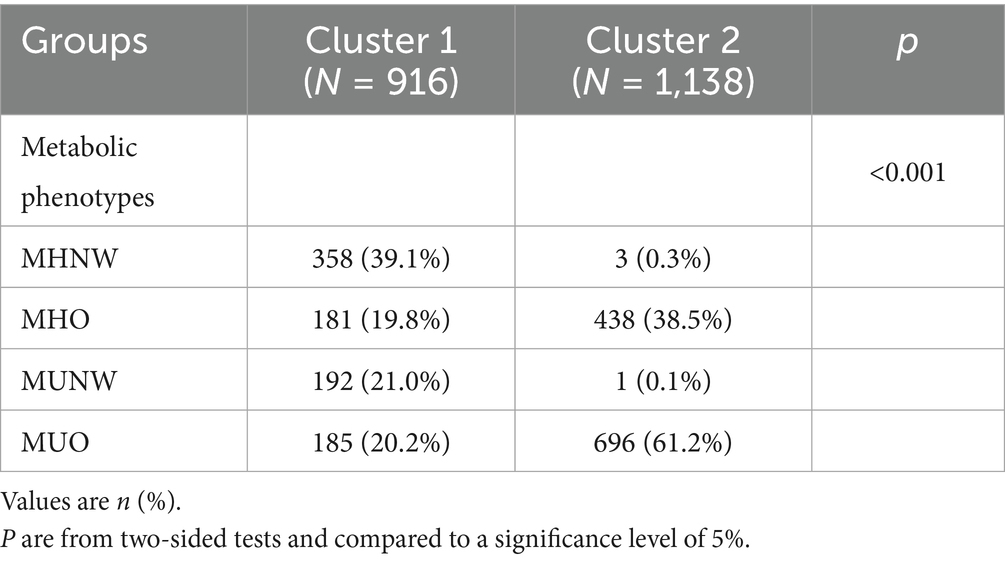
Table 5. Metabolic phenotype in male participants at different clusters.
Table 6 shows the distribution of metabolic phenotypes and clustering results in the female population. Similar to male subgroups, cluster 3 was mainly composed of overweight or obese participants (98.4%), while Cluster 1 was composed only with normal weight participants (100.0%), and Cluster 2 participants exhibited a relatively stable composition of patients with different metabolic phenotypes, more specific, 45.4, 20.6, 15.0, and 18.9% for MHNW, MHO, MUNW, and MUO, respectively (Table 6).
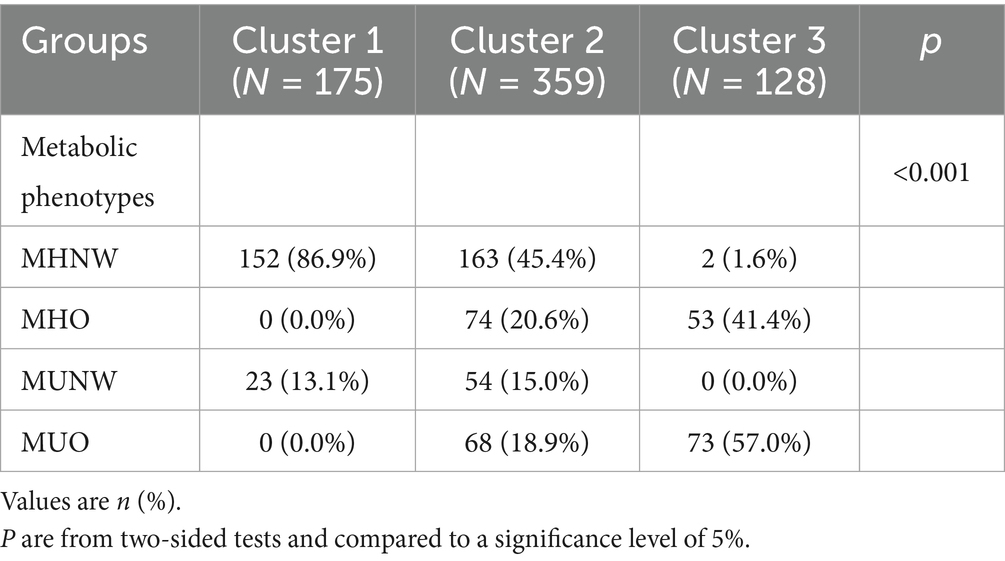
Table 6. Metabolic phenotype in female participants at different clusters.
Prevalence of metabolic diseases in sex-dimorphic clustering subgroups
For male participants, the prevalence of hypertension (29.4% vs. 21.2%, p < 0.001) and hyperlipidemia (8.4% vs. 4.9%, p = 0.001) was significantly higher in the cluster 2 subgroup (Table 7). While in female participants, a significantly higher prevalence of hypertension (22.8%) and diabetes (4.9%) was found in cluster 3, and the participants in cluster 1 had the lowest prevalence of hypertension (3.2%) and diabetes (1.2%) (p values were < 0.001 and 0.021, respectively) (Table 8).
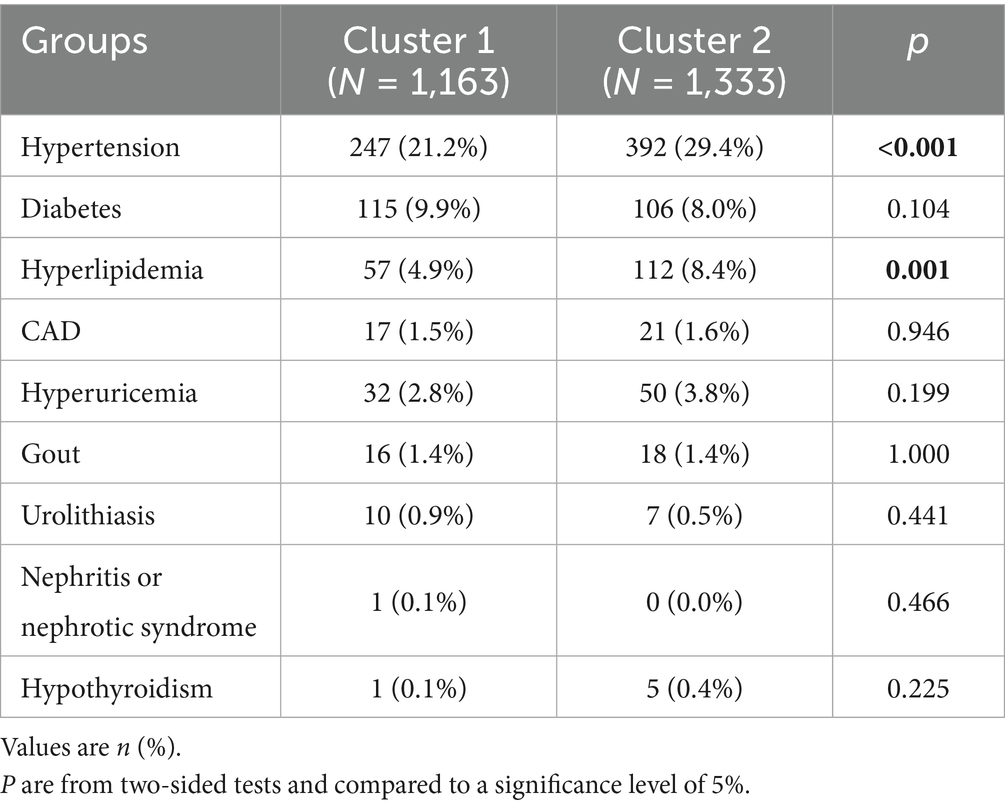
Table 7. Prevalence of metabolic diseases in male participants at different clusters.
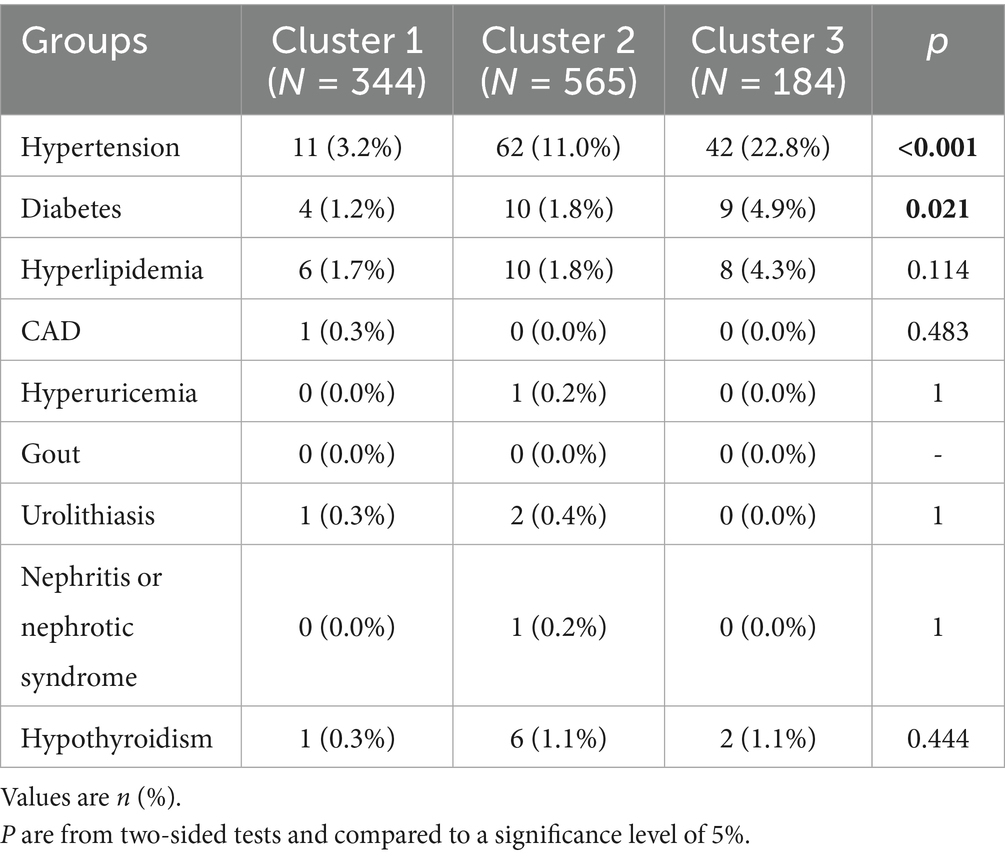
Table 8. Prevalence of metabolic diseases in female participants at different clusters.
Prediction of underlying diseases using metabolic phenotype and clustering results
In male participants, the AUCs were 0.629 (95% CI: 0.605–0.652), 0.626 (95% CI: 0.603–0.648), and 0.547 (95% CI: 0.527–0.567) for metabolic phenotypes + clustering results, metabolic phenotypes, and clustering results, respectively (Table 9; Figure 3). While in female participants, the AUCs were 0.770 (95% CI: 0.726–0.813), 0.755 (95% CI: 0.710–0.799), and 0.651 (95% CI: 0.610–0.692) for metabolic phenotypes + clustering results, metabolic phenotypes, and clustering results, respectively (Table 9; Figure 4). Indicating that the prediction model performance was better in the female group.
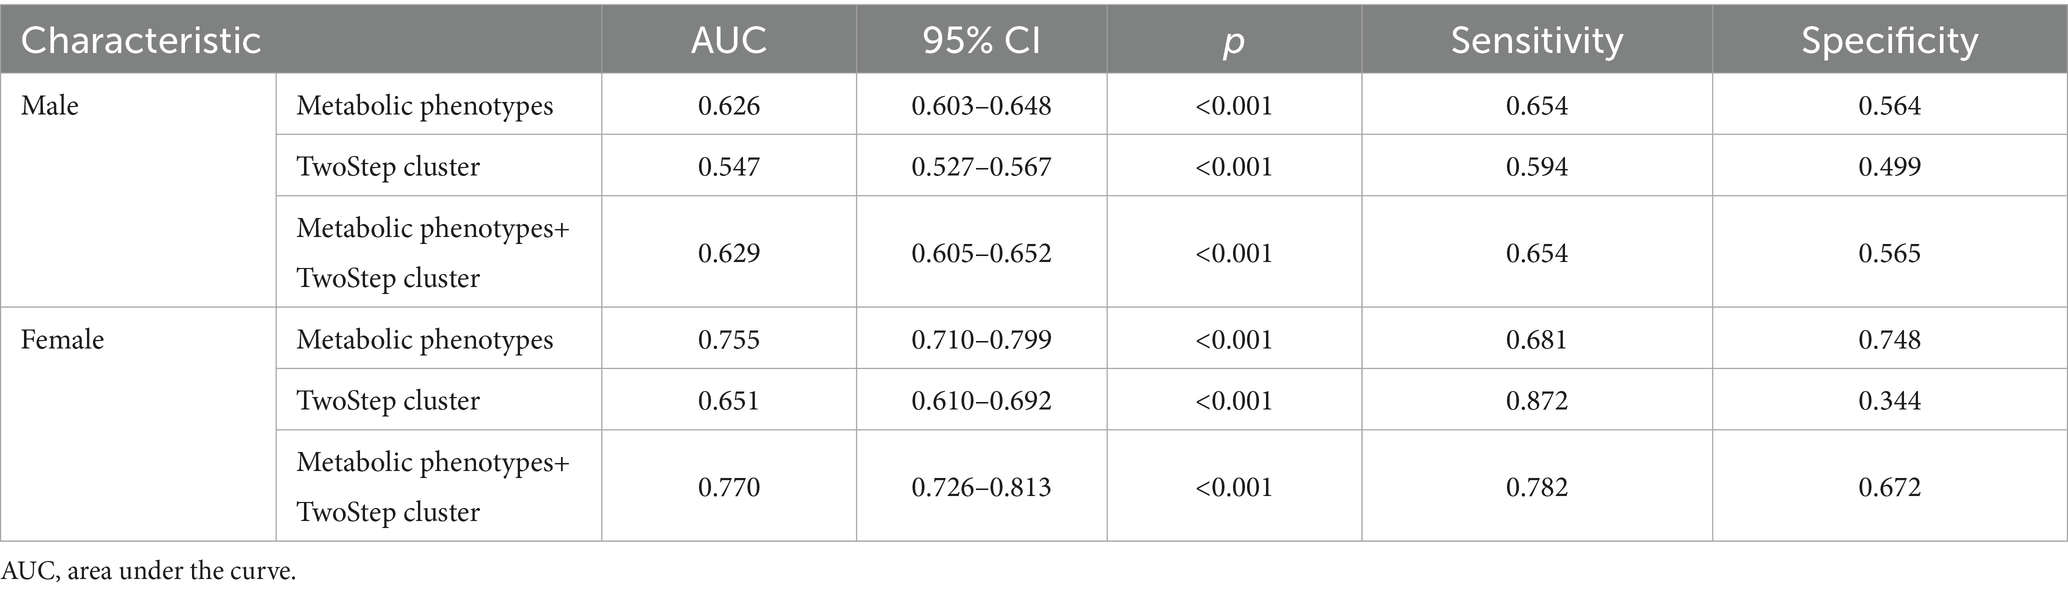
Table 9. Prediction model performance.
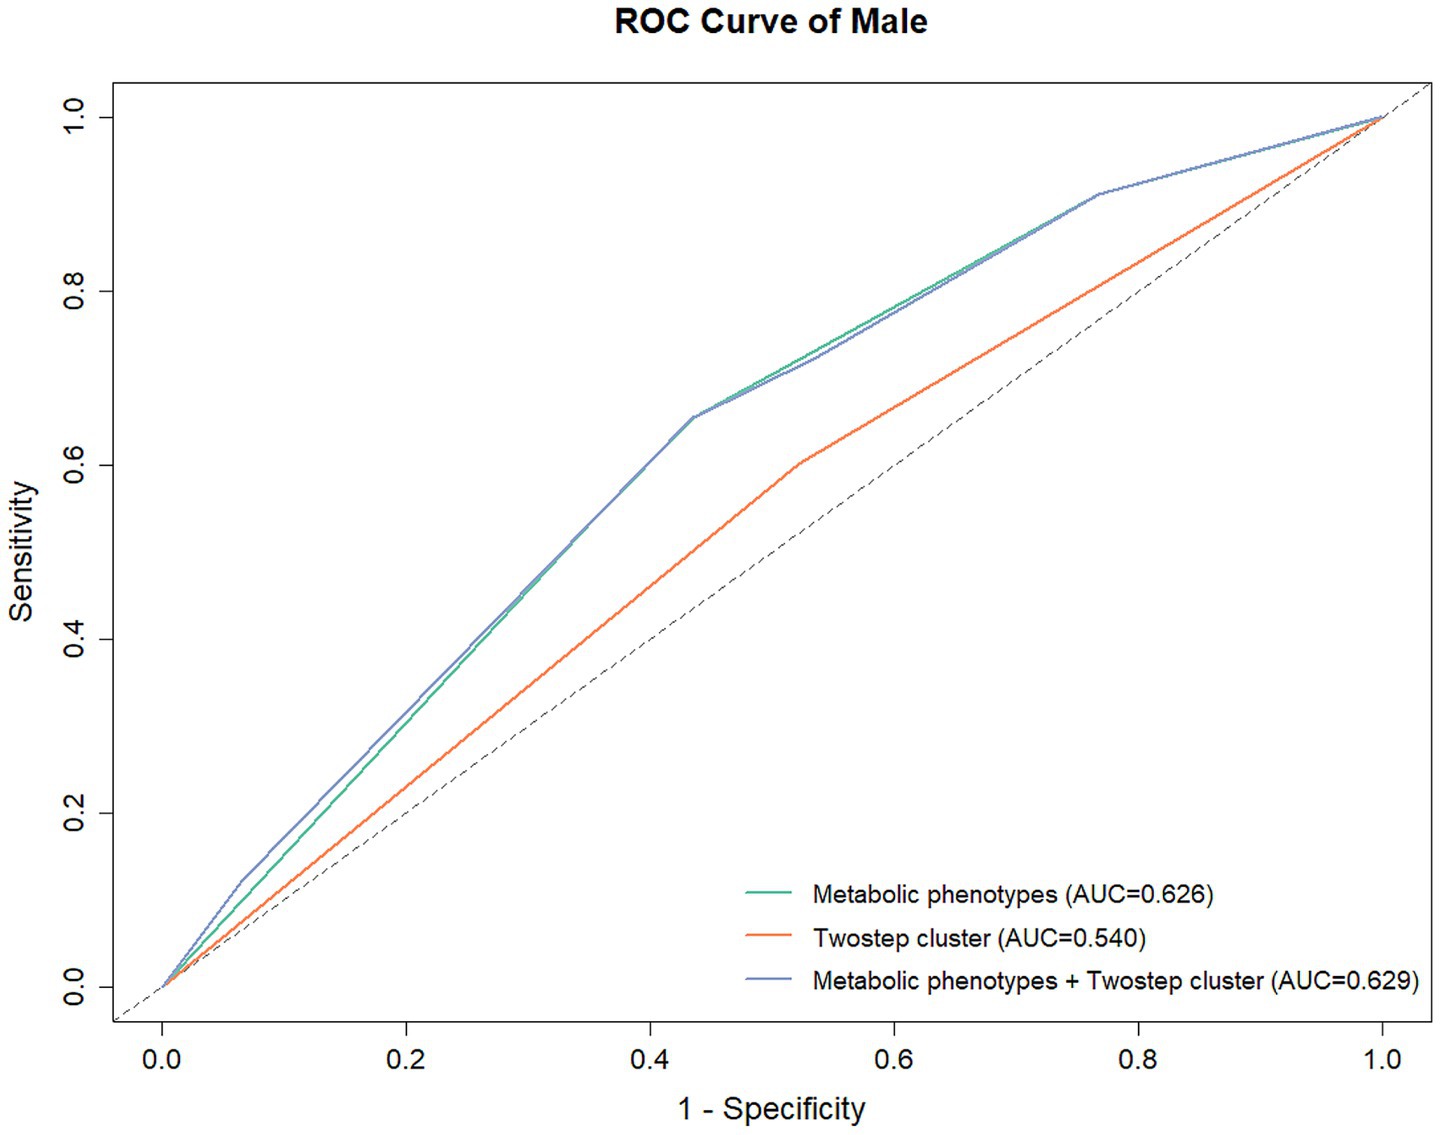
Figure 3. ROC for the prediction of underlying diseases in male participants.
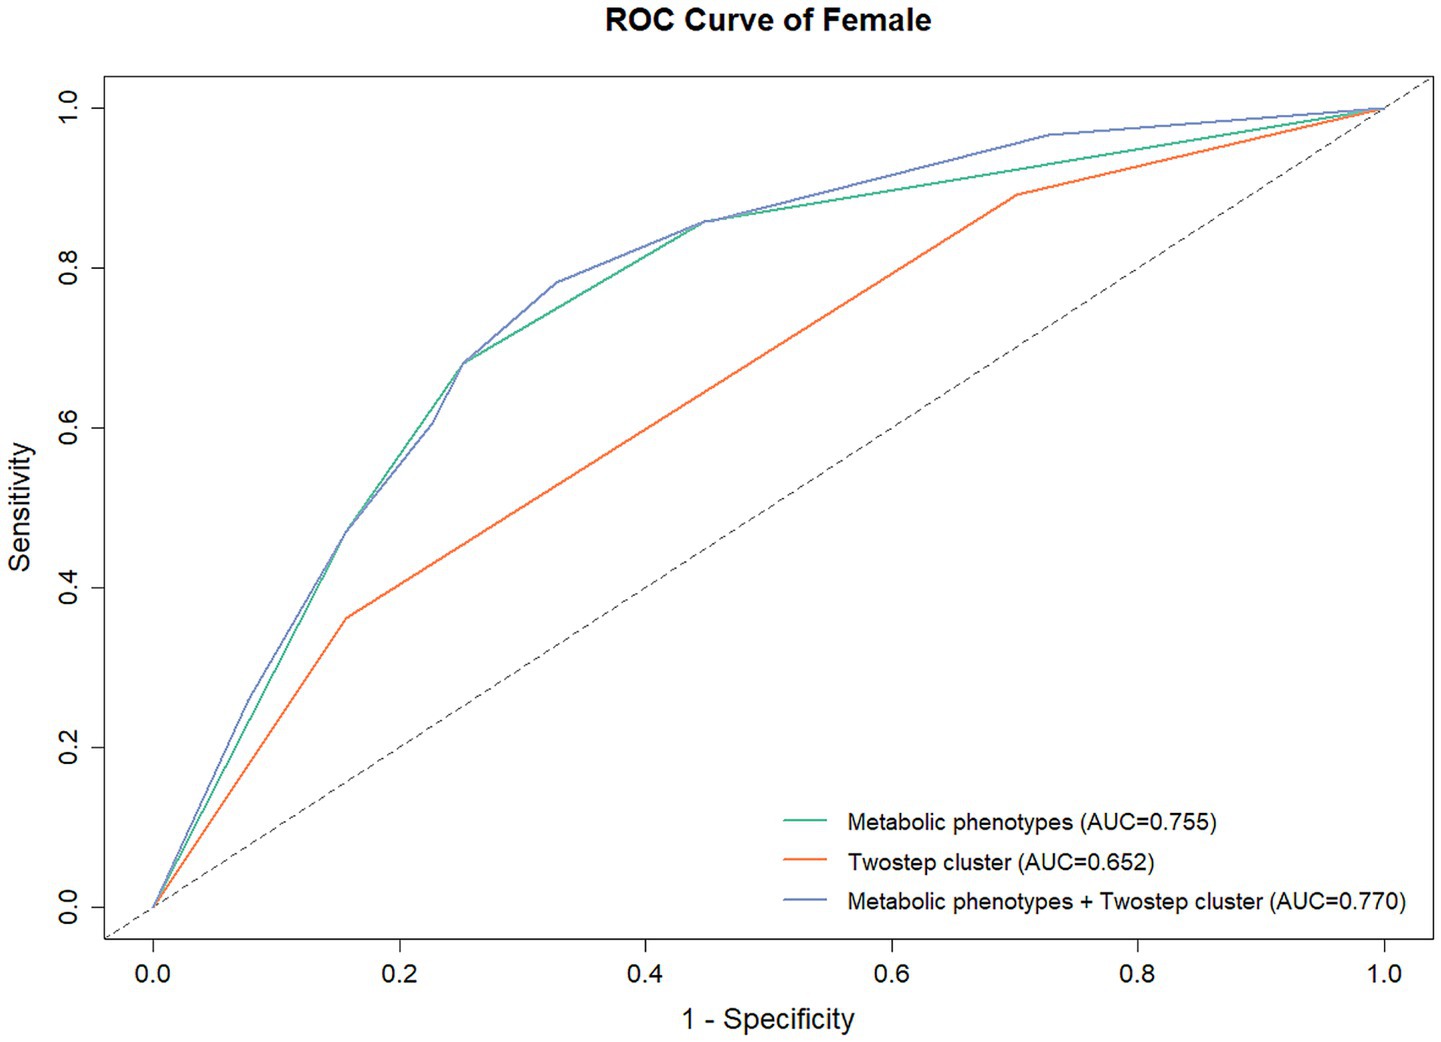
Figure 4. ROC for the prediction of underlying diseases in female participants.
Discussion
In this population-based study, we found that the InBody-based clustering analysis could classify people into different subgroups, which might indicate specific obese people with a higher risk of metabolic diseases. The findings of this study provide new ideas for managing metabolic diseases at a population level.
Body composition estimation is an important component in various professional and medical settings, and could be used to evaluate obesity, sarcopenia, and osteoporosis (19–21). Katahira et al. showed that estimated VFA is a better index for the evaluation of waist circumference for the diagnosis of MetS in central obesity patients (22), while Sarahi et al. developed a metabolic age prediction algorithm based on BMR and showed that the proposed method could facilitate the prediction of metabolic syndrome (23). however in the previous mentioned studies, BMR or VFA was evaluated using conventional techniques, while in some recent studies, the InBody was adopted and used in the evaluation of metabolic syndrome, Mohammad et al. revealed that decreased BMR, FFM, and total body water were associated with a high-antioxidant diet in normal-weight metabolic syndrome patients (24); Habib et al. collected InBody examination based body composition information in 360 obesity and overweight women, and they found that FFMI were different in participants with different nutrient patterns (25). However, to our knowledge, no study used the InBody indexes for the machine learning-based clustering of participants and explored the clustering results with the metabolic phenotypes. In the present study, we did the clustering analysis in male and female separately for the differences of body composition between different sexes, the body composition could be affected by hormone levels (26), eating habit (27), and developmental differences (28), the results also confirmed this hypothesis, we found clustering algorithm categorized male and female participants into two and three subgroups, and the obesity/overweight rate in male participants of cluster 2 reached 99.6%, while the obesity/overweight rate in female participants of cluster 3 reached 98.4%, indicating that BMI > 24 is a significant characteristic for the automatic clustering algorithm, the feature importance also revealed that BMI was the most importance feature in both male and female subgroups. We also noticed that female cluster 2 and male cluster 1, female cluster 3 and male cluster 2 showed similar metabolic phenotype composition, while female participants have an additional cluster 1 with only normal-weight participants included (86.9% MHNW and 13.1% MUNW), indicating that normal-weight female patients may represent a group of participants in the Chinese population, which is also in alignment with the results of a large-scale Chinese cohort study (29), we also noticed that the prevalence of hypertension (3.2% vs. 11.0 and 22.8%, p < 0.001) and diabetes (1.2% vs. 1.8 and 4.9%, p = 0.021) were also lower in cluster 1 female, which was also in agreement with several previous studies, Xu reported that overweight obese Chinese participants had a higher risk of developing diabetes compared to normal weight non obese participants (30), while Ren et al. reported that overweight-obese subjects with central obesity demonstrated the highest risk of hypertension compared to normal weight but no central obesity participants (31). The findings of the present study directly revealed that InBody examination results are different in both sexes, and the differences could further help differentiate participants into 2 or more subgroups, which is of great importance in a clinical scenario, Trempe et al. found that women presented a higher prevalence of abdominal obesity and elevated visceral fat level (32), however, when considering subgroups, the results could be different, and the subgroup classification provided a more delicate risk stratification and health status evaluation tool.
The association between hematological indicators and metabolic phenotypes is another important research topic for a better understanding of individualized health status. Several previous studies have revealed the specific associations between hematological indicators and metabolic phenotypes, both Feng and Zhao focused on serum uric acid and overweight/obese metabolic phenotypes, their results showed that hyperuricemia was positively associated with MHO and MU subjects (33, 34); while Ferreira et al. explored the relation between cytokine levels and different metabolic phenotypes and showed MUO subjects had a higher risk for increased cytokine levels (35). However, the previously mentioned studies only concentrated on limited hematological features, while in the present study, we analyzed the association between body index and about 50 characteristics, including both medical history and hematological indicators. Our results also reflect that a higher InBody score correlates with a better hematological status. Except for the hematological indicators, age, BMI and other basic characteristics were also important for the metabolic phenotypes and InBody clustering results, Murthy revealed that metabolic phenotype could refines cardiovascular risk evaluation in young adults (36), while Cho et al. showed an age-related metabolic derangement through CT body composition method (37), while in the present study, we included age in the clustering analysis, which could provide a more comprehensive spectrum of InBody-based cluster results.
Apart from hematological features and InBody indexes, this study also evaluated the associations between metabolic disease prevalence and clustering results. Although many studies have assessed the underlying relation between metabolic diseases and metabolic phenotypes, Zhao revealed that obesity was significantly associated with renal disease, while adding metabolic unhealthy status further increased the risk (38); Kim et al. stressed that the metabolic milieu beyond obesity could play a significant role in patients with hepatic fibrosis (39). The present study also showed that the prevalence of hypertension, diabetes, hyperlipidemia, and hyperuricemia was significantly different between patients of the four metabolic phenotypes. However, after a sex-dimorphic cluster analysis, only hypertension and hyperlipidemia remained significant in the male population, for females, the difference in prevalence was only observed in hypertension and diabetes. These results indicated that different disease prevalence may have a sex-specific and metabolism-dependent pattern. However, the robustness of this study was limited by the low prevalence of these diseases, and large-scale comorbidities data should be used to further validate our results. Still, these findings could provide more details for the understanding of metabolic diseases.
However, this study still had several limitations. Firstly, although more than three thousand participants were initially enrolled, this study was still a retrospective single-center study which unavoidably affected by the limitation of the study population, further external validation is required before the application of the study results. Secondly, the study only analyzed participants with normal weight and obesity/overweight, participants with reduced weight were excluded from the present study to avoid confounding, since low body weight often reflects distinct underlying illnesses or etiologies. Nevertheless, future studies should include participants with reduced weight for better generalization ability. Thirdly, the machine learning based clustering method could be difficult to understand for some clinicians, a more acceptable interpretation of the clustering results was in urgent need. Furthermore, although the clustering method did not require factors without multicollinearity, the highly correlated variables may amplify the weight of characteristics, which could be one of the strategies for improving the algorithm in the future. Finally, the present study focused on the InBody test results, due to the retrospective nature of this study, some basic information including smoking status, activity levels were not documented for all participants, moreover, the follow-up data was not obtained, inclusion of follow-up data and complete basic characteristics may facilitate better understanding of the cluster results in future studies.
Conclusion
This study showed that the InBody-based clustering analysis could classify the populations into different subgroups, indicating that InBody examination should be performed in a clinical scenario, and specific obese populations with a higher risk of metabolic diseases should receive more frequent health check-ups.
Data availability statement
The original contributions presented in the study are included in the article/Supplementary material, further inquiries can be directed to the corresponding authors.
Ethics statement
The studies involving humans were approved by the Ethics Committee of Taikang Xianlin Drum Tower Hospital (LS202319). The studies were conducted in accordance with the local legislation and institutional requirements. Written informed consent for participation was not required from the participants or the participants’ legal guardians/next of kin in accordance with the national legislation and institutional requirements.
Author contributions
DX: Writing – original draft, Writing – review & editing. LY: Writing – original draft. WC: Writing – original draft. YWu: Writing – original draft. YWa: Writing – review & editing.
Funding
The author(s) declare that financial support was received for the research and/or publication of this article. The study was supported by Taikang Xianlin Drum Tower Hospital Fund (TKKTYB20222203).
Conflict of interest
The authors declare that the research was conducted in the absence of any commercial or financial relationships that could be construed as a potential conflict of interest.
Generative AI statement
The authors declare that no Gen AI was used in the creation of this manuscript.
Any alternative text (alt text) provided alongside figures in this article has been generated by Frontiers with the support of artificial intelligence and reasonable efforts have been made to ensure accuracy, including review by the authors wherever possible. If you identify any issues, please contact us.
Publisher’s note
All claims expressed in this article are solely those of the authors and do not necessarily represent those of their affiliated organizations, or those of the publisher, the editors and the reviewers. Any product that may be evaluated in this article, or claim that may be made by its manufacturer, is not guaranteed or endorsed by the publisher.
Supplementary material
The Supplementary material for this article can be found online at: https://www.frontiersin.org/articles/10.3389/fnut.2025.1636849/full#supplementary-material
References
1. Gallego, A , Olivares-Arancibia, J , Yáñez-Sepúlveda, R , Gutiérrez-Espinoza, H , and López-Gil, JF . Socioeconomic status and rate of poverty in overweight and obesity among Spanish children and adolescents. Children. (2024) 11:1020. doi: 10.3390/children11081020
2. Zheng, Y , Sun, Y , Ren, W , Duan, R , Li, S , Chen, M, et al. Factors associated with nonalcoholic fatty liver disease in a non-overweight/obese and overweight/obese Chinese population at risk for metabolic syndrome: a cross-sectional multicenter study. Metab Syndr Relat Disord. (2024) 23:41–52. doi: 10.1089/met.2024.0168
3. Sigit, FS , Tahapary, DL , Riyadina, W , and Djokosujono, K . Sex disparities in the associations of overall versus abdominal obesity with the 10-year cardiovascular disease risk: evidence from the Indonesian National Health Survey. PLoS One. (2024) 19:e0307944. doi: 10.1371/journal.pone.0307944
4. Eastabrook, G , Murray, E , Bedell, S , Miller, MR , Siu, S , and de Vrijer, B . Pulse wave velocity as a tool for cardiometabolic risk stratification in individuals with hypertensive disorders of pregnancy and increased BMI. J Obstet Gynaecol Can. (2024) 47:102665. doi: 10.1016/j.jogc.2024.102665
5. Wang, M , Ni, X , and Yu, F . Impact of body mass index on risk of exacerbation in patients with COPD: a systematic review and Meta-analysis. Chronic Obstr Pulm Dis. (2024) 11:524–33. doi: 10.15326/jcopdf.2024.0507
6. Heikkinen, A , Bollepalli, S , and Ollikainen, M . The potential of DNA methylation as a biomarker for obesity and smoking. J Intern Med. (2022) 292:390–408. doi: 10.1111/joim.13496
7. Wewege, M , van den Berg, R , Ward, RE , and Keech, A . The effects of high-intensity interval training vs. moderate-intensity continuous training on body composition in overweight and obese adults: a systematic review and meta-analysis. Obes Rev. (2017) 18:635–46. doi: 10.1111/obr.12532
8. Al-Sofiani, ME , Ganji, SS , and Kalyani, RR . Body composition changes in diabetes and aging. J Diabetes Complicat. (2019) 33:451–9. doi: 10.1016/j.jdiacomp.2019.03.007
9. Huang, X , Zeng, Y , Ma, M , Xiang, L , Liu, Q , Xiao, L, et al. Associations between body composition profile and hypertension in different fatty liver phenotypes. Front Endocrinol. (2023) 14:1247110. doi: 10.3389/fendo.2023.1247110
10. He, H , Pan, L , Liu, F , Ren, X , Cui, Z , Pa, L, et al. The mediation effect of body composition on the association between menopause and hyperuricemia: evidence from China National Health Survey. Front Endocrinol. (2022) 13:879384. doi: 10.3389/fendo.2022.879384
11. Murray Hurtado, M , Martín Rivada, Á , Quintero Alemán, C , Ruiz Alcántara, MP , and Ramallo Fariña, Y . Body composition and nutritional status changes in adolescents with anorexia nervosa. An Pediatr. (2023) 99:162–9. doi: 10.1016/j.anpede.2023.06.015
12. Battaglia, Y , Ullo, I , Massarenti, S , Esposito, P , Prencipe, M , Ciancio, G, et al. Ultrasonography of quadriceps Femoris muscle and subcutaneous fat tissue and body composition by BIVA in chronic Dialysis patients. Nutrients. (2020) 12:388. doi: 10.3390/nu12051388
13. Brewer, GJ , Blue, MNM , Hirsch, KR , Saylor, HE , Gould, LM , Nelson, AG, et al. Validation of InBody 770 bioelectrical impedance analysis compared to a four-compartment model criterion in young adults. Clin Physiol Funct Imaging. (2021) 41:317–25. doi: 10.1111/cpf.12700
14. Ntineri, A , Menti, A , Kyriakoulis, KG , Bountzona, I , Prapa, S , Kollias, A, et al. Validation of the InBody BPBIO210 manual auscultatory hybrid device for professional office use in a general population according to the Association for the Advancement of medical instrumentation/European Society of Hypertension/International Organization for Standardization Universal Standard. Blood Press Monit. (2022) 27:135–8. doi: 10.1097/MBP.0000000000000571
15. Xia, L , Dong, F , Gong, H , Xu, G , Wang, K , Liu, F, et al. Association between indices of body composition and abnormal metabolic phenotype in Normal-weight Chinese adults. Int J Environ Res Public Health. (2017) 14:391. doi: 10.3390/ijerph14040391
16. Deng, Y , Ma, T , Ngai, FW , Wang, HH , Yang, L , Sun, Q, et al. Association of a healthy lifestyle index with anthropometric indices and obesity in Hong Kong Chinese women: evidence from the MECH-HK cohort study. Obes Res Clin Pract. (2024) 18:401–8. doi: 10.1016/j.orcp.2025.01.003
17. Ye, J , Zhuang, X , Li, X , Gong, X , Sun, Y , Wang, W, et al. Novel metabolic classification for extrahepatic complication of metabolic associated fatty liver disease: a data-driven cluster analysis with international validation. Metabolism. (2022) 136:155294. doi: 10.1016/j.metabol.2022.155294
18. Takeshita, S , Nishioka, Y , Tamaki, Y , Kamitani, F , Mohri, T , Nakajima, H, et al. Novel subgroups of obesity and their association with outcomes: a data-driven cluster analysis. BMC Public Health. (2024) 24:124. doi: 10.1186/s12889-024-17648-1
19. Stojković, M , Heinrich, KM , Čvorović, A , Jeknić, V , Greco, G , and Kukić, F . Accuracy of body mass index and obesity status in police trainees. Eur J Investig Health Psychol Educ. (2022) 12:42–9. doi: 10.3390/ejihpe12010004
20. Merchant, RA , Seetharaman, S , Au, L , Wong, MWK , Wong, BLL , Tan, LF, et al. Relationship of fat mass index and fat free mass index with body mass index and association with function, cognition and sarcopenia in pre-frail older adults. Front Endocrinol. (2021) 12:765415. doi: 10.3389/fendo.2021.765415
21. Kim, S , Lee, S , and Kwon, H . Association between serum uric acid level and bone mineral density in men more than 50 years of age. Front Endocrinol. (2023) 14:1259077. doi: 10.3389/fendo.2023.1259077
22. Katahira, M , Moriura, S , and Ono, S . Estimation of visceral fat area using criteria for metabolic syndrome: a cross-sectional study. Diabetes Metab Syndr. (2022) 16:102584. doi: 10.1016/j.dsx.2022.102584
23. Vásquez-Alvarez, S , Bustamante-Villagomez, SK , Vazquez-Marroquin, G , Porchia, LM , Pérez-Fuentes, R , Torres-Rasgado, E, et al. Metabolic age, an index based on basal metabolic rate, can predict individuals that are high risk of developing metabolic syndrome. High Blood Press Cardiovasc Prev. (2021) 28:263–70. doi: 10.1007/s40292-021-00441-1
24. Rashidmayvan, M , Sharifan, P , Darroudi, S , Saffar Soflaei, S , Salaribaghoonabad, R , Safari, N, et al. Association between dietary patterns and body composition in normal-weight subjects with metabolic syndrome. J Diabetes Metab Disord. (2022) 21:735–41. doi: 10.1007/s40200-022-01043-x
25. Yarizadeh, H , Setayesh, L , Majidi, N , Rasaei, N , Mehranfar, S , Ebrahimi, R, et al. Nutrient patterns and their relation to obesity and metabolic syndrome in Iranian overweight and obese adult women. Eat Weight Disord. (2022) 27:1327–37. doi: 10.1007/s40519-021-01268-4
26. Antony, B , Venn, A , Cicuttini, F , March, L , Blizzard, L , Dwyer, T, et al. Association of Body Composition and Hormonal and inflammatory factors with Tibial cartilage volume and sex difference in cartilage volume in young adults. Arthritis Care Res. (2016) 68:517–25. doi: 10.1002/acr.22715
27. Amadeh, T , Rafie, M , Radmanesh, S , Azizi, A , Ahangarian, A , Fathollahi, P, et al. Intelligent diet recommendation system powered by artificial intelligence for personalized nutritional solutions. Clin Nutr ESPEN. (2025) 6:S2405-4577(25)02924-9. doi: 10.1016/j.clnesp.2025.09.002
28. Güney, G , Schmitt, K , Zicola, J , Toprak, U , Rostás, M , Scholten, S, et al. The microRNA pathway regulates obligatory aestivation in the cabbage stem flea beetle Psylliodes chrysocephala. Commun Biol. (2025) 8:1288. doi: 10.1038/s42003-025-08721-5
29. Chen, K , Shen, Z , Gu, W , Lyu, Z , Qi, X , Mu, Y, et al. Prevalence of obesity and associated complications in China: a cross-sectional, real-world study in 15.8 million adults. Diabetes Obes Metab. (2023) 25:3390–9. doi: 10.1111/dom.15238
30. Xu, S , Ming, J , Jia, A , Yu, X , Cai, J , Jing, C, et al. Normal weight obesity and the risk of diabetes in Chinese people: a 9-year population-based cohort study. Sci Rep. (2021) 11:6090. doi: 10.1038/s41598-021-85573-z
31. Ren, H , Guo, Y , Wang, D , Kang, X , and Yuan, G . Association of normal-weight central obesity with hypertension: a cross-sectional study from the China health and nutrition survey. BMC Cardiovasc Disord. (2023) 23:120. doi: 10.1186/s12872-023-03126-w
32. Lajeunesse-Trempe, F , Piché, ME , Poirier, P , Tchernof, A , and Ayotte, P . Adiposity phenotypes and associated Cardiometabolic risk profile in the Inuit population of Nunavik. Nutrients. (2024) 16:725. doi: 10.3390/nu16050725
33. Feng, X , Yang, Y , Xie, H , Zhuang, S , Fang, Y , Dai, Y, et al. The association between hyperuricemia and obesity metabolic phenotypes in Chinese general population: a retrospective analysis. Front Nutr. (2022) 9:773220. doi: 10.3389/fnut.2022.773220
34. Zhao, W , and Zhao, C . Association between metabolic obesity phenotype, transition of metabolic phenotypes and the risk of hyperuricemia in Chinese adults: a cohort study. Medicine. (2022) 101:e32094. doi: 10.1097/MD.0000000000032094
35. Ferreira, FG , Reitz, LK , Valmorbida, A , Papini Gabiatti, M , Hansen, F , Faria Di Pietro, P, et al. Metabolically unhealthy and overweight phenotypes are associated with increased levels of inflammatory cytokines: a population-based study. Nutrition. (2022) 96:111590. doi: 10.1016/j.nut.2022.111590
36. Murthy, VL , Reis, JP , Pico, AR , Kitchen, R , Lima, JAC , Lloyd-Jones, D, et al. Comprehensive metabolic phenotyping refines cardiovascular risk in young adults. Circulation. (2020) 142:2110–27. doi: 10.1161/CIRCULATIONAHA.120.047689
37. Cho, SW , Baek, S , Han, S , Kim, CO , Kim, HC , Rhee, Y, et al. Metabolic phenotyping with computed tomography deep learning for metabolic syndrome, osteoporosis and sarcopenia predicts mortality in adults. J Cachexia Sarcopenia Muscle. (2024) 15:1418–29. doi: 10.1002/jcsm.13487
38. Zhao, L , Zou, Y , Wu, Y , Cai, L , Zhao, Y , Wang, Y, et al. Metabolic phenotypes and risk of end-stage kidney disease in patients with type 2 diabetes. Front Endocrinol. (2023) 14:1103251. doi: 10.3389/fendo.2023.1103251
Keywords: metabolic phenotypes, metabolic diseases, serum lipid levels, obese population, risk, body composition
Citation: Xiang D, Yuan L, Chen W, Wu Y and Wang Y (2025) A body composition-based clustering study and its association with metabolic phenotypes among the general population in China. Front. Nutr. 12:1636849. doi: 10.3389/fnut.2025.1636849
Edited by:
Arpita Mukhopadhyay, St. John's Research Institute, IndiaReviewed by:
Mostafa Gouda, National Research Centre, EgyptMarilaeta Cindryani, Ngoerah General Hospital, Indonesia
Copyright © 2025 Xiang, Yuan, Chen, Wu and Wang. This is an open-access article distributed under the terms of the Creative Commons Attribution License (CC BY). The use, distribution or reproduction in other forums is permitted, provided the original author(s) and the copyright owner(s) are credited and that the original publication in this journal is cited, in accordance with accepted academic practice. No use, distribution or reproduction is permitted which does not comply with these terms.
*Correspondence: Yangtian Wang, c2t5MTYxNjMyQGFsaXl1bi5jb20=; Dan Xiang, eGlhbmdkYW4xMjMwQDEyNi5jb20=