 Xinyao Liu1,2†Ruru Wang1,2†
 Yumeng Li1,2Jing Zhang2
 Jingjing Li1,2Shuangping Li1,2Qingping Ye1,2Renting Cao2Wen Wang2Wenhui Luo2Shujuan Beng2
 Xianchun Duan1,2,3,4,5*
 Can Peng2,3,4,5*
- 1Department of Pharmacy, The First Affiliated Hospital of Anhui University of Chinese Medicine, Hefei, China
- 2School of Pharmacy, Anhui University of Chinese Medicine, Hefei, China
- 3Key Laboratory of Xin'An Medicine, Ministry of Education, Hefei, China
- 4Xin'an Medical Research Institute, Hefei, China
- 5Anhui Province Key Laboratory of Chinese Medicinal Formula, Hefei, China
Background: The causes of acute liver injury (ALI) are complex and diverse, including alcohol, drugs, infections, and toxic substances, and it has become a major global health issue. Traditional Chinese medicine (TCM), with advantages such as broad-spectrum biological activity, low toxicity, and minimal side effects, has been widely used in drug research and development as well as disease management. Some TCMs have shown significant efficacy in treating ALI: Ganoderma lucidum polysaccharides, monoterpene glycosides from Paeonia lactiflora, glycyrrhizic acid saponins, and flavonoids all exhibit liver-protective effects; however, the protective effects of their compound preparations on liver injury remain unclear.
Methods: The study optimized the water extraction process using orthogonal experiments with AHP-entropy weight scoring. The preparation process was verified by single-factor experiments, Plackeett–Burman and Box–Bohnken tests. The mechanism of action was validated using network pharmacology methods and a CCl4-induced acute liver injury animal model.
Results: The developed extraction and granule formation processes were reliable after validation. The contents of active components in CEHG determined by HPLC were as follows: albiflorin 1.26%, paeoniflorin 5.42%, liquiritin 0.43%, glycyrrhizic acid 1.30%, and ganoderic acid A 0.14%, with batch-to-batch variation coefficients (RSD) of 1.66%, 0.87%, 2.32%, 1.60%, and 4.03%, respectively. The dry extract ratio was 18.23% with an RSD of 2.11%. Network pharmacology revealed that CEHG improved liver injury by regulating the HIF-1, p53, and FoxO signaling pathways. Animal experiments indicated that CEHG granules reduce liver function-related aspartate transaminase (AST), alanine transaminase (ALT), total cholesterol (TC), triglyceride (TG), total bilirubin (TBIL), and LDH levels, decrease the levels of inflammatory factors IL-6, IL-1β, and TNF-α and of oxidative stress-related MDA and ROS, and down-regulated the mRNA and protein levels of P53, Bax, and HIF-1α in rats with liver injury. Meanwhile, CEHG improved liver function-related Total Protein (TP), raised the levels of oxidative stress-related SOD, GSH-Px, and GSH, and up-regulated mRNA and protein expression of Bcl-2.
Conclusion: This study successfully optimized the extraction and granule-formation of CEHG and revealed its hepatoprotective mechanism through network pharmacology and animal studies, providing scientific evidence supporting the further development and clinical use of CEHG.
1 Introduction
Chemical liver injury (CLI) is a major cause of acute liver injury, whose incidence is rising yearly (1). CLI can result from improper drug use, long-term alcohol consumption, and exposure to toxic chemicals in the environment (2–4). These factors can directly poison liver cells, induce metabolic disorders, trigger oxidative stress, and activate immunological responses, all of which can damage liver cells (5). This damage can lead to different liver diseases that not only lower the quality of life of patients but can also be life-threatening. Thus, the development of liver-protective drugs or functional foods is of great practical significance.
Traditional Chinese medicine (TCM), with its multi-component and multi-target approach, offers great potential for modern drug development. Many TCMs and their extracts can protect the liver by regulating hepatic metabolic function, combating oxidative stress, inhibiting inflammation, and enhancing immunity (6, 7). Modern pharmacological studies have shown that Ganoderma lucidum contains components such as Ganoderma polysaccharides, Ganoderma triterpenoids, and sterols that exert hepatoprotective effects. Their mechanisms include antioxidation, free radical scavenging, anti-inflammation, immunomodulation, antifibrosis, and metabolic regulation (8–11). Paeonia lactiflora contains compounds such as monoterpene glycosides, triterpenoids, flavonoids, and tannins. The total glycosides, are the main hepatoprotective components and include active compounds such as paeoniflorin and albiflorin, which protect the liver through antioxidative stress, anti-inflammation, anti-cell death, immunomodulation, improvement of microcirculation, and anti-hepatic fibrosis (12–15). Glycyrrhiza glabra is a widely used medicinal plant and a TCM with medicinal and edible values that are extensively applied in the food and pharmaceutical industries. Its main chemical components consist of triterpenoid saponins, flavonoids, and polysaccharides. These components protect the liver through mechanisms such as antioxidation, anti-inflammation, anti-apoptosis, detoxification, and regulation of lipid metabolism (16–19). In our study, the following three herbs are combined: Paeonia lactiflora, which nourishes the blood, soothes the liver, alleviates pain, and protects the liver, serves as the sovereign herb; Ganoderma lucidum, which improves overall health, acted as the ministerial herb; and Glycyrrhiza glabra, which strengthened spleen function and harmonized the formula, functioned as the assistant and guide herb. Together, the combination was predicted to form a health-promoting formula that strengthened the body, eliminated harmful influences, balanced qi and blood, and coordinated liver and spleen functions.
Compared with ordinary formulations, effervescent granules have a pleasant taste and are easy to carry. They are widely used in health products and can greatly improve treatment compliance. This study aimed to optimize extraction and granule formation processes to develop a hepatoprotective health products with significant effects and easy acceptance (20). Systematic pharmacological studies and animal experiments will be conducted to verify their protective effects on liver injury, providing a theoretical basis and practical support for the development of new liver-protective health products.
2 Materials and methods
2.1 Materials
Ganoderma lucidum originated from Jinghe, Jilin. Paeonia lactiflora was purchased from Huiqiao Pharmaceutical Co., Ltd., Bozhou. Glycyrrhiza glabra was purchased from the Jingwan Chinese Medicine Slices Factory, Bozhou. Anhydrous citric acid of food grade, sodium bicarbonate, maltodextrin, and mannitol were obtained from Zhongchen Biotechnology Co., Ltd., Henan. Edible alcohol was acquired from Hanyong Alcohol Co., Ltd., Henan.
2.2 Reagents and standards
Ganoderic acid A, paeoniflorin, and albiflorin (purity ≥98%) were purchased from Chengdu Puesday Biological Technology Co., Ltd. Ammonium glycyrrhizinate (purity ≥98%) was obtained from Chengdu Chroma Biotechnology Co., Ltd. Liquiritin (purity ≥98%) was sourced from Beijing Zhongke Zhijian Biotechnology Co., Ltd. HPLC-grade methanol and acetonitrile were bought from Beijing J&K Scientific Technology Co., Ltd. Chromatographic-grade formic acid was procured from Shanghai Aladdin Biochemical Technologies Co., Ltd. The ROS detection kit was purchased from Shanghai Beibio Biotechnology Co., Ltd. The apoptosis kit, MDA colorimetric assay kit, SOD colorimetric assay kit, GSH colorimetric assay kit, GSH-PX colorimetric assay kit, BCA protein concentration determination kit, AST/GOT colorimetric assay kit, ALT/GPT colorimetric assay kit, LDH colorimetric assay kit, TC colorimetric assay kit, TG colorimetric assay kit, TBIL colorimetric assay kit, and TP colorimetric assay kit were obtained from Elabscience. The IL-1β kit, IL-6 kit, and TNF-α kit were purchased from Quanzhou Ruixin Biotechnology Co., Ltd. P53, Bax, Bcl-2, and HIF-1α antibodies were obtained from Affinity. β-actin, goat anti-mouse IgG, and goat anti-rabbit IgG antibodies were purchased from Zs-BIO. RIPA lysis buffer (strong) and PMSF were obtained from Biosharp. SDS, glycine, Tris, APS, acrylamide, bis-acrylamide, and PBS buffer powder were purchased from Servicebio. All other reagents were obtained from professional reagent companies.
2.3 Animals
SPF-grade SD rats (male, 7–8 weeks old, 200 ± 20 g, n = 60) were purchased from Liaoning Changsheng Biotechnology Co., Ltd. in Liaoning, China [SCXK (Liao) 2020-0001]. The Experimental Ethics Committee of Anhui University of Chinese Medicine (Hefei, China, AHUCM-rats-2024049) granted approval for all animal experiments.
2.4 Extraction and preparation of CEHG
2.4.1 Steps of preparation of the CEHG extract
According to the drug usage standards of the 2020 edition of the Chinese Pharmacopeia, the daily formula dosage of CEHG is as follows: Ganoderma lucidum 6 g, Paeonia lactiflora 6 g and Glycyrrhiza glabra 3 g. Preparation of the extract: Weigh the Chinese herbal slices in proportion, place them in a stainless steel pot, and add water to soak (preliminary experiments show that the water absorption rate of the herbal slices is approximately twice their own weight, so an additional twice the amount of water needs to be added for subsequent extraction). After soaking, heat and decoct the mixture; the filtrate is filtered through 8 layers of medical gauze to obtain the extract. Concentrate the extract in a material-to-liquid ratio of 1:1 using a rotary evaporator, freeze-dry it, then crush it in a mortar and pass through an 80-mesh pharmaceutical sieve to obtain the extract powder.
2.4.2 Optimization of extraction process by orthogonal experiment
An orthogonal experimental design with three factors and three levels was adopted to select the levels of the water addition ratio (A), the number of extraction times (B), and the extraction duration (C). The experimental combinations of these factors were arranged according to the orthogonal table, as detailed in Table 1.
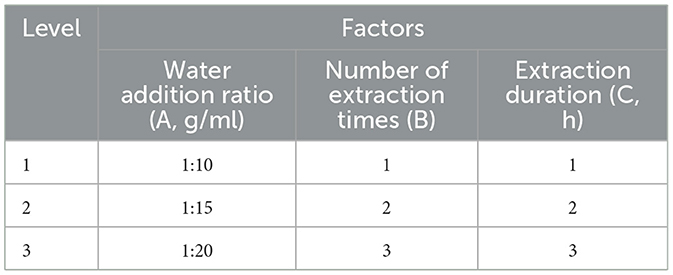
Table 1. Orthogonal test factors and levels table.
2.4.3 Optimization of the extraction process by the combined AHP-entropy weighting method
The critical quality indicators of the Compound Liver-protecting Effervescent Granules, determined by the functions of the product, were identified as the dry extract ratio and the content of albiflorin, paeoniflorin, liquiritin, glycyrrhizic acid and ganoderic acid A. The dry extract ratio was measured by the loss on drying method and the contents of albiflorin, paeoniflorin, liquiritin, glycyrrhizic acid and ganoderic acid A were determined by high-performance liquid chromatography (HPLC). Chromatographic column: caprisil C18-AQ (5 μm, 250 mm × 4.6 mm), mobile phase: 0.1% formic acid water (A) acetonitrile (B); gradient elution: 0–8 min, 90%−86%A; 8–16 min, 86%−75%A; 16–21 min, 75%−74%A; 21–26 min, 74%-68%A; 26–48 min, 68%−42%A; 48–53 min, 42%−12%A; 53–54 min, 12%−90%A; 54–55 min, 90%A; flow rate: 0.8 ml/min; detection wavelength: 254 nm; column temperature: 30 °C; injection volume: 10 μl.
Accurately weigh appropriate amounts of paeoniflorin lactone, paeoniflorin, liquiritin, ammonium glycyrrhizinate, and ganoderic acid A, dissolve them in 80% methanol to prepare reference standard stock solutions with mass concentrations of 1.25, 2.66, 1.38, 1.29, and 0.10 mg/ml respectively. Pipette different volumes of the above reference standard solutions into 5 ml volumetric flasks, dilute to the mark, and obtain a mixed reference standard solution with mass concentrations of 62.50, 532.0, 69.00, 129.0, and 25.00 μg/ml respectively.
Accurately weigh 0.2 g of the main drug into a 50 ml volumetric flask, dilute to the mark with 80% methanol, and weigh the mass. Subject the flask to ultrasonic treatment for 30 min (40 kHz, 200 W), then allow it to cool to room temperature. Replenish the lost mass with 80% methanol, shake well, take 1 ml of the solution, centrifuge it at 12,000 r/min for 10 min, and collect the supernatant to obtain the test sample solution.
According to Table 2, paeoniflorin and albiflorin, act as the main hepatoprotective components with equal importance, both scoring 1 point, but slightly more important than liquiritin and glycyrrhizic acid (both scoring 3 points), and significantly higher than ganoderic acid A and the dry extract ratio (both scoring 5 points); AHP hierarchical analysis, subjective and objective entropy weighting of information were carried out using the SPSSAU online analysis tool (https://spssau.com/indexs.html), in which the combined weights were determined according to formula 1, orthogonal experimental data were standardized according to formula 2. A comprehensive score was calculated by comprehensive weighting according to formula 3, and finally the best process was defined through variance and range hierarchical analysis of AHP.
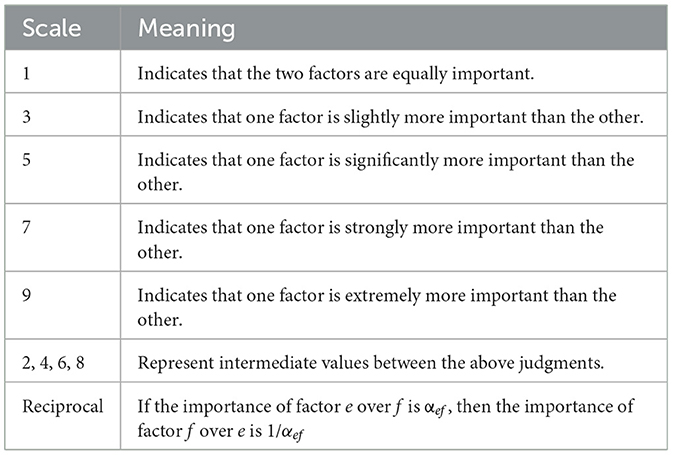
Table 2. Criteria for AHP construction of judgment matrices.
2.4.4 Precision test
Take the mixed reference standard solution, inject it continuously for 6 times under the chromatographic conditions specified in “Section 2.4.3”, record the peak areas and retention times, and calculate the relative standard deviation (RSD) percentage.
2.4.5 Repeatability test
Take the main drug from the same batch, prepare 6 parallel test sample solutions according to the method specified in “Section 2.4.3”, and perform injection analysis. Record the peak areas and retention times, then calculate the relative standard deviation (RSD) percentage.
2.4.6 Stability test
Accurately pipette the same test sample solution, let it stand at room temperature, and perform injection analysis at 0, 2, 4, 8, 12, 16, and 24 h under the chromatographic conditions specified in “Section 2.4.3”. Record the peak areas and retention times, then calculate the relative standard deviation (RSD) percentage.
2.4.7 Determination of molding parameters for CEHG
The extract powder was prepared according to the optimal process parameters. For the preparation of CEHG, the extract powder was first mixed with a diluent (mannitol: maltodextrin = 1:1) and divided into two equal parts. Anhydrous citric acid was added to one part, and sodium bicarbonate was added to the other. The ethanol solution was used as the binder for wet granulation of each part separately; after drying, the granules were mixed uniformly and sized. The amount of extract was fixed at 10 g, whereas the amounts of diluent and binder and the volume fraction of ethanol were varied, with the molding rate used as an index to optimize the process parameters. Based on preliminary experiments, the amount of diluent, the volume fraction of ethanol, and the amount of binder were selected as optimization factors for the Box–Behnken experimental design, with 3 levels set for each. The response surface analysis was performed using Design-Expert v.13.0 software, including 12 factorial points and 5 center points, resulting in a total of 17 experiments. The design is shown in Table 3.
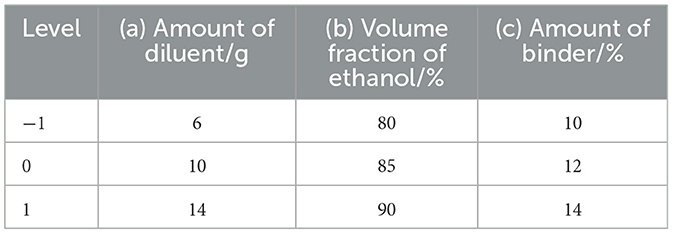
Table 3. Factors and levels of box—Behnken experiment.
2.4.8 Verification of an optimal molding process and quality testing of the pulmonary protective effects of CEHG
After determining the optimal process, the validation experiments were conducted in triplicate. The prepared granules were subjected to quality inspection in accordance with the requirements for the granule agents (0104) specified in Volume III of the 2020 Chinese Pharmacopeia. The tests included measurements of particle size, moisture content, dissolving properties, and angle of repose.
2.5 Network pharmacology study of compound liver-protecting effervescent granules
2.5.1 Collection of active components and targets
Literature was reviewed to collect active components of Paeonia lactiflora, Glycyrrhiza uralensis, and Ganoderma lucidum. Their SDF (2D) structure files were downloaded from the PubChem (https://pubchem.ncbi.nlm.nih.gov/) platform and imported into the PharmMapper (https://lilab-ecust.cn/pharmmapper/submitfile.html) database to predict potential targets. Data with a normalized fit score ≥0.6 were selected to obtain the UniProt IDs of the targets for each component. These IDs were consolidated and duplicates were removed. Finally, the IDs were converted to gene names via the UniProt (https://www.uniprot.org/) website (21–23).
2.5.2 Collection of liver injury disease targets
Targets related to liver injury were collected by searching the GeneCards (https://www.genecards.org/) database using the keyword “Liver injury” (24). The exported data were filtered in Excel to select target information with a relevance score of at least twice the median value of the relevance scores.
2.5.3 Intersection of active components and liver injury targets
Online tool Venny 2.1.0 (https://bioinfogp.cnb.csic.es/tools/venny/index.html) was used to find the intersection of active component targets and liver injury target genes, and to create a Venn diagram. These intersectional genes (or “genes from the intersection”), regarded as potential targets for the granules against liver injury, were used for further analysis.
2.5.4 Construction of active component–target–disease network
Cytoscape 3.9.1 was used to construct the target network of active components and visualize the relationships between active components, targets, and diseases in the form of an “Active Component–Target–Disease” network diagram. A network topology analysis was performed, and the network style was set based on node degrees. The importance of nodes in the network was reflected by their degree values: the higher the degree value, the larger the node and the darker its color.
2.5.5 PPI network construction and analysis
The intersecting targets were imported into the STRING (http://string-db.org) platform to construct a PPI network, with the organism set to Homo sapiens and a confidence score >0.7 (25). After removing isolated nodes, the network was imported into Cytoscape 3.9.1. Network topology analysis was performed using the CentiScape 2.2 plugin, and key targets were identified based on Degree, Betweenness Centrality (BC), and Closeness Centrality (CC) thresholds.
2.5.6 GO and KEGG enrichment analyses
The intersecting targets were imported into the DAVID (https://davidbioinformatics.nih.gov/) database for GO and KEGG pathway enrichment analyses, with the species set to Homo sapiens and a significance threshold of P < 0.01 (26). The top 20 entries were selected and visualized as bar and bubble charts using the WeBioinformatics (http://www.bioinformatics.com.cn/) platform, and the results were analyzed (27).
2.5.7 Molecular docking
Obtain the SDF files of the 2D structures of the screened core components from the PubChem database, then import the SDF files into Chem3D software for energy optimization and conversion into 3D structures; Download the 3D structures of key targets from the PDB database, perform molecular docking using AutoDock software and related plugins, and plot the results using PyMOL software.
2.6 Pharmacological study of CEHG on carbon tetrachloride-induced liver injury in rats
2.6.1 Animal grouping and modeling
After 7 days of adaptive feeding in an SPF-grade environment (temperature 23 °C ± 2 °C, 12 h light-dark cycle), 60 rats were randomly divided into 6 groups (10 rats per group). The doses were determined based on the conversion of the human body surface to the rat body area, with low, medium, and high doses set at 5, 10, and 20-fold the human recommended dose, respectively. Carbon tetrachloride (CCl4) (160 mg/kg·BW, dissolved in olive oil) was administered by gavage. Silymarin served as a positive control drug. The experimental groups were as follows: control group (A), model group (B), low-dose group (2.7 g/kg) (C), medium-dose group (5.4 g/kg) (D), high-dose group (10.8 g/kg) (E), and silymarin group (1 g/kg) (F).
The test groups received the samples by gavage daily, whereas the control group and the model group received distilled water. The rats were weighed twice a week to adjust the dose. On day 30, after 16 h of fasting, the model group and the test groups received a single gavage of CCl4, the control group received olive oil, and the test groups continued their respective treatments until the end of the experiment (with a 4-h interval after the gavage with CCl4). Twenty-four hours after CCl4 administration, rats were anesthetized with 20% urethane (0.5 mL/100 g), blood was collected for serum separation, and the rats were euthanized by cervical dislocation before the livers were harvested for further analysis.
2.6.2 Pathological histological examination (HE) of the liver
Pathological examination of liver tissue was performed using HE staining of paraffin sections: Paraffin-embedded liver sections were dewaxed with xylene three times (15 min each), then sequentially hydrated with 100%, 95%, and 80% ethanol (5 min each); rinsed under running water until no alcohol remained and the sections were clean and transparent. Sampless were stained with hematoxylin for 3–5 min, rinsed with water, differentiated in 1% hydrochloric acid alcohol for several seconds, then rinsed with water again; treated with dilute lithium carbonate solution for 30 s to restore blue color, rinsed with water, dehydrated with 80% ethanol, and stained with alcohol-soluble eosin for 20 s. The sections were placed in 95% ethanol I and II for about 10 s each for color adjustment, dehydrated in anhydrous ethanol I and II for 1–2 min each, and finally cleared in xylene I and II for 1–2 min each, mounted, and observed under a microscope.
2.6.3 Determination of biochemical indicators in rat serum
Rat blood was collected and allowed to stand for 30 min to 1 h for coagulation. The blood was then centrifuged at 4,000 rpm for 10 min to separate the serum, and the supernatant was collected for analysis. Commercial kits were used to measure the levels of ALT, AST, TG, TC, LDH, TP, TBIL, TNF-α, IL-1β, and IL-6 in rat serum.
2.6.4 Determination of biochemical indicators in rat liver homogenate
Liver tissue was homogenized using PBS (0.01 M, pH 7.4). The homogenate was centrifuged at 10,000 rpm for 10 min at 4 °C and the supernatant was collected on ice. Commercial kits were used to measure the levels of SOD, MDA, GSH, and GSH-Px in the liver homogenate.
2.6.5 Detection of liver tissue ROS levels by flow cytometry
The tissue was homogenized using the homogenate solution according to the ROS kit instructions. After centrifugation, 200 μl of supernatant was retrieved, mixed with 2 μl of probe, and incubated at 37 °C for 30 min. During incubation, cells were mixed to ensure full probe binding. Part of the supernatant was used for protein content determination. After protein measurement, the sample was filtered through a 200-mesh filter and tested using a flow cytometer. The results were analyzed using NovoExpress software.
2.6.6 Detection of apoptotic cells in liver tissue by TUNEL assay
Liver tissue sections were dewaxed with xylene three times (15 min each), then sequentially hydrated with 100%, 95%, and 80% ethanol (5 min each); and rinsed under running water until clean and transparent. The sections were treated with 20 μg/ml proteinase K (without DNase) at 37 °C for 20 min, then washed with PBS three times. The TUNEL detection solution (50 μl; TdT enzyme + Biotin-dUTP=5 μl + 45 μl) was added to each sample, and incubated at 37 °C for 60 min. After washing with PBS three times, 100 μl of reaction termination solution was added and the samples were incubated at room temperature for 10 min. Following 3 washes with PBS, 100 μl of Streptavidin-HRP working solution (0.5 μl + 99.5 μl) was added and the samples were incubated at room temperature for 30 min. After the final three washes with PBS, color was developed using DAB at room temperature for 8 min and the sections were rinsed three times with PBS, counterstained with hematoxylin, to differentiate and restore blue color. Finally, the sections were dehydrated and cleared, mounted with neutral gum, and observed under a microscope.
2.6.7 Detection of apoptotic cells by flow cytometry
Liver tissue samples were ground on ice, centrifuged at 3,000 rpm for 3 min at 4 °C, and the supernatant was collected. Cells were collected at a density of 1–2 × 10⁶ cells, centrifuged at 1,500 rpm for 3 min, and the supernatant was discarded. The cell suspension was then mixed with 2.5 μl of Annexin V-FITC Reagent and 2.5 μl of PI Reagent (50 μg/ml). After gentle vortexing, the mixture was incubated at room temperature in the dark for 15–20 min. Next, 400 μl of diluted 1 × Annexin V Binding Buffer was added and thoroughly mixed. The sample was filtered through a 200-mesh filter and analyzed using a flow cytometer. The flow cytometry images of the apoptotic cells were analyzed using NovoExpress software.
2.6.8 RT-qPCR detection of P53, Bax, Bcl-2, and HIF-1α mRNA expression
Liver tissue processing: 50–100 mg of liver tissue was ground to powder in liquid nitrogen, and 1 mL of TRIzol was added to lyse the cells. After the addition of 0.2 ml of chloroform, the samples were vortexed for 15 s, and incubated on ice for 5 min; and centrifuged at 12,000 rpm for 10 min at 4 °C.
RNA extraction and cDNA synthesis: the supernatant was collected and the RNA was precipitated with isopropanol. The precipitate was washed with 75% ethanol before resuspending in 20–50 μl of DEPC-treated water. RNA was reverse-transcribed into cDNA using one-step first-strand synthesis.
Gene expression: The reaction system contained 10 μl of Taq SYBR Green qPCR Premix (Universal), 0.4 μl each of forward/reverse primers (10 μm), 3 μl of cDNA, and 6.2 μl of RNase-free water, with a total volume of 20 μl. The cycling conditions were as follows: pre-denaturation at 95 °C for 30 s; 40 cycles (95 °C for 15 s, 60 °C for 30 s). Relative quantification was performed using the 2−ΔΔCt method, and primer sequences are listed in Table 4.
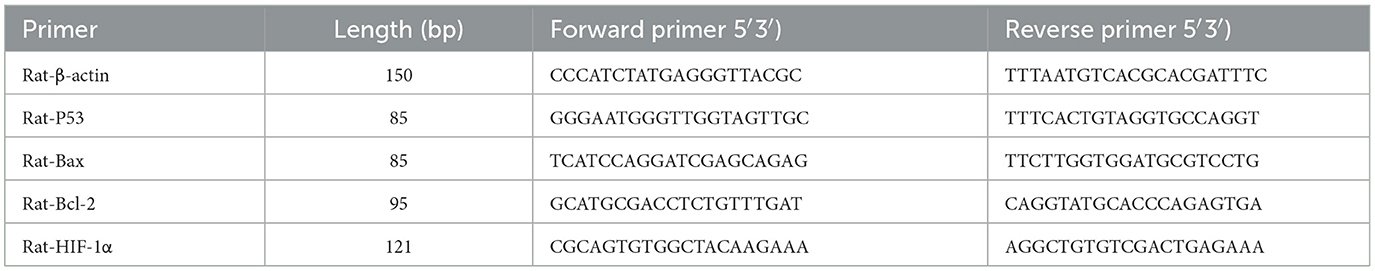
Table 4. PCR primer sequences.
2.6.9 Western blot (WB) analysis of protein expression of p53, Bax, Bcl-2, and HIF-1α
Liver tissue samples of 50–100 mg were homogenized in RIPA lysis buffer (containing 1 mM PMSF) at a 1:100 ratio and incubated on ice for 30 min. Samples were centrifuge at 12,000 rpm for 15 min at 4 °C to collect the supernatant as total protein. Protein concentration was determined using the BCA assay kit according to the instructions. 5 × SDS-PAGE loading buffer was added to protein samples at a 1:4 ratio. Samples were heated in boiling water for 10 min to denature the proteins and then loaded onto a 10% SDS-PAGE gel for electrophoresis for 1 h. The proteins were transferred to a PVDF membrane. The membrane was blocked with 5% skim milk for 2 h, and after discarding the blocking solution, the membranes were washed with TBST. Ther membrane was incubated overnight at 4 °C with primary antibodies diluted as follows: p53 (1:1,000), Bax (1:1,000), Bcl-2 (1:1,000), HIF-1α (1:500), and β-actin (1:1,000). After washing, the secondary antibody (1:10,000) was incubated for 2 h. Proteins were detected using an ECL hypersensitive luminescent reagent kit and the grayscale values of the bands were analyzed with ImageJ software. The relative protein expression levels were determined based on by the grayscale densitometric values of β-actin bands.
2.7 Statistical analysis
The experimental data were analyzed using GraphPad Prism v.9.4.1. Data are presented as mean ± standard deviation (x ± s). For comparisons involving multiple groups, one-way analysis of variance (ANOVA) was used. If homogeneity of variances was confirmed, LSD tests were applied for pairwise comparisons. If the variances were heterogeneous, Dunnett-t tests were used instead. A P-value < 0.05 was considered statistically significant.
3 Results
3.1 Optimization of the extraction process based on orthogonal experiments and the AHP-entropy method
3.1.1 Optimization of the extraction process
The dry extract ratio and the contents of albiflorin, paeoniflorin, liquiritin, glycyrrhizic acid, and ganoderic acid A in the extract were determined, with the results presented in Table 5 and Figure 1.
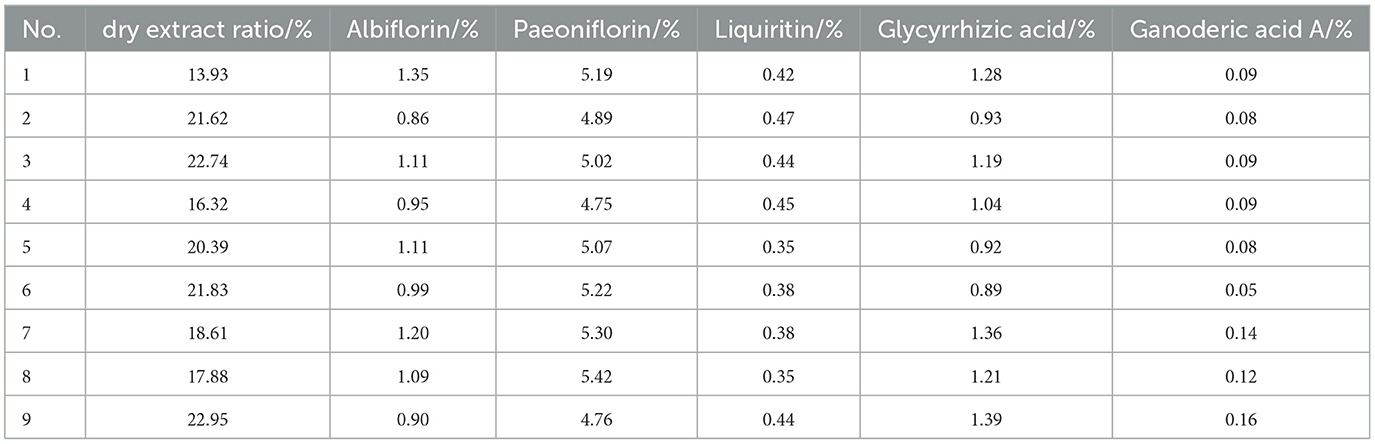
Table 5. Orthogonal experiment results.
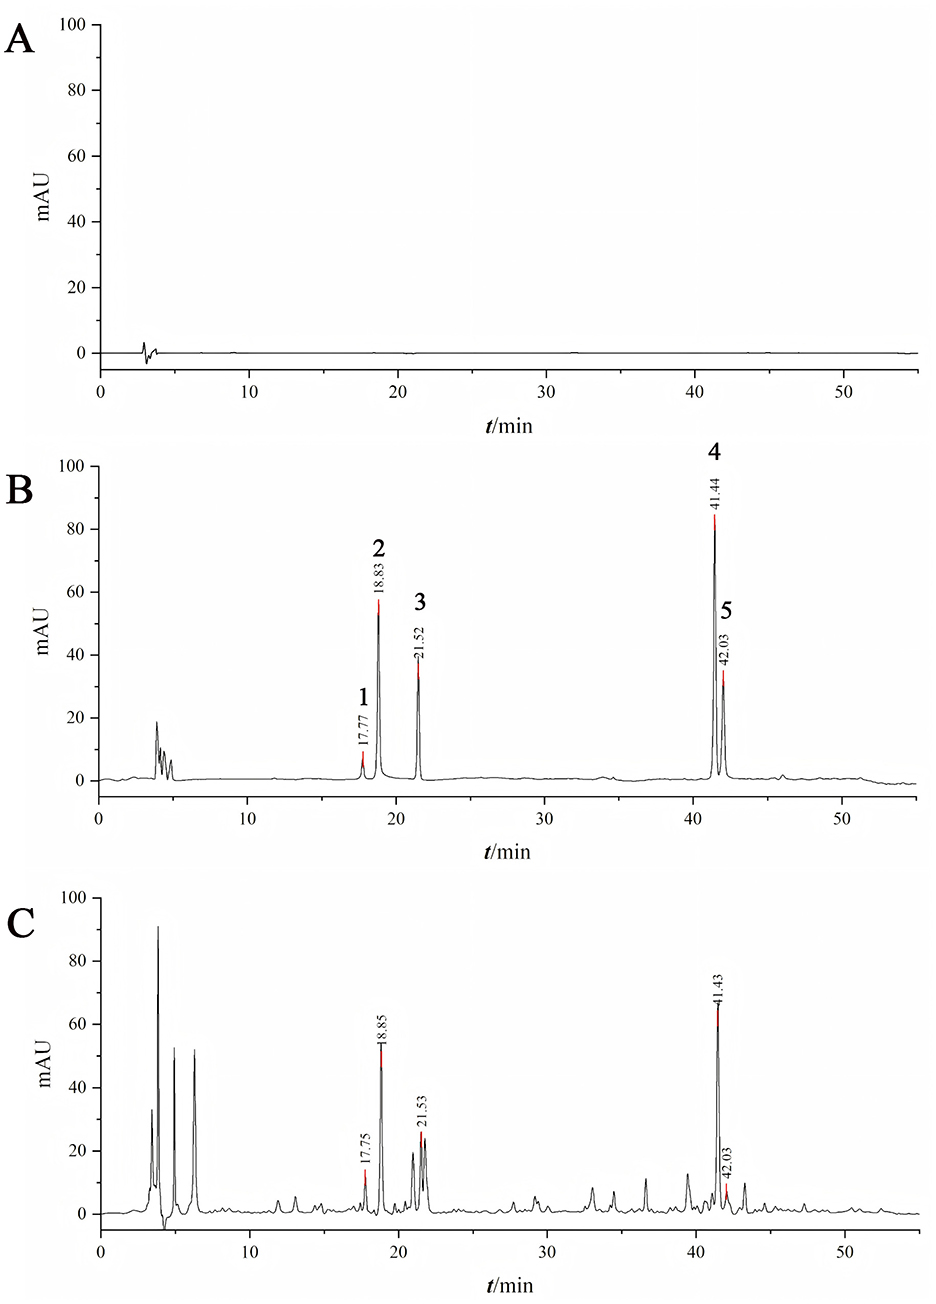
Figure 1. Determination of active ingredient content by HPLC. [A: 80% methanol; B: Mixed reference standards (1: paeoniflorin, 2: paeonolide, 3: liquiritin, 4: ammonium glycyrrhizinate, 5: ganoderic acid A); C: Test sample].
The subjective weight coefficients based on AHP, the objective weight coefficients based on entropy, and the combined weight coefficients for the ratio of paeoniflorin, albiflorin, glycyrrhizic acid, liquiritin, ganoderic acid A and dry extract are shown in Table 6.
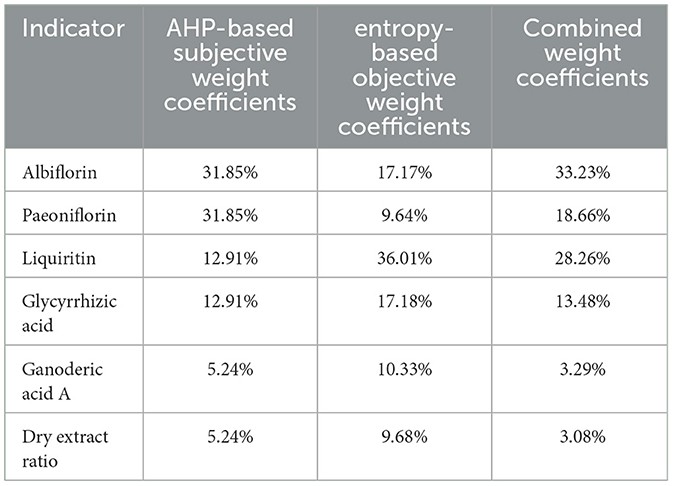
Table 6. Weight coefficients.
After standardization of orthogonal experimental data, the significance of the influence of factors on the results was determined through a range and variance analysis. The intuitive analysis of the R range showed that the primary and secondary factors that affected the comprehensive extraction score were A > C > B (the solid-liquid ratio had the greatest influence, followed by the extraction time, and finally the extraction times). As shown in Tables 7A–C all had significant effects on the complete score (P < 0.05). The optimal scheme was A3B1C1 (water addition ratio 1:20, extracted once, 1 h each time). The results of the range analysis and variance analysis are shown in Tables 7, 8, respectively.
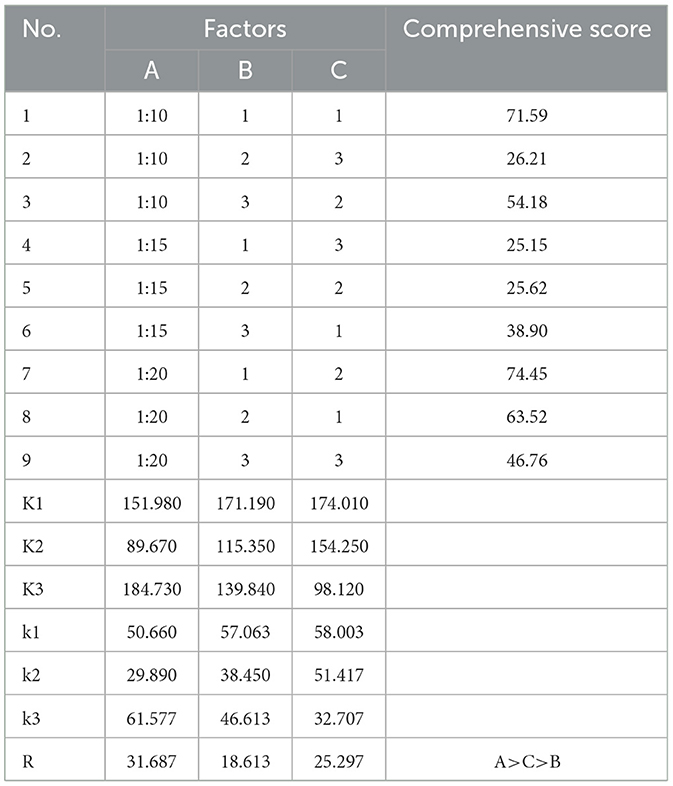
Table 7. Comprehensive scoring results of the orthogonal test table.
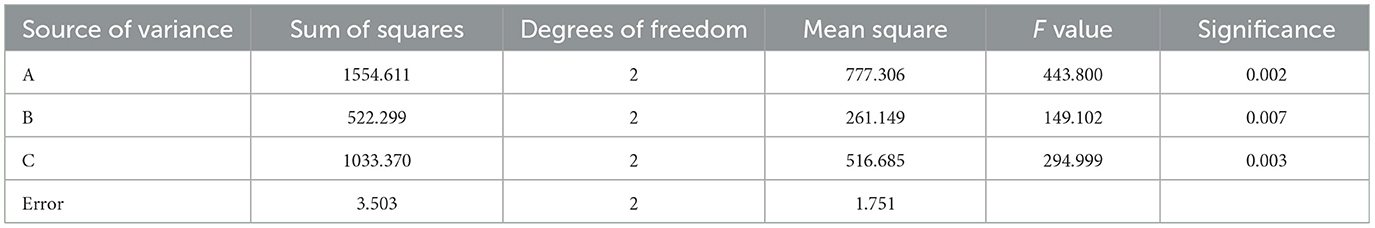
Table 8. ANOVA of orthogonal experiment.
3.1.2 Investigation of precision, repeatability and stability
For the five components (paeoniflorin lactone, paeoniflorin, liquiritin, ammonium glycyrrhizinate, and ganoderic acid A), in the precision investigation, the peak area RSD% values were all in the range of 0.30%−1.63% (all < 2%), and the retention time RSD% values were all in the range of 0.01%−0.09% (all < 0.10%), indicating good precision of the instrument; in the repeatability investigation, the peak area RSD% values were all in the range of 0.24%−1.24% (all < 2%), and the retention time RSD% values were all in the range of 0.03%−0.11% (all < 0.20%), indicating good repeatability of the method; in the stability investigation, within 24 h, the peak area RSD% values were all in the range of 0.67%−1.71% (all < 2%), and the retention time RSD% values were all in the range of 0.02%−0.30% (all < 0.30%), indicating good stability of the test sample within 24 h.
3.1.3 Validation of the extraction process
The results of the validation testing are presented in Table 9. Three batches of parallel tests showed similar index component content and dry extract rates, with RSD values below 5%. This indicated that the extraction process was stable and feasible, with excellent reproducibility.
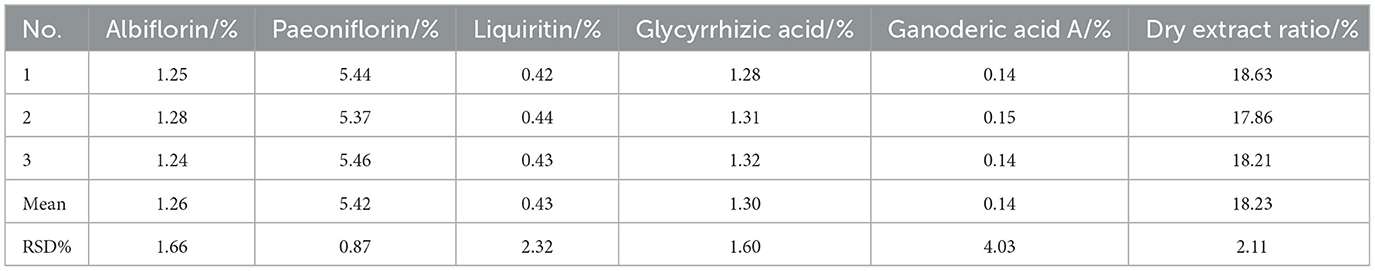
Table 9. Validation experiment results.
3.1.4 Optimization of the molding process
The results and analysis of the Box–Behnken experiment are shown in Tables 10, 11. The Box–Behnken experiment yielded a second order polynomial regression equation for the molding rate Y = 84.03 – 0.94a – 10.26b + 1.83c – 1.33ab + 0.098ac + 2.13bc – 1.03a2 – 0.17b2 – 1.85c2. As shown in the table below, the model's F value was 67.36 and P < 0.05, indicating that the model terms were statistically significant. The lack of fit item had a P-value > 0.05, indicating a good fit of the regression equation. R2 = 0.9886 and Radj2 = 0.9739, which indicated that the model had a good fit. Independent variables effectively explained the changes in the response variable. The similar R2 and Radj2 values suggested that the independent variables introduced were valid. Based on the F value, the significant effects on the formation rate were in the order of b > c > a. In the regression model, the linear terms b and c, the quadratic term c2, and the interaction term bc were significant, whereas the linear term a, the quadratic terms a2 and b2, and the interaction terms ab and ac were not significant. The optimized forming process parameters were as follows: 11 parts of diluent, 12% binder, and 80% ethanol volume fraction.
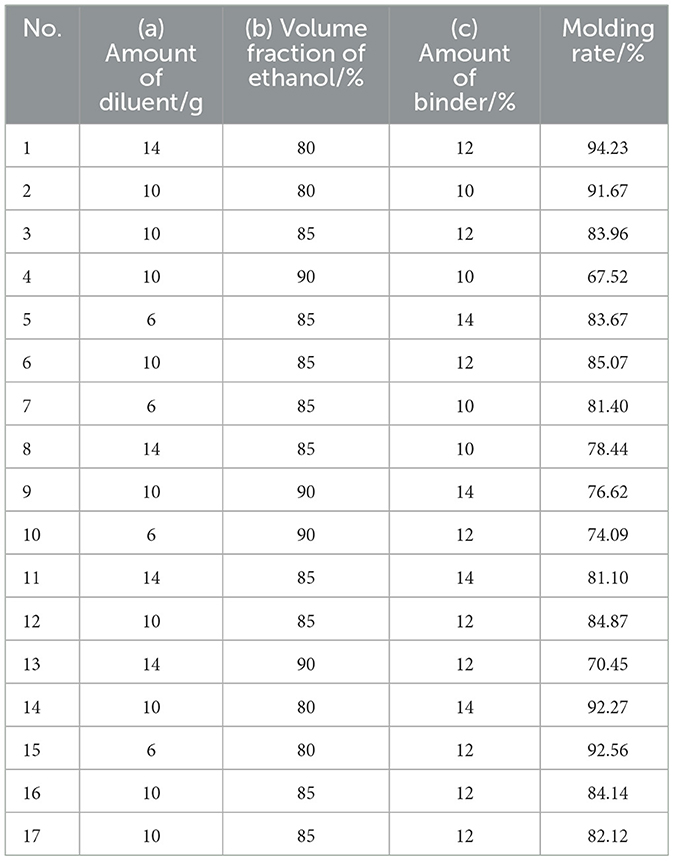
Table 10. Factors and levels table of box—Behnken experimental design.
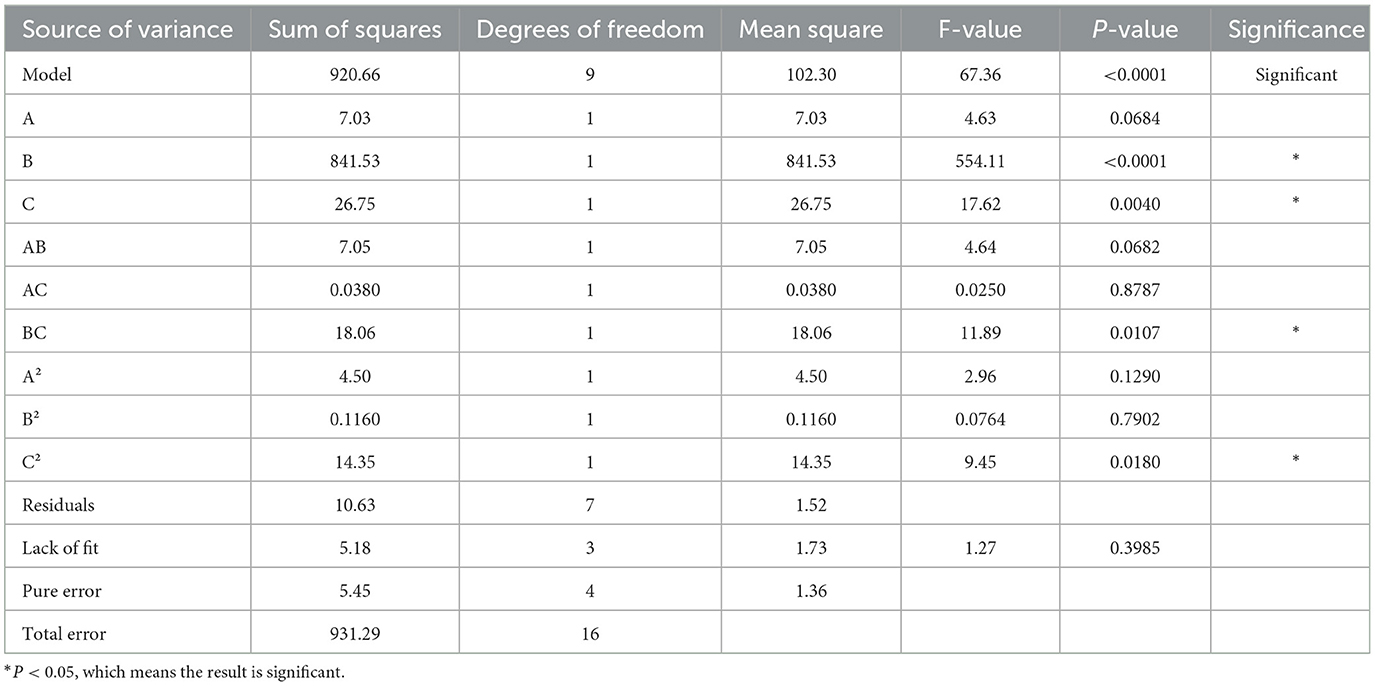
Table 11. Analysis of variance of molding rate.
3.1.5 Validation and testing of the optimal molding process of granule quality
Three tests showed a particle formation rate of 95.42%, 96.33%, and 94.76%. The moisture of the CEHG was 5.44%, below 8%. The dissolving time was within 5 min, meeting the Chinese Pharmacopeia requirements. With a resting angle of < 40°, the flow ability of the particles satisfied basic production needs.
3.2 Results of the network pharmacology study on CEHG
A total of 121 bioactive components were identified. After importing into the PharmMapper database for summarization, screening, and deduplication, 1,486 potential targets were identified. Through the GeneCards database, 2,764 targets related to “liver injury” were retrieved. The intersection of the active component target and the liver injury disease target, displayed by a Venny diagram, showed 199 overlapping targets (Figure 2a). The active component-target-disease network diagram revealed key components such as palmitic acid ergosta-7,22-diene-3β-ol ester, pentadecanoic acid ergosta-7,22-diene-3β-ol ester, and paeoniflorin, as well as key targets, including F2, PRPS1 and SDHA (Figure 2b). Based on Degree Centrality (DC), Betweenness Centrality (BC), and Closeness Centrality (CC) thresholds, the analysis of the PPI network identified key nodes such as CTNNB1, ALB, and EP300 (Figures 2c, d). GO enrichment analysis yielded 653 entries (P < 0.01), including 445 in BP, 73 in CC, and 135 in MF, with the top 20 entries selected (Figures 3a–c). KEGG pathway enrichment analysis identified 114 signaling pathways (P < 0.01), and the top 20 were visualized, which involved signaling pathways such as HIF-1, p53, and FoxO (Figure 3d). Molecular docking was performed between three key components (paeoniflorin, ergosta-7,22-dien-3β-yl palmitate, and ergosta-7,22-dien-3β-yl pentadecanoate) and three key target proteins (ALB, EP300, and CTNNB1). The binding energy of each drug molecule to the corresponding protein was < -5 kJ·mol−1, indicating that relatively stable binding can be formed between the drug molecules and the proteins. These drug molecules have the potential to bind to the target proteins, possibly regulate their functions, and thereby exert therapeutic effects on diseases. The molecular docking results are shown in Figure 4.
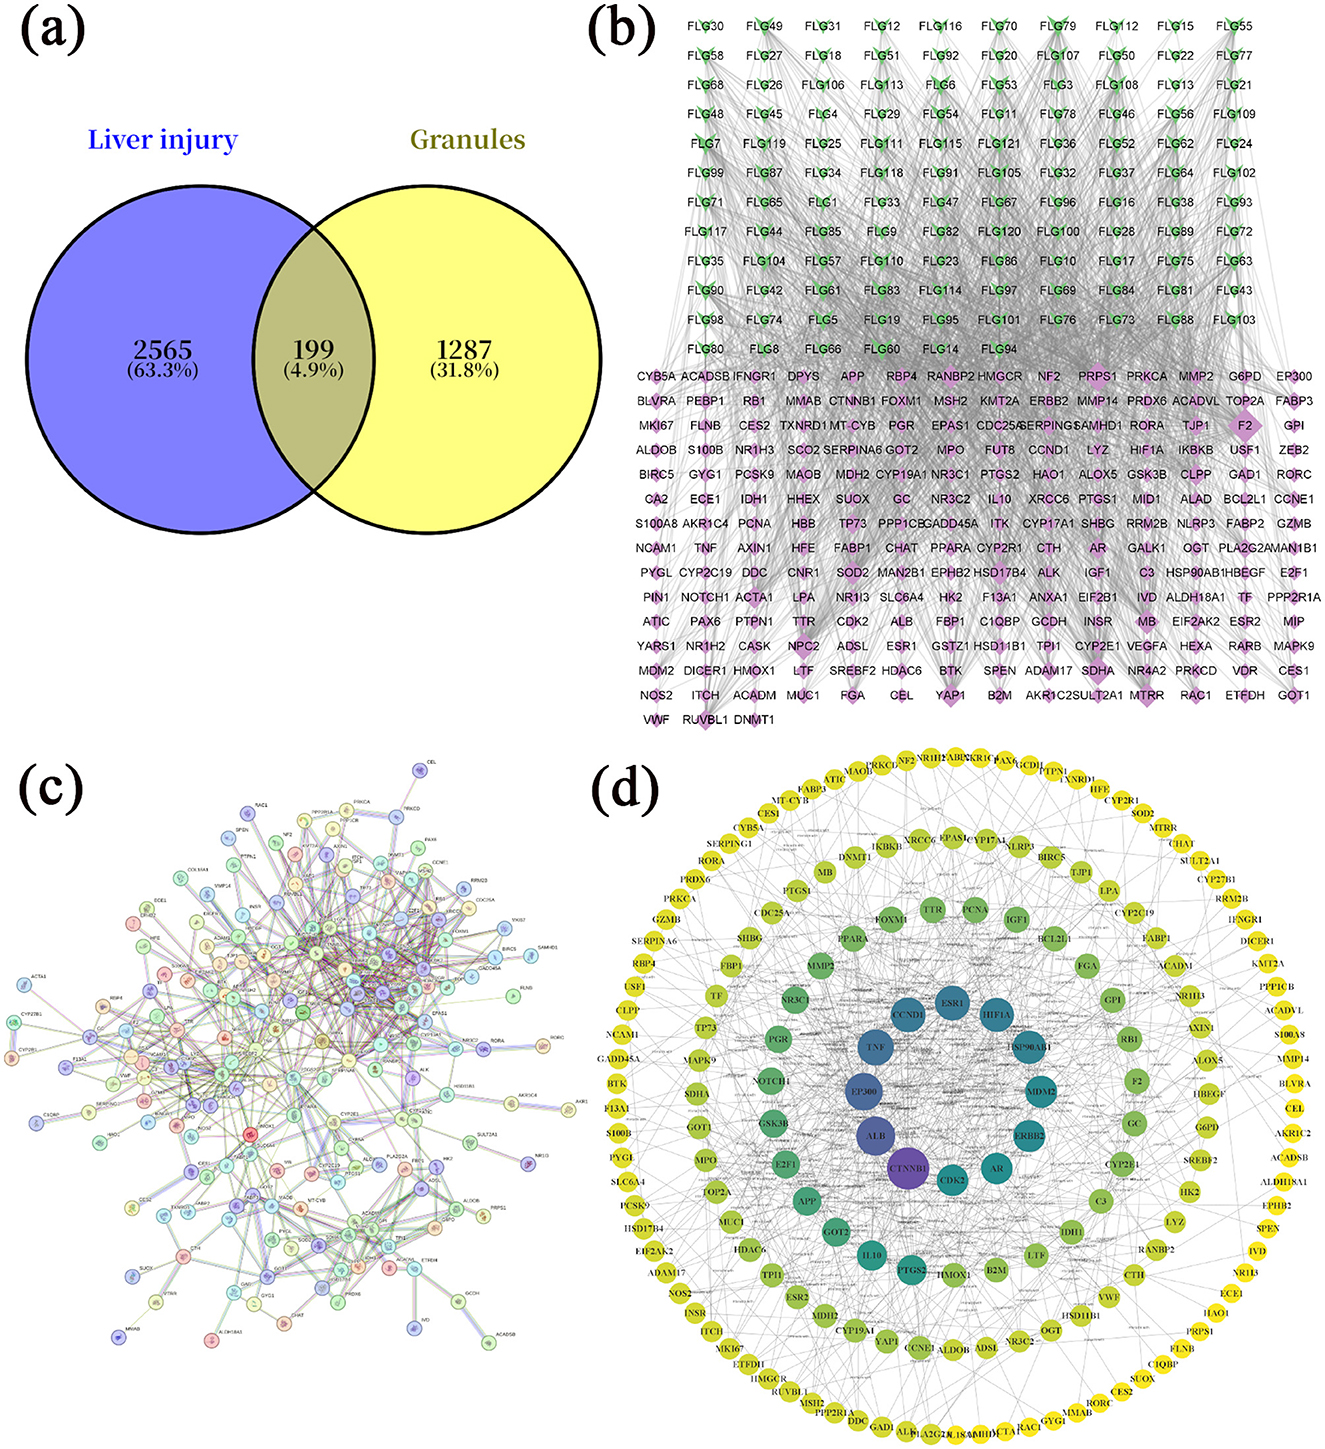
Figure 2. Network pharmacology study of compound liver-protecting effervescent granules (CEHG). (a) Intersection of active ingredients and target genes of liver injury; (b) network analysis of active ingredients-targets-diseases; (c) PPI network analysis an of potential targets for CEHG for the treatment of liver injury; (d) core targets map showing results of PPI network analysis of potential targets for CEHG.
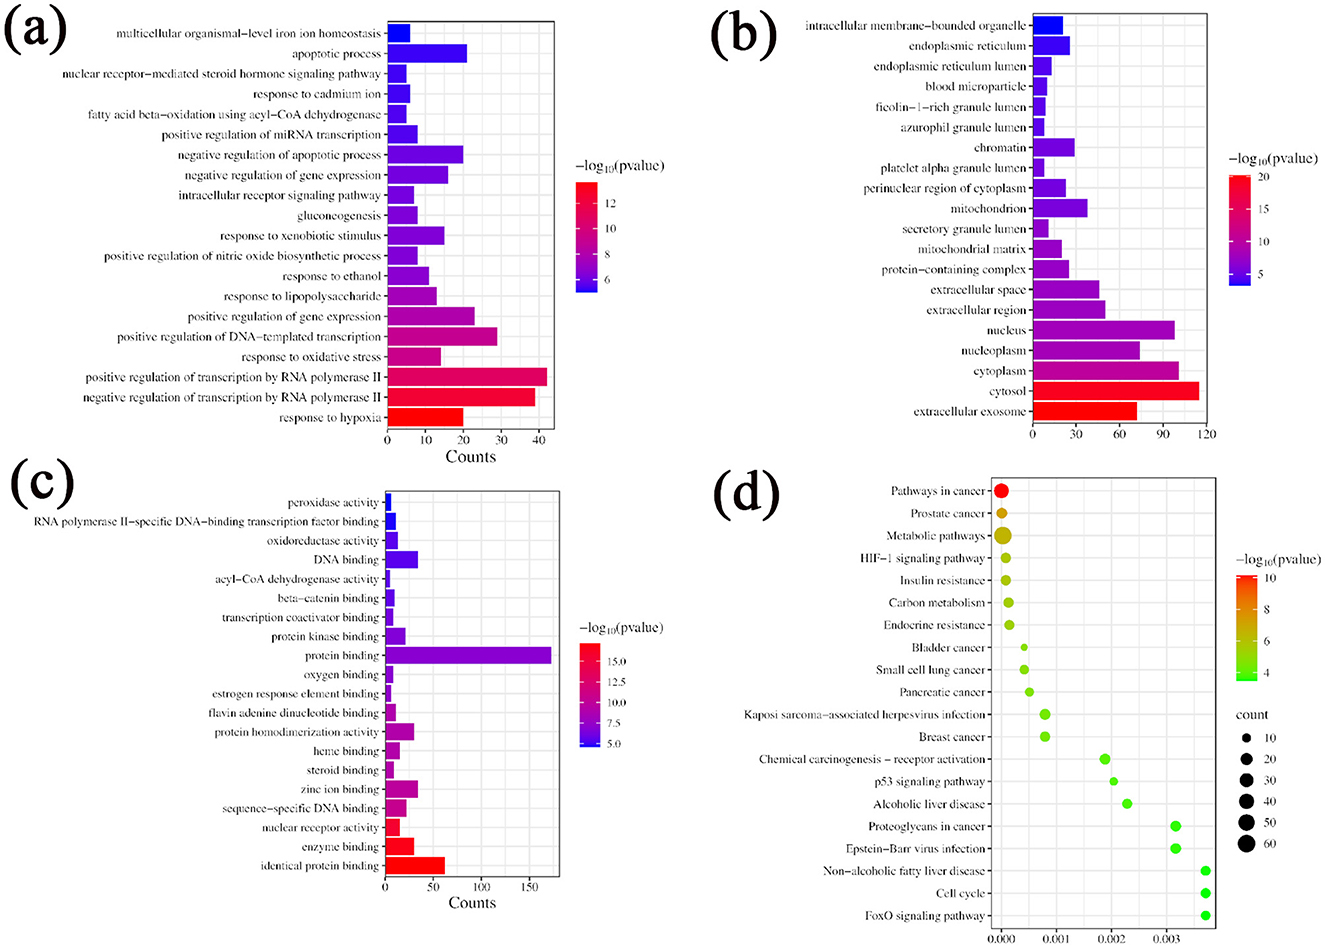
Figure 3. GO and KEGG enrichment analysis. (a) GO function enrichment map BP; (b) GO function enrichment map CC; (c) GO function enrichment map MF; (d) KEGG Enrichment Analysis.
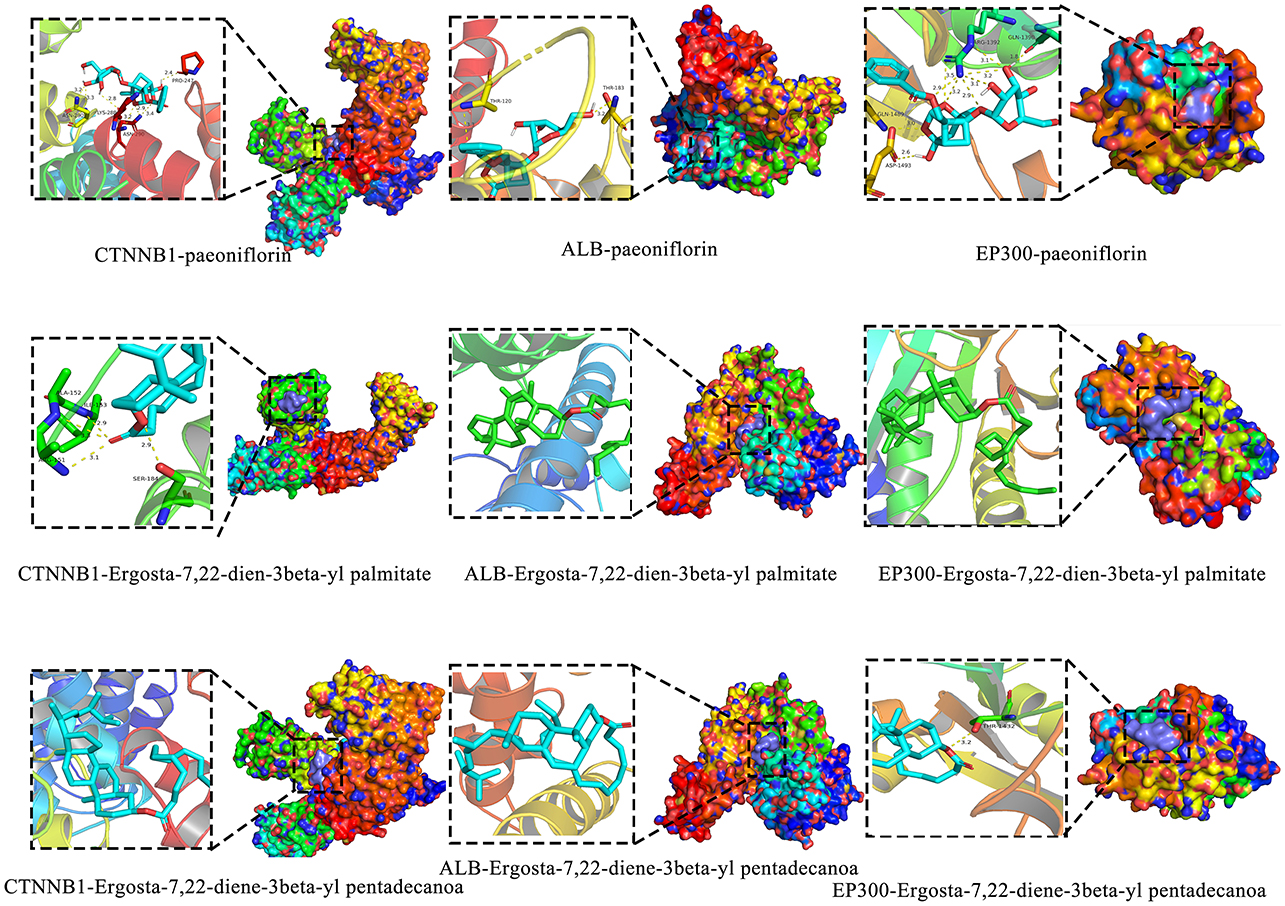
Figure 4. Molecular docking.
3.3 Pharmacological study of CEHG in the CCl4-induced acute liver injury rat model
3.3.1 Pathological changes induced by CEHG in rats with acute liver injury
HE staining showed that in the control group, rat liver cells were normal in size and shape, with large round nuclei and a clear structure. The hepatocyte cords were arranged radially around the central vein. In the model group of CCl4-induced acute liver injury, significant necrosis, steatosis, inflammatory infiltration, and hemorrhage was observed in liver tissue. As the dose of the granules increased, the liver damage eased and the morphology of the liver improved visibly. Silybin, a reference drug, also improved CCl4-induced liver injury, nearly restoring the tissue to its normal state (Figure 5).
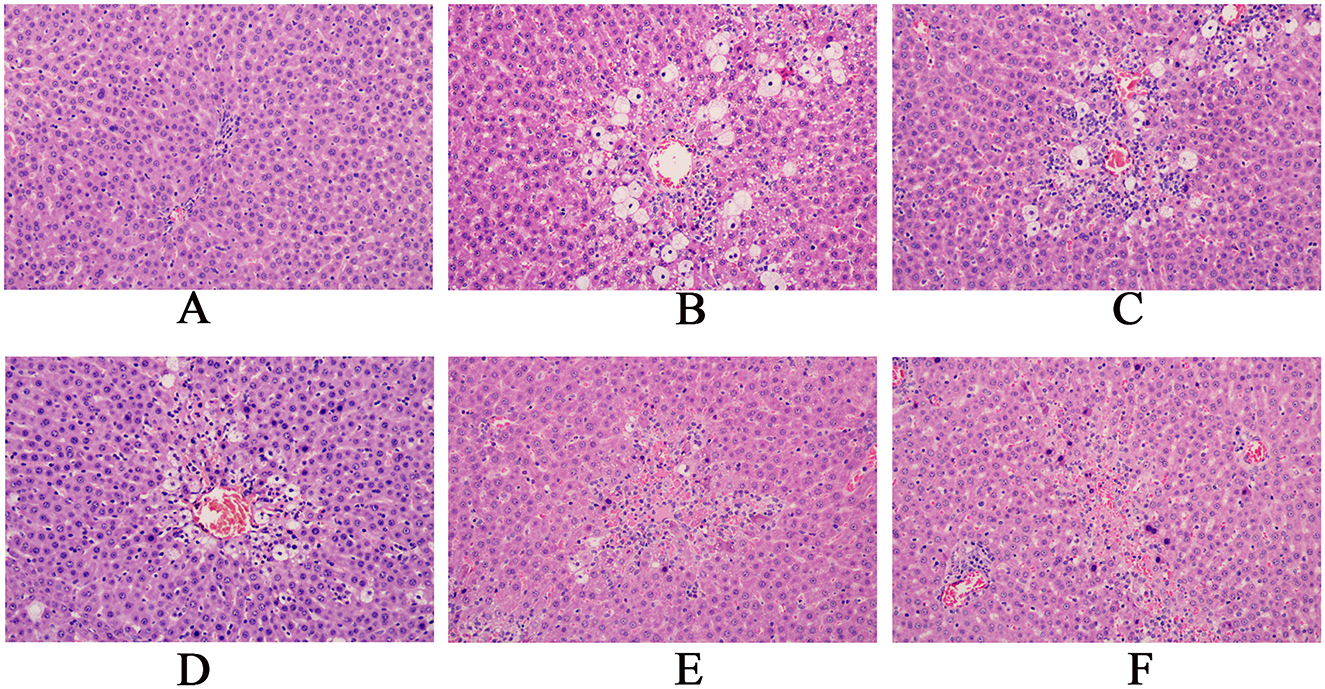
Figure 5. Pathological sections of the rat liver (magnification, x200).(A: Blank group; B: Model group; C: Compound Liver-Protecting Effervescent Granules low-dose group; D: Compound Liver-Protecting Effervescent Granules medium-dose group; E: Compound Liver-Protecting Effervescent Granules high-dose group; F: Silybin group).
3.3.2 Changes in AST, ALT, TC, TG, TP, TBIL, LDH, IL-6, IL-1β and TNF-α levels in rat serum
Compared with the control group, the model group showed significant increases in ALT and AST, indicating the successful establishment of liver injury models. Compared with the model group, the low, medium, and high dose groups had notable reductions in ALT and AST levels, demonstrating that the effervescent protective granules of compound liver could improve liver function indicators in rats with liver injury in a dose-dependent manner. The positive drug group also had much lower ALT and AST levels than the model group. Compared with the control group, the model group presented higher levels of TC, TG, TBIL, and LDH and significantly lower levels of TP. These changes confirmed the successful establishment of the liver injury model, reflecting lipid metabolic disorders, impaired hepatic synthetic function, and abnormal bilirubin metabolism due to liver injury. Compared with the model group, except for the low-dose group, which showed no significant changes in TP and LDH, all other dosing groups exhibited significantly reduced levels of TC, TG, TBIL, and LDH and significantly increased TP levels. After treatment, TC, TG, TBIL and LDH decreased with increasing doses, whereas TP increased with higher doses. Compared with the control group, the model group showed significantly increased levels of IL-6, IL-1β, and TNF-α. Compared with the model group, all treatment groups, except the low-dose group with non-significant changes in IL-6 levels, exhibited significantly reduced levels of IL-6, IL-1β, and TNF-α. Overall, the liver-protecting effervescent granules of the compound suppressed the release of IL-6, IL-1β, and TNF-α, thus alleviating the inflammatory response (Figure 6).
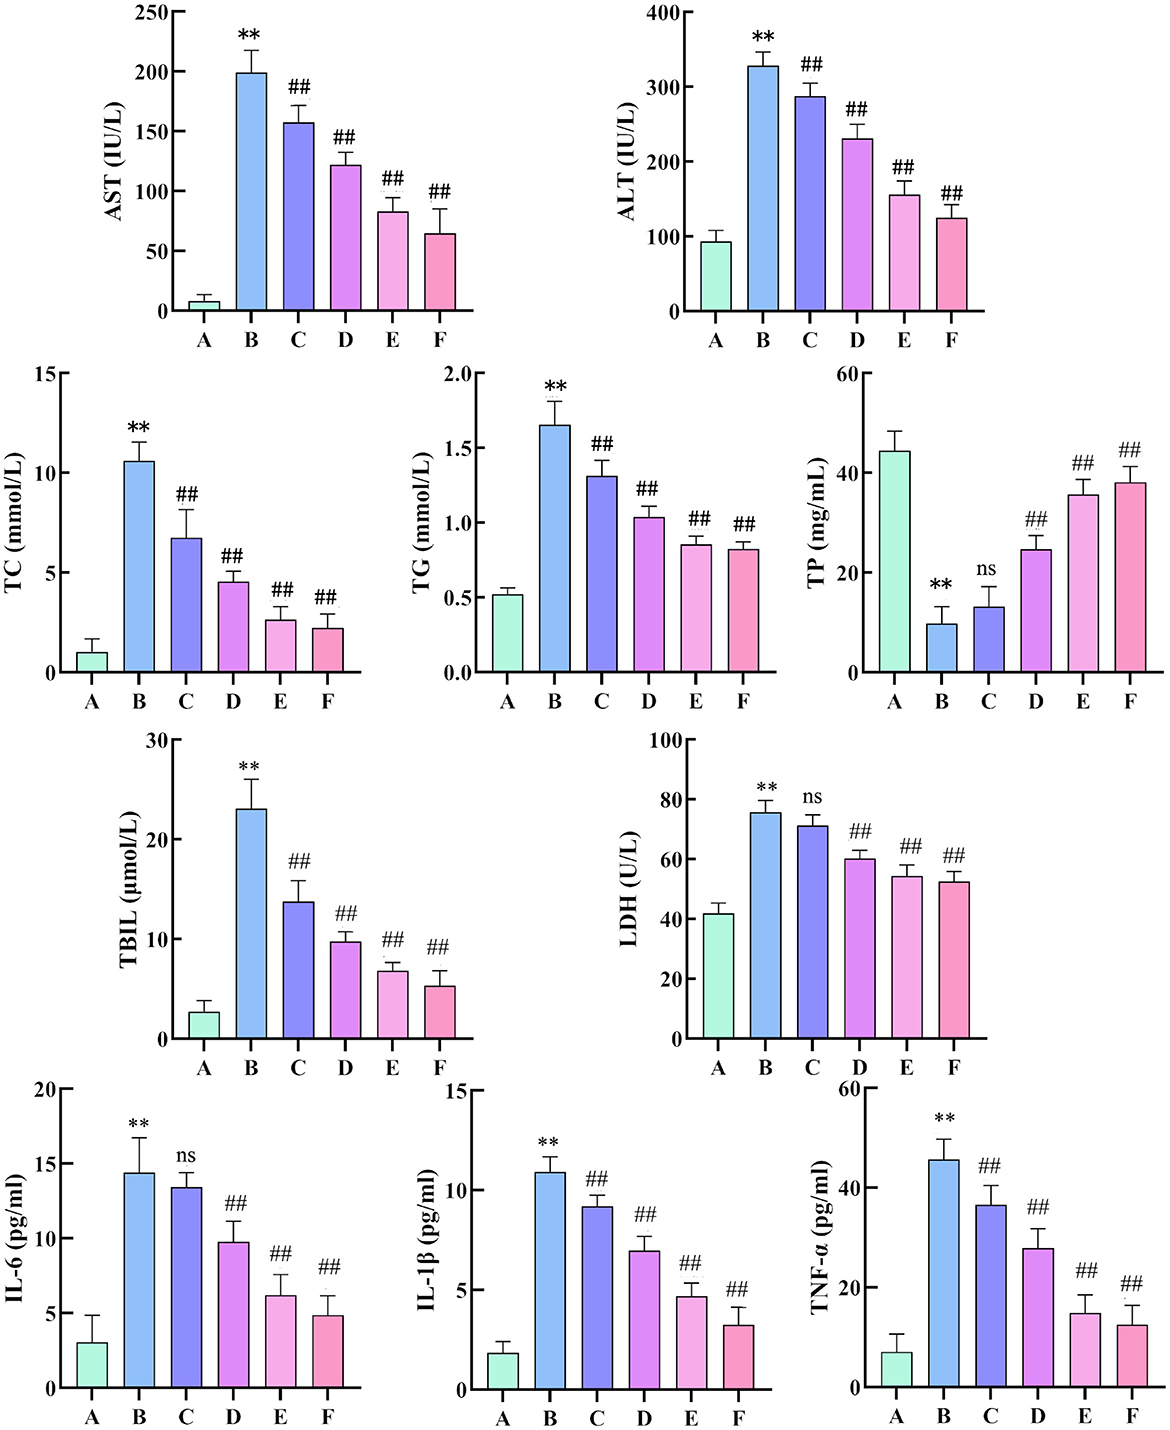
Figure 6. Changes in AST, ALT, TC, TG, TP, TBIL, LDH, IL-6, IL-1β and TNF-α levels in the serum of rats. (n = 8, compared with the control group, **P < 0.01, compared with the model group, ##P < 0.01). (A: Blank group; B: Model group; C: Compound Liver-Protecting Effervescent Granules low-dose group; D: Compound Liver-Protecting Effervescent Granules medium-dose group; E: Compound Liver-Protecting Effervescent Granules high-dose group; F: Silybin group).
3.3.3 Changes in the contents of SOD, MDA, GSH, GSH-Px and ROS in rat liver tissue
Compared with the control group, the model group showed significantly reduced SOD and GSH-Px activity, increased MDA levels, and decreased GSH levels. This indicates a weakening of hepatic antioxidant capacity, increased oxidative stress, and severe damage to stem cell membranes in the liver injury model. Compared with the model group, all treatment groups (except for GSH content without significant difference) showed significantly increased SOD and GSH-Px activity and significantly decreased MDA levels and increased GSH levels. Thus, CEHG can protect the liver by enhancing antioxidant capacity and reducing oxidative stress (Figure 7a). Compared with the control group, the model group showed a significant increase in ROS levels in rat liver tissue. Compared with the model group, all treatment groups had markedly lower ROS levels. This indicated that the liver-protecting effervescent granules of CEHG reduced ROS in liver tissue from rats with chemical-induced liver injury, thus decreasing damage due to oxidative stress (Figures 7b, c).
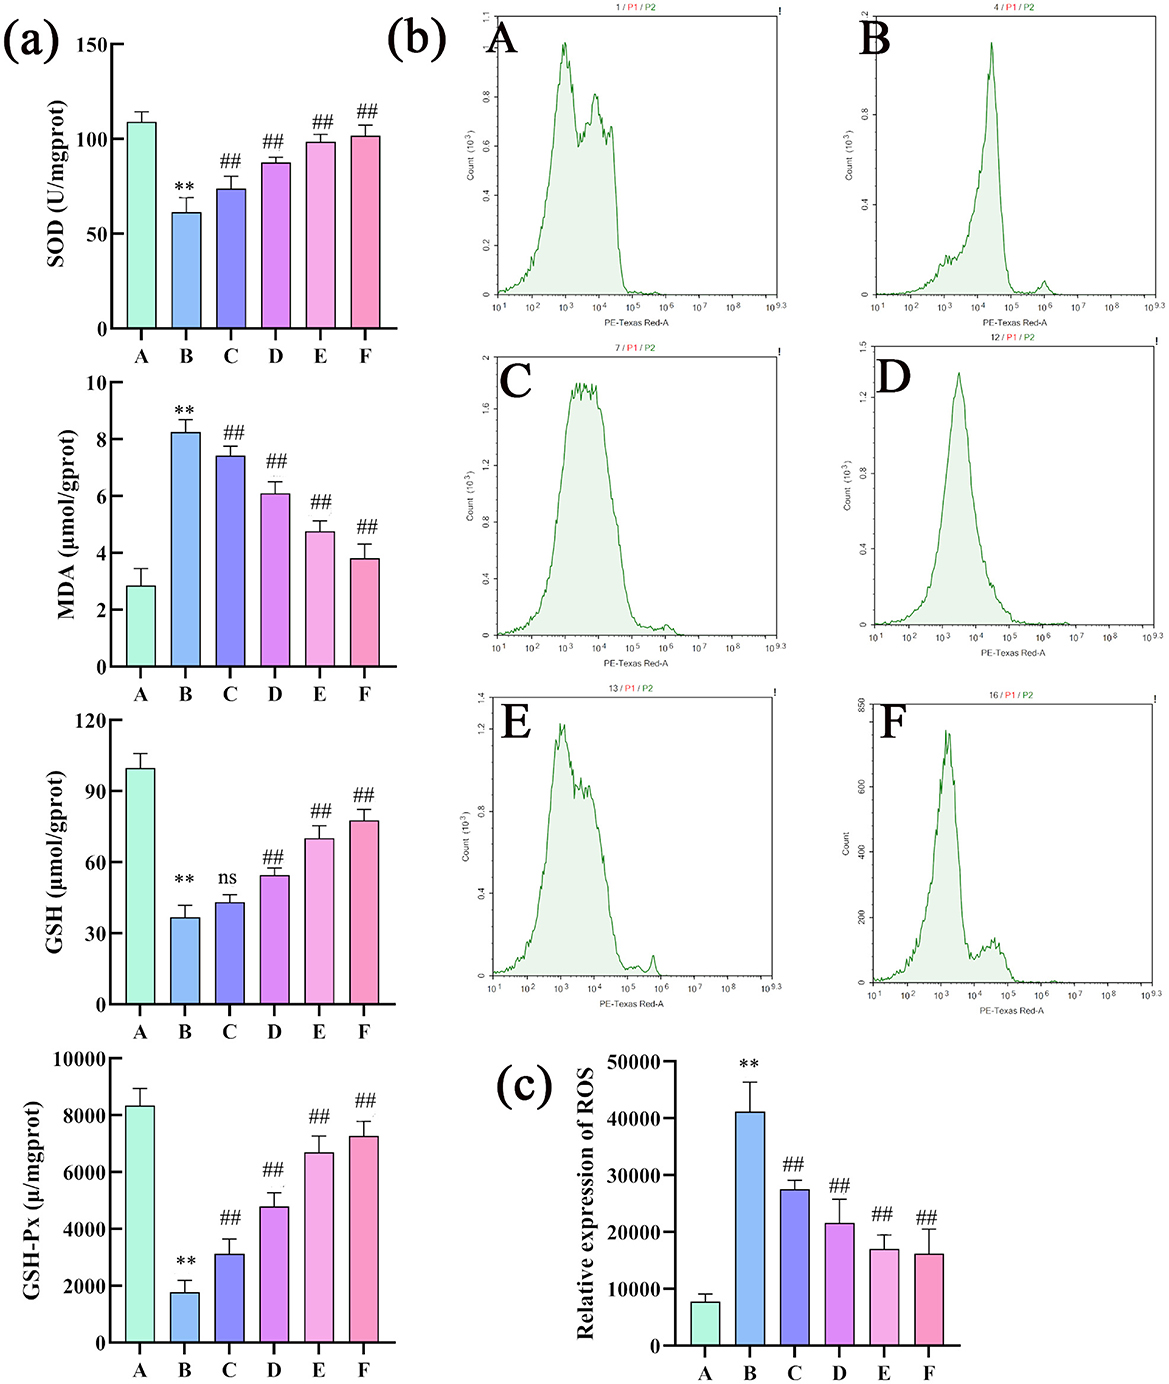
Figure 7. Changes in the SOD, MDA, GSH, GSH-Px, and ROS levels in rat liver tissue (n = 8; compared with the control group, **P < 0.01; compared with the model group, ##P < 0.01; ns indicates that comparisons were not significant. (a) Changes in the SOD, MDA, GSH and GSH-Px levels in rat liver tissues (n = 8; compared with the control group, **P < 0.01; compared with the model group, ##P < 0.01; ns indicates not significant); (b) changes in ROS levels in rat liver tissues; (c) quantitative analysis of ROS (n =3 compared with the control group; **P < 0.01, compared with the model group, ##P < 0.01; ns indicates not significant). Changes in the SOD, MDA, GSH, GSH-Px, and ROS levels in rat liver tissue (n = 8); compared with the control group, **P < 0.01; compared with the model group, ##P < 0.01; ns indicates that comparisons were not significant. (a) Changes in the SOD, MDA, GSH and GSH-Px levels in rat liver tissues (n = 8; compared with the control group, **P < 0.01; compared with the model group, ##P < 0.01; ns indicates not significant); (b) changes in ROS levels in rat liver tissues; (c) quantitative analysis of ROS (n = 3 compared with the control group; **P < 0.01, compared with the model group, ##P < 0.01; ns indicates not significant).
3.3.4 Analysis of cell apoptosis in rat liver tissue
The results of the TUNEL assay revealed a significantly higher positivity rate in the hepatocytes of the model group than in the control group, indicative of intensified apoptosis. Compared with the model group, the low dose group showed a decrease in positivity rate, albeit not significant, whereas other medicated groups presented markedly lower positivity rates, signaling a substantial reduction in hepatocyte apoptosis. Flow cytometry apoptosis images were analyzed using NovoExpress software as follows: quadrant 1: necrotic cells; quadrant 2: late apoptotic cells; quadrant 3: normal cells; quadrant 4: early apoptotic cells. The combined percentage of cells in quadrants 2 and 4 (late and early apoptotic cells) was calculated. The flow cytometry results showed a higher rate of apoptosis in the model group than in the control group (Figure 8). In contrast, the apoptosis rate was significantly lower in the treatment groups than in the model group, which was consistent with the findings of the TUNEL assay. Overall, these results demonstrate that CEHG can inhibit hepatocyte apoptosis in rats with liver injury, fulfilling their liver-protecting function.
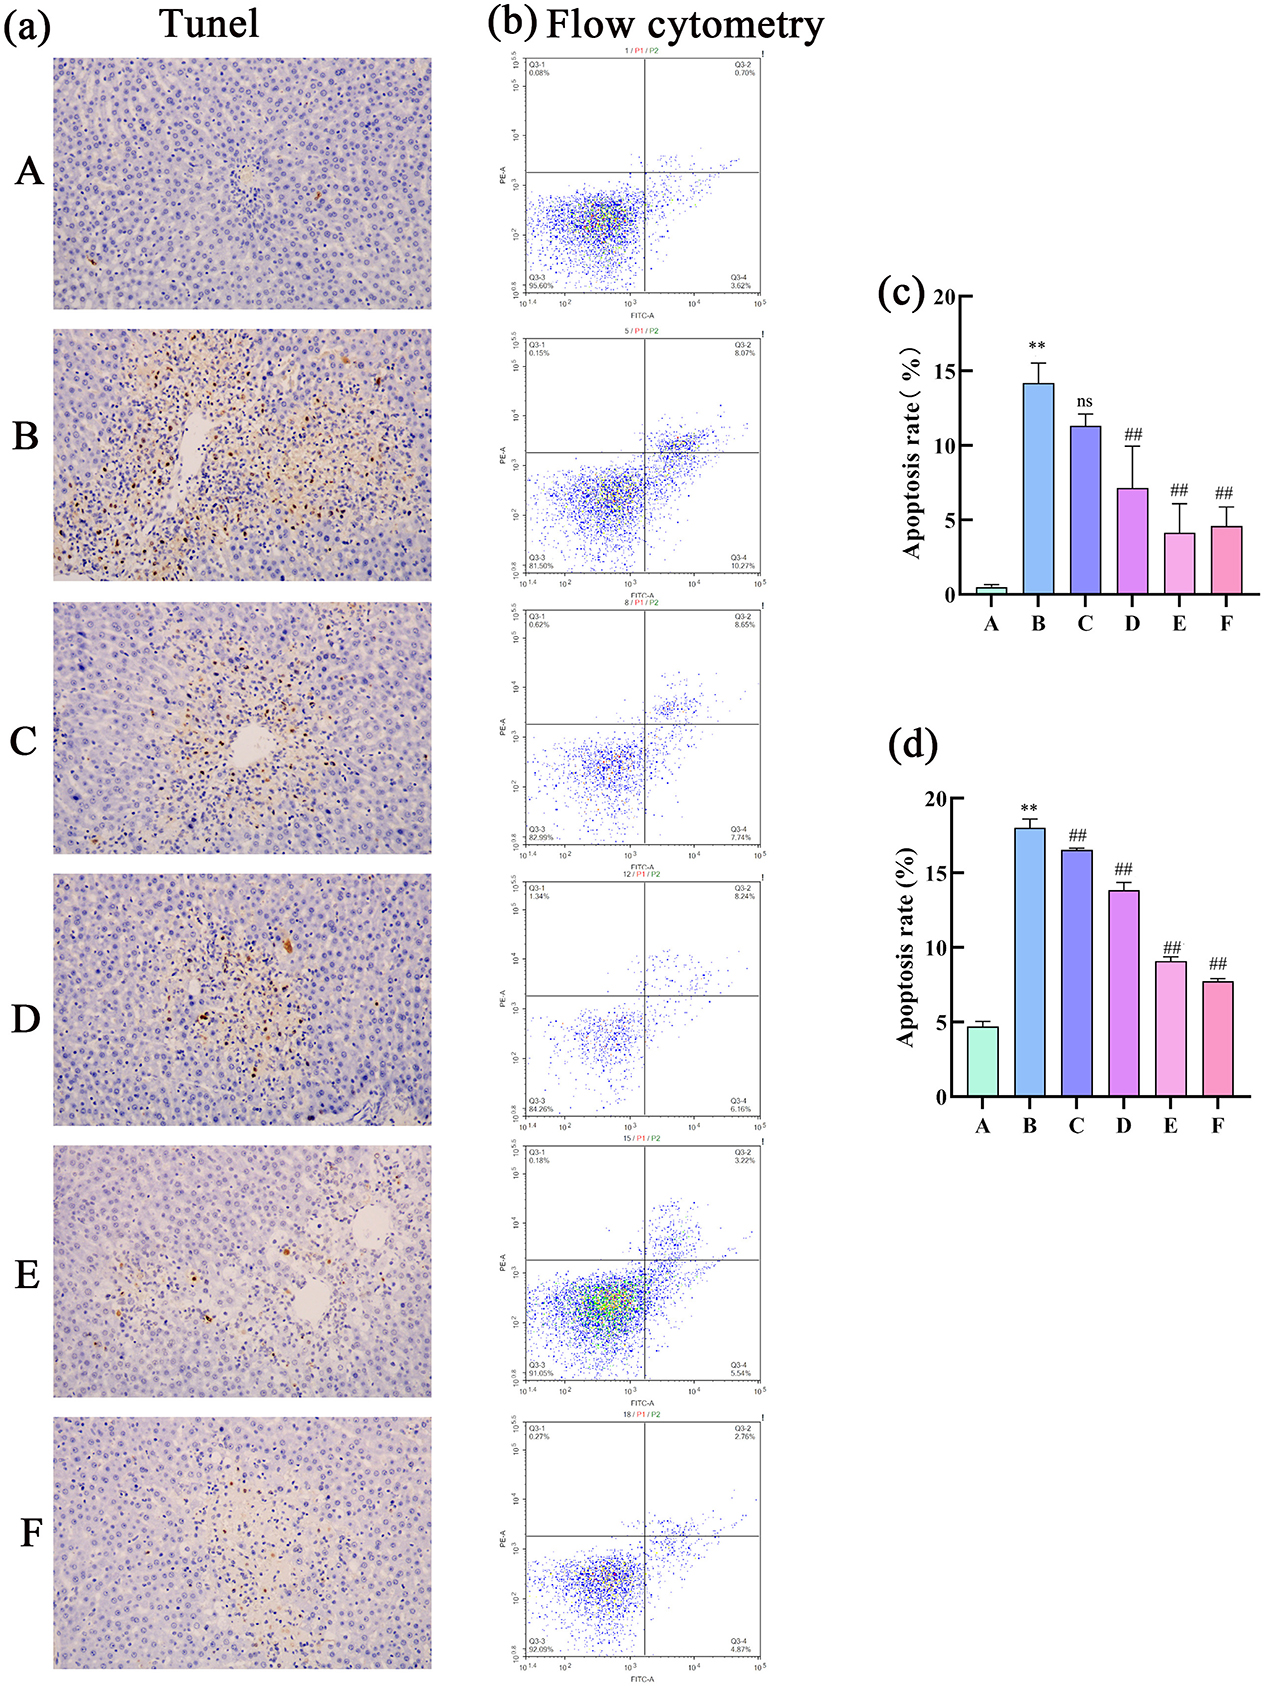
Figure 8. Analysis of cell apoptosis in rat liver tissue. (a) TUNEL assay; (b) flow cytometry detection of apoptotic cells; (c) TUNEL quantification of cell apoptosis (n = 3; compared with the control group, **P < 0.01; compared with the model group, ##P < 0.01; ns indicates not significant); (d) Flow cytometry analysis of apoptotic cells (n = 3; compared with the control group, **P < 0.01; compared with the model group, ##P < 0.01).
3.3.5 Effects of CEHG on mRNA and protein expression of P53, Bax, Bcl-2, and HIF-1α
The results of RT-qPCR showed that, compared with the control group, the model group had a significant higher mRNA expression of P53, Bax, and HIF-1α, and a lower expression of Bcl-2 mRNA. Compared with the model group, the treatment groups had a significant decrease in P53, Bax, and HIF-1α mRNA levels and increased Bcl-2 mRNA levels.
The WB results showed that, compared with the control group, the model group had significantly higher expression of P53, Bax and HIF-1α protein, and decreased expression of protein Bcl-2. Compared with the model group, the dosed groups had significantly lower protein levels of P53, Bax, and HIF-1α protein levels but higher Bcl-2 levels (Figure 9).
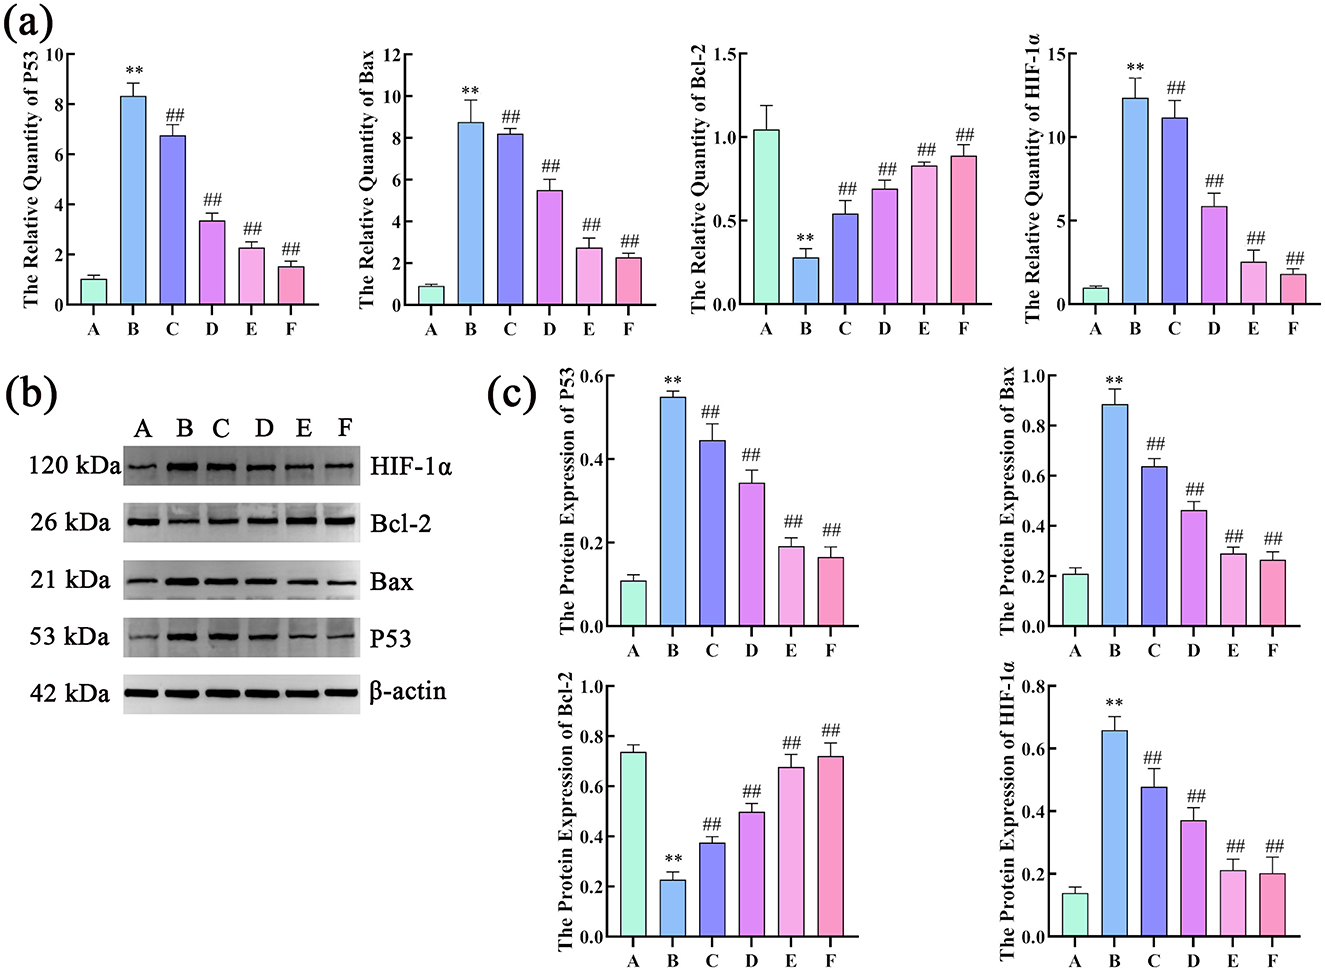
Figure 9. Effects of compound liver: protecting effervescent granules on P53, Bax, Bcl-2, and HIF-1α mRNA and protein expression levels. (a) Effects of CEHG on the expression of P53, Bax, Bcl-2, and HIF-1 mRNA α in rats with liver injury (n = 6, compared with the control group, **P < 0.01, compared with the model group, ##P < 0.01); (b) Gel electrophoresis images of P53, Bax, Bcl-2, and HIF-1α; (c) Quantification of gel electrophoresis of P53, Bax, Bcl-2, and HIF-1α Proteins (n = 3, compared with the control group, **P < 0.01, compared with the model group, ** P < 0.01).
4 Discussion
In this study, CEHG were developed using Ganoderma lucidum, Paeonia lactiflora, and Glycyrrhiza glabra as raw materials, with the aim of exploring their auxiliary protective effect against CLI. Based on TCM theory and modern pharmacological research, a multi-dimensional study was conducted to systematically optimize the preparation process and clarify the hepatoprotective mechanisms involved, providing a scientific basis for the development of functional hepatoprotective foods.
In the optimization of the extraction process, orthogonal experiments, characterized by advantages of reducing the number of experiments required, thus saving resources and time, combined with the determination of the contents of hepatoprotective active components via HPLC, laid the foundation for process screening. The AHP-entropy weight method (28), by integrating the subjective weights of AHP and the objective weights of the entropy method, balanced subjective and objective factors. The combination of the dry extract rate and active hepatoprotective components was used as the characterization index for the entire formula, and the generalized score was applied to more accurately reflect the extraction quality. Eventually, an optimal extraction process was determined as a material-to-liquid ratio of 1:20, with 1 extraction per 1 h. Verification experiments showed that this process was stable, feasible, and reproducible.
The Box–Behnken response surface method was adopted to optimize the granulation process (29). This efficient and flexible three-level experimental design, suitable for quadratic response surface models, enabled sufficient information to be obtained with fewer experiments. The results indicated that the interaction between ethanol volume fraction and binder dosage had a significant impact on granule formation. The optimized granulation parameters (11 parts of diluent, 12% binder, and 80% ethanol volume fraction) were verified to meet the requirements of the Chinese Pharmacopeia, suggesting that in actual production, strict control of the ethanol volume fraction and binder dosage was necessary to avoid quality fluctuations.
Network pharmacology studies provided theoretical clues for the hepatoprotective mechanism of the CEHG: 121 active components were subjected to target prediction and intersection analyses with liver injury disease targets, resulting in 199 overlapping targets involving key signaling pathways such as HIF-1 (30), p53 (31), and FoxO (32). Further analysis of the active component-target-disease network and PPI network identified core components including palmitic acid ergosta-7,22-diene-3β-ol ester and paeoniflorin, as well as key targets such as CTNNB1 and P53, suggesting that the granules may exert their effects through multiple components, multiple targets, and multiple pathways.
Animal experiments were used to verify the aforementioned mechanisms. In the CCl4-induced liver injury model, the granules dose-dependently reduced serum liver function indicators such as AST and ALT and improved pathological damage to liver tissue, indicating their ability to alleviate liver injury. Meanwhile, the granules significantly reduced serum levels of inflammatory factors, including IL-6, IL-1β, and TNF-α, suggesting that they exert protective effects by inhibiting inflammatory responses. In terms of oxidative stress (33), the granules increased the activities of SOD and GSH-Px, as well as the content of GSH in liver tissue, and reduced the levels of MDA and ROS, indicating their capacity to enhance antioxidant capacity and alleviate damage from oxidative stress. Cell apoptosis detection revealed that granules could reduce the proportion of apoptotic cells in liver tissue, down-regulate P53 and Bax mRNA and protein expression, and up-regulate Bcl-2 expression, suggesting that they inhibit excessive hepatocyte apoptosis by regulating apoptosis-related molecules. The down-regulation of HIF-1α indicated that the granules might improve the hypoxic state of the liver, further alleviating oxidative stress.
In summary, this study provided reliable parameters for the large-scale production of CEHG granules through process optimization. Combined network pharmacology and animal experiments revealed that granules exert hepatoprotective effects through multiple pathways such as anti-inflammation, anti-oxidation, inhibition of apoptosis, and regulation of HIF-1α expression, offering solid scientific support for their further development and clinical application. In future studies, we plan to conduct more in-depth research on the underlying mechanism and increase the number of experimental replicates for the preparation process. This optimization is intended to improve the reproducibility and reliability of the experimental results. Additionally, we will add comparative experiments between effervescent granules and traditional dosage forms in terms of bioavailability, therapeutic efficacy, and other aspects to verify the advantages of effervescent granules.
5 Conclusion
This study determined the parameters for the extraction and molding process of CEHG, a hepatoprotective functional food. CEHG improved liver pathology, function indices, oxidative stress, and cell apoptosis of rats with CCl4-induced acute liver injury and regulated P53, Bax, Bcl-2, and HIF-1α expression to exert hepatoprotective effects.
Data availability statement
The raw data supporting the conclusions of this article will be made available by the authors, without undue reservation.
Ethics statement
The animals were housed in an environment devoid of pathogens. The animal care and use methods were authorized by the Committee on the Ethics of Animal Experiments of Anhui University of Chinese Medicine (Permit Number: AHUCM-rats-2024049). According to the applicable norms and regulations, all techniques were executed. The investigation was conducted in accordance with the ARRIVE standards.
Author contributions
XL: Conceptualization, Data curation, Formal analysis, Investigation, Validation, Writing – original draft. RW: Conceptualization, Data curation, Formal analysis, Investigation, Visualization, Writing – original draft. YL: Investigation, Resources, Validation, Writing – original draft. JZ: Investigation, Software, Writing – original draft. JL: Data curation, Methodology, Writing – original draft. SL: Formal analysis, Writing – original draft. Methodology. QY: Data curation, Investigation, Writing – original draft. RC: Formal analysis, Writing – original draft. WW: Formal analysis, Writing – original draft. WL: Formal analysis, Writing – original draft. SB: Formal analysis, Writing – original draft. XD: Funding acquisition, Project administration, Supervision, Writing – review & editing. CP: Funding acquisition, Project administration, Supervision, Writing – review & editing.
Funding
The author(s) declare that financial support was received for the research and/or publication of this article. This research was supported by The Anhui Provincial Hygiene and Health Outstanding Talents Project (NO.ahsjhmypygc20230074), Anhui Provincial Health Research Key Project (Reference: AHWJ2022a013), Anhui Province Academic Leader Reserve Candidate Funding Project (No. 2022H287), Research Funds of Center for Xin'an Medicine and Modernization of Traditional Chinese Medicine of IHM (NO.2023CXMMTCM006), Anhui University Natural Science Foundation (NO.2023AH020035), Anhui Natural Science Foundation (NO.2408085J048), Key Science & Technology Project of Anhui Province (NO.202423I10050010), Traditional Chinese Medicine high-level key discipline construction project of National Administration of Traditional Chinese Medicine-Science of Chinese medicinal material resources (pharmaceutical botany) (NO. zyyzdxk-2023095), Anhui Universities Collaborative Innovation Project (NO.GXXT-2022-075, GXXT-2022-084).
Conflict of interest
The authors declare that the research was conducted in the absence of any commercial or financial relationships that could be construed as a potential conflict of interest.
Generative AI statement
The author(s) declare that no Gen AI was used in the creation of this manuscript.
Any alternative text (alt text) provided alongside figures in this article has been generated by Frontiers with the support of artificial intelligence and reasonable efforts have been made to ensure accuracy, including review by the authors wherever possible. If you identify any issues, please contact us.
Publisher's note
All claims expressed in this article are solely those of the authors and do not necessarily represent those of their affiliated organizations, or those of the publisher, the editors and the reviewers. Any product that may be evaluated in this article, or claim that may be made by its manufacturer, is not guaranteed or endorsed by the publisher.
Abbreviations
CEHG, compound ganoderma lucidum hepatoprotective effervescent granules; ALT, alanine transaminase; AST, aspartate transaminase; GSH, glutathione; NF-κB, nuclear factor-kappa B; Nrf2, nuclear factor erythroid 2-related factor 2.
References
1. Li X, Lao R, Lei J, Chen Y, Zhou Q, Wang T, et al. Natural products for acetaminophen-induced acute liver injury: a review. Molecules. (2023) 28:7901. doi: 10.3390/molecules28237901
2. Ding Y, Li X, Qi R, Su Y, Wang X. Chelerythrine-mediated targeting of NF-kB and Nrf2 pathways alleviates liver injury in a carbon tetrachloride-induced liver fibrosis mouse model. Histol Histopathol. (2025) 24:18892. doi: 10.14670/HH-18-892
3. Lai S, Ye Y, Ding Q, Hu X, Fu A, Wu L, et al. Thonningianin A ameliorates acetaminophen-induced liver injury by activating GPX4 and modulating endoplasmic reticulum stress. Front Pharmacol. (2025) 16:1531277. doi: 10.3389/fphar.2025.1531277
4. Zhang Y, Gong C, Tao L, Zhai J, Huang F, Zhang S. Involvement of SIRT1-mediated aging in liver diseases. Front Cell Dev Biol. (2025) 13:1548015. doi: 10.3389/fcell.2025.1548015
5. Li R, Wu H, Xu Y, Xu X, Xu Y, Huang H, et al. Underlying mechanisms and treatment of acetaminophen-induced liver injury (review). Mol Med Rep. (2025) 31:106. doi: 10.3892/mmr.2025.13471
6. Chen Y, Hu Q, Zhang W, Gong Q, Yan J, Wang Z, et al. Chidan Tuihuang granule modulates gut microbiota to influence NOD1/RIPK2 pathway in cholestatic liver injury recovery. Phytomedicine. (2024) 135:156164. doi: 10.1016/j.phymed.2024.156164
7. Zhao X, Su H, Chen H, Tang X, Li W, Huang A, et al. Integrated serum pharmacochemistry and network pharmacology to explore the mechanism of Yi-Shan-Hong formula in alleviating chronic liver injury. Phytomedicine. (2024) 128:155439. doi: 10.1016/j.phymed.2024.155439
8. Chen S, Guan X, Yong T, Gao X, Xiao C, Xie Y, et al. Structural characterization and hepatoprotective activity of an acidic polysaccharide from Ganoderma lucidum. Food Chem X. (2022) 13:100204. doi: 10.1016/j.fochx.2022.100204
9. Lv XC, Wu Q, Cao YJ, Lin YC, Guo WL, Rao PF, et al. Ganoderic acid A from Ganoderma lucidum protects against alcoholic liver injury through ameliorating the lipid metabolism and modulating the intestinal microbial composition. Food Funct. (2022) 13:5820–37. doi: 10.1039/D1FO03219D
10. Zhang XT, Yang Y, Ji C, Fu Y, Pu X, Xu G. Ganoderma lucidum polysaccharides reduce the severity of acute liver injury by improving the diversity and function of the gut microbiota. Heliyon. (2024) 10:e35559. doi: 10.1016/j.heliyon.2024.e35559
11. Zheng C, Lv S, Ye J, Zou L, Zhu K, Li H, et al. Metabolomic insights into the mechanisms of ganoderic acid: protection against α-amanitin-induced liver injury. Metabolites. (2023) 13:1164. doi: 10.3390/metabo13111164
12. Mu X, Luan R, Gao Y, Zhao B, Wang J, Ni X, et al. The traditional applications, phytochemistry, pharmacology, pharmacokinetics, quality control and safety of paeoniae radix alba: a review. Am J Chin Med. (2024) 52:2337–76. doi: 10.1142/S0192415X24500897
13. Shin MR, Lee SH, Roh SS. The potential hepatoprotective effect of paeoniae radix alba in thioacetamide-induced acute liver injury in rats. Evid Based Complement Alternat Med. (2022) 2022:7904845. doi: 10.1155/2022/7904845
14. Xu Y, Wang X, Wang Y, Guo L, Zhao X, Dong M, et al. New compatible pair of TCM: Paeoniae Radix Alba effectively alleviate Psoraleae Fructus-induced liver injury by suppressing NLRP3 inflammasome activation. Heliyon. (2024) 10:e34591. doi: 10.1016/j.heliyon.2024.e34591
15. Yan D, Zhang X, Ma C, Huang W, Hao M, Xie L. Mechanism study of xiaoyao san against nonalcoholic steatohepatitis-related liver fibrosis based on a combined strategy of transcriptome analysis and network pharmacology. Pharmaceuticals. (2024) 17:1128. doi: 10.3390/ph17091128
16. Lu J, Gu X, Xue C, Shi Q, Jia J, Cheng J, et al. Glycyrrhizic acid alleviates concanavalin A-induced acute liver injury by regulating monocyte-derived macrophages. Phytomedicine. (2024) 133:155586. doi: 10.1016/j.phymed.2024.155586
17. Wang X, Shi LL, Zhang YH, Zhu HZ, Cao SS, Shi Y, et al. Ameliorative effect of glycyrrhizic acid on diosbulbin b-induced liver injury and its mechanism. Am J Chin Med. (2025) 53:309–35. doi: 10.1142/S0192415X25500120
18. Yan M, Guo L, Ma J, Yang Y, Tang T, Zhang B, et al. Liquiritin alleviates alpha-naphthylisothiocyanate-induced intrahepatic cholestasis through the Sirt1/FXR/Nrf2 pathway. J Appl Toxicol. (2023) 43:350–9. doi: 10.1002/jat.4385
19. Zou B, Zhang S, Li F, Weng F, Zhao J, Jin J, et al. Gancao decoction attenuates hepatic necroptosis via activating caspase 8 in cholestatic liver injury. J Ethnopharmacol. (2024) 326:117909. doi: 10.1016/j.jep.2024.117909
20. Huynh DTM, Hai HT, Hau NM, Lan HK, Vinh TP, Tran V, et al. Preparations and characterizations of effervescent granules containing azithromycin solid dispersion for children and elder: solubility enhancement, taste-masking, and digestive acidic protection. Heliyon. (2023) 9:e16592. doi: 10.1016/j.heliyon.2023.e16592
21. Liu X, Ouyang S, Yu B, Liu Y, Huang K, Gong J, et al. PharmMapper server: a web server for potential drug target identification using pharmacophore mapping approach. Nucleic Acids Res. (2010) 38:W609–14. doi: 10.1093/nar/gkq300
22. Wang X, Pan C, Gong J, Liu X, Li H. Enhancing the enrichment of pharmacophore-based target prediction for the polypharmacological profiles of drugs. J Chem Inf Model. (2016) 56:1175–83. doi: 10.1021/acs.jcim.5b00690
23. Zhao L, Zhang H, Li N, Chen J, Xu H, Wang Y. Network pharmacology, a promising approach to reveal the pharmacology mechanism of Chinese medicine formula. J Ethnopharmacol. (2023) 309:116306. doi: 10.1016/j.jep.2023.116306
24. Stelzer G, Rosen N, Plaschkes I, Zimmerman S, Twik M, Fishilevich S, et al. The GeneCards suite: from gene data mining to disease genome sequence analyses. Curr Protoc Bioinformatics. (2016) 54:1.30.1-1.30.33. doi: 10.1002/cpbi.5
25. Szklarczyk D, Gable AL, Lyon D, Junge A, Wyder S, Huerta-Cepas J, et al. STRING v11: protein-protein association networks with increased coverage, supporting functional discovery in genome-wide experimental datasets. Nucleic Acids Res. (2019) 47:D607–13. doi: 10.1093/nar/gky1131
26. Huang DW, Sherman BT, Lempicki RA. Systematic and integrative analysis of large gene lists using DAVID bioinformatics resources. Nat Protoc. (2009) 4:44–57. doi: 10.1038/nprot.2008.211
27. Tang D, Chen M, Huang X, Zhang G, Zeng L, Zhang G, et al. SRplot: a free online platform for data visualization and graphing. PLoS ONE. (2023) 18:e0294236. doi: 10.1371/journal.pone.0294236
28. Yang X, Song J, Lu H, Gao X, Sun R, Wang J, et al. Process optimization of stir-fried Inonotus hispidus based on the box-behnken design-response surface method and the component variations during the stir-frying process. Biomed Chromatogr. (2025) 39:e70039. doi: 10.1002/bmc.70039
29. Elkady EF, Fouad MA, Mozayad AN. Application of Box-Behnken experimental design and response surface methodology for selecting the optimum RP-HPLC conditions for the simultaneous determination of methocarbamol, indomethacin and betamethasone in their pharmaceutical dosage form. BMC Chem. (2022) 16:114. doi: 10.1186/s13065-022-00908-9
30. Lu L, Ma Y, Tao Q, Xie J, Liu X, Wu Y, et al. Hypoxia-inducible factor-1 alpha (HIF-1α) inhibitor AMSP-30 m attenuates CCl(4)-induced liver fibrosis in mice by inhibiting the sonic hedgehog pathway. Chem Biol Interact. (2025) 413:111480. doi: 10.1016/j.cbi.2025.111480
31. Sha JY Li JH, Zhou YD, Yang JY, Liu W, Jiang S, et al. The p53/p21/p16 and PI3K/Akt signaling pathways are involved in the ameliorative effects of maltol on D-galactose-induced liver and kidney aging and injury. Phytother Res. (2021) 35:4411–24. doi: 10.1002/ptr.7142
32. Zhang B, Hong L, Ke J, Zhong Y, Cao N, Li W, et al. Polysaccharide of Atractylodes macrocephala Koidz alleviate lipopolysaccharide-induced liver injury in goslings via the p53 and FOXO pathways. Poult Sci. (2023) 102:102480. doi: 10.1016/j.psj.2023.102480
Keywords: Traditional Chinese medicine, functional food, effervescent granules, liver injury, pharmacology
Citation: Liu X, Wang R, Li Y, Zhang J, Li J, Li S, Ye Q, Cao R, Wang W, Luo W, Beng S, Duan X and Peng C (2025) Development and preliminary mechanistic analysis of compound effervescent hepatoprotective granules. Front. Nutr. 12:1639561. doi: 10.3389/fnut.2025.1639561
Received: 02 June 2025; Accepted: 22 September 2025;
Published: 15 October 2025.
Edited by:
Ruyu Yao, Chinese Academy of Sciences (CAS), ChinaReviewed by:
Sidharth Mehan, Indo-Soviet Friendship College of Pharmacy, IndiaAhmed A. Zaky, National Research Centre, Egypt
Allan James De Castro Bussmann, State University of Londrina, Brazil
Guifang Zhao, Mayo Clinic Florida, United States
Copyright © 2025 Liu, Wang, Li, Zhang, Li, Li, Ye, Cao, Wang, Luo, Beng, Duan and Peng. This is an open-access article distributed under the terms of the Creative Commons Attribution License (CC BY). The use, distribution or reproduction in other forums is permitted, provided the original author(s) and the copyright owner(s) are credited and that the original publication in this journal is cited, in accordance with accepted academic practice. No use, distribution or reproduction is permitted which does not comply with these terms.
*Correspondence: Xianchun Duan, ZHVhbnhjQGFodGNtLmVkdS5jbg==; Can Peng, cGVuZ2NhbkBhaHRjbS5lZHUuY24=
†These authors share first authorship