 Meng Zhang†
 Xiapei Peng
- Department of Neurology, The Central Hospital of Wuhan, Tongji Medical College, Huazhong University of Science and Technology, Wuhan, China
Objective: To methodically assess the effectiveness of nutritional support therapy combined with conventional treatment on short-term symptom improvement, nutritional and immune recovery, and complication rates in stroke patients.
Methods: A thorough literature search was carried out utilizing PubMed, EMBASE, ScienceDirect, the Cochrane Library, and major Chinese databases (CNKI, VIP, Wanfang, and CBM) from inception to the present. Randomized controlled trials (RCTs) evaluating the impact of nutritional support in stroke patients were included. Two reviewers independently extracted the data, and the Cochrane Handbook 5.3 was used to determine the risk of bias. RevMan 5.3 was used to conduct the meta-analysis.
Results: Following PRISMA guidelines, 1,693 records were retrieved and screened, resulting in the inclusion of 8 randomized controlled trials with a total of 727 individuals. Meta-analysis revealed that nutritional support significantly improved Glasgow Coma Scale (GCS) scores, serum markers of nutritional status (Hb, TLC), and immune parameters (IgA, IgG, IgM). Pro-inflammatory cytokines (IL-2, IL-6, TNF-α) were significantly reduced. Moreover, the incidence of infectious complications was lower in the intervention group. However, heterogeneity among studies was high in several analyses, warranting cautious interpretation.
Conclusion: Nutritional support combined with conventional therapy improves nutritional and immune recovery and reduces infection risk in stroke patients. However, given the high heterogeneity and methodological limitations of included trials, the certainty of evidence remains low to very low, and these results should be interpreted cautiously.
1 Introduction
Stroke is a common cerebrovascular disorder frequently encountered in clinical practice. With the global trend of population aging, the incidence of stroke continues to rise annually. Stroke can lead to a range of motor impairments due to damage to the central nervous system, with dysphagia being one of the most prevalent complications (1). According to published literature (2, 3), approximately 22 to 65% of stroke patients develop dysphagia. Affected individuals may experience impaired swallowing or an increased risk of regurgitation and aspiration, which compromises nutritional intake and absorption and significantly elevates the risk of aspiration pneumonia. Moreover, stroke is often associated with cerebral edema, elevated intracranial pressure, neurological dysfunction, and reduced gastrointestinal motility—all of which further impair nutritional intake, weaken immune function, delay neurological recovery, increase mortality risk, and prolong hospitalization (4).
Nutritional support therapy, including enteral nutrition, parenteral nutrition and combined application, has a significant part in improving the nutritional status of stroke individuals, reducing complications and promoting functional recovery (5, 6). Among them, early enteral nutrition (EN) shortens the establishment time of sitting balance and standing balance by maintaining intestinal barrier function, regulating immune response, and reducing the risk of infection. Combined enteral and parenteral nutritional support (EN + PN) can rapidly correct hypoproteinemia, improve the levels of total plasma protein, albumin and hemoglobin, and reduce the incidence of complications such as pneumonia and pressure ulcers. The patients who received early nutritional intervention (within 72 h of onset) had significantly better modified Barthel index scores and the degree of improvement in neurological deficits than those in the delayed intervention group (IG) (7). However, existing studies show heterogeneity in terms of the types of nutritional support, the timing of intervention and evaluation indicators. For instance, some studies have strongly adjusted the short-term metabolic advantages of protein-based enteral nutrition agents (8), while others recommend sequential enteral nutrition to reduce the risk of infection (9). Based on the above background, this article seeks to systematically evaluate the effect of nutritional support therapy applied to stroke patients through evidence-based methods, aiming to provide a reference basis for clinicians to formulate more scientific and reasonable diagnosis and treatment measures.
The objective of this systematic review and meta-analysis was to evaluate the short-term effects of nutritional support therapy combined with conventional treatment on neurological recovery, nutritional and immune function, and infection-related complications in patients with stroke.
2 Methods
2.1 The sources and procedures used to get literary materials
A comprehensive literature search was conducted using electronic databases, including PubMed, EMBASE, ScienceDirect, the Cochrane Library, the China National Knowledge Infrastructure (CNKI), the Chinese Biomedical Literature Database (CBM), the Wanfang Database, and the VIP Full-Text Database. In addition, manual searches were performed to identify relevant studies from Chinese and international journals, conference proceedings, dissertations, and other academic sources. Reference lists of retrieved articles were also reviewed to identify additional relevant publications.
The search focused on studies assessing the effects of nutritional support therapy on symptom improvement and long-term prognosis in patients with stroke. The following Boolean search strategy was employed to ensure comprehensive coverage:
(“nutritional support therapy” OR “nutritional intervention” OR “enteral nutrition” OR “parenteral nutrition” OR “clinical nutrition support”) AND (“routine treatment” OR “conventional therapy”) AND (“stroke” OR “cerebral infarction” OR “cerebral hemorrhage”) AND (“prognosis” OR “recovery” OR “rehabilitation outcome”).
Both Medical Subject Headings (MeSH) and free-text terms were utilized. Search terms and operators were adapted according to the specific syntax requirements of each database. The search was restricted to publications dated from January 2010 to the present.
2.2 Criteria for literature inclusion and exclusion
2.2.1 Inclusion criteria of literature
To ensure a comprehensive and structured selection process, inclusion criteria were defined according to the PICOS framework:
Population (P): Adult patients (≥18 years) clinically diagnosed with stroke (ischemic or hemorrhagic) according to established diagnostic criteria. Studies were excluded if participants required palliative care, had acute coronary syndrome, transient ischemic attack, subarachnoid hemorrhage, progressive neurological diseases, heart failure, or respiratory failure, or if they had pre-existing disability before stroke onset.
Intervention (I): Nutritional support therapy, including enteral nutrition, nasogastric nutritional management, parenteral nutrition, or combined enteral–parenteral approaches. Studies describing early nutritional support (initiated within 72 h) or immune-enhanced formulations were also eligible.
Comparator (C): Routine or conventional treatment without structured nutritional support, or family-based nutritional management consistent with standard hospital care.
Outcomes (O): Primary outcomes: Nutritional status indicators {[serum prealbumin (PA), albumin (Alb), total lymphocyte count (TLC), and hemoglobin (Hb)]}|.
Secondary outcomes: Neurological function {[National Institutes of Health Stroke Scale (NIHSS)] score}, level of consciousness {[Glasgow Coma Scale (GCS)] score}, immune function markers (IgA, IgG, IgM), inflammatory cytokines {[tumor necrosis factor-alpha (TNF-α), interleukin-2 (IL-2), and interleukin-6 (IL-6)]}, and incidence of infectious complications.
Study design (S): Randomized controlled trials (RCTs) were included in the final analysis to ensure methodological rigor. Although cohort studies were initially considered during the search stage for comprehensiveness, only RCTs meeting the Cochrane Handbook 5.3 criteria were retained after quality assessment. Although cohort studies were initially considered to capture a broad evidence base, they were excluded after quality appraisal because they lacked randomization or comparable control groups, as reflected in the PRISMA flowchart (Figure 1).
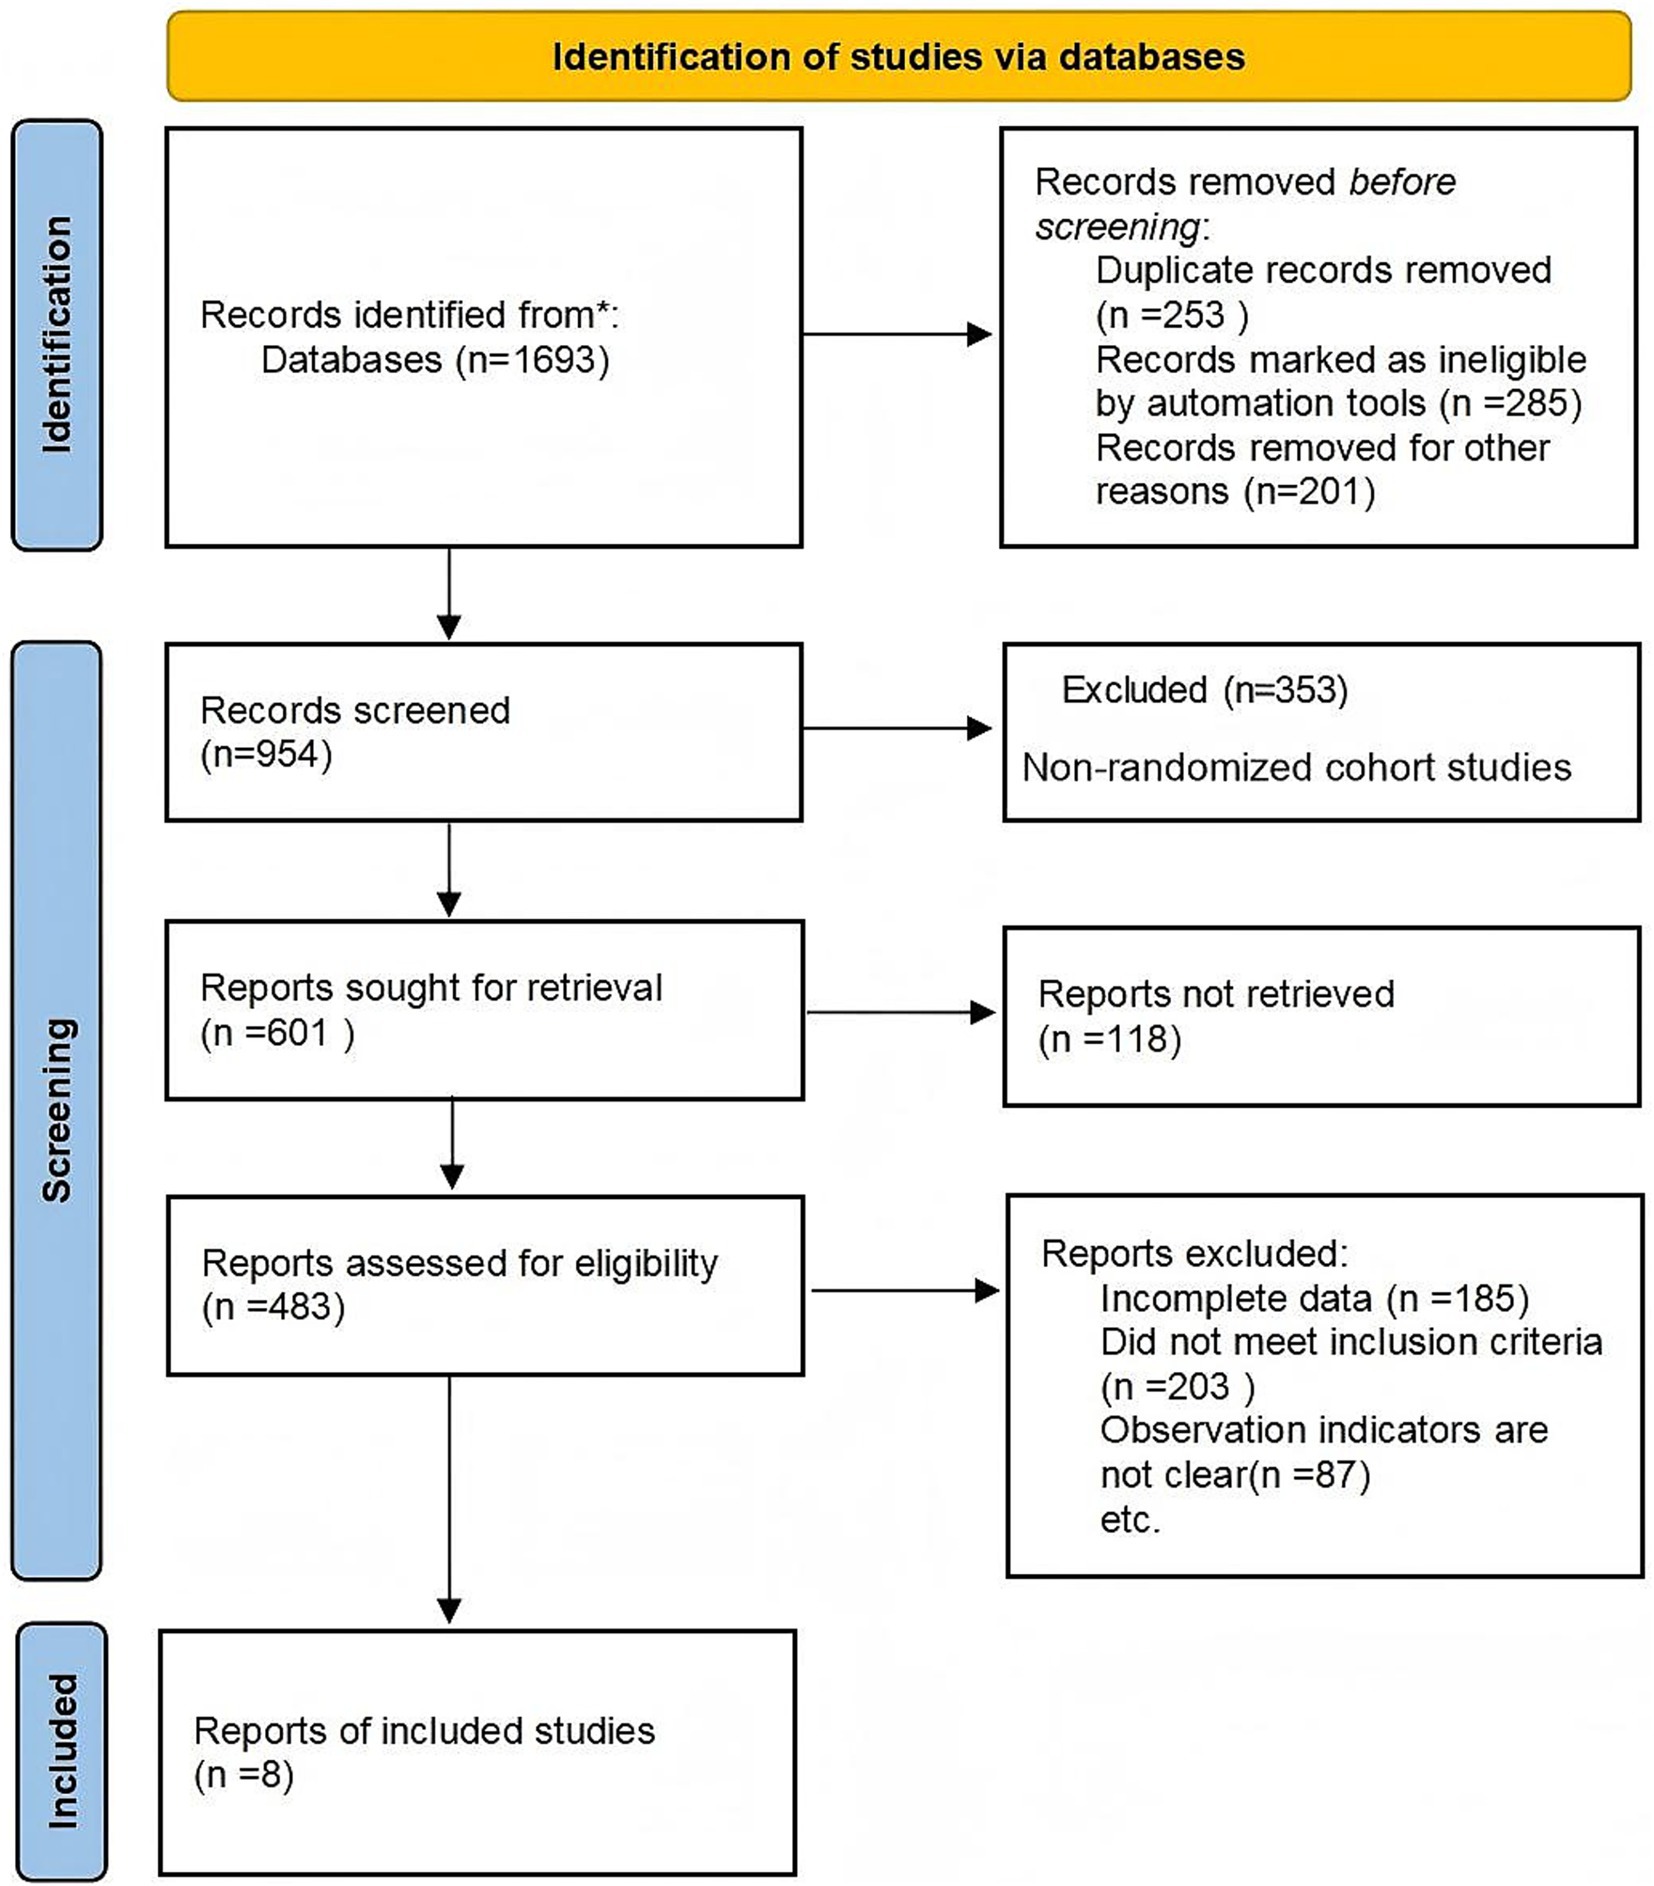
Figure 1. Flowchart of literature screening.
All included studies reported baseline patient characteristics and intervention details. However, the reporting of blinding and attrition varied among studies, which was considered in the risk of bias assessment.
Efficacy Endpoints: Neurological function: Assessed using the NIHSS, that falls between 0 and 42 points. Higher scores show more serious neurological impairments, with 0–1 indicating normal or mild deficits and ≥21 indicating severe impairment (10). Level of consciousness: Evaluated using the GCS, with a total score of 15. Lower scores indicate deeper levels of coma (11). Nutritional status: Assessed via PA, Alb, TLC, and Hb. Immune function: Measured by serum levels of immunoglobulins (IgA, IgM, IgG). Inflammatory markers: Including TNF-α, IL-2, and IL-6.
2.2.2 Literature exclusion criteria
(1) Research not involving randomized controlled trials.
(2) Studies with incomplete or non-usable data.
(3) Duplicate publications (only the most recent version was retained).
(4) Studies lacking clearly defined outcomes.
(5) Review articles, meta-analyses, or theoretical literature.
(6) Case reports or clinical case series.
2.3 Quality evaluation and data extraction
2.3.1 Risk of bias assessment
The Cochrane Collaboration’s “Risk of Bias” assessment technique, described in the Cochrane Handbook for Systematic Reviews of Interventions, version 5.3, was used to assess the risk of bias in the included studies.
2.3.2 Literature screening and data extraction
The literature was separately examined, pertinent data was retrieved, and the quality of the study was evaluated by two reviewers. Any disagreements were settled by discussion or, if required, by a third reviewer. NoteExpress and Microsoft Excel were used for reference management and data extraction. Attempts were made to get in touch with the original writers for clarification or further information in situations where crucial material was unclear or missing. The information that was retrieved contained: (1) Basic study information: first author, year of publication, and sample size; (2) Intervention details: Nutritional support therapy (e.g., enteral nutrition, nasogastric feeding) and conventional treatment (standard nutritional care). When reported, data on the enteral-to-parenteral nutrition (EN/PN) ratio, nutrient composition (such as protein- or peptide-based formulations, lipid emulsions, immunonutrient-enriched formulas), and timing and duration of initiation were also extracted. However, reporting across studies was inconsistent, with several trials lacking detailed specification of formula type, caloric density, or supplementation content; (3) Outcome measures: Neurological function (NIHSS score), level of consciousness (GCS score), nutritional status markers (prealbumin, albumin, hemoglobin, total lymphocyte count), immune function (IgA, IgM, IgG), inflammatory biomarkers (IL-2, IL-6, TNF-α), and incidence of infectious complications.
2.4 Statistical processing
The Cochrane Collaboration developed the RevMan 5.4 program for meta-analysis. Counting data adopted the Odds Ratio (OR) as the effect indicator. RevMan 5.4 was used to analyze data, including the incidence of infectious complications, serum inflammatory factor levels, nutritional status indicators, immunological function indicators, NIHSS score, and GCS score. For dichotomous outcomes (incidence of infectious complications), effect sizes were calculated as odds ratios (ORs) with 95% confidence intervals (CIs). For continuous outcomes (NIHSS, GCS, PA, Alb, Hb, TLC, IgA, IgG, IgM, IL-2, IL-6, TNF-α), effect sizes were calculated as mean differences (MDs) with 95% CIs. Fixed- or random-effects models were selected according to between-study heterogeneity (χ2 test and I2 statistic). The included studies were deemed homogenous if p > 0.1 and I2 < 50%, and the adjusted influence models could be gathered for meta-analysis. When evaluating the homogeneity of the included studies, the random effects model was chosen if p < 0.1 and I2 > 50% and a combined effect was required. When P is less than 0.1 and the source of heterogeneity cannot be identified, descriptive analysis is used instead of meta-analysis. To further examine the publication bias of the included literature, an inverted funnel plot was created. Since the number of literatures included in this study was less than 10, funnel plot drawing was not conducted.
Given the anticipated clinical and methodological heterogeneity across studies, exploratory subgroup and sensitivity analyses were prespecified. Subgroups of interest comprised: (1) route and composition of nutritional support (enteral nutrition alone vs. nasogastric nutrition management vs. combined or immunonutrient-enriched formulations, where reported); (2) timing and duration of the intervention (early enteral nutrition initiated during the acute phase vs. later initiation; short-term courses ≤2 weeks vs. longer durations); (3) stroke subtype and severity (hemorrhagic vs. ischemic or mixed types; severe vs. non-severe cases, where reported); and (4) control regimen (conventional care vs. family-administered nutrition management).
Sensitivity analyses included leave-one-out analyses, exclusion of small-sample studies, and restriction to studies with comparable laboratory measurement protocols. In cases of insufficient data or inconsistent definitions across studies, subgroup pooling was not performed, and relevant findings were summarized narratively.
3 Results and analysis
3.1 The outcomes of the literature search and the fundamental state of the included literature
The literature review followed Preferred Reporting Items for Systematic Reviews and Meta-Analyses (PRISMA) guidelines. A total of 1,693 records were retrieved; after screening and full-text assessment, non-randomized cohort studies were excluded due to methodological limitations and absence of comparable control groups. Ultimately, eight RCTs involving 727 participants were included in the meta-analysis (Figure 1).
Table 1 presents the basic characteristics of the eight included RCTs, including study design, diagnostic methods, conventional and nutritional interventions, demographic characteristics, and primary results. Most studies implemented early enteral nutrition as the main intervention, while control groups received conventional treatment or family-based nutritional management. Despite similarities in population and intervention timing, the composition and dosage of nutritional support varied considerably, contributing to potential clinical heterogeneity.
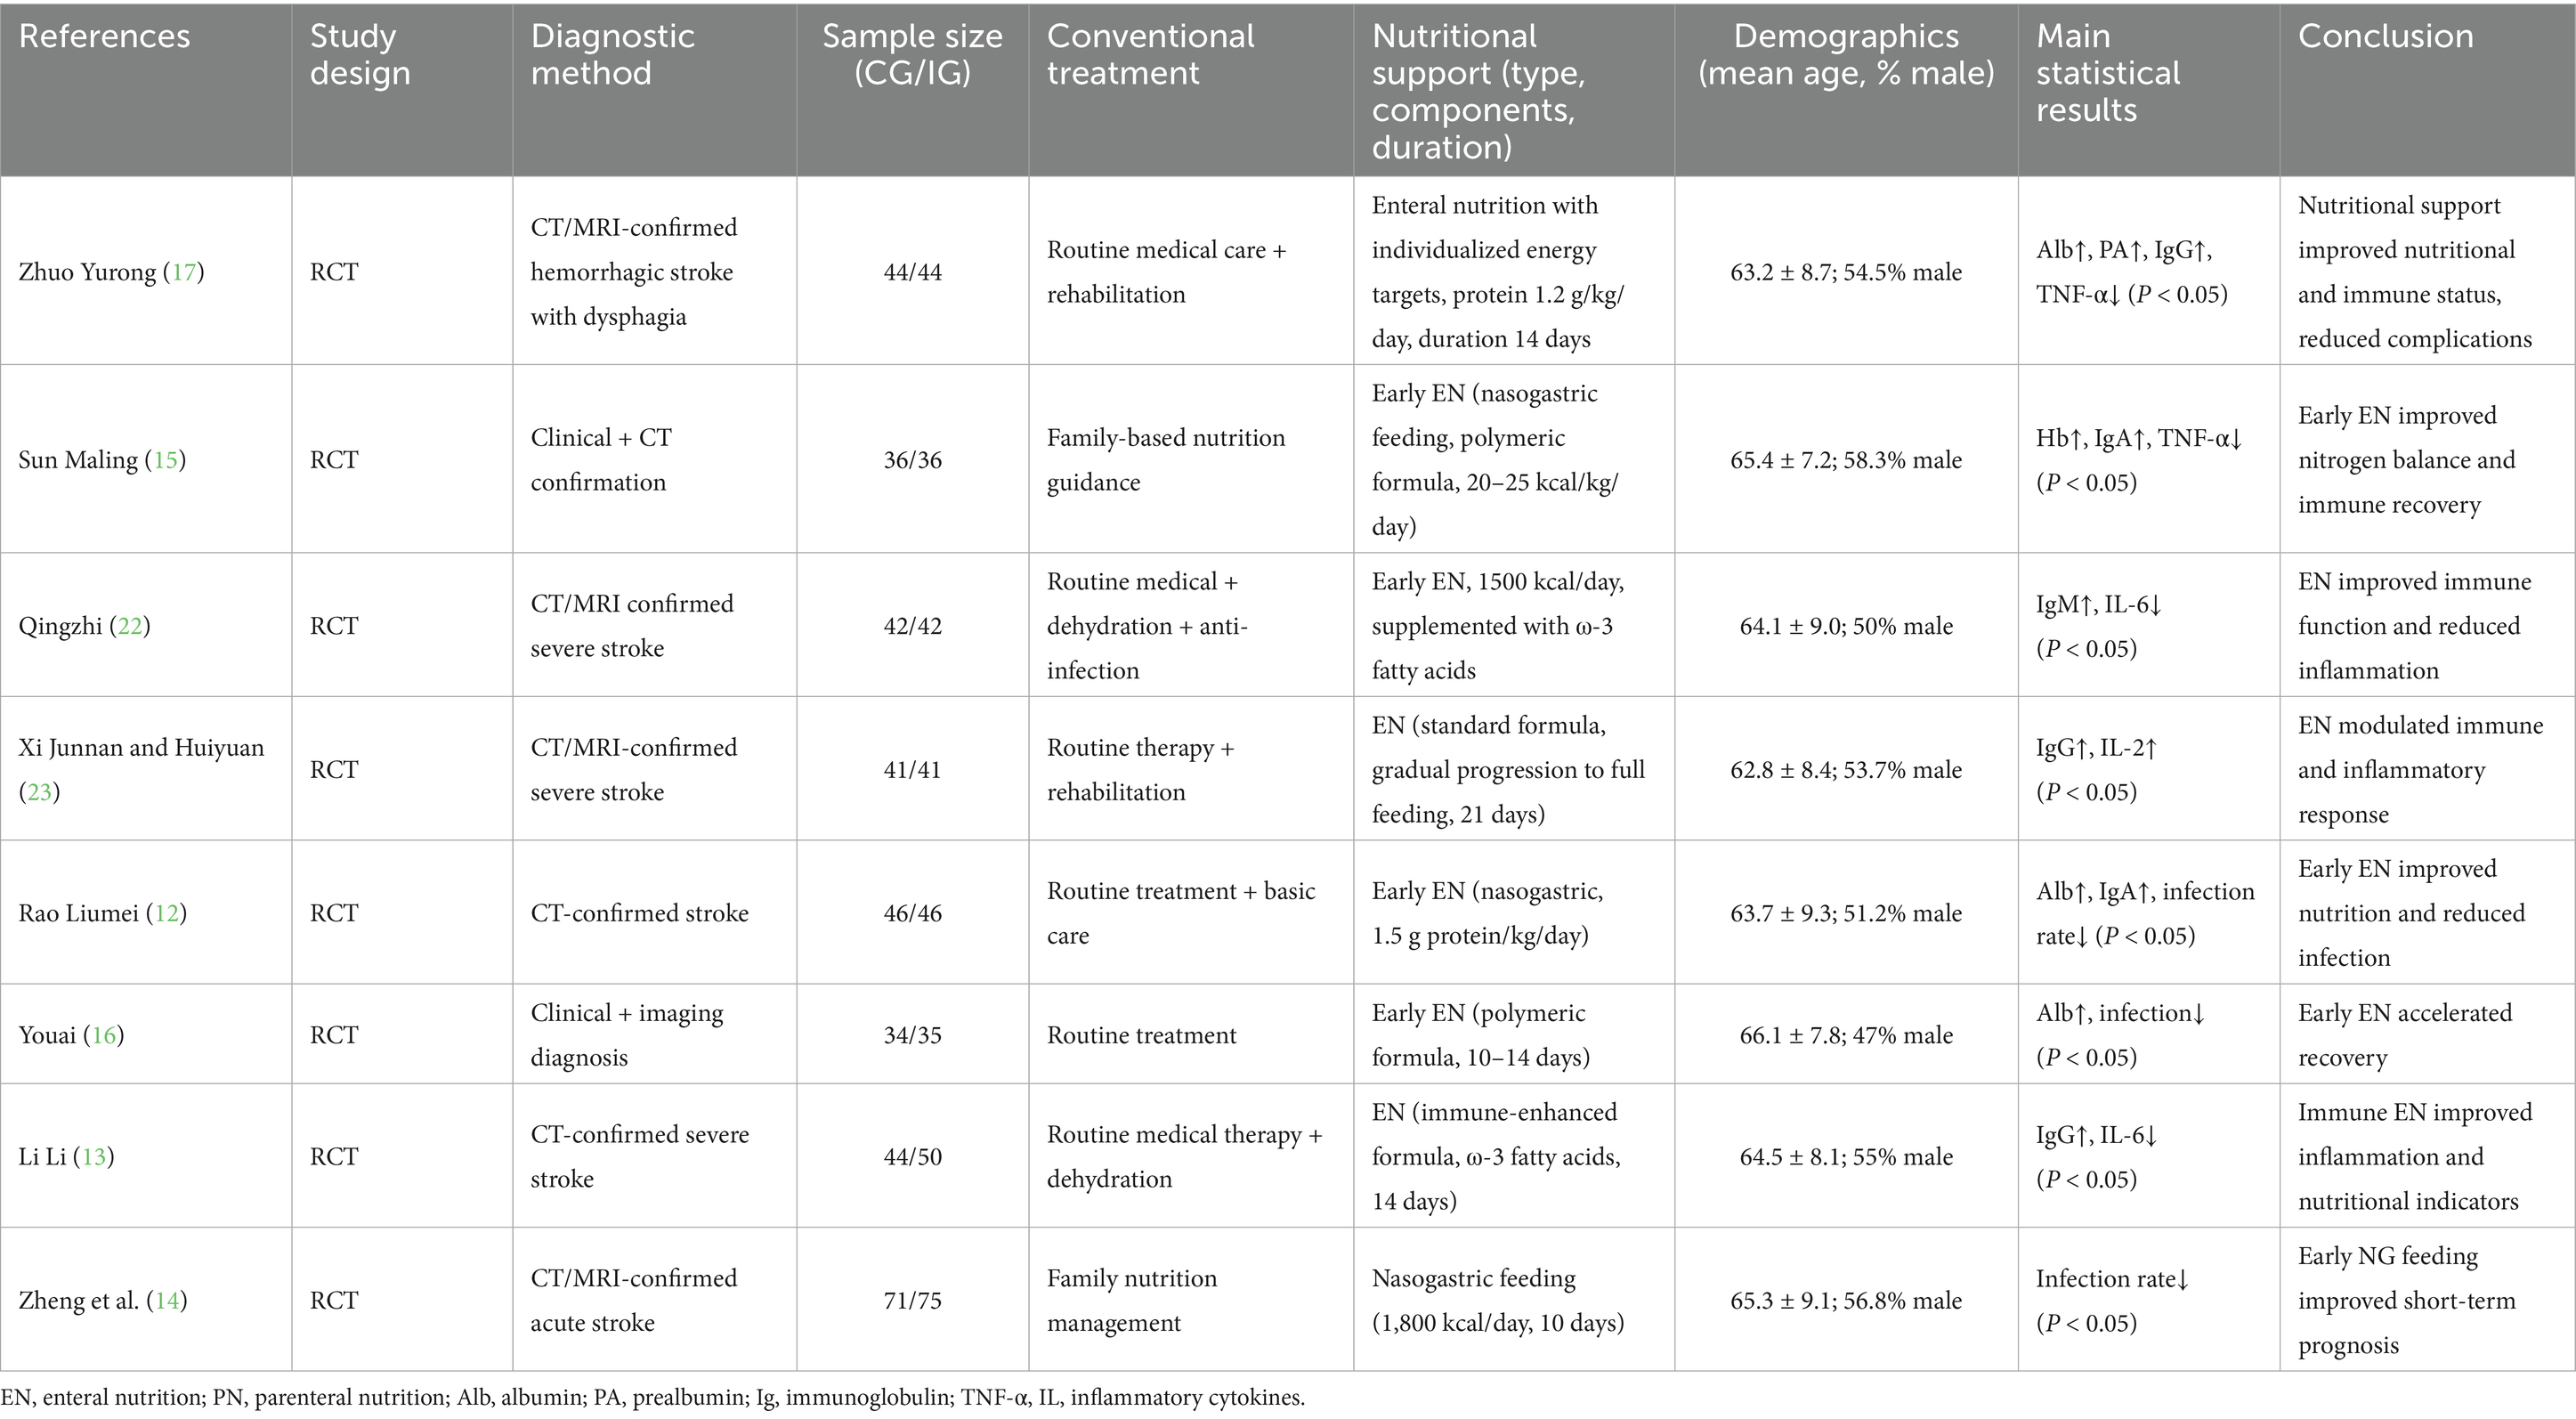
Table 1. Basic characteristics of the included randomized controlled trials.
3.2 Assessment of the methodological quality of the literature
All eight of the RCTs that were included of this meta-analysis reported baseline patient information and gave thorough explanations of the intervention procedures and outcome measures. However, none of the studies explicitly reported the methods or extent of blinding, nor did they adequately describe the number of individuals lost to follow-up or the reasons for withdrawal. Figures 2, 3 show the risk of bias assessment for the included studies.
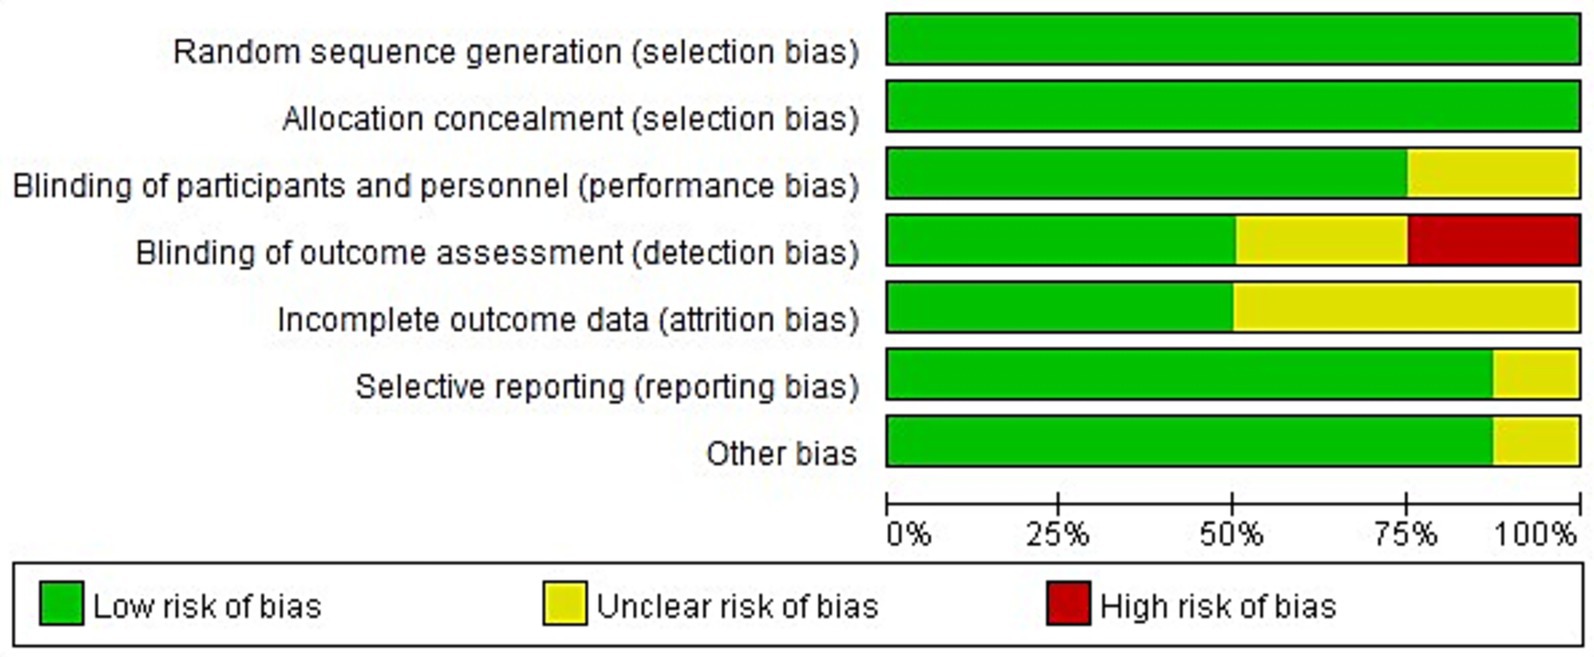
Figure 2. Risk bias graph.
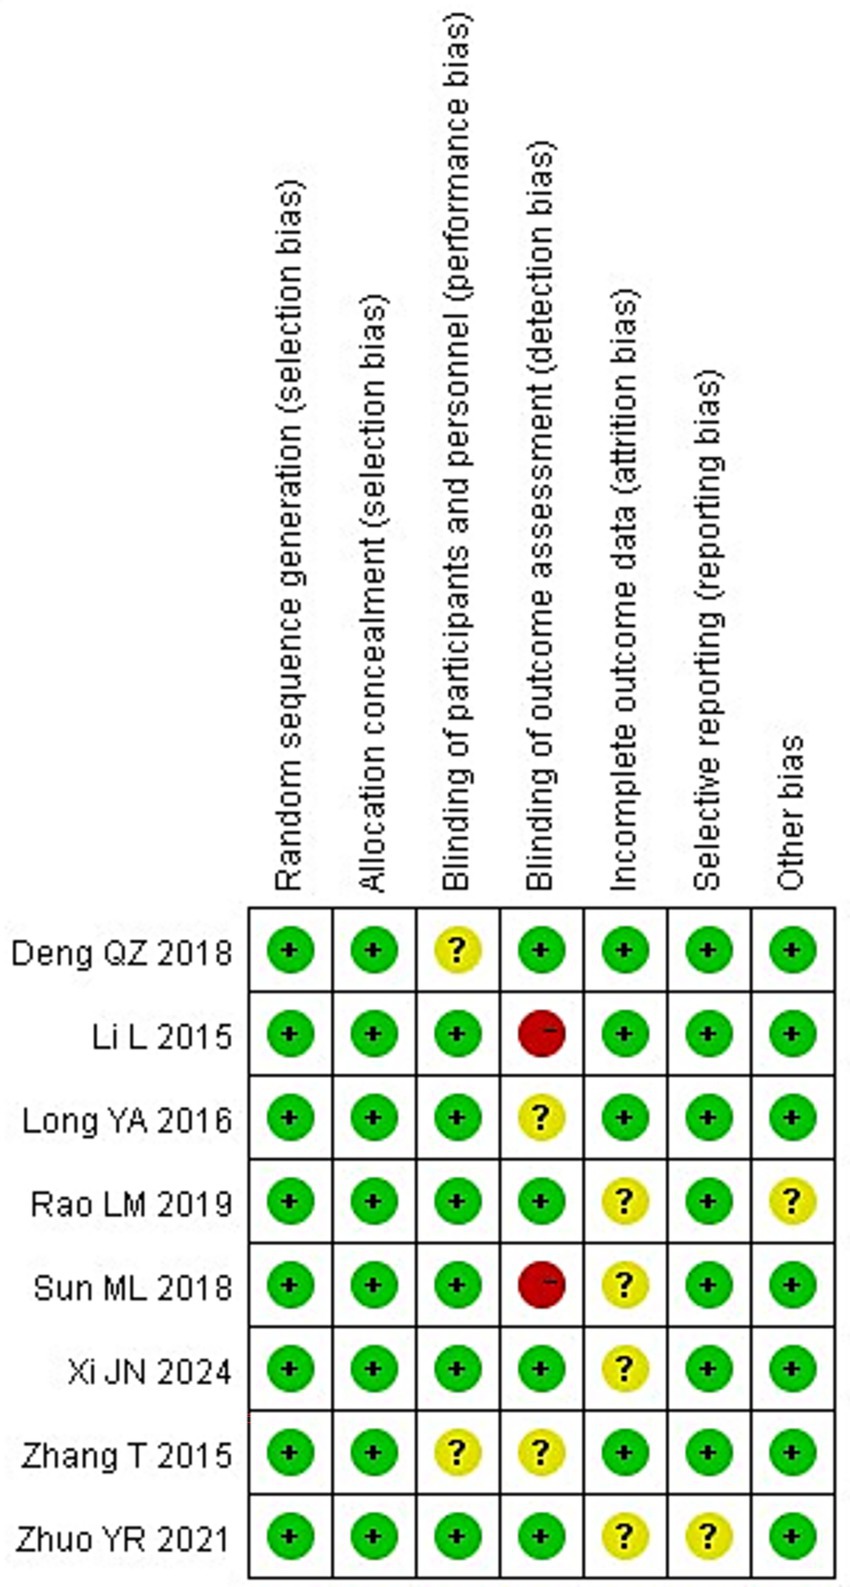
Figure 3. Summary chart of risk bias.
Quantitatively, six of the eight studies (75%) were judged as having a low risk of bias for random sequence generation and allocation concealment, while all studies were rated as having unclear or high risk for blinding of participants and outcome assessment. Specifically, 2 studies (25%) showed a high risk of performance bias due to unblinded interventions, and 3 studies (37.5%) had unclear detection bias. Incomplete outcome data were reported in only 3 studies (37.5%), and selective reporting was unclear in 2 (25%).
The overall methodological quality of the included RCTs was suboptimal. None of the trials explicitly reported the use or extent of blinding, and most failed to describe participant attrition or reasons for withdrawal. These deficiencies raise a high risk of performance and detection bias, especially for outcomes that rely on subjective clinical judgment or additional attention (e.g., GCS scores and infection monitoring). Therefore, while pooled analyses suggest beneficial effects, the certainty of evidence for all main outcomes should be considered low to very low.
3.3 Meta-analysis results
3.3.1 Neural function
A total of 8 studies were included in this research, involving a total of 727 samples. Among them, 2 literatures reported the NIHSS scores of the two groups after treatment. It can be known from the findings of the heterogeneity test that: Chi2 = 29.70, df = 1, p < 0.00001, I2 = 97%, indicating significant heterogeneity among the included research data. Analysis using the random effects model shows (Figure 4) that there was no discernible variation in the NIHSS scores involving the two groupings of individuals (MD = −4.60, 95%CI: −9.21 to 0.00, p = 0.05).
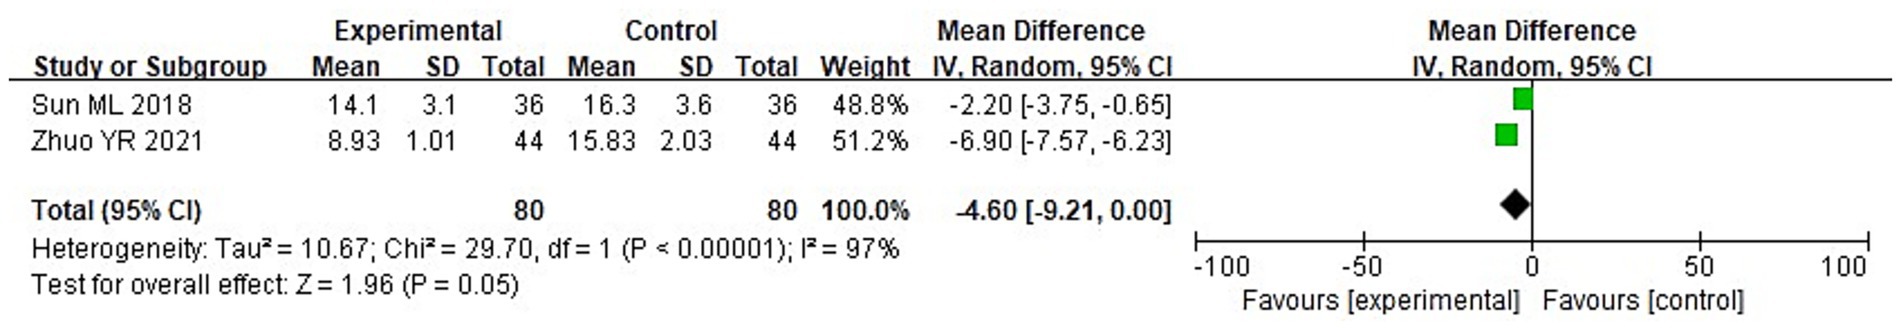
Figure 4. Forest analysis diagrams comparing the NIHSS scores of the two groupings.
3.3.2 Degree of coma
Among 8 studies, 2 studies reported the GCS scores of the two groups after treatment. It can be known from the findings of the heterogeneity test that: Chi2 = 2.29, df = 1, p = 0.13, I2 = 56%, indicating heterogeneity among the included research data. It can be known from the random effects model analysis (Figure 5) that the GCS score of the IG after treatment was higher than that of the control group (CG) (MD = 1.83, 95%CI: 1.11–2.56, p < 0.0001).
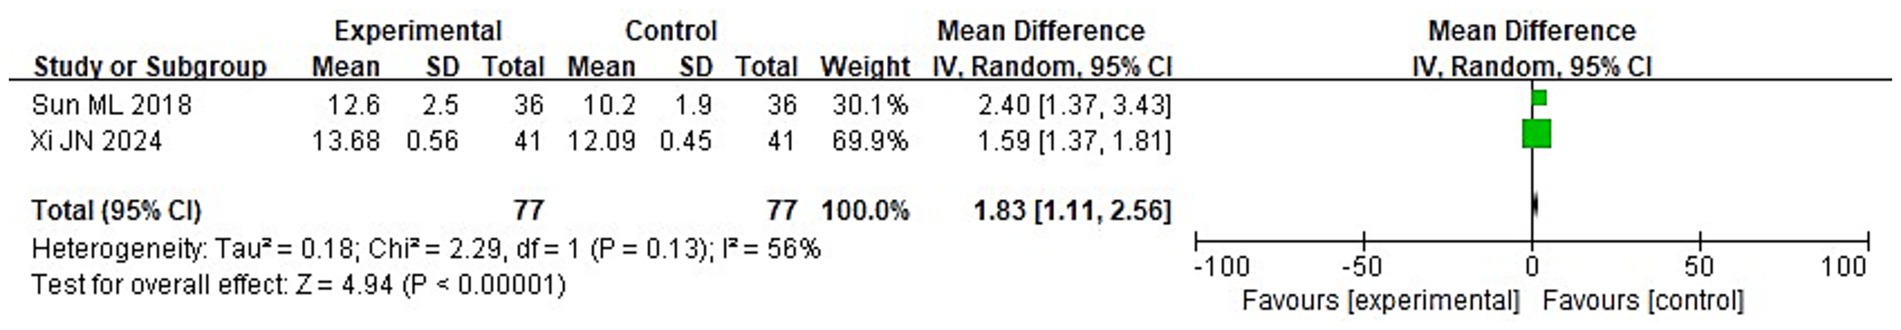
Figure 5. Forest analysis chart comparing the GCS scores of the two groups.
3.3.3 Nutritional status
A meta-analysis was carried out to assess the post-treatment nutritional status indicators in both groupings. The heterogeneity test findings were as follows: PA: Chi2 = 47.88, df = 2, p < 0.00001, I2 = 96% (Figure 6); Alb: Chi2 = 13.65, df = 5, p = 0.02, I2 = 63%; Hb: Chi2 = 110.34, df = 4, p < 0.00001, I2 = 96%; and TLC: Chi2 = 40.02, df = 2, p < 0.00001, I2 = 95%. These results indicate substantial heterogeneity among the included studies. Using a random-effects model, the analysis demonstrated that serum levels of Hb and TLC were considerably higher in the IG in contrast to the CG (p < 0.05) (Figures 7–9). Although serum PA levels were also elevated in the IG, the disparity wasn’t that great (p > 0.05).
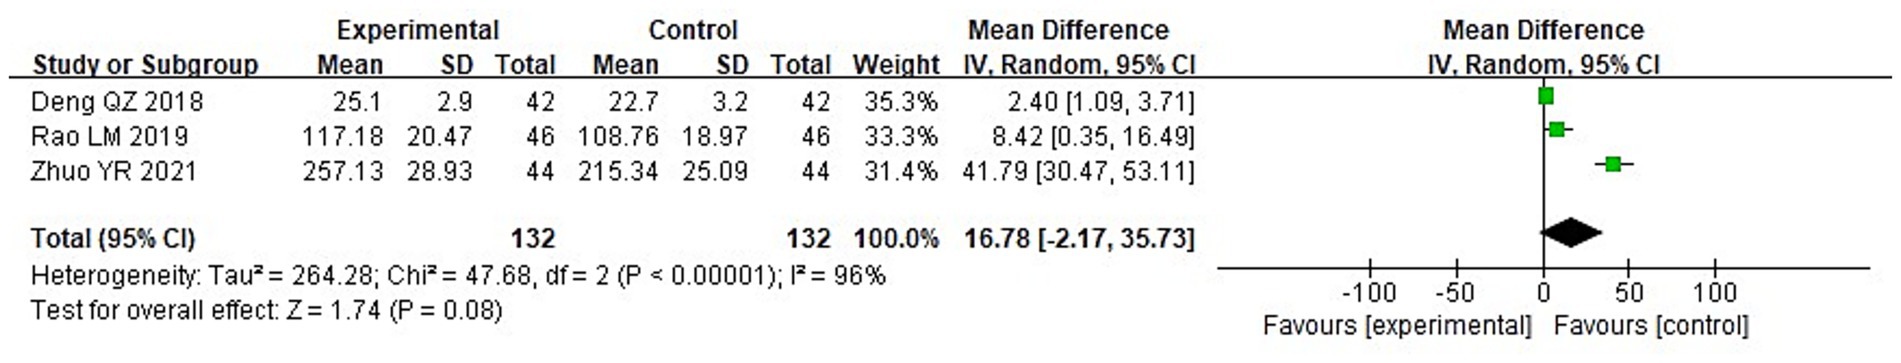
Figure 6. Forest analysis diagram comparing the levels of prealbumin (PA) in the two groupings.
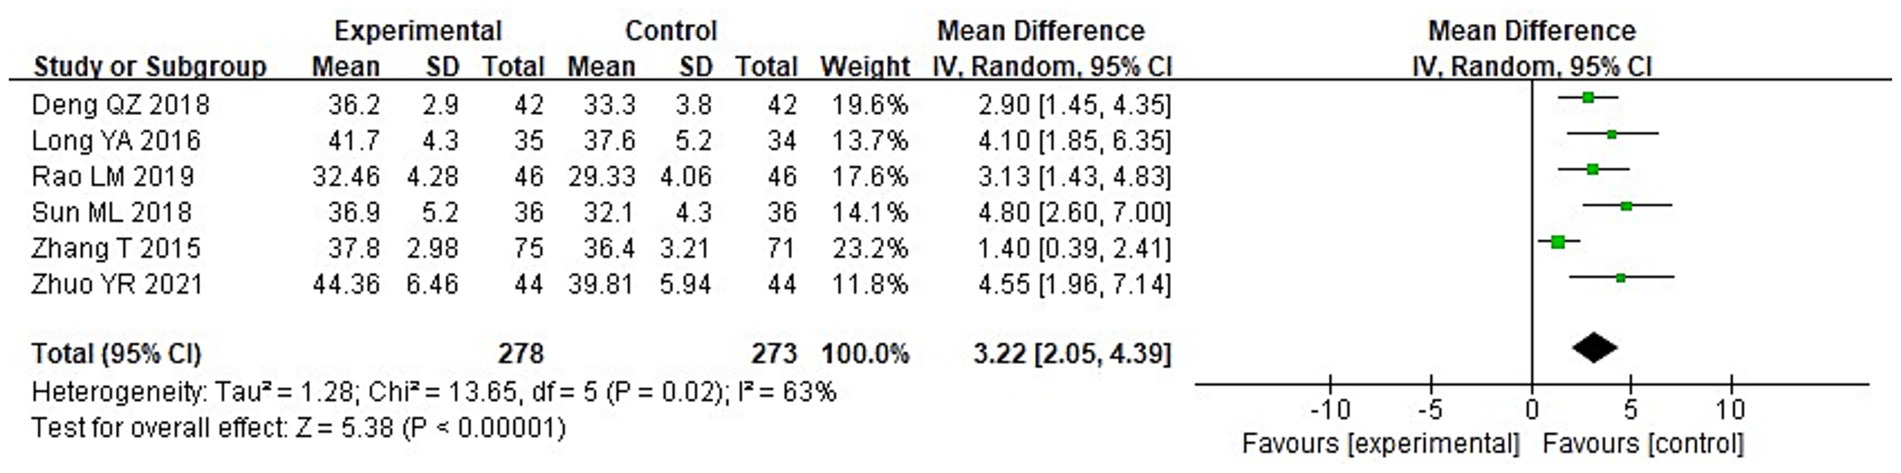
Figure 7. Forest analysis diagram comparing the levels of albumin (Alb) in the two groupings.
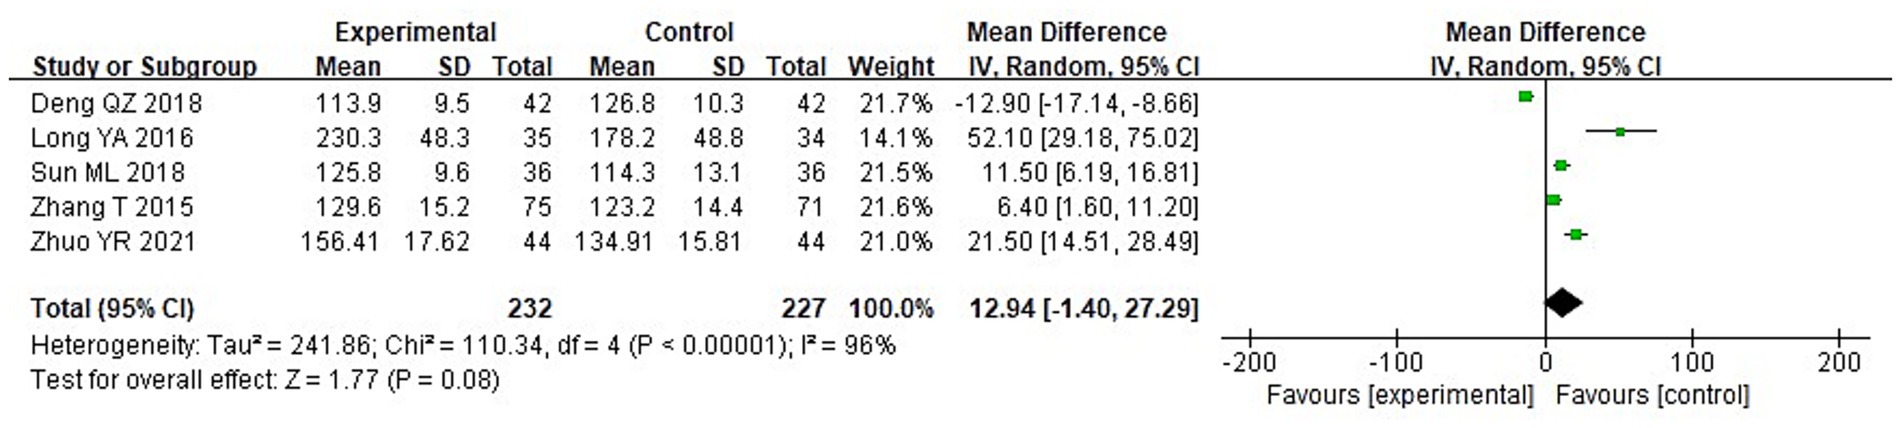
Figure 8. Forest analysis diagram comparing the levels of hemoglobin (Hb) in the two groupings.
![Forest plot showing the mean difference between experimental and control groups for three studies: Deng QZ 2018, Li L 2015, and Rao LM 2019. Each study lists mean, standard deviation, total, weight, and 95% confidence interval. Combined results show a total mean difference of 0.31 with a 95% confidence interval [0.08, 0.54]. Heterogeneity statistics include Tau² = 0.04, Chi² = 40.02, df = 2, I² = 95%. The test for overall effect has a Z-value of 2.66 and P-value of 0.008. A graph indicates the results with green squares and diamond on a scale from -2 to 2.](https://www.frontiersin.org/files/Articles/1642161/fnut-12-1642161-HTML/image_m/fnut-12-1642161-g009.jpg)
Figure 9. Forest analysis diagram comparing the total blood lymphocyte count (TLC) of the two groupings.
3.3.4 Immune function
A meta-analysis was conducted to evaluate immune function indicators in both groupings following treatment. The results of the heterogeneity tests were as follows: IgA: Chi2 = 73.87, df = 3, p < 0.00001, I2 = 96%; IgM: Chi2 = 181.01, df = 3, p < 0.00001, I2 = 98%; and IgG: Chi2 = 149.92, df = 3, p < 0.00001, I2 = 98%. These findings indicate substantial heterogeneity across the included studies. Using a random-effects model, the analysis demonstrated that post-treatment serum levels of IgA, IgG, and IgM were considerably higher in the IG in contrast to the CG (p < 0.05) (Figures 10–12).
![Forest plot showing the mean differences between experimental and control groups across four studies. Each study displays mean, standard deviation, total participants, and weight. Mean differences and confidence intervals (CI) are provided: Deng QZ 2018 (0.61 [0.42, 0.80]), Li L 2015 (0.91 [0.77, 1.05]), Rao LM 2019 (0.74 [0.58, 0.90]), and Sun ML 2018 (-0.16 [-0.37, 0.05]). The overall mean difference is 0.53 [0.11, 0.95]. Heterogeneity: Tau² = 0.18, Chi² = 73.87, df = 3, p < 0.00001, I² = 96%. Overall effect Z = 2.48, p = 0.01.](https://www.frontiersin.org/files/Articles/1642161/fnut-12-1642161-HTML/image_m/fnut-12-1642161-g010.jpg)
Figure 10. Forest analysis diagrams comparing the levels of IgA in the two groupings.
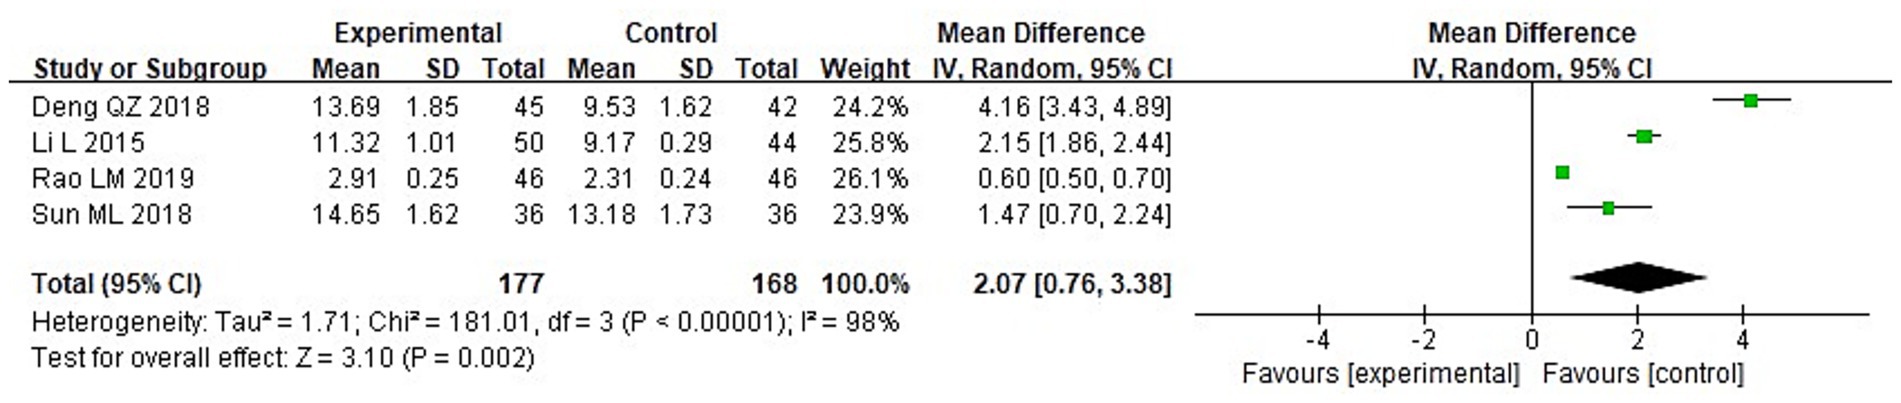
Figure 11. Forest analysis diagram comparing the IgM levels of the two groupings.
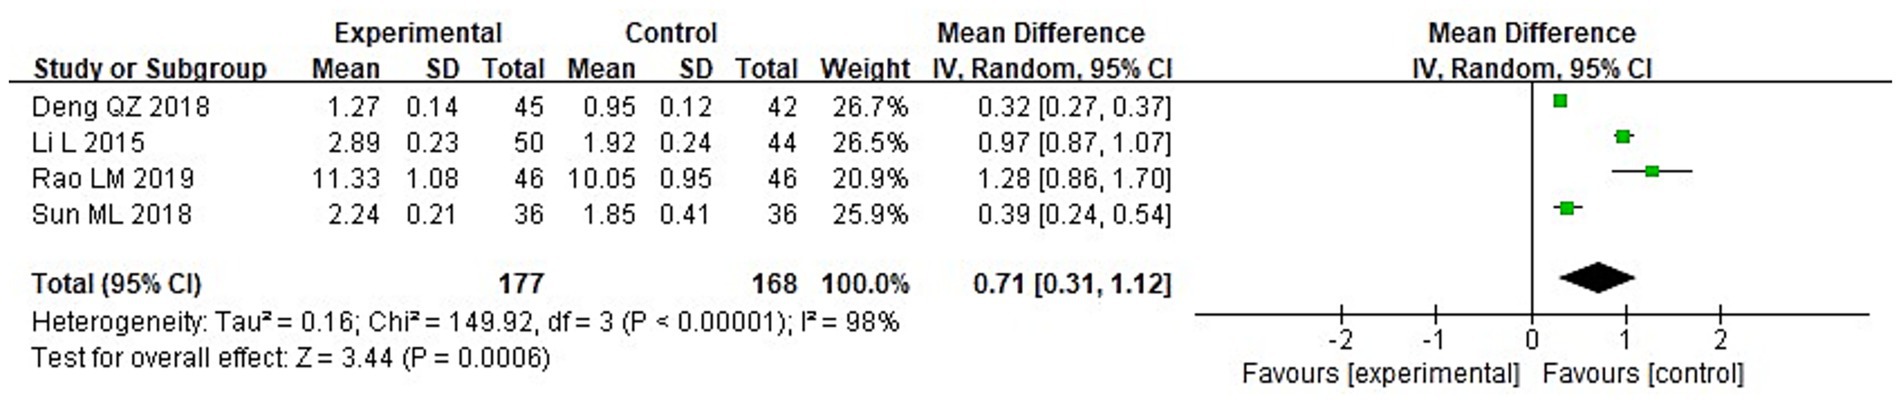
Figure 12. Forest analysis plot comparing the IgG levels of the two groups.
3.3.5 Serum inflammatory factors
To compare the two groups’ post-treatment levels of inflammatory cytokines, a meta-analysis was carried out. The following were the findings of the heterogeneity test: Chi2 = 88.06, df = 2, p < 0.00001, I2 = 98% for IL-2; Chi2 = 71.08, df = 2, p < 0.00001, I2 = 97% for IL-6; and Chi2 = 84.37, df = 2, p < 0.00001, I2 = 98% for TNF-α. These findings suggest that the included studies exhibit significant heterogeneity. Following treatment, the IG’s blood levels of IL-2, IL-6, and TNF-α were considerably lower than those of the CG (p < 0.05), according to analysis using a random-effects model (Figures 13–15).
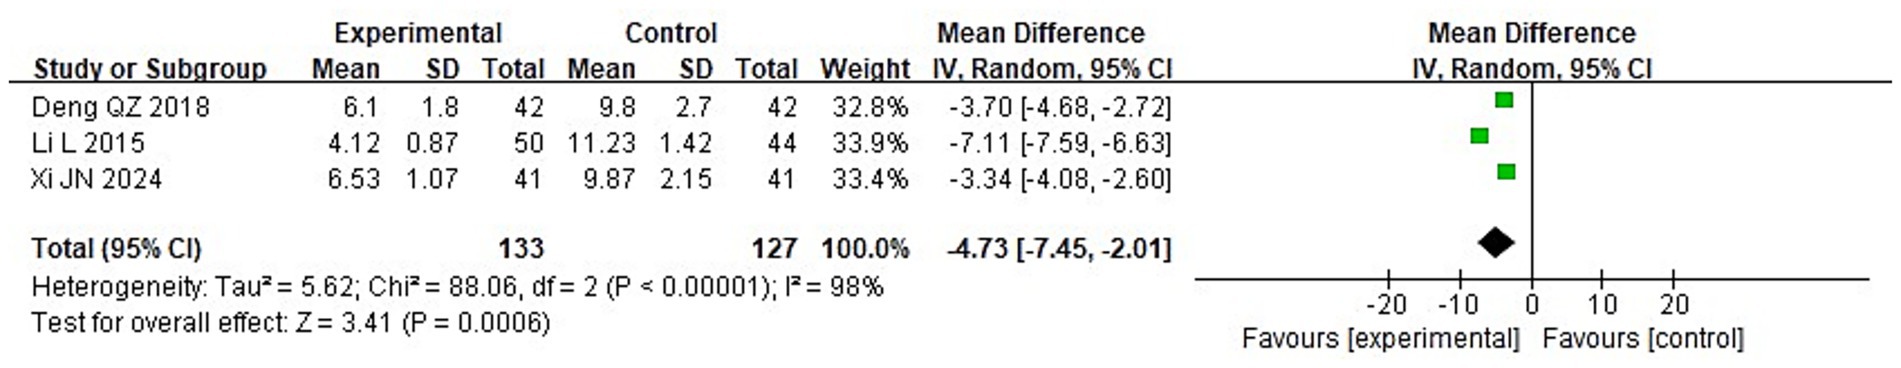
Figure 13. Forest analysis chart comparing the levels of serum IL-2 in the two groupings.
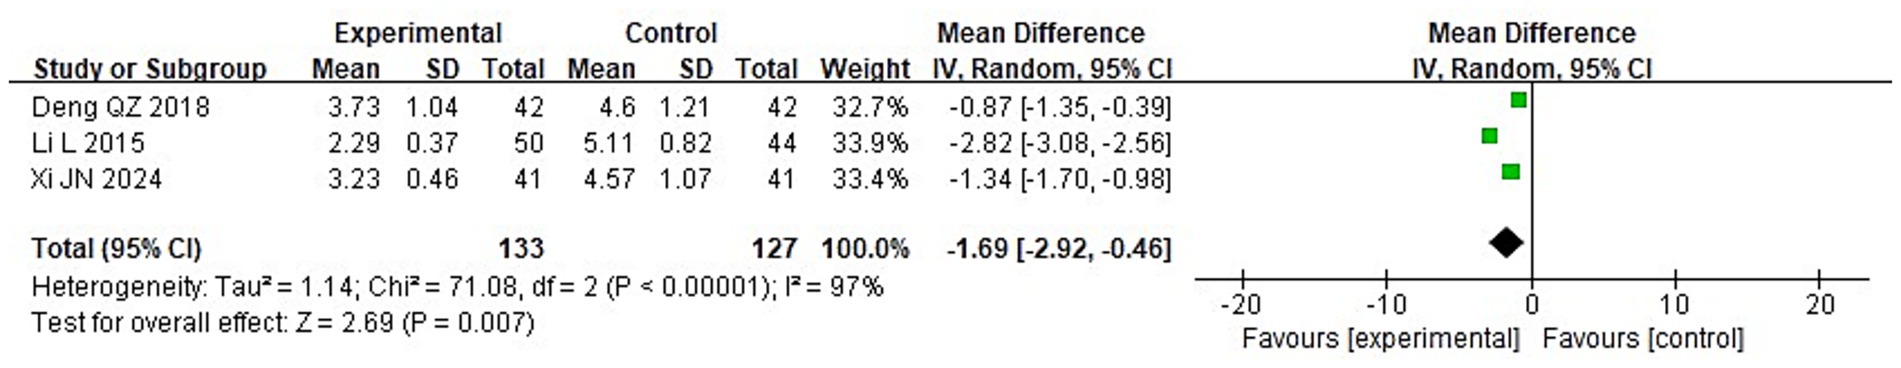
Figure 14. Forest analysis chart comparing the levels of serum IL-6 in the two groupings.
![Forest plot showing mean differences between experimental and control groups across three studies. Each study is visualized with a square symbol representing effect size and confidence intervals. The overall effect is summarized with a diamond, showing a mean difference of -8.35 with a confidence interval of [-12.54, -4.16]. Statistical metrics indicate high heterogeneity with an I² of 98%.](https://www.frontiersin.org/files/Articles/1642161/fnut-12-1642161-HTML/image_m/fnut-12-1642161-g015.jpg)
Figure 15. Forest analysis chart comparing the levels of serum TNF-α in the two groups.
3.3.6 Exploration of heterogeneity (subgroup and sensitivity analyses)
Several pooled outcomes (nutritional status markers, immunoglobulins, and inflammatory cytokines) exhibited very high heterogeneity (I2 > 95%). To explore potential sources, we conducted prespecified sensitivity analyses: Leave-one-out analyses did not identify a single outlier study driving the heterogeneity; pooled effects remained directionally consistent. Excluding studies with distinct control regimens (e.g., trials that used family nutrition management as control rather than standard hospital-based care) qualitatively reduced between-study variability for immune and inflammatory markers, although substantial heterogeneity persisted. Restricting to similar intervention routes (EN-only vs. nasogastric nutrition management) attenuated dispersion in several biomarker outcomes but did not fully resolve inconsistency. Excluding the hemorrhagic-stroke-only cohort with dysphagia yielded more homogeneous estimates for some inflammatory markers, suggesting stroke subtype may contribute to heterogeneity.
3.3.7 Incidence of infectious complications
Five of the studies that were considered provided information on the prevalence of infectious complications. The following outcomes were obtained using the heterogeneity test: With chi2 = 1.85, df = 4, p = 0.76, and I2 = 0%, there is no discernible variation among the studies. The fixed-effect model was thus used. According to the meta-analysis, the IG experienced a considerably reduced incidence of infectious complications than the CG (p < 0.05) (Figure 16).
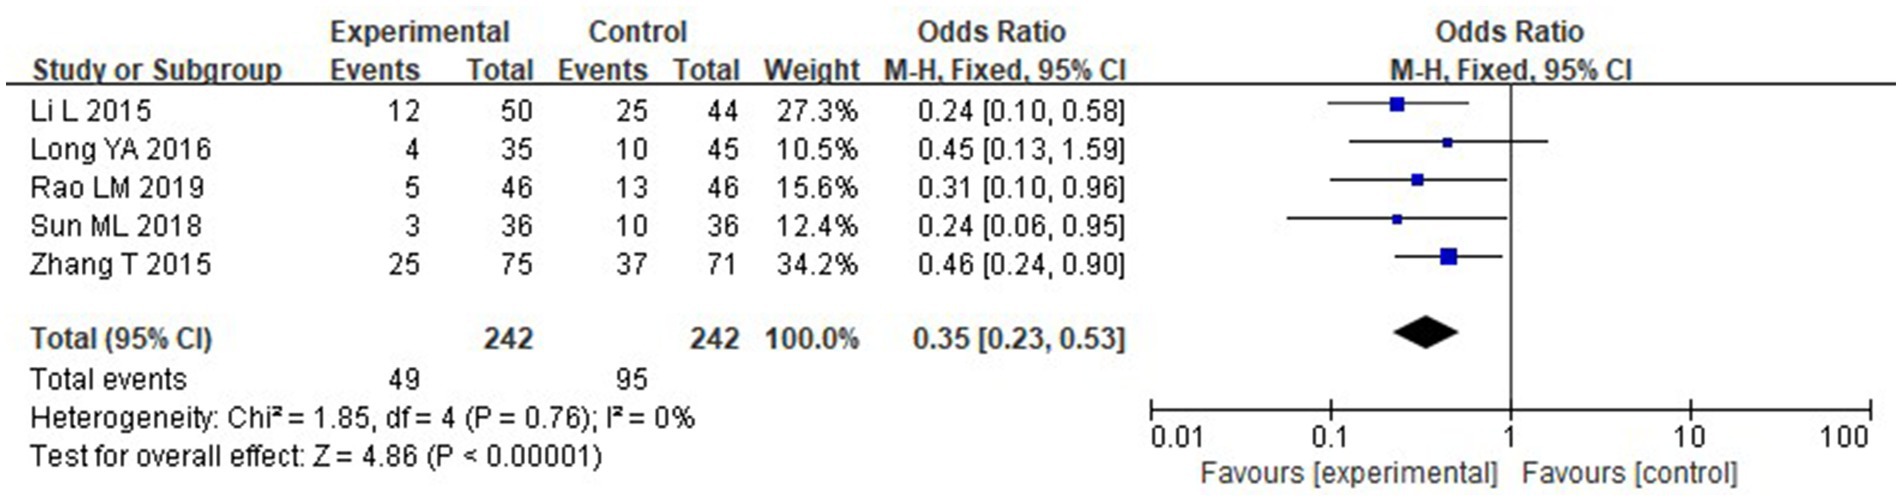
Figure 16. Forest analysis chart comparing the incidence of infection complications in the two groups.
Consistency of definitions and assessment methods for infectious complications, among the five included trials reporting infectious complications, the definitions and diagnostic criteria were not fully standardized. Three studies defined infections based on clinical and laboratory evidence of pneumonia, urinary tract infection, or sepsis, following hospital-based diagnostic criteria (12–14). Two studies (15, 16) did not specify diagnostic criteria in detail but described infection as “fever with elevated inflammatory markers and confirmed bacterial infection.” None of the studies clearly indicated whether microbiological confirmation or radiographic evidence was routinely required.
The assessment timeframes also varied, ranging from hospitalization period only (12, 13) to up to 4 weeks post-treatment (17). Moreover, differences in infection classification (e.g., respiratory vs. systemic infections) were not consistently reported. This inconsistency in definitions and detection methods likely influenced the pooled estimate of infection incidence, despite the statistical homogeneity observed (I2 = 0%).
To improve transparency, a summary of infection assessment definitions across included studies is provided in Table 2.
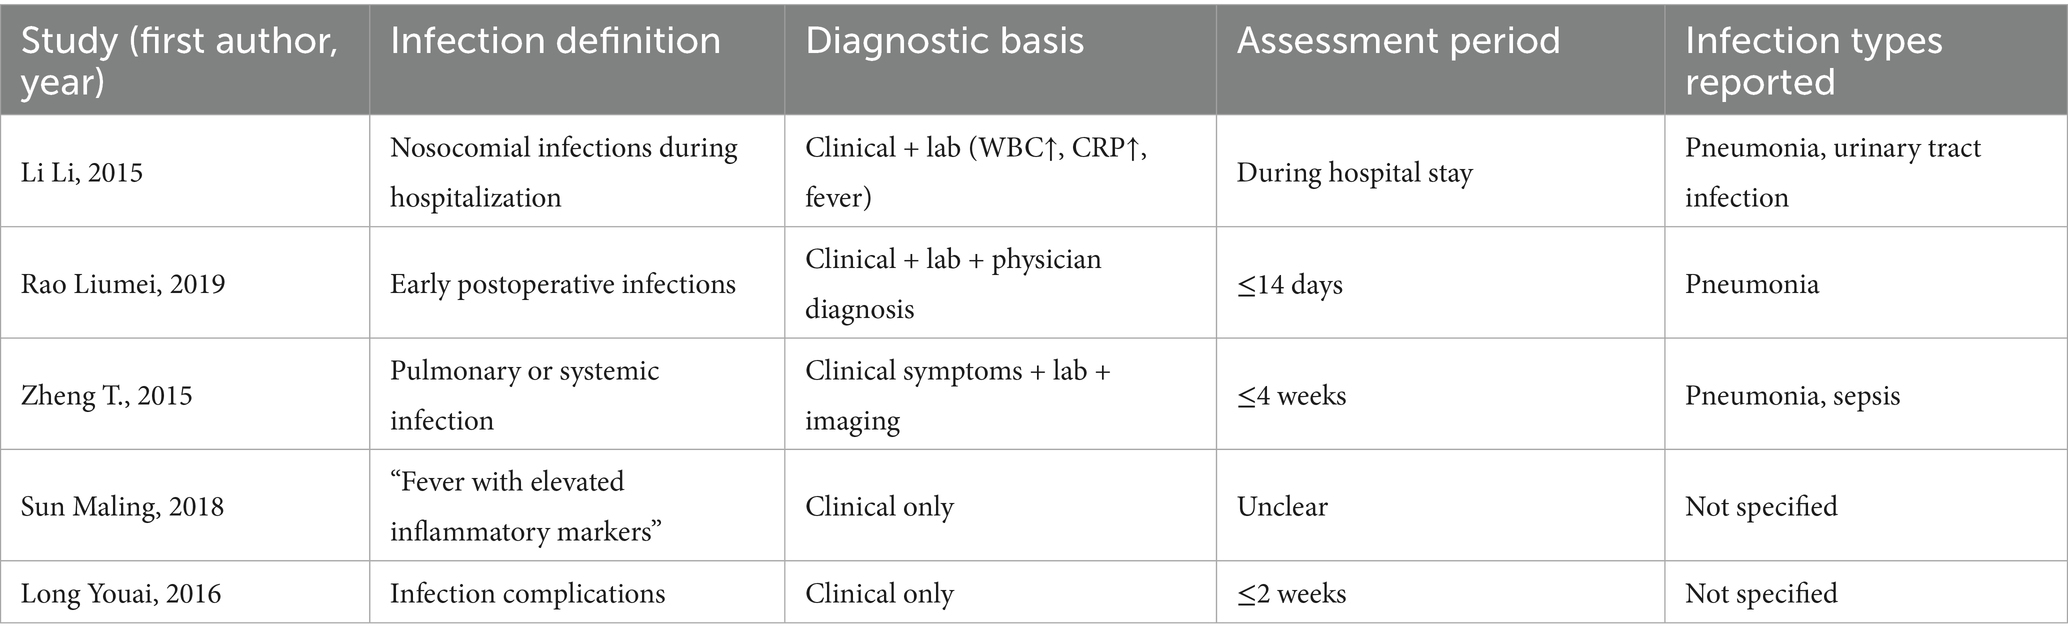
Table 2. Variability in definitions and methods used for assessing infectious complications across included studies.
3.4 Subgroup and sensitivity analyses
To explore potential sources of the considerable heterogeneity (I2 > 95%) observed across several pooled outcomes, subgroup and sensitivity analyses were performed. (1) By nutritional support type: When studies were stratified by intervention type, the EN-only subgroup demonstrated consistent improvements in nutritional (Alb, PA) and immune markers (IgG, IgA) with reduced heterogeneity (I2 ranging from 60 to 75%). In contrast, trials combining enteral and parenteral nutrition (EN + PN) or including immunonutrient supplementation retained high heterogeneity (I2 > 90%), suggesting compositional variability contributed to between-study differences. (2) By stroke type: Subgrouping by stroke subtype (ischemic vs. hemorrhagic) revealed that studies enrolling only hemorrhagic stroke patients (17) showed stronger effects on serum inflammatory cytokines (TNF-α, IL-6 reduction), whereas mixed or ischemic cohorts exhibited moderate effects with persistent heterogeneity (I2 > 85%). (3) By timing of nutritional support: Early nutritional intervention (initiated within 72 h post-stroke) yielded greater improvements in GCS, PA, and IgG levels compared with delayed initiation (>72 h), and heterogeneity was partially attenuated (I2 = 70–80%). These results suggest that intervention timing may explain some between-study variation. (4) Sensitivity analyses: Leave-one-out analyses indicated that no single study disproportionately affected pooled effect sizes. After excluding studies rated as high risk for performance or detection bias, the overall direction and significance of results remained unchanged, though heterogeneity decreased modestly (by 10–15%) for most biochemical outcomes.
Despite these subgroup efforts, residual heterogeneity remained substantial (I2 > 80%) in some outcomes (e.g., IL-2, TNF-α), implying unmeasured methodological and clinical variability. Detailed subgroup results and corresponding forest plots are presented in Supplementary Figures S1–S3.
4 Discussion
Stroke is a neurological disorder resulting from cerebrovascular injury and subsequent brain tissue necrosis, characterized by high incidence and mortality (18). In severe cases, rapid disease progression, impaired consciousness, motor dysfunction, and gastrointestinal dysmotility often lead to dysphagia and negative nitrogen balance (19, 20). The present meta-analysis synthesized data from eight randomized controlled trials evaluating nutritional support combined with conventional therapy in stroke patients. Consistent with prior reports, nutritional intervention significantly improved short-term nutritional and immune indicators (PA, Hb, TLC, IgA, IgG, IgM) and reduced inflammatory cytokines (IL-2, IL-6, TNF-α), thereby lowering infection risk. However, its effect on neurological function as measured by NIHSS was limited, suggesting that the primary benefits of nutritional support occur during early metabolic stabilization rather than direct neurofunctional recovery.
Based on the findings of this meta-analysis, nutritional support demonstrated significant benefits across multiple clinical domains in stroke patients, though with notable variations in treatment effects. The intervention group showed consistent improvements in nutritional biomarkers including hemoglobin, total lymphocyte count, and immunoglobulins, with elevated prealbumin levels indicating effective protein-energy supplementation. These nutritional improvements were accompanied by enhanced immune competence, as evidenced by increased cellular and humoral immunity markers, which likely contributed to the observed reduction in infectious complications. Simultaneously, significant reductions in pro-inflammatory cytokines (IL-2, IL-6, TNF-α) were observed, suggesting effective modulation of the systemic inflammatory response, possibly mediated through immunonutrients such as ω-3 fatty acids and arginine used in some trials. However, neurological outcomes revealed a divergent pattern: while Glasgow Coma Scale scores improved significantly, indicating better consciousness levels potentially related to metabolic stabilization, NIH Stroke Scale scores showed no statistically significant improvement, suggesting that nutritional support may primarily affect arousal and alertness rather than higher-order neurological functions within short-term follow-up periods. Substantial heterogeneity (I2 > 90%) was noted across several outcomes, potentially arising from variations in nutritional support routes, formula compositions, initiation timing, patient characteristics, and control interventions, with studies focusing on hemorrhagic stroke patients demonstrating more pronounced anti-inflammatory effects compared to mixed cohorts.
These results align with previous meta-analyses and clinical studies. Fu et al. (9) and Khoshbonyani et al. (5) also reported that nutritional therapy reduces post-stroke infections and improves metabolic homeostasis, while its influence on long-term neurological outcomes remains modest. Ikezawa et al. (6) similarly observed that early enteral nutrition enhances discharge readiness through improved immune and metabolic status rather than direct neurological repair. Collectively, these findings emphasize that nutritional interventions primarily stabilize systemic metabolism, attenuate inflammation, and prevent complications during the acute phase of stroke.
Nutritional adequacy also plays an essential role in maintaining immune competence and physical performance in healthy populations (21), further underscoring its physiological importance for recovery in stroke patients.
The present analysis identified significant improvement in GCS but only borderline NIHSS changes. This discrepancy reflects the differing physiological domains of the two scales: the GCS assesses consciousness and arousal, which respond to early metabolic stabilization, whereas the NIHSS measures higher-order cortical functions requiring longer neuroplastic recovery. Mechanistically, early nutritional support may improve consciousness via enhanced glucose and lipid metabolism, reduced oxidative stress, and preservation of the blood–brain barrier. In contrast, improvements in motor and language function depend on longer-term neuronal remodeling. Thus, GCS may serve as a sensitive short-term endpoint, while NIHSS remains the benchmark for long-term neurological recovery.
Increases in PA, Hb, and TLC levels confirmed that nutritional support can quickly improve protein–energy malnutrition and immune competence. PA, with its short half-life, sensitively reflects early nutritional improvement; higher Hb suggests correction of inflammatory anemia, and increased TLC reflects restored cellular immunity, contributing to lower infection rates. Enhanced immunoglobulin levels (IgA, IgG, IgM) further indicate strengthened humoral immunity. Meanwhile, the observed reductions in TNF-α, IL-2, and IL-6 suggest that early nutritional therapy attenuates systemic inflammation, thereby preventing further ischemic damage and secondary infection.
Although subgroup analyses by nutrition type, stroke subtype, and timing partially reduced variability, substantial heterogeneity persisted (I2 > 80%). This heterogeneity likely reflects clinical and methodological differences, including formula composition, caloric targets, intervention duration, and patient comorbidities. Variability in measurement protocols and incomplete descriptions of enteral/parenteral ratios and nutrient formulations further limited comparability. Even after sensitivity analyses excluding high-risk studies, heterogeneity remained high, indicating genuine diversity among study designs. Future RCTs should adopt standardized definitions of nutritional interventions and outcome measures to enable more robust quantitative synthesis. The heterogeneity likely arises from: (1) differences in intervention route and composition (EN vs. nasogastric; potential use of immunonutrients), (2) timing and duration of nutritional support (early/acute-phase initiation vs. later; short vs. longer courses), (3) patient mix (hemorrhagic vs. ischemic/mixed; baseline severity and nutritional risk), (4) control care pathways (“conventional care” vs. “family nutrition management”), and (5) assay protocols for laboratory outcomes.
The current review has several limitations that warrant consideration. First, all included RCTs exhibited methodological weaknesses, particularly the absence of blinding and incomplete reporting of follow-up data, which introduces risks of performance and detection bias. Second, substantial heterogeneity was observed across multiple outcomes, which could be attributed to variations in nutritional protocols, patient characteristics, and measurement methods—though prespecified subgroup and sensitivity analyses were performed to explore these sources. Furthermore, inconsistencies in the definitions and assessment methods for infectious complications across the included studies may influence the validity of the pooled estimate for infection incidence, despite the statistical homogeneity observed. Although the beneficial direction of nutritional support was consistently demonstrated, the magnitude of effect may be overestimated. In addition, all studies focused on short-term outcomes (generally 2–4 weeks post-intervention) and lacked long-term follow-up data on critical endpoints such as mortality, functional independence, or quality of life. Finally, the small number of included studies precludes a reliable assessment of publication bias. Consequently, the overall certainty of evidence is judged to be low to very low.
Despite these limitations, the consistent improvement across nutritional, immune, and inflammatory markers indicates a physiologically meaningful benefit during the acute phase of stroke. Future multicenter, blinded RCTs with standardized protocols and long-term follow-up are warranted to confirm these findings and clarify their clinical implications.
5 Conclusion
In summary, the current evidence suggests that nutritional support therapy, as an adjunct to conventional treatment, may confer benefits in improving short-term nutritional status, enhancing immune function, and reducing infectious complications in stroke patients. However, its effects on neuromotor recovery remain inconclusive. These findings must be interpreted with caution due to substantial methodological limitations observed across the included studies, including the absence of blinding, incomplete follow-up reporting, and significant variability in nutritional intervention protocols. The overall certainty of evidence is rated as low to very low. Future rigorously designed randomized controlled trials featuring standardized nutritional regimens, adequate blinding procedures, and longer-term outcome assessments are warranted to validate these preliminary findings and establish evidence-based clinical guidelines.
Author contributions
MZ: Writing – original draft, Methodology, Formal analysis, Data curation. ML: Data curation, Writing – original draft, Investigation, Formal analysis. YD: Writing – original draft, Methodology, Data curation. YZ: Writing – review & editing, Formal analysis. LZ: Writing – original draft, Investigation. XP: Writing – review & editing, Conceptualization.
Funding
The author(s) declare that no financial support was received for the research and/or publication of this article.
Conflict of interest
The authors declare that the research was conducted in the absence of any commercial or financial relationships that could be construed as a potential conflict of interest.
Generative AI statement
The authors declare that no Gen AI was used in the creation of this manuscript.
Any alternative text (alt text) provided alongside figures in this article has been generated by Frontiers with the support of artificial intelligence and reasonable efforts have been made to ensure accuracy, including review by the authors wherever possible. If you identify any issues, please contact us.
Publisher’s note
All claims expressed in this article are solely those of the authors and do not necessarily represent those of their affiliated organizations, or those of the publisher, the editors and the reviewers. Any product that may be evaluated in this article, or claim that may be made by its manufacturer, is not guaranteed or endorsed by the publisher.
Supplementary material
The Supplementary material for this article can be found online at: https://www.frontiersin.org/articles/10.3389/fnut.2025.1642161/full#supplementary-material
Supplementary Figure S1 | Subgroup analysis by nutritional support type (EN vs. EN+PN) for nutritional and immune outcomes.
Supplementary Figure S2 | Subgroup analysis by stroke subtype (hemorrhagic vs. ischemic/mixed) for inflammatory markers.
Supplementary Figure S3 | Sensitivity analyses excluding high-risk-of-bias studies for robustness evaluation.
References
1. Wang, J, Chang, E, and Jiang, Y. Effects of vitamin C stimulation on rehabilitation of dysphagia after stroke: a randomized trial. Eur J Phys Rehabil Med. (2022) 58:558–64. doi: 10.23736/S1973-9087.22.07337-3
2. Zhang, W, Jin, HT, Wang, F, Zhang, JL, Bao, Y, and Wang, S. A randomized controlled study investigating the efficacy of electro-acupuncture and exercise-based swallowing rehabilitation for post-stroke dysphagia: impacts on brainstem auditory evoked potentials and cerebral blood flow. Medicine. (2024) 103:e37464. doi: 10.1097/MD.0000000000037464
3. Zhang, W, Wang, F, Jin, HT, Lu, M, and Yang, J. Clinical effect of "Tong guan Li Qiao" needling method combined with swallowing training in the treatment of post-stroke dysphagia and its influence on surface electromyography and cerebral microcirculation. Zhen Ci Yan Jiu. (2022) 47:1025–30. doi: 10.13702/j.1000-0607.20210974
4. Feng, X, Zhang, T, Wang, N, Qu, X, Qi, M, Zhao, H, et al. Safety and efficacy of glibenclamide on cerebral oedema following aneurysmal subarachnoid haemorrhage: a randomised, double-blind, placebo-controlled clinical trial. Stroke Vasc Neurol. (2024) 9:530–40. doi: 10.1136/svn-2023-002892
5. Khoshbonyani, PA, Ismayilov, IS, and Leyderman, IN. Key problems of nutritional support in patients with ischemic stroke and nontraumatic intracranial hemorrhage. Vopr Pitan. (2020) 89:59–68. doi: 10.24411/0042-8833-2020-10066
6. Ikezawa, K, Hirose, M, Maruyama, T, Yuji, K, Yabe, Y, Kanamori, T, et al. Effect of early nutritional initiation on post-cerebral infarction discharge destination: a propensity-matched analysis using machine learning. Nutr Diet. (2022) 79:247–54. doi: 10.1111/1747-0080.12718
7. Hui, C. Application of nutritional risk assessment combined with individualized enteral nutrition intervention in diet care of coma patients after acute cerebral infarction. Qingdao Med J. (2022) 54:178–80.
8. Wu Runming, SY, and Jiao, A. Effect of early enteral whole protein and short peptide nutritional support on nutritional status of patients with severe cerebral infarction and intervention of peripheral blood Th17/Treg. J Huaihai Med. (2022) 40:616–9.
9. Fu Qizhi, SQ, and Wenna, C. Parenteral combined with enteral sequential nutrition reduces the risk of pulmonary infection and upper gastrointestinal bleeding in patients with severe stroke. Parenter Enter Nutr. (2017) 24:292–5.
10. Alemseged, F, Rocco, A, Arba, F, Schwabova, JP, Wu, T, Cavicchia, L, et al. Posterior National Institutes of Health stroke scale improves prognostic accuracy in posterior circulation stroke. Stroke. (2022) 53:1247–55. doi: 10.1161/STROKEAHA.120.034019
11. Bodien, YG, Barra, A, Temkin, NR, Barber, J, Foreman, B, Vassar, M, et al. Diagnosing level of consciousness: the limits of the Glasgow coma scale Total score. J Neurotrauma. (2021) 38:3295–305. doi: 10.1089/neu.2021.0199
12. Rao Liumei, ZW. Effect analysis of early enteral nutrition nursing treatment for stroke patients. China Foreign Med Treat. (2019) 38:145–7.
13. Li Li, LH. Effect of early enteral nutrition support on inflammatory factors and immune function in patients with severe stroke. J Practi Med. (2015) 31:3912–4.
14. Zheng, T, Zhu, X, Liang, H, Huang, H, Yang, J, and Wang, S. Impact of early enteral nutrition on short term prognosis after acute stroke. J Clin Neurosci. (2015) 22:1473–6. doi: 10.1016/j.jocn.2015.03.028
15. Sun Maling, D. Zeng Xinhua, effect of early enteral nutrition on nitrogen balance, immune function and prognosis in patients with dysphagia after stroke. Health Med Res Pract. (2018) 15:31–5.
16. Youai, L. Clinical effect of early enteral nutrition support in patients with acute stroke. Chin J Clin Rational Drug Use. (2016) 9:99–100.
17. Zhuo Yurong, WJ. Effect of nutritional support therapy under the guidance of nutritional risk screening on nutritional status and rehabilitation process of patients with hemorrhagic stroke complicated with dysphagia. Chin J Prim Med Pharm. (2021) 28:4.
18. Joy, MT, and Carmichael, ST. Encouraging an excitable brain state: mechanisms of brain repair in stroke. Nat Rev Neurosci. (2021) 22:38–53. doi: 10.1038/s41583-020-00396-7
19. Liu, H, Jiang, Y, Wang, N, Yan, H, Chen, L, Gao, J, et al. Scalp acupuncture enhances local brain regions functional activities and functional connections between cerebral hemispheres in acute ischemic stroke patients. Anat Rec. (2021) 304:2538–51. doi: 10.1002/ar.24746
20. Cosentino, G, Todisco, M, Giudice, C, Tassorelli, C, and Alfonsi, E. Assessment and treatment of neurogenic dysphagia in stroke and Parkinson's disease. Curr Opin Neurol. (2022) 35:741–52. doi: 10.1097/WCO.0000000000001117
21. Vecchio, M, Chiaramonte, R, Testa, G, and Pavone, V. Clinical effects of L-carnitine supplementation on physical performance in healthy subjects, the key to success in rehabilitation: a systematic review and Meta-analysis from the rehabilitation point of view. J Funct Morphol Kinesiol. (2021) 6:93. doi: 10.3390/jfmk6040093
22. Qingzhi, D. Effect of early enteral nutrition on serum inflammatory factors and immune function in patients with severe stroke. Sichuan Med J. (2018) 39:776–9.
Keywords: nutritional support therapy, conventional treatment, stroke, long-term prognosis, meta-analysis
Citation: Zhang M, Li M, Ding Y, Zhang Y, Zhang L and Peng X (2025) The impact of nutritional support therapy combined with conventional treatment models on short-term symptom improvement and complications in stroke patients: a systematic review and meta-analysis. Front. Nutr. 12:1642161. doi: 10.3389/fnut.2025.1642161
Edited by:
Mohsen Khosravi, Zahedan University of Medical Sciences, IranCopyright © 2025 Zhang, Li, Ding, Zhang, Zhang and Peng. This is an open-access article distributed under the terms of the Creative Commons Attribution License (CC BY). The use, distribution or reproduction in other forums is permitted, provided the original author(s) and the copyright owner(s) are credited and that the original publication in this journal is cited, in accordance with accepted academic practice. No use, distribution or reproduction is permitted which does not comply with these terms.
*Correspondence: Xiapei Peng, UGVuZ3hpYXBlaUAxNjMuY29t
†These authors have contributed equally to this work and share first authorship