Abstract
Background:
Metabolically obese normal weight (MONW), obesity with a normal body mass index, is often neglected due to the seemingly normal weight but has a high risk of metabolic diseases. This study aimed to assess associations among the triglyceride-glucose (TyG) index, its changes (∆TyG index), and metabolically normal, normal weight (MNNW) to MONW transition via a population-based cohort study.
Methods:
Participants aged 40–65 years in 15 Chinese communities were recruited. A total of 530 participants [mean age: 53.00 (48.00–58.00) years; 346 (65.3%) female participants] with complete data on anthropometry, metabolic indicators, abdominal visceral fat area (VFA), and a normal body mass index (BMI) (18.5 ≤ BMI < 24) were included in the cross-sectional analysis. In total, 253 participants [mean age: 53.00 (48.00–58.00) years; 171 (67.6%) female participants] who had follow-up and maintained a normal BMI were included in the follow-up analysis. MONW was defined as two or more abnormal metabolic components but with a normal BMI. Multivariate logistic regression, Cox proportional hazards regression, and restricted cubic spline regression were used to assess associations among the TyG index, ∆TyG index, and MONW-MONW and MNNW-MONW transition.
Results:
An incrementally higher risk of MONW was observed with the increasing TyG index quartiles in the cross-sectional analysis. The adjusted odds ratio (OR) in the TyG index quartile 4 was 31.81 (95% CI 11.47–88.20) for MONW, and there was a significant MONW risk for TyG >9.04. A positive linear association between the ∆TyG index (p trend = 0.001) instead of the TyG index (p for non-linearity = 0.034) and MNNW-MONW transition was observed. The adjusted hazard ratio (HR) in the TyG index quartile 3 was 2.35 (95% CI 1.02–5.41), and in the ∆TyG index quartile 4 was 3.60 (95% CI 1.48–8.79) for MNNW-MONW transition. Subgroup analyses revealed the correlations among the TyG index, ∆TyG index, and MONW-MONW and MNNW-MONW transition were more evident in individuals with larger VFA, and similar results were obtained in sensitivity analysis.
Conclusion:
The elevated TyG index and ∆TyG index were associated with higher risks of MONW-MONW and MNNW-MONW transition, and these associations were strengthened by VFA. In addition, the ∆TyG index may be a better indicator for predicting MNNW-MONW transition.
Introduction
Metabolically obese normal weight (MONW), a special type of obesity with a normal body mass index (BMI) but symptoms of metabolic dysfunction, adversely affects the lipid profile and blood pressure, intensifies inflammatory, thrombotic processes, and oxidative stress, and has a higher risk of type 2 diabetes, cardiovascular disease (CVD) and all-causes of death compared to metabolically normal, normal weight (MNNW) (1–3). However, surveillance of metabolic indicators and early intervention measures is often neglected in patients with MONW due to the seemingly normal weight. Therefore, early identification of MONW, as well as timely monitoring MNNW-MONW transition via simple and accurate markers could mitigate the metabolic and cardiovascular risks. Nevertheless, literature is limited on MNNW-MONW trajectory; thus, analyzing the risk factors underlying MNNW-MONW transition should be the focus of further research (4–6).
In recent years, the triglyceride-glucose (TyG) index, a composite index composed of fasting triglyceride and fasting glucose, has been proven to be a simple and reliable surrogate biomarker of insulin resistance, even superior to the homeostasis model of assessment-insulin resistance for predicting CVD in the large-scale population (7–10). Furthermore, the TyG index is closely associated with the increased amounts of visceral fat, insulin resistance, and hyperinsulinemia, which are the key parts of the complex and still insufficiently recognized pathogenesis of MONW (11, 12). Therefore, the TyG index and its changes might be effective biomarkers for timely identifying, monitoring, and intervening MNNW-MONW transition and the accompanying CVD risk. This study aimed to explore the role of the TyG index and its changes in the incidence of MONW-MONW and MNNW-MONW transition based on a cohort study in 15 Chinese communities.
Materials and methods
Study participants
The population-based cohort study recruited individuals aged 40 to 65 years with at least 5 years of residency on the basis of the stratified cluster random sampling method from 15 communities of Caihe Street in Hangzhou, Zhejiang Province, China, while excluding following participants: (1) previous cardiovascular events, (2) oral or intravenous corticosteroids, (3) cirrhosis and ascites, (4) known hyperthyroidism or hypothyroidism, (5) malignant tumor, (6) severe disability or mental illness, and (7) pregnant and lactating women, and the baseline investigation was performed between March and May 2010, while the follow-up was carried out in 2013 and 2015, as documented previously (13). Finally, a total of 1,181 Chinese Han participants were enrolled in the baseline investigation. The current study was a further analysis of the above population-based cohort study. The inclusion criteria for the baseline cross-sectional analysis of the current study were as follows: (1) had complete data on anthropometry and fasting blood glucose (FBG), (2) underwent abdominal magnetic resonance imaging (MRI) examination, and (3) had 18.5 ≤ BMI < 24 (normal BMI range was based on the criteria of the Working Group on Obesity in China (14)). Participants with poor image quality due to motion artifacts were excluded. In the follow-up analysis of MNNW-MONW transition, in addition to the inclusion and exclusion criteria in the cross-sectional analysis, we further excluded participants who (1) were lost to follow-up and (2) had a BMI <18.5 or ≥24 at the follow-up (Figure 1).
Figure 1
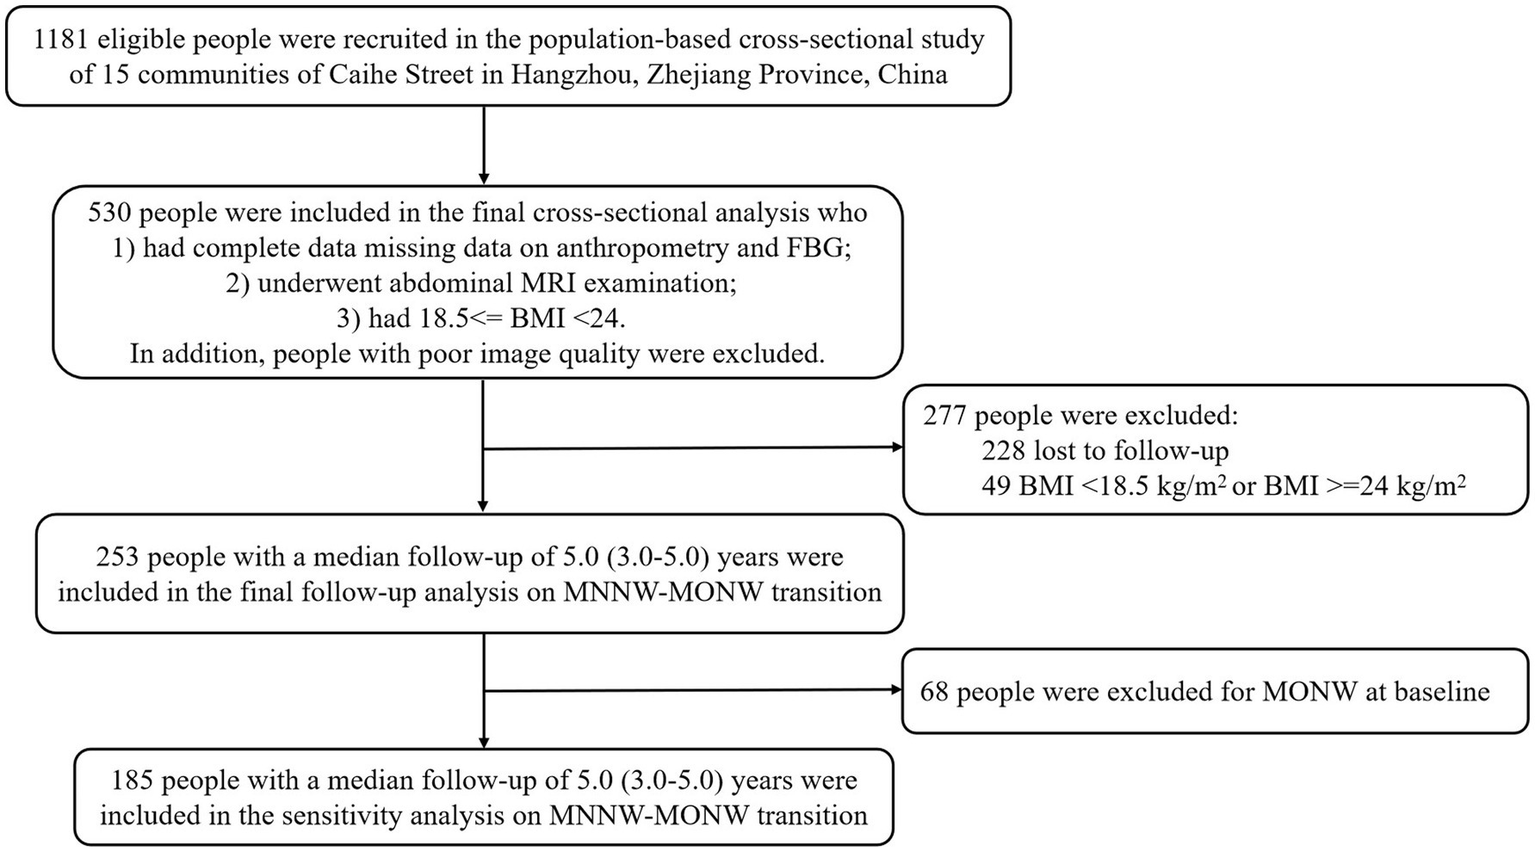
Flowchart of study participant enrollment. FBG, fasting blood glucose; MRI, magnetic resonance imaging; BMI, body mass index; MNNW, metabolically normal, normal weight; MONW, metabolically obese, normal weight.
Data collection
Demographic characteristics, medical history, and lifestyle risk factors were obtained via rigorous standardized questionnaires and through quality control systems by trained medical investigators: age, sex, medical history of diabetes mellitus (DM) and hypertension, smoking status, alcohol consumption, and physical activity. Smoking status was classified as non-smoker, ex-smoker, or current smoker. Alcohol consumption was categorized as no drinking (none), less than three times a month (mild), or three or more times a month (heavy). Exercise data were collected via the International Physical Activity Questionnaire Short Form (IPAQ-SF), and physical activity was categorized as low, moderate, or high levels according to the criteria of the IPAQ Research Committee (15).
Basic anthropometric data, including weight, height, waist circumference, and blood pressure, were measured via established techniques by trained staff, as described previously (16). In brief, weight was measured in a fasting state without shoes and wearing light clothes. Height was measured when participants took off the shoes and stood upright. Waist circumference was measured by a tape measure at the midpoint between the lower border of the rib cage and the iliac crest. Blood pressure was measured in triplicate using a mercury sphygmomanometer in Sir Run Run Shaw Hospital, and the average of the three measurements was recorded. After at least 10 h of overnight fasting, whole-blood and serum samples were collected from all participants. Blood samples were measured in the central laboratory of Sir Run Run Shaw Hospital for the 75-g oral glucose tolerance test (OGTT). FBG, 2-h post-load plasma glucose (2hPG), total cholesterol, triglyceride, high-density lipoprotein cholesterol (HDL-C), and low-density lipoprotein cholesterol (LDL-C) were measured with enzymatic method by auto analyzer (Aeroset, Chicago, IL, United States).
Abdominal subcutaneous fat area (SFA) and visceral fat area (VFA) at the umbilical level between L4 and L5 were scanned with MRI examination using a Signa 1.5 T MRI device equipped with an abdominal coil (SMT-100; Shimadzu Corp., Kyoto, Japan) and analyzed via SliceOmatic image analysis software (version 5) on the basis of 2-D pixels in DICOM images fitting the “adipose shading threshold.”
Definition and diagnosis
DM was defined as self-reported DM, any treatment for DM, or those newly diagnosed based on OGTT in this survey. Hypertension was defined as self-reported hypertension, any treatment for hypertension, or systolic blood pressure (SBP) ≥140 mmHg, or diastolic blood pressure (DBP) ≥90 mmHg in this survey. BMI was calculated as weight (kg) divided by the square of height (m2). eGFR was calculated using the modified Modification of Diet in Renal Disease equation: eGFR = 175 × Scr (mg/dL) − 1.234 × Age−0.179 × 1 (male) or 175 × Scr (mg/dL) − 1.234 × Age−0.179 × 0.79 (female) (17). Remnant cholesterol concentration was calculated as the total cholesterol concentration minus the LDL-C concentration minus the HDL-C concentration (18). The TyG index was calculated as ln[triglyceride (mg/dL) × FBG (mg/dL)/2] (19). The ∆TyG index was defined as (the TyG index at follow-up—the TyG index at baseline)/the TyG index at baseline × 100%.
General obesity was defined by BMI according to the criteria of the Working Group on Obesity in China (14). Obesity was defined as BMI ≥28, overweight as 24 ≤ BMI < 28, and normal weight as 18.5 ≤ BMI < 24. Metabolically abnormal components included (1) elevated triglyceride (≥1.7 mmol/L) or treatment with lipid-lowering therapy; (2) low HDL-C (male participants <1.04 mmol/L, female participants <1.29 mmol/L); (3) elevated SBP (≥130 mmHg) or DBP (≥85 mmHg), and (or) confirmed hypertension and (or) treatment with antihypertensive therapy; (4) FBG ≥110 mg/dL or 2hPG ≥140 mg/dL, and (or) diagnosis of DM and (or) treatment with antidiabetic therapy (20, 21). Metabolic obesity was defined as two or more abnormal components, while metabolic normality was defined as ≤1 abnormal component (22, 23). The transitions between MNNW and MONW were categorized into four groups: MNNW-MNNW was defined as MNNW at baseline and throughout the follow-up, MNNW-MONW as MNNW at baseline and MONW at any point during the follow-up, MONW-MONW as MONW at both baseline and the last follow-up, and MONW-MNNW as MONW at baseline and MNNW throughout the follow-up.
Statistical analysis
Baseline characteristic data were expressed as mean ± standard deviation (SD) for continuous variables with the normal distribution or median (25th–75th percentiles) for continuous variables without the normal distribution and as number (percentage or frequency) for categorical variables. Participant characteristics were stratified by the baseline TyG index quartiles, and comparisons between groups used the χ2 test for categorical variables, or one-way analysis of variance test (ANOVA) or Kruskal–Wallis test as appropriate for continuous variables. Multivariate logistic regression models were used to assess odds ratios (ORs) and 95% confidence intervals (CIs) for the associations between the TyG index quartiles and the incidence of MONW in the baseline cross-sectional analysis. The associations between the TyG index quartiles, the ∆TyG index quartiles, and the risk of MNNW-MONW transition in the follow-up analysis were investigated using quartile 1 as the reference category via Cox proportional hazards regression models, and the results were reported as hazard ratios (HRs) with 95% CIs. Collinearity was identified by variance inflation factor (VIF) >10. Three regression models were constructed: model 1 was unadjusted; model 2 was adjusted for age and sex; and model 3 was adjusted for age, sex, BMI, waist circumference, VFA, body fat content, remnant cholesterol, smoking status, alcohol consumption, physical activity, hypertension, and DM (All VIFs were less than 10).
Subgroup analyses and interaction testing were also performed stratified by age, sex, remnant cholesterol, and VFA at baseline to explore the potential modifying effects on the basis of likelihood ratio tests. Age and sex were classified into two groups: <55 and ≥55 years, and male and female groups, respectively; remnant cholesterol and VFA were categorized into four groups according to quartiles. Considering the small amount of the study sample size, in these subgroup analyses, the ORs (95% CI) of the association between the TyG index and MONW, and the HRs (95% CI) of the associations between the TyG index, ∆TyG index, and MNNW-MONW transition were based on the analysis of the TyG index and the ∆TyG index as continuous variables.
We used restricted cubic spline (RCS) regression with five knots at the 5th, 35th, 50th, 65th, and 95th centiles (reference is the 5th percentile) to test the potential non-linearity and flexibly model the association of the TyG index with MONW in the cross-sectional analysis and the TyG and ∆TyG index with MNNW-MONW transition in the follow-up analysis. In the spline models, age, sex, BMI, waist circumference, VFA, body fat content, remnant cholesterol, smoking status, alcohol consumption, physical activity, hypertension, and DM were adjusted.
To minimize the possible influence of pre-existing MONW on the associations between the TyG index quartiles, ∆TyG index quartiles, and the risk of MNNW-MONW transition, we also performed sensitivity analysis excluding individuals who were MONW at baseline. All statistical analyses were performed via SPSS Statistics 26.0 (IBM Corp., Armonk, NY, United States) and R software.1 Statistical significance was defined as a two-tailed p < 0.05.
Results
Cross-sectional analysis
A total of 530 eligible participants were included in the final baseline cross-sectional analysis, with 184 male and 346 female participants. Participant characteristics stratified by the TyG index quartiles are presented in Table 1. Participants in the higher quartile (quartile 4) of the TyG index were more likely to be male and had a less favorable metabolic profile than those in the lower quartiles. Participants in quartile 4 exhibited higher levels of BMI, waist circumference, blood pressure, FBG, total cholesterol, triglyceride, LDL-C, VFA, and remnant cholesterol and lower levels of HDL-C. Current smokers, heavy drinkers, and DM were also more prevalent in quartile 4 than in quartile 1.
Table 1
| TyG index | |||||
|---|---|---|---|---|---|
| Quartile 1 n = 132 | Quartile 2 n = 133 | Quartile 3 n = 133 | Quartile 4 n = 132 | p | |
| Age, years | 51.00 (47.00–56.00) | 53.00 (47.00–57.00) | 55.00 (48.50–58.00) | 55.00 (48.00–59.00) | 0.014 |
| Sex, n (%) | <0.001 | ||||
| Male | 39 (29.5) | 36 (27.1) | 43 (32.3) | 66 (50.0) | |
| Female | 93 (70.5) | 97 (72.9) | 90 (67.7) | 66 (50.0) | |
| BMI (kg/m2) | 21.03 (19.98–22.30) | 21.57 (20.49–22.87) | 22.32 (21.05–23.23) | 22.59 (21.13–23.20) | <0.001 |
| Waist circumference (cm) | 70.25 (68.00–75.00) | 72.00 (68.00–76.00) | 74.50 (70.00–79.00) | 78.75 (72.50–82.00) | <0.001 |
| SBP (mm Hg) | 118.00 (110.00–124.75) | 120.00 (110.00–130.00) | 120.00 (110.00–134.00) | 120.00 (112.00–138.00) | <0.001 |
| DBP (mm Hg) | 80.00 (70.00–80.00) | 80.00 (70.00–81.50) | 80.00 (70.00–86.00) | 80.00 (76.50–90.00) | <0.001 |
| FBG (mg/dL) | 82.00 (77.00–88.00) | 84.00 (79.00–90.00) | 90.00 (83.00–98.00) | 92.00 (84.00–108.00) | <0.001 |
| Total cholesterol (mg/dL) | 198.00 (172.00–218.25) | 208.00 (184.00–230.00) | 220.00 (192.00–250.50) | 234.00 (206.00–258.75) | <0.001 |
| HDL-C (mg/dL) | 65.00 (56.25–76.00) | 61.00 (55.00–69.50) | 55.00 (49.00–62.00) | 50.00 (40.25–55.00) | <0.001 |
| LDL-C (mg/dL) | 85.00 (70.50–94.00) | 89.00 (77.00–101.00) | 97.00 (82.50–111.00) | 99.00 (81.00–113.75) | <0.001 |
| Triglyceride (mg/dL) | 62.50 (52.00–70.00) | 93.00 (84.50–103.00) | 122.00 (111.00–138.50) | 192.00 (164.00–235.00) | <0.001 |
| eGFR (mL/min per 1·73 m2) | 103.32 (91.14–109.28) | 104.11 (89.91–109.96) | 102.27 (88.24–109.81) | 102.92 (96.06–115.59) | 0.248 |
| VFA (cm2) | 43.46 (29.72–61.63) | 51.23 (34.89–66.09) | 61.42 (45.18–78.56) | 73.63 (57.67–107.65) | <0.001 |
| SFA (cm2) | 137.15 (104.65–175.65) | 139.60 (106.55–182.20) | 144.70 (109.20–183.80) | 127.15 (107.10–158.38) | 0.473 |
| Body fat content, (%) | 25.90 (21.85–28.50) | 27.40 (23.15–30.75) | 27.00 (23.55–31.10) | 26.60 (23.60–30.75) | 0.051 |
| Remnant cholesterol (mg/dL) | 46.00 (37.25–57.00) | 57.00 (49.00–65.50) | 67.00 (58.00–79.50) | 81.50 (68.25–98.75) | <0.001 |
| TyG index | 7.85 (7.69–7.97) | 8.27 (8.17–8.36) | 8.64 (8.55–8.72) | 9.12 (8.95–9.43) | <0.001 |
| MONW, n (%) | 8 (6.1) | 10 (7.5) | 33 (24.8) | 102 (77.3) | <0.001 |
| Smoking status, n (%) | <0.001 | ||||
| Non-smoker | 105 (79.5) | 104 (78.2) | 104 (78.2) | 78 (59.1) | |
| Ex-smoker | 5 (3.8) | 4 (3.0) | 2 (1.5) | 8 (6.1) | |
| Current smoker | 22 (16.7) | 25 (18.8) | 27 (20.3) | 46 (34.8) | |
| Alcohol consumption, n (%) | 0.016 | ||||
| None | 89 (67.4) | 83 (62.4) | 80 (60.2) | 65 (49.2) | |
| Mild | 22 (16.7) | 27 (20.3) | 26 (19.5) | 33 (25.0) | |
| Heavy | 21 (15.9) | 23 (17.3) | 27 (20.3) | 34 (25.8) | |
| Hypertension, n (%) | 13 (9.8) | 26 (19.5) | 38 (28.6) | 34 (25.8) | 0.117 |
| DM, n (%) | 3 (2.3) | 2 (1.5) | 19 (14.3) | 22 (16.7) | <0.001 |
| Physical activity, n (%) | 0.202 | ||||
| Low | 21 (15.9) | 28 (21.1) | 23 (17.3) | 33 (25.0) | |
| Moderate | 68 (51.5) | 66 (49.6) | 68 (51.1) | 64 (48.5) | |
| High | 43 (32.6) | 39 (29.3) | 42 (31.6) | 35 (26.5) | |
Baseline characteristics of study participants according to the TyG index quartiles in the cross-sectional analysis.
TyG index, triglyceride-glucose index; BMI, body mass index; SBP, systolic blood pressure; DBP, diastolic blood pressure; FBG, fasting blood glucose; HDL-C, high-density lipoprotein cholesterol; LDL-C, low-density lipoprotein cholesterol; eGFR, estimated glomerular filtration rate; VFA, visceral fat area; SFA, subcutaneous fat area; MONW, metabolically obese, normal weight; DM, diabetes mellitus.
The prevalence of MONW progressively increased with the higher TyG index quartiles (6.1, 7.5, 24.8, and 77.3%, respectively). An incrementally higher risk of MONW was observed with the increasing TyG index quartiles compared with quartile 1 in all models (p trend <0.001). In the fully adjusted model (model 3), the adjusted OR in the TyG index quartile 4 was 31.81 (95% CI 11.47–88.20) for MONW (Table 2). The RCS model revealed a J-shaped association between the TyG index and risk of MONW (p for non-linearity <0.001), with a significant MONW risk for TyG >9.04 (Figure 2A). Subgroup analyses and interaction testing indicated the association between the TyG index and MONW differed significantly across age, sex, remnant cholesterol, and VFA subgroups and an incrementally higher MONW risk with higher remnant cholesterol and VFA quartiles (Figure 2B).
Table 2
| n (%) | OR (95% CI) | p | p trend | OR (95% CI) | p | p trend | OR (95% CI) | p | p trend | |
|---|---|---|---|---|---|---|---|---|---|---|
| Model 1 | Model 2 | Model 3 | ||||||||
| Quartile 1 | 8 (6.1) | Ref | Ref | Ref | ||||||
| Quartile 2 | 10 (7.5) | 1.26 (0.48–3.30) | 0.638 | 1.24 (0.47–3.25) | 0.667 | 0.97 (0.34–2.75) | 0.958 | |||
| Quartile 3 | 33 (24.8) | 5.12 (2.26–11.57) | <0.001 | 4.78 (2.10–10.86) | <0.001 | 2.41 (0.94–6.21) | 0.069 | |||
| Quartile 4 | 102 (77.3) | 52.70 (23.15–119.98) | <0.001 | 48.25 (21.10–110.34) | <0.001 | 31.81 (11.47–88.20) | <0.001 | |||
| Overall | 153 (28.9) | 4.90 (3.68–6.51) | <0.001 | 4.71 (3.54–6.28) | <0.001 | 4.02 (2.82–5.73) | <0.001 | |||
Risk of MONW across the TyG index quartiles in the cross-sectional analysis.
Model 1: unadjusted.
Model 2: adjusted for age and sex.
Model 3: adjusted for age, sex, BMI, waist circumference, VFA, body fat content, remnant cholesterol, smoking status, alcohol consumption, physical activity, hypertension, and DM.
p trend <0.05 indicated the higher TyG index, the greater risk of MONW.
MONW, metabolically obese, normal weight; TyG index, triglyceride-glucose index; OR, odds ratio; CI, confidence interval; BMI, body mass index; VFA, visceral fat area; DM, diabetes mellitus.
Figure 2
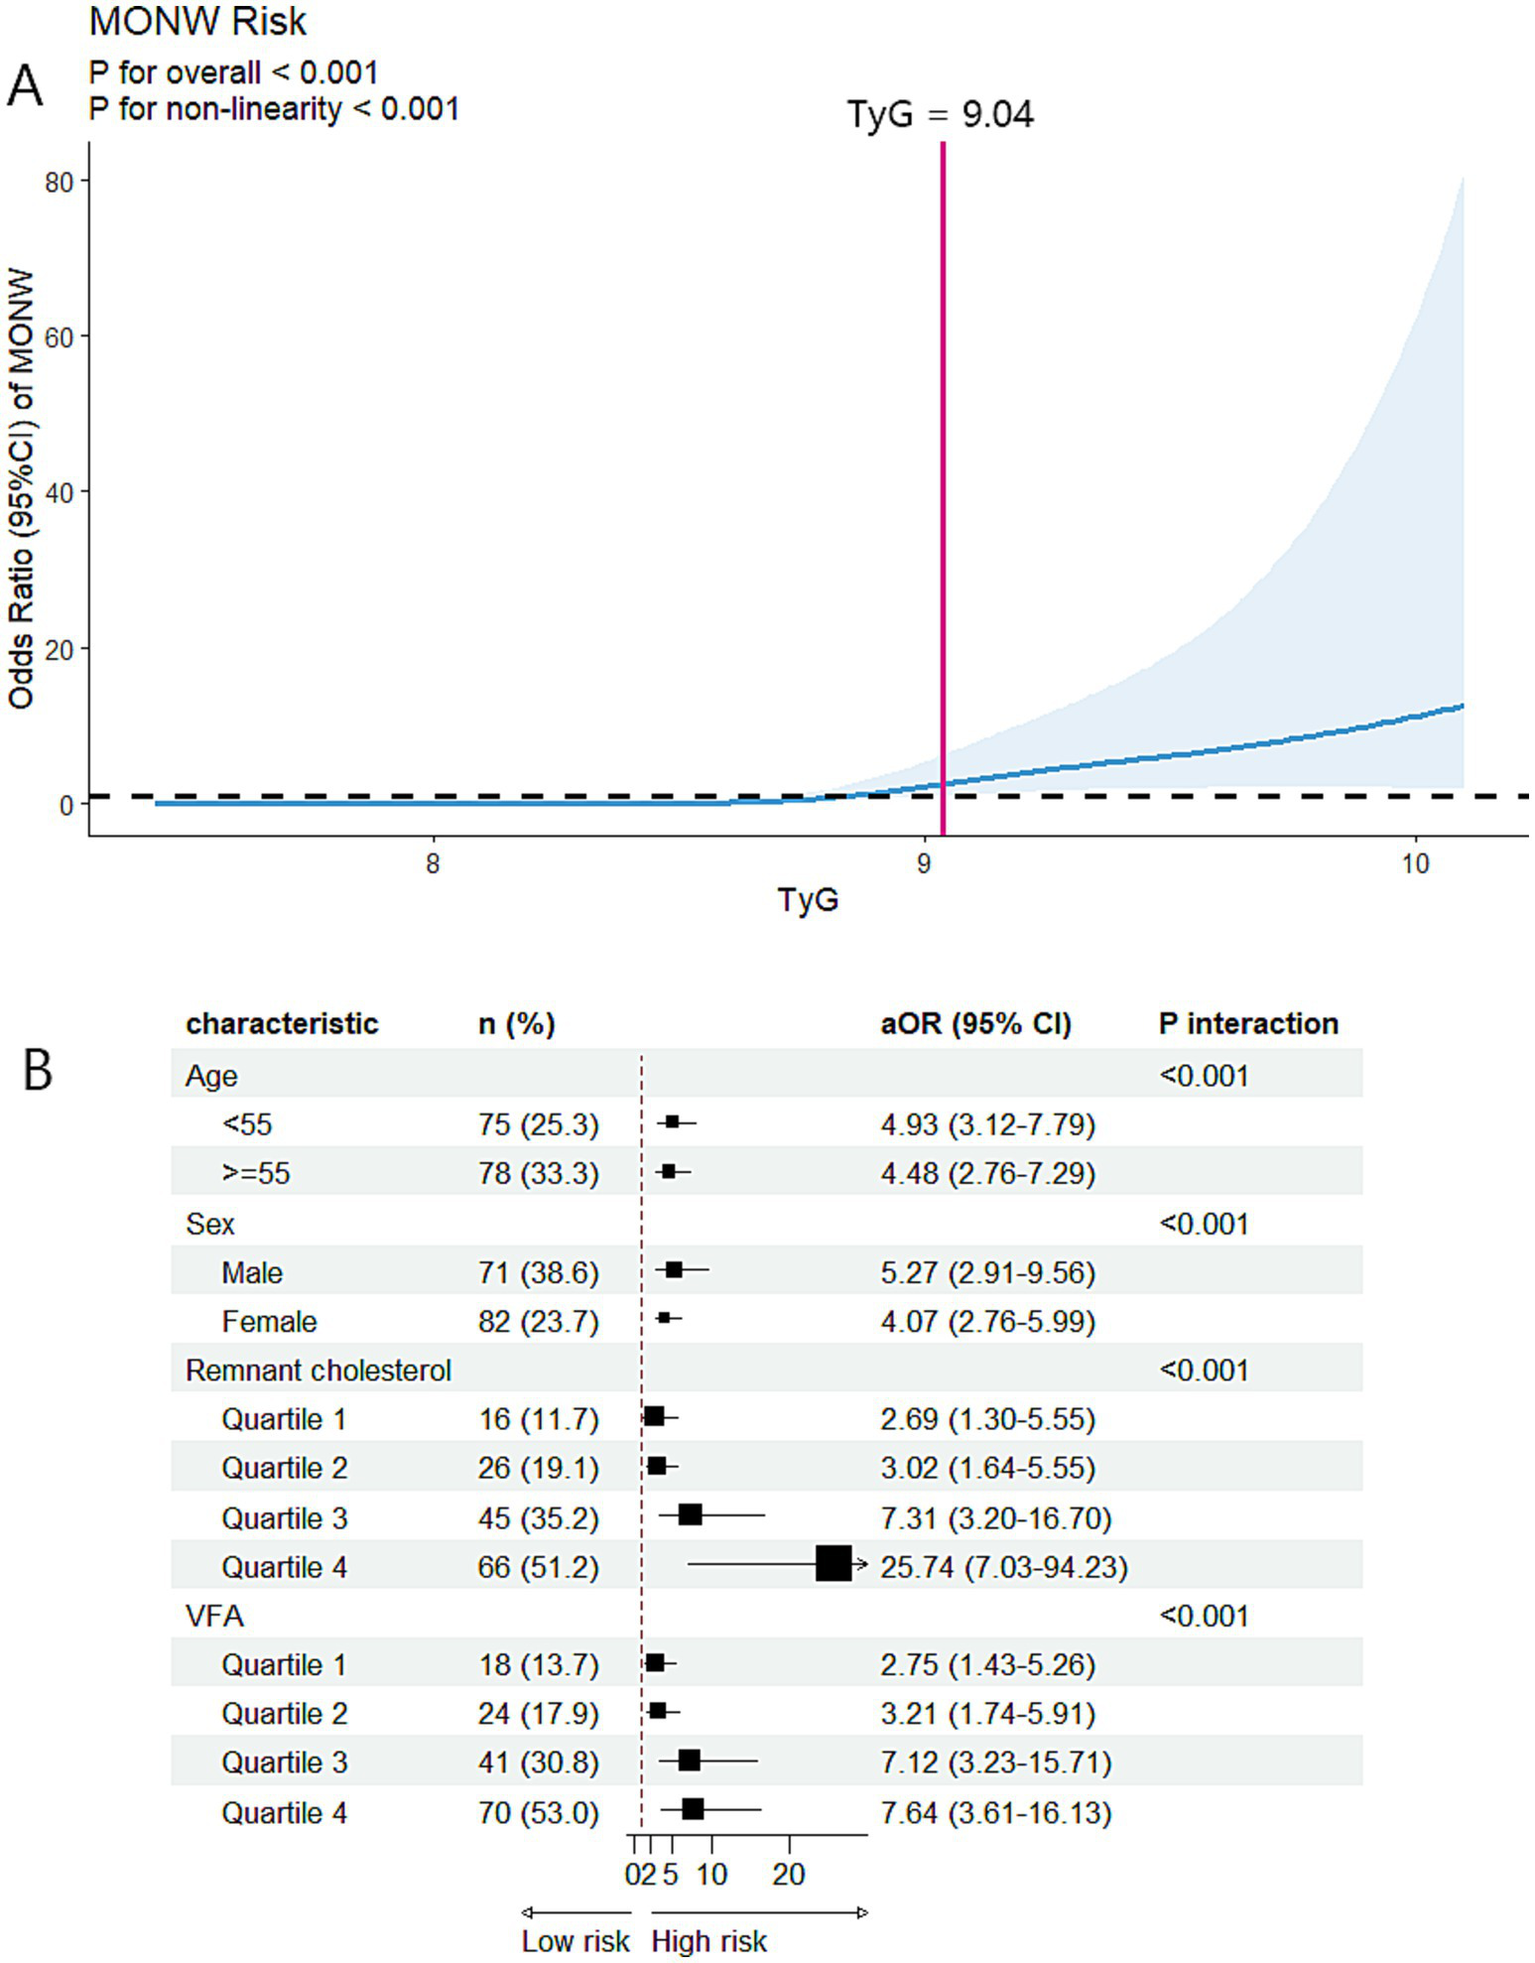
Associations between the TyG index and MONW in the cross-sectional analysis. (A) Restricted cubic spline regression analysis of the TyG index with MONW. The model was conducted with 5 knots at 5th, 35th, 50th, 65th, and 95th centiles of the TyG index (reference is the 5th centile). The ORs (95% CI) were adjusted for age, sex, BMI, waist circumference, smoking status, alcohol consumption, physical activity, hypertension, and DM. Solid lines indicate ORs, and shadow shapes indicate 95% CIs. (B) Subgroup analysis of the association between the TyG index and MONW. The aORs (95% CI) were estimated using logistic regression models adjusted for age, sex, BMI, waist circumference, smoking status, alcohol consumption, physical activity, hypertension, and DM. p interaction <0.05 indicated that the association between the TyG index and MONW differed significantly across subgroups. MONW, metabolically obese, normal weight; TyG index, triglyceride-glucose index; BMI, body mass index; DM, diabetes mellitus; aOR, adjusted odds ratio; CI, confidence interval; VFA, visceral fat area.
Follow-up analysis
A total of 253 eligible participants, including 82 male participants and 171 female participants, were included in the final follow-up analysis. Baseline participant characteristics stratified by the baseline TyG index quartiles are presented in Table 3 and were similar to the characteristics of the participants in the baseline cross-sectional analysis.
Table 3
| Baseline TyG index | |||||
|---|---|---|---|---|---|
| Quartile 1 n = 63 | Quartile 2 n = 63 | Quartile 3 n = 64 | Quartile 4 n = 63 | p | |
| Age, years | 50.00 (47.00–54.00) | 53.00 (47.00–57.00) | 55.00 (50.25–58.00) | 55.00 (50.00–59.00) | 0.006 |
| Sex, n (%) | 0.011 | ||||
| Male | 18 (28.6) | 15 (23.8) | 18 (28.1) | 31 (49.2) | |
| Female | 45 (71.4) | 48 (76.2) | 46 (71.9) | 32 (50.8) | |
| BMI (kg/m2) | 20.85 (19.87–21.94) | 21.21 (20.49–22.44) | 21.97 (20.98–22.89) | 22.18 (21.12–22.99) | <0.001 |
| Waist circumference (cm) | 70.00 (67.00–75.00) | 72.00 (68.00–74.50) | 73.00 (69.25–78.75) | 78.00 (73.50–82.00) | <0.001 |
| SBP (mm Hg) | 118.00 (110.00–124.00) | 120.00 (105.00–130.00) | 120.00 (112.00–130.00) | 120.00 (118.00–138.00) | 0.006 |
| DBP (mm Hg) | 80.00 (70.00–80.00) | 80.00 (70.00–84.00) | 80.00 (72.00–87.50) | 80.00 (78.00–90.00) | 0.033 |
| FBG (mg/dL) | 83.00 (79.00–89.00) | 85.00 (80.00–90.00) | 90.50 (83.00–98.75) | 93.00 (84.00–112.00) | <0.001 |
| Total cholesterol (mg/dL) | 198.00 (168.00–216.00) | 202.00 (183.00–224.00) | 226.00 (196.25–254.00) | 227.00 (206.00–248.00) | <0.001 |
| HDL-C (mg/dL) | 65.00 (57.00–76.00) | 62.00 (51.00–71.00) | 56.50 (50.00–62.00) | 50.00 (40.00–54.00) | <0.001 |
| LDL-C (mg/dL) | 84.00 (63.00–93.00) | 88.00 (76.00–101.00) | 99.50 (88.25–111.75) | 94.00 (78.00–109.00) | <0.001 |
| Triglyceride (mg/dL) | 60.00 (51.00–67.00) | 87.00 (77.00–100.00) | 115.50 (109.00–130.50) | 193.00 (154.00–235.00) | <0.001 |
| eGFR (mL/min per 1·73 m2) | 102.56 (91.06–107.77) | 106.21 (92.49–113.23) | 99.34 (86.67–107.08) | 101.98 (95.77–116.60) | 0.126 |
| VFA (cm2) | 41.40 (28.36–54.95) | 53.30 (35.87–71.72) | 60.08 (34.14–77.54) | 73.00 (58.94–105.80) | <0.001 |
| SFA (cm2) | 141.50 (102.90–180.30) | 139.60 (112.30–165.20) | 146.05 (107.20–183.03) | 119.60 (102.10–158.40) | 0.647 |
| Body fat content, (%) | 25.90 (21.70–28.00) | 27.80 (24.00–30.90) | 27.30 (22.90–30.95) | 26.70 (24.10–30.90) | 0.024 |
| Remnant cholesterol (mg/dL) | 43.00 (33.00–58.00) | 54.00 (45.00–63.00) | 67.50 (59.00–79.00) | 80.00 (67.00–98.00) | <0.001 |
| Baseline TyG index | 7.84 (7.63–7.92) | 8.23 (8.13–8.33) | 8.59 (8.48–8.68) | 9.10 (8.90–9.49) | <0.001 |
| MNNW-MNNW, n (%) | 51 (81.0) | 42 (66.7) | 27 (42.2) | 8 (12.7) | <0.001 |
| MNNW-MONW, n (%) | 10 (15.9) | 14 (22.2) | 24 (37.5) | 9 (14.3) | 0.007 |
| MONW-MONW, n (%) | 1 (1.6) | 6 (9.5) | 11 (17.2) | 39 (61.9) | <0.001 |
| MONW-MNNW, n (%) | 1 (1.6) | 1 (1.6) | 2 (3.1) | 7 (11.1) | 0.009 |
| Smoking status, n (%) | 0.020 | ||||
| Non-smoker | 50 (79.4) | 53 (84.1) | 54 (84.4) | 39 (61.9) | |
| Ex-smoker | 2 (3.2) | 1 (1.6) | 0 (0.0) | 5 (7.9) | |
| Current smoker | 11 (17.5) | 9 (14.3) | 10 (15.6) | 19 (30.2) | |
| Alcohol consumption, n (%) | 0.698 | ||||
| None | 43 (68.3) | 42 (66.7) | 41 (64.1) | 35 (55.6) | |
| Mild | 9 (14.3) | 11 (17.5) | 13 (20.3) | 12 (19.0) | |
| Heavy | 11 (17.5) | 11 (15.9) | 22 (34.4) | 16 (25.4) | |
| Hypertension, n (%) | 4 (6.3) | 16 (25.4) | 38 (28.6) | 21 (33.3) | 0.001 |
| DM, n (%) | 0 (0.0) | 4 (6.3) | 7 (10.9) | 11 (17.5) | 0.005 |
| Physical activity, n (%) | 0.264 | ||||
| Low | 8 (12.7) | 17 (27.0) | 9 (14.1) | 12 (19.0) | |
| Moderate | 32 (50.8) | 30 (47.6) | 38 (59.4) | 29 (46.0) | |
| High | 23 (36.5) | 16 (25.4) | 17 (26.6) | 22 (34.9) | |
Baseline characteristics of study participants according to the TyG index quartiles in the follow-up analysis.
TyG index, triglyceride-glucose index; BMI, body mass index; SBP, systolic blood pressure; DBP, diastolic blood pressure; FBG, fasting blood glucose; HDL-C, high-density lipoprotein cholesterol; LDL-C, low-density lipoprotein cholesterol; eGFR, estimated glomerular filtration rate; VFA, visceral fat area; SFA, subcutaneous fat area; MNNW, metabolically normal, normal weight; MONW, metabolically obese, normal weight; DM, diabetes mellitus.
Furthermore, during a median follow-up of 5.0 (3.0–5.0) years, MNNW-MNNW, MNNW-MONW, MONW-MONW, and MONW-MNNW transitions occurred in 128 (50.6%), 57 (22.5%), 57 (22.5%), and 11 (4.3%) participants, respectively. The proportions of MONW-MONW and MONW-MNNW transition progressively increased with the increasing TyG index quartiles; however, the proportion of MNNW-MNNW progressively decreased with the increasing TyG index quartiles. Furthermore, the association between the TyG index and MNNW-MONW transition was not linear, with the highest MNNW-MONW transition occurring in the TyG index quartile 3 and the lowest occurring in quartile 4. In the fully adjusted model (model 3), the adjusted HR in the TyG index quartile 3 was 2.35 (95% CI 1.02–5.41) for MNNW-MONW transition (Table 4). In contrast, a positive linear association between the ∆TyG index quartiles and MNNW-MONW transition was observed in all models (p trend = 0.001), and in the fully adjusted model (model 3), the adjusted HR in the ∆TyG index quartile 4 was 3.60 (1.48–8.79) for the transition of MNNW-MONW (Table 4). In the RCS model, there was an n-shaped association between the TyG index and risk of MNNW-MONW transition (p for non-linearity = 0.034), with a significant MNNW-MONW transition risk for baseline TyG index between 8.41 and 8.51 (Figure 3A). Consistent with the results of the Cox proportional hazards regression model to fit the association between the ∆TyG index and MNNW-MONW transition, the RCS model also showed a linear association (p for non-linearity = 0.822), with a significant MNNW-MONW transition risk for ∆TyG index >6.94% (Figure 3B).
Table 4
| n (%) | HR (95% CI) | p | p trend | HR (95% CI) | p | p trend | HR (95% CI) | p | p trend | |
|---|---|---|---|---|---|---|---|---|---|---|
| Model 1 | Model 2 | Model 3 | ||||||||
| TyG index | ||||||||||
| Quartile 1 | 10 (15.9) | Ref. | Ref. | Ref. | ||||||
| Quartile 2 | 14 (22.2) | 1.44 (0.64–3.24) | 0.379 | 1.48 (0.66–3.33) | 0.347 | 1.49 (0.638–3.50) | 0.355 | |||
| Quartile 3 | 24 (37.5) | 2.51 (1.20–5.25) | 0.015 | 2.71 (1.28–5.75) | 0.009 | 2.35 (1.02–5.41) | 0.045 | |||
| Quartile 4 | 9 (14.3) | 0.99 (0.40–2.44) | 0.980 | 1.11 (0.44–2.79) | 0.830 | 0.94 (0.31–2.84) | 0.906 | |||
| Overall | 57 (22.5) | 1.09 (0.86–1.37) | 0.506 | 1.13 (0.89–1.44) | 0.325 | 1.09 (0.80–1.48) | 0.602 | |||
| ∆TyG index | ||||||||||
| Quartile 1 | 8 (12.7) | Ref. | Ref. | Ref. | ||||||
| Quartile 2 | 10 (15.6) | 1.21 (0.48–3.06) | 0.689 | 1.18 (0.46–3.00) | 0.732 | 1.33 (0.51–3.46) | 0.561 | |||
| Quartile 3 | 18 (25.8) | 2.27 (0.99–5.22) | 0.054 | 2.21 (0.96–5.11) | 0.063 | 2.90 (1.17–7.17) | 0.022 | |||
| Quartile 4 | 21 (33.3) | 2.60 (1.15–5.86) | 0.022 | 2.51 (1.11–5.69) | 0.027 | 3.60 (1.48–8.79) | 0.005 | |||
| Overall | 57 (22.5) | 1.41 (1.10–1.80) | 0.006 | 1.40 (1.09–1.78) | 0.008 | 1.57 (1.20–2.07) | 0.001 | |||
Risk of MNNW-MONW transition across the TyG index and ∆TyG index quartiles in the follow-up analysis.
Model 1: unadjusted.
Model 2: adjusted for age and sex.
Model 3: adjusted for age, sex, BMI, waist circumference, VFA, body fat content, remnant cholesterol, smoking status, alcohol consumption, physical activity, hypertension, and DM.
p trend <0.05 indicated the higher TyG index and ∆TyG index, the greater risk of MNNW-MONW transition.
MNNW, metabolically normal, normal weight; MONW, metabolically obese normal weight; TyG index, triglyceride-glucose index; HR, hazard ratio; CI, confidence interval; BMI, body mass index; VFA, visceral fat area; DM, diabetes mellitus.
Figure 3
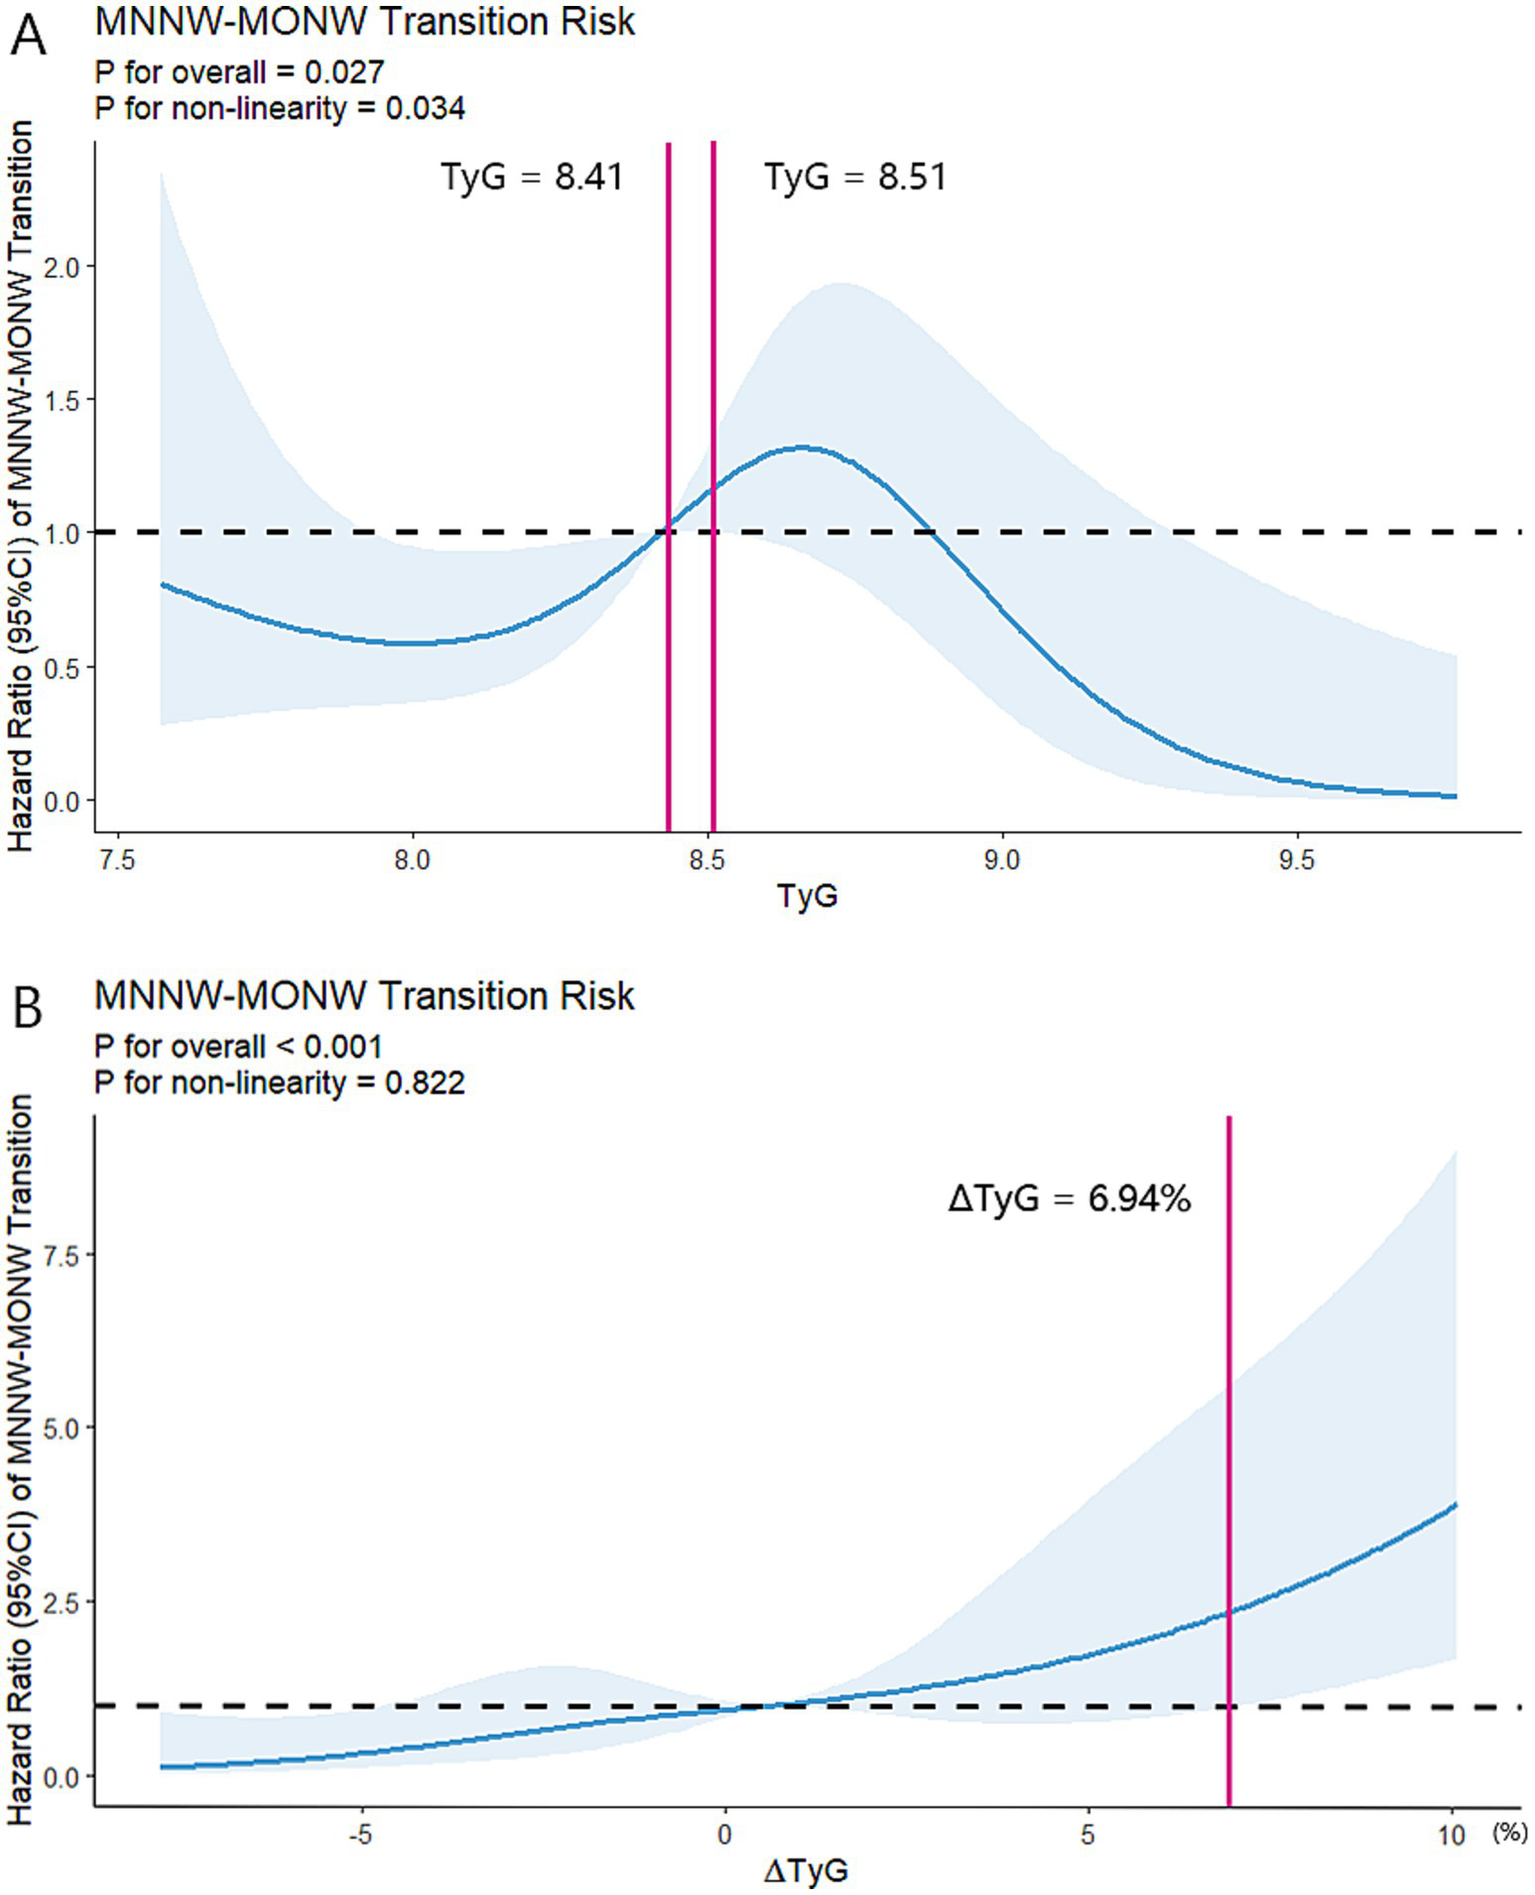
Restricted cubic spline regression analyses of two indices with MNNW-MONW transition in the follow-up analysis. (A) Restricted cubic spline regression analysis of the TyG index with MNNW-MONW transition. (B) Restricted cubic spline regression analysis of the ∆TyG index with MNNW-MONW transition. Two models were both conducted with 5 knots at 5th, 35th, 50th, 65th, and 95th centiles of each individual index (reference is the 5th centile). The HRs (95% CI) were adjusted for age, sex, BMI, waist circumference, smoking status, alcohol consumption, physical activity, hypertension, and DM. Solid lines indicate HRs, and shadow shapes indicate 95% CIs. MNNW, metabolically normal, normal weight; MONW, metabolically obese normal weight; TyG index, triglyceride-glucose index; HR, hazard ratio; CI, confidence interval; BMI, body mass index; DM, diabetes mellitus.
Subgroup analyses and interaction testing showed that the association between the TyG index and MNNW-MONW transition differed significantly only between remnant cholesterol subgroups, and surprisingly, the higher TyG index was a protective factor for MNNW-MONW transition in the remnant cholesterol quartile 4 with the adjusted HR being 0.46 (0.22–0.97). Furthermore, the association between the ∆TyG index and MNNW-MONW transition differed significantly across sex, remnant cholesterol, and VFA subgroups, and there was a trend for an incrementally higher MNNW-MONW transition risk with higher VFA quartiles (Figure 4).
Figure 4
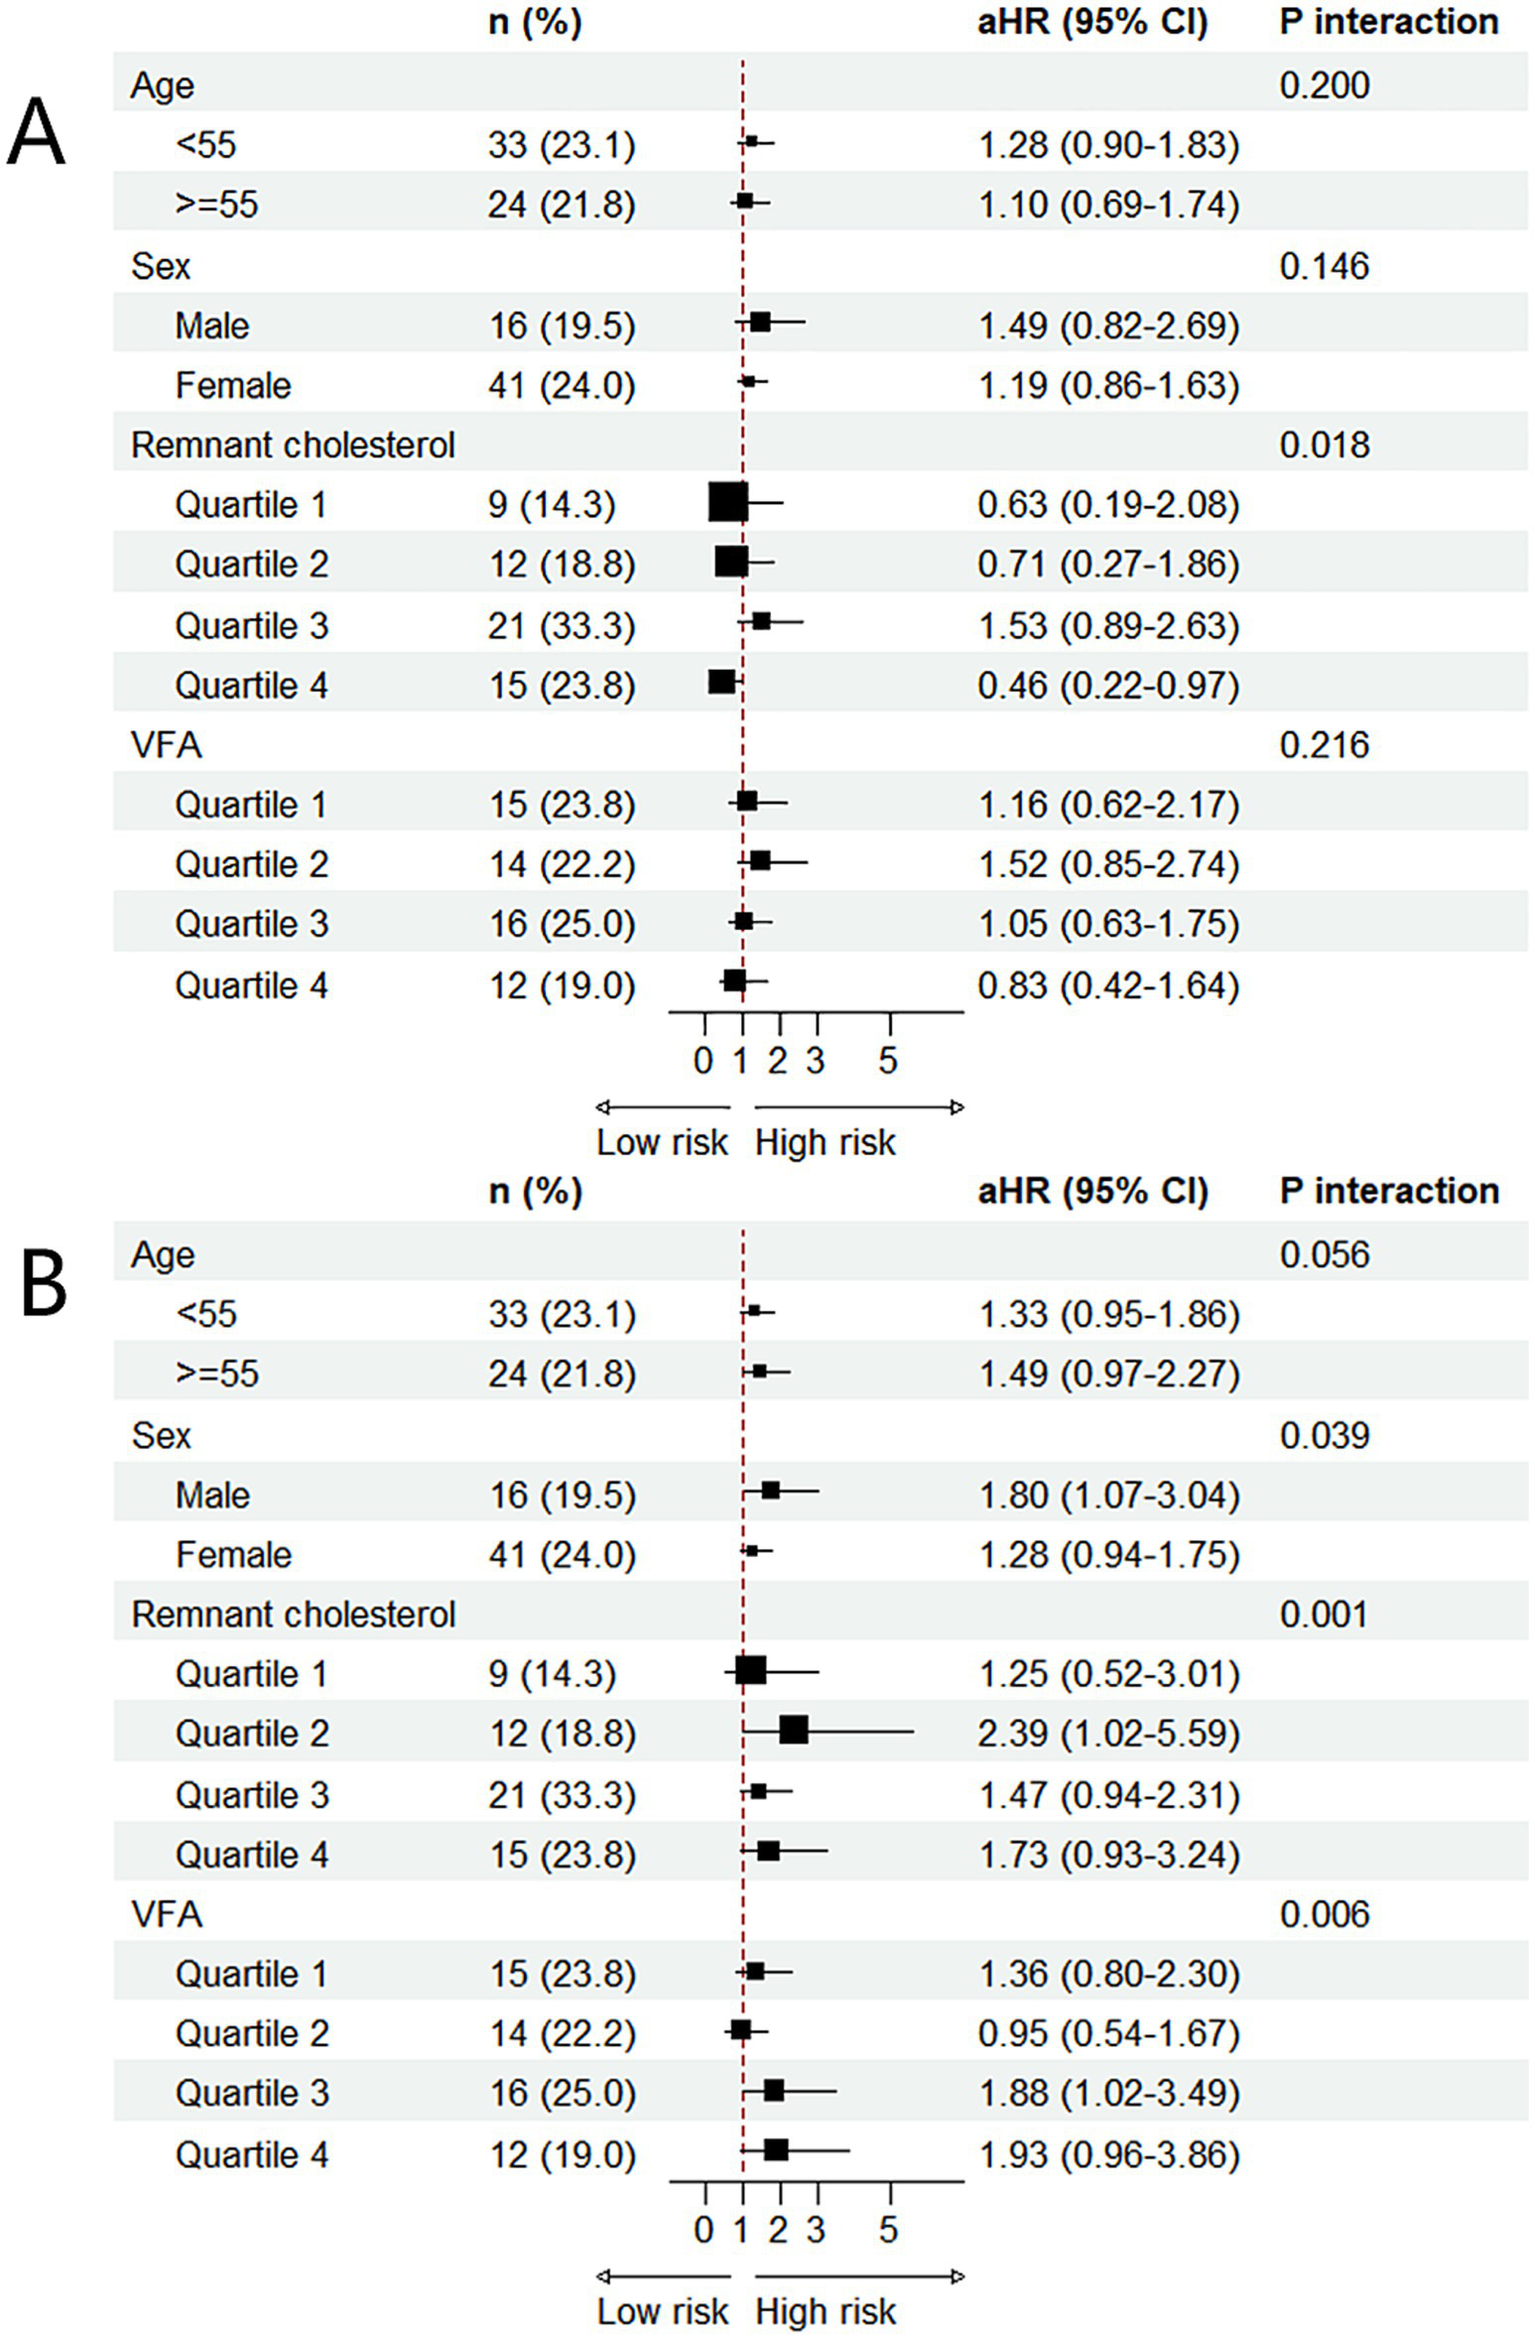
Subgroup analysis of the associations between two indices and MNNW-MONW transition in the follow-up analysis. (A) The association between the TyG index and MNNW-MONW transition. (B) The association between the ∆TyG index and MNNW-MONW transition. The aHRs (95% CI) were estimated using Cox regression models adjusted for age, sex, BMI, waist circumference, smoking status, alcohol consumption, physical activity, hypertension, and DM. p interaction <0.05 indicated that associations among the TyG index, ∆TyG index, and MNNW-MONW transition differed significantly between subgroups. MNNW, metabolically normal, normal weight; MONW, metabolically obese normal weight; TyG index, triglyceride-glucose index; aHR, adjusted hazard ratio; CI, confidence interval; VFA, visceral fat area; BMI, body mass index; DM, diabetes mellitus.
Sensitivity analysis
Sensitivity analysis excluding participants with MONW at baseline also revealed positive linear associations between the TyG index quartiles, ∆TyG index quartiles, and the transition of MNNW-MONW: the increasing TyG index quartiles and ∆TyG index quartiles were associated with a progressively higher risk of MNNW-MONW transition compared with quartile 1 (p trend <0.05). The results of sensitivity analysis for the association between the ∆TyG index quartiles and the transition of MNNW-MONW were similar to those in the follow-up analysis (Supplementary Table 1). In addition, in the subgroup analyses and interaction testing, we observed the association between the TyG index and the transition of MNNW-MONW differed significantly across age, sex, remnant cholesterol, and VFA subgroups; however, the association between the ∆TyG index and MNNW-MONW transition differed significantly only between remnant cholesterol and VFA subgroups, which was also similar to the results of the follow-up analysis. Furthermore, the increased risk of MNNW-MONW transition associated with either the TyG index or ∆TyG index was more pronounced in VFA quartile 4 in the subgroup analyses and interaction testing (Supplementary Figure 1).
Discussion
In this population-based cohort study, we found that the higher TyG index was significantly associated with higher risk of MONW in the cross-sectional study; even more importantly, the higher TyG index and ∆TyG index were significantly associated with higher risk of MNNW-MONW transition in the 5-year follow-up analysis, and these relationships were further strengthened by larger VFA. These findings suggested the TyG and ΔTyG index were sensitive and cost-effective screening tests to monitor and mitigate the risk of MONW-MONW and MNNW-MONW transition and the accompanying CVD risk, especially in people with large VFA. In addition, the predictive performance of the ∆TyG index was better and more stable than the TyG index when monitoring the risk of MNNW-MONW transition, indicating dynamic changes of the TyG index should be monitored regularly in clinical practice for timely recognition of MNNW-MONW transition.
Emerging evidence supported the prediction performance of the TyG index in various chronic metabolic diseases, including type 2 diabetes and CVD (7–10). Previously, several cross-sectional studies also supported the association between the TyG index and MONW incidence (8, 24, 25); however, no studies have evaluated the effects of the TyG index and its changes in predicting MNNW-MONW transition from the long-term metabolic abnormality perspective. Therefore, our study is of great importance. Consistently, we also found that the TyG index is correlated with MOMN in our cross-sectional analysis (8, 24, 25). However, we were the first to report the positive relationship between the ∆TyG index and MNNW-MONW transition in a 5-year follow-up investigation. Although the mechanism underlying the TyG index and its changes in relation to MOMN and MNNW-MONW transition remain unclear, it may be partially elucidated from the perspective of insulin resistance, which is currently recognized as the key etiology of MONW (2, 4). Previous studies have reported the significance of the TyG index in assessing insulin resistance as compared with hyperinsulinemic-euglycemic clamp, as well as the role of the TyG index in evaluating whole-body insulin resistance and CVD prognosis (7–10). In addition, positive associations between components of MONW and the TyG index have also been reported (8). Furthermore, participants in our study were middle-aged and older adults who were more susceptible to visceral fat deposition and insulin resistance-related metabolic abnormalities. Therefore, simple indicators such as the TyG index, which reflects insulin resistance, are more practically significant for monitoring metabolic phenotype transitions, particularly for Asians even with a normal BMI (26, 27). Based on the findings regarding the relationship between the TyG index and MOMN, as well as the association between the TyG index, ∆TyG index, and MNNW-MONW transition, insulin resistance emerges as a pivotal factor for both MOMN and the metabolic phenotype conversion.
We revealed a significant interaction effect between sex, VFA and the TyG index, and ∆TyG index for the risk of MONW-MONW and MNNW-MONW transition by subgroup analyses and interaction testing. It has been reported that, although MONW individuals maintained a normal BMI, their fat distribution tended to accumulate in the truncal or visceral adipose tissue (11). The difference between sex may be partly attributed to a greater amount of visceral fat in male participants and more subcutaneous adipose tissue in female participants (28). Sex hormones also influence body fat distribution and adipocyte differentiation, thereby influencing the difference of MONW phenotype between genders (29). In addition, there were distinct adipose progenitor cells in visceral fat in male participants with elevated proliferation and adipogenesis activity during middle age, which partly contributed to visceral fat expansion of middle-aged male participants (30). In addition, several studies have reported a positive correlation between the TyG index and visceral fat deposition (31–33). Excess visceral fat deposition is linked to the development of insulin resistance and metabolic impairment (34, 35). The increase in visceral adipose tissue leads to the excessive release of pro-inflammatory cytokines and is prone to lipolysis, which in turn accumulates free fatty acids in the liver and skeletal muscles. In the liver, excess free fatty acids contribute to increased very-low-density lipoprotein biosynthesis and reduced degradation, which eventually translate into an increase in low-density lipoprotein particles with high atherogenic property and an increase in the concentration of triglyceride in the blood plasma disturbing the insulin pathways. On the other hand, the accumulation of free fatty acids in skeletal muscles adversely affects the activity of insulin, leading to reduced glucose utilization in skeletal muscles. Thus, the TyG index reflects the combined effects of increased hepatic triglyceride synthesis and decreased glucose utilization in skeletal muscle, both resulting from visceral fat deposition. From this perspective, the relationships between the TyG index and MONW and between the TyG index, ∆TyG index, and MNMN-MOMN transition are closely linked to visceral fat.
Notably, the associations between the TyG index quartiles and MNNW-MONW transition were not consistent in the follow-up analysis or sensitivity analysis, which may be due to the significant difference in the proportions of MNNW at baseline among the TyG index quartiles. Since only 17 (26.9%) participants with MNNW were at baseline in the TyG index quartile 4 in the follow-up analysis, there was a limited ceiling of proportion of MNNW-MONW transition in quartile 4. On the other hand, participants with MONW at baseline may be more likely to gain much BMI, exacerbate metabolic dysfunction, and not meet the purpose of the study. It is also easy to understand MONW-MNNW transition increases with the increasing TyG index quartiles because the proportion of MONW increases with the increasing quartiles. In addition, the seemingly contradictory point the TyG index in quartile 4 was a protective factor for MNNW-MONW transition in the remnant cholesterol quartile 4 might be owing to the lowest proportion of MNNW in the TyG index quartile 4. After excluding participants with pre-existing MONW, the ceiling of the proportion of MNNW-MONW transition was equal in 4 quartiles; therefore, the association between the TyG index and MNNW-MONW transition can be rationally presented under this condition. Therefore, we have reasons to believe that there is a positive linear association between the TyG index and MNNW-MONW transition. Nevertheless, the associations between the ∆TyG index quartiles and MNNW-MONW transition were consistent in the follow-up analysis and sensitivity analysis, which suggested the ∆TyG index may be more stable and reliable for indicating the risk of MNNW-MONW transition as compared to the TyG index.
In addition, it is important to acknowledge that definitions and diagnostic criteria for DM and hypertension vary across different guidelines, which may influence MONW identification and study outcomes. In the current study, we adopted Chinese guidelines for DM and hypertension, which are suitable for Chinese population but have some variations compared to other guidelines, such as European and American guidelines. These differences can impact the prevalence of MONW-MONW and MNNW-MONW transition and the strength of associations among the TyG index, ∆TyG index, and MONW-MONW and MNNW-MONW transition, which limited the comparability and generalizability of the conclusions.
Several limitations of this study should be acknowledged. First, definitions and diagnostic criteria for DM, overweight/obesity, and hypertension vary across different guidelines, and we adopted definitions applicable to the Chinese demographic in the current study, which may influence the prevalence of MONW-MONW and MNNW-MONW transition and limit the comparability and generalizability of the conclusions to other ethnic groups. Second, although the inclusion population in the follow-up analysis can represent the overall population, exclusion of participants with non-normal BMI levels may result in the dilution of the predictive power of the TyG and ∆TyG index for severe metabolic abnormalities (overweight/obesity/underweight) and exacerbate the inherent bias of observational studies, such as selection bias, and future studies need to explore the role of the TyG and ∆TyG index in a larger field of metabolic abnormalities with a larger sample. Third, some inherent and potential bias of the observational study should be considered, such as residual confounding, reverse causation, selection bias, and recall bias for several covariates and self-reported variables (smoking status, alcohol consumption, and physical activity). Fourth, the small amount of the study sample size and the study population located in a specific region limited the generalizability of the conclusions. Fifth, the individuals in the study were predominantly middle-aged and older adults, which limited the extrapolation of the results; therefore, additional investigations are needed to extrapolate the results to other age and ethnic groups.
Conclusion
The elevated TyG index and ∆TyG index were associated with higher risks of MONW-MONW and MNNW-MONW transition, and the ∆TyG index may be a better biomarker for indicating the risk of MNNW-MONW transition. The risks of MONW-MONW and MNNW-MONW transition associated with the higher TyG index and ∆TyG index were strengthened by VFA.
Statements
Data availability statement
The raw data supporting the conclusions of this article will be made available by the authors, without undue reservation.
Ethics statement
The studies involving humans were approved by Sir Run Run Shaw Hospital affiliated with Zhejiang University. The studies were conducted in accordance with the local legislation and institutional requirements. The participants provided their written informed consent to participate in this study.
Author contributions
JiaW: Writing – original draft, Formal analysis, Writing – review & editing. JinW: Writing – review & editing, Writing – original draft. YL: Writing – review & editing. XY: Project administration, Writing – review & editing. FZ: Funding acquisition, Supervision, Writing – review & editing, Conceptualization, Writing – original draft. QY: Writing – review & editing.
Funding
The author(s) declare that financial support was received for the research and/or publication of this article. This study was funded by the Natural Science Foundation of Zhejiang Province (LHDMY23H070005).
Acknowledgments
The authors gratefully acknowledge the commitment and dedication of the participants for this study.
Conflict of interest
The authors declare that the research was conducted in the absence of any commercial or financial relationships that could be construed as a potential conflict of interest.
Generative AI statement
The authors declare that no Gen AI was used in the creation of this manuscript.
Any alternative text (alt text) provided alongside figures in this article has been generated by Frontiers with the support of artificial intelligence and reasonable efforts have been made to ensure accuracy, including review by the authors wherever possible. If you identify any issues, please contact us.
Publisher’s note
All claims expressed in this article are solely those of the authors and do not necessarily represent those of their affiliated organizations, or those of the publisher, the editors and the reviewers. Any product that may be evaluated in this article, or claim that may be made by its manufacturer, is not guaranteed or endorsed by the publisher.
Supplementary material
The Supplementary material for this article can be found online at: https://www.frontiersin.org/articles/10.3389/fnut.2025.1642725/full#supplementary-material
- 2hPG
2-h post-load plasma glucose
- ANOVA
One-way analysis of variance
- BMI
Body mass index
- CIs
Confidence intervals
- CVD
Cardiovascular disease
- DBP
Diastolic blood pressure
- DM
Diabetes mellitus
- FBG
Fasting blood glucose
- HDL-C
High-density lipoprotein cholesterol
- HRs
Hazard ratios
- IPAQ-SF
International Physical Activity Questionnaire Short Form
- LDL-C
Low-density lipoprotein cholesterol
- MNNW
Metabolically normal, normal weight
- MONW
Metabolically obese normal weight
- MRI
Magnetic resonance imaging
- OGTT
Oral glucose tolerance test
- ORs
Odds ratios
- SBP
Systolic blood pressure
- SD
Standard deviation
- SFA
Subcutaneous fat area
- TyG index
Triglyceride-glucose index
- VFA
Visceral fat area
- RCS
Restricted cubic spline
Glossary
Footnotes
References
1.
Meigs JB Wilson PW Fox CS Vasan RS Nathan DM Sullivan LM et al . Body mass index, metabolic syndrome, and risk of type 2 diabetes or cardiovascular disease. J Clin Endocrinol Metab. (2006) 91:2906–12. doi: 10.1210/jc.2006-0594
2.
Stefan N Schick F Haring HU . Causes, characteristics, and consequences of metabolically unhealthy normal weight in humans. Cell Metab. (2017) 26:292–300. doi: 10.1016/j.cmet.2017.07.008
3.
Wang B Zhuang R Luo X Yin L Pang C Feng T et al . Prevalence of metabolically healthy obese and metabolically obese but normal weight in adults worldwide: a meta-analysis. Horm Metab Res. (2015) 47:839–45. doi: 10.1055/s-0035-1559767
4.
Pluta W Dudzinska W Lubkowska A . Metabolic obesity in people with normal body weight (MONW)-review of diagnostic criteria. Int J Environ Res Public Health. (2022) 19:624. doi: 10.3390/ijerph19020624
5.
Kelly AS Armstrong SC Michalsky MP Fox CK . Obesity in adolescents: a review. JAMA. (2024) 332:738–48. doi: 10.1001/jama.2024.11809
6.
Lingvay I Cohen RV Roux CWL Sumithran P . Obesity in adults. Lancet. (2024) 404:972–87. doi: 10.1016/S0140-6736(24)01210-8
7.
Tao LC Xu JN Wang TT Hua F Li JJ . Triglyceride-glucose index as a marker in cardiovascular diseases: landscape and limitations. Cardiovasc Diabetol. (2022) 21:68. doi: 10.1186/s12933-022-01511-x
8.
Morales-Gurrola G Simental-Mendia LE Castellanos-Juarez FX Salas-Pacheco JM Guerrero-Romero F . The triglycerides and glucose index is associated with cardiovascular risk factors in metabolically obese normal-weight subjects. J Endocrinol Investig. (2020) 43:995–1000. doi: 10.1007/s40618-020-01184-x
9.
Zhang M Wang B Liu Y Sun X Luo X Wang C et al . Cumulative increased risk of incident type 2 diabetes mellitus with increasing triglyceride glucose index in normal-weight people: the rural Chinese cohort study. Cardiovasc Diabetol. (2017) 16:30. doi: 10.1186/s12933-017-0514-x
10.
Wang S Shi J Peng Y Fang Q Mu Q Gu W et al . Stronger association of triglyceride glucose index than the HOMA-IR with arterial stiffness in patients with type 2 diabetes: a real-world single-centre study. Cardiovasc Diabetol. (2021) 20:82. doi: 10.1186/s12933-021-01274-x
11.
Katsuki A Sumida Y Urakawa H Gabazza EC Murashima S Maruyama N et al . Increased visceral fat and serum levels of triglyceride are associated with insulin resistance in Japanese metabolically obese, normal weight subjects with normal glucose tolerance. Diabetes Care. (2003) 26:2341–4. doi: 10.2337/diacare.26.8.2341
12.
Conus F Allison DB Rabasa-Lhoret R St-Onge M St-Pierre DH Tremblay-Lebeau A et al . Metabolic and behavioral characteristics of metabolically obese but normal-weight women. J Clin Endocrinol Metab. (2004) 89:5013–20. doi: 10.1210/jc.2004-0265
13.
Qiu R Wu B He Y Huang S Wang S Li H et al . Age-related adiposity and beta-cell function: impact on prediabetes and diabetes prevalence in middle-aged and older Han Chinese adults. J Endocrinol Investig. (2023) 46:405–13. doi: 10.1007/s40618-022-01917-0
14.
Zhou BF Cooperative Meta-Analysis Group of the Working Group on Obesity in China . Predictive values of body mass index and waist circumference for risk factors of certain related diseases in Chinese adults—study on optimal cut-off points of body mass index and waist circumference in Chinese adults. Biomed Environ Sci. (2002) 15:83–96. PMID:
15.
Fan M Lyu J He P . Chinese guidelines for data processing and analysis concerning the International Physical Activity Questionnaire. Zhonghua Liu Xing Bing Xue Za Zhi. (2014) 35:961–4. PMID:
16.
Xueyao Y Saifei Z Dan Y Qianqian P Xuehong D Jiaqiang Z et al . Circulating fractalkine levels predict the development of the metabolic syndrome. Int J Endocrinol. (2014) 2014:715148. doi: 10.1155/2014/715148
17.
Ma YC Zuo L Chen JH Luo Q Yu XQ Li Y et al . Modified glomerular filtration rate estimating equation for Chinese patients with chronic kidney disease. J Am Soc Nephrol. (2006) 17:2937–44. doi: 10.1681/ASN.2006040368
18.
Nordestgaard BG Benn M Schnohr P Tybjaerg-Hansen A . Nonfasting triglycerides and risk of myocardial infarction, ischemic heart disease, and death in men and women. JAMA. (2007) 298:299–308. doi: 10.1001/jama.298.3.299
19.
Simental-Mendia LE Rodriguez-Moran M Guerrero-Romero F . The product of fasting glucose and triglycerides as surrogate for identifying insulin resistance in apparently healthy subjects. Metab Syndr Relat Disord. (2008) 6:299–304. doi: 10.1089/met.2008.0034
20.
Unwin N Bhopal R Hayes L White M Patel S Ragoobirsingh D et al . A comparison of the new international diabetes federation definition of metabolic syndrome to WHO and NCEP definitions in Chinese, European and South Asian origin adults. Ethn Dis. (2007) 17:522–8. PMID:
21.
Ko GT Cockram CS Chow CC Yeung VT Chan WB So WY et al . Metabolic syndrome by the international diabetes federation definition in Hong Kong Chinese. Diabetes Res Clin Pract. (2006) 73:58–64. doi: 10.1016/j.diabres.2005.11.009
22.
Zhou Y Zhang X Zhang L Li Z Wu Q Jin Z et al . Increased stroke risk in metabolically abnormal normal weight: a 10-year follow-up of 102,037 participants in China. Transl Stroke Res. (2021) 12:725–34. doi: 10.1007/s12975-020-00866-1
23.
Chen Q Zhou Y Dai C Zhao G Zhu Y Zhang X . Metabolically abnormal but normal-weight individuals had a higher risk of type 2 diabetes mellitus in a cohort study of a Chinese population. Front Endocrinol. (2021) 12:724873. doi: 10.3389/fendo.2021.724873
24.
Xu X Bhagavathula AS Zhang Y Ryan PM Rahmani J Qi X . Sex differences in the TyG index and cardiovascular risk factors in metabolically obese normal weight phenotype. Int J Endocrinol. (2022) 2022:1139045. doi: 10.1155/2022/1139045
25.
Kim B Taniguchi K Isobe T Oh S . Triglyceride-glucose index is capable of identifying metabolically obese, normal-weight older individuals. J Physiol Anthropol. (2024) 43:8. doi: 10.1186/s40101-024-00355-6
26.
He W Li Q Yang M Jiao J Ma X Zhou Y et al . Lower BMI cutoffs to define overweight and obesity in China. Obesity. (2015) 23:684–91. doi: 10.1002/oby.20995
27.
Haldar S Chia SC Henry CJ . Body composition in Asians and Caucasians: comparative analyses and influences on cardiometabolic outcomes. Adv Food Nutr Res. (2015) 75:97–154. doi: 10.1016/bs.afnr.2015.07.001
28.
Palmisano BT Zhu L Eckel RH Stafford JM . Sex differences in lipid and lipoprotein metabolism. Mol Metab. (2018) 15:45–55. doi: 10.1016/j.molmet.2018.05.008
29.
Lizcano F Guzman G . Estrogen deficiency and the origin of obesity during menopause. Biomed Res Int. (2014) 2014:757461. doi: 10.1155/2014/757461
30.
Wang G Li G Song A Zhao Y Yu J Wang Y et al . Distinct adipose progenitor cells emerging with age drive active adipogenesis. Science. (2025) 388:eadj0430. doi: 10.1126/science.adj0430
31.
Yang Q Xu H Zhang H Li Y Chen S He D et al . Serum triglyceride glucose index is a valuable predictor for visceral obesity in patients with type 2 diabetes: a cross-sectional study. Cardiovasc Diabetol. (2023) 22:98. doi: 10.1186/s12933-023-01834-3
32.
Shahavandi M Djafari F Shahinfar H Davarzani S Babaei N Ebaditabar M et al . The association of plant-based dietary patterns with visceral adiposity, lipid accumulation product, and triglyceride-glucose index in Iranian adults. Complement Ther Med. (2020) 53:102531. doi: 10.1016/j.ctim.2020.102531
33.
Bolat MS Bolat IA Dundar C Asci R . Which is better to predict erectile dysfunction and male sexual function in the context of metabolic syndrome: triglyceride-glucose index or visceral adiposity index?: a retrospective cross-sectional study. Int Urol Nephrol. (2024) 56:2869–76. doi: 10.1007/s11255-024-04057-x
34.
Neeland IJ Ross R Despres JP Matsuzawa Y Yamashita S Shai I et al . Visceral and ectopic fat, atherosclerosis, and cardiometabolic disease: a position statement. Lancet Diabetes Endocrinol. (2019) 7:715–25. doi: 10.1016/S2213-8587(19)30084-1
35.
Cnop M Landchild MJ Vidal J Havel PJ Knowles NG Carr DR et al . The concurrent accumulation of intra-abdominal and subcutaneous fat explains the association between insulin resistance and plasma leptin concentrations: distinct metabolic effects of two fat compartments. Diabetes. (2002) 51:1005–15. doi: 10.2337/diabetes.51.4.1005
Summary
Keywords
triglyceride-glucose index, changes in triglyceride-glucose index, metabolically normal, normal weight, metabolically obese normal weight, visceral fat area
Citation
Wang J, Wang J, Lei Y, Yuan Q, Yin X and Zheng F (2025) Relationships among the triglyceride-glucose index, its changes, and the development of metabolically obese normal weight are strengthened by increased visceral fat area. Front. Nutr. 12:1642725. doi: 10.3389/fnut.2025.1642725
Received
07 June 2025
Accepted
28 August 2025
Published
16 September 2025
Volume
12 - 2025
Edited by
Owen Kelly, Sam Houston State University, United States
Reviewed by
Andreas Antzoulas, General University Hospital of Patras, Greece
Silvana Patiño-Cardona, University of Castilla La Mancha, Spain
Updates
Copyright
© 2025 Wang, Wang, Lei, Yuan, Yin and Zheng.
This is an open-access article distributed under the terms of the Creative Commons Attribution License (CC BY). The use, distribution or reproduction in other forums is permitted, provided the original author(s) and the copyright owner(s) are credited and that the original publication in this journal is cited, in accordance with accepted academic practice. No use, distribution or reproduction is permitted which does not comply with these terms.
*Correspondence: Fenping Zheng, 3407004@zju.edu.cn
†These authors have contributed equally to this work
Disclaimer
All claims expressed in this article are solely those of the authors and do not necessarily represent those of their affiliated organizations, or those of the publisher, the editors and the reviewers. Any product that may be evaluated in this article or claim that may be made by its manufacturer is not guaranteed or endorsed by the publisher.