 Li Mu
Li Mu Qianqian Liu1
 Sijia Sun
 Yuhang Liu
 Zeyue Gao
 Li Zhang
 Ying Xu
- 1College of Food Science and Engineering of ChangChun University, Changchun, Jilin, China
- 2Jilin Province Product Quality Supervision and Inspection Institute, Changchun, Jilin, China
Since the invention of synthetic sweeteners, there has been considerable debate regarding the safety of some of these sweeteners due to their poor thermal stability. Sodium saccharin is a synthetic sweetener used to modulate the flavor of fried nuts and seeds. The change in saccharin sodium during high-temperature frying was investigated, and a detection method for saccharin sodium and its frying product, o-sulfamoylbenzoic acid, was established using high-performance liquid chromatography (HPLC). Sodium saccharin will be completely decomposed at 190 °C for 40 min by frying. O-sulfamoylbenzoic acid is the decomposition product of sodium saccharin under high-temperature frying conditions. An HPLC method was developed for the simultaneous determination of sodium saccharin and o-sulfamoylbenzoic acid. When the UV wavelength was 264 nm, the mobile phase was an acetonitrile-0.1% formic acid aqueous solution with gradient elution, and the detection was performed using HPLC. The detection limit of sodium saccharin was 0.045 mg/kg, and the limit of quantification (LOQ) was 0.135 mg/kg. O-sulfamoylbenzoic acid showed a detection limit of 0.056 mg/kg and a limit of quantification of 0.167 mg/kg. The recovery rate of spiked sodium saccharin ranged from 105.67 to 112.16% with relative standard deviations (RSDs) between 0.24 and 1.39%. The recovery rate of o-sulfamoylbenzoic acid spiked between 98.67 and 108.16% with relative standard deviations (RSDs) ranging from 0.13 to 1.51%. We employed the established method to conduct application detection and analysis of a range of commercially available snack foods. Saccharin sodium was detected, while o-sulfamoylbenzoic acid was not found.
1 Introduction
Synthetic sweeteners are a class of food additives that are widely used in various industries and fields. However, there is skepticism about the safety of these sweeteners because their history of use is much shorter than that of natural sweeteners. Some synthetic sweeteners have potential cumulative hazards after consumption and may decompose under complex processing conditions in some foods (1). Sodium saccharin, a non-nutritive synthetic sweetener produced by the methylbenzene or phthalic anhydride process, is 300–500 times sweeter than sucrose (2). Stabilization of sodium saccharin decreases with increase in temperature. Sodium saccharin is not only used as a sweetener for food and beverages but also as a diagnostic drug for measuring blood circulation and as a pharmaceutical processing material (roxithromycin). It is also processed as a flavoring agent for toothpaste, cigarettes, and cosmetics. Additionally, it serves as a brightening flux for chrome plating (3). Industrial production of sodium saccharin began in the United States in 1910; it was introduced for consumption in the United States in the same year, and it gained popularity in the soft drink industry during the 1950s. On 27 October 2017, the World Health Organization's International Agency for Research on Cancer (IARC) published a list of carcinogens, with saccharin and its salts in the list of three groups of carcinogens. EFSA and the European Chemicals Agency (ECHA) consider sodium saccharin to be potentially hazardous by inhalation or in contact with the skin and eyes. GB2760-2024 (China) establishes the limit for the use of a sodium saccharin; compared to the preserved fruits and candied fruits class limit of 5 g/kg, foods that need to be heated and fried, such as shelled/cooked nuts and seeds, are limited to 1 g/kg. Additionally, for products that undergo repeated high-temperature heating and for seasonings, the limit is further decreased to 0.15 g/kg. In the United States, the FDA, along with France's regulatory agency, EFSA, and the European Chemicals Agency (ECHA) oversees non-high-temperature food heating processes (4, 5). Saccharin is not allowed to be used in food intended for infants and young children, people with weaker metabolic detoxification abilities, the elderly, pregnant women, as it may even lead to cancer or birth defects. China has implemented strict measures to ensure the safety of food processing (6). According to Frost and Sullivan, based on the latest 2023 international sodium saccharin data, nearly 60% is used in the daily chemical industry, and only 40% is used by food companies in their processing activities (7–10). Among these, approximately 70% is attributed to non-heated food processing, which includes products such as cold beverages, preserved fruits, and candied fruit production (National Bureau of Statistics of the People's Republic of China, Key Economic Indicators of Industrial Enterprises in the Food Manufacturing Industry, 2023).
o-sulfamoylbenzoic acid has many applications in the chemical industry. It is commonly used as an important intermediate in the production of dyes, drugs, and in organic synthesis. It is mainly used as a rubber antioxidant, vulcanization accelerator, and a chemical auxiliary in plastics and textiles. Additionally, it functions as a boiler water treatment agent, metal corrosion inhibitor, emulsifier, anticorrosive agent, antistatic agent, latex coagulant, petroleum additive, fungicide, pesticide, and dye intermediate. However, there is a potential risk of chronic and cumulative toxicity associated with its use, and currently, no relevant test methods are available to assess this risk (11, 12).
The available detection methods for sodium saccharin include liquid chromatography (GB 5009.28-2016), gas chromatography (GB 5009.28-2016), evaporative light scattering detection (13), ambient flame ionization mass spectrometry (14), silver nanorod array SERS (15), ion chromatography (12), and pulse polarography (11). Evaporative light-scattering detection has the advantage of detecting any sample that is less volatile than the mobile phase and can be connected to any liquid chromatograph for analysis (13). However, disadvantages are that the mobile phase must be volatile, and non-volatile buffer salts and surfactants cannot be used; the sensitivity is relatively low. Ambient flame ionization mass spectrometry can quantify sodium saccharin in a variety of food samples (14), but the detection cost is high, and there is a limitation on the detected substances. The silver nanorod array SERS method offers quick sample pre-treatment and high detection sensitivity, but its operation is complicated and the detection costs are high (15–17). Ion chromatography has strong specificity and high sensitivity and stability; however, when detecting target substances with large concentrations, samples need to be diluted. Ion chromatography has shortcomings such as low reproducibility and unstable instruments. Hannisdal (18) developed a rapid differential pulse polarography method for the determination of the synthetic sweeteners potassium acesulfame and saccharin in beverages. After methodological validation, it was found that the quantitative results were consistent with those of high-performance liquid chromatography (HPLC).
The “Tmall Food Industry Trend Analysis Report” jointly released by the First Financial Data Center and Tmall Food shows that the preference for small packages is growing among both female and male consumers (19). Young people and children like to eat snacks while playing and entertaining. Popular snacks include fried nuts, seeds, and peanuts. Many people prefer consuming fried foods with sodium saccharin, which has a sweet and tangy flavor. To reduce costs, some business owners reuse frying oil multiple times. Currently, there are few reports of high-temperature frying with sodium saccharin, and the safety of this additive is still under debate (20–23). In this study, the changes in the content of sodium saccharin were investigated during high-temperature frying, and it was identified that o-sulfamoylbenzoic acid was the primary decomposition product. Furthermore, a high-performance liquid chromatography (HPLC) method for the detection of sodium saccharin and o-sulfamoylbenzoic acid was established. Four types of leisure foods—fried peanuts, fried pine nuts, roasted bhatanmu, and fried sunflower seeds—were tested using this method.
2 Materials and methods
2.1 Materials and reagents
Four types of leisure foods—fried peanuts, fried pine nuts, roasted bhatanmu, and stir-fried sunflower seeds cooked in corn oil—were purchased from a market in China.
The purity of sodium saccharin standard (concentration 1 mg/ml) was ≥99% and was procured from Shanghai Amperex Standard Technical Service Co., Ltd., Shanghai, China. o-sulfamoylbenzoic acid (analytical purity, purity >99.0%) was sourced from Shanghai Macklin Biochemical Technology Co., Shanghai, China. Potassium ferricyanide and zinc sulfate (analytically pure) were purchased from Sinopharm Chemical Reagent Co.
2.2 Instruments and chromatographic separation
Samples were detected using an HPLC-UV detector with an Agilent 1260 (Agilent Technologies Inc., USA). HPLC analysis was performed on a 5 μm 4.6 × 150 mm Eclipse XDB-C18 column (Agilent) with the mobile phase of acetonitrile (solvent A) and −0.1% formic acid aqueous solution (solvent B) at a flow rate of 1.2 ml/min, injection volume of 10 μl, and column temperature of 25 °C. Gradient elution was performed according to the program described in Table 1.
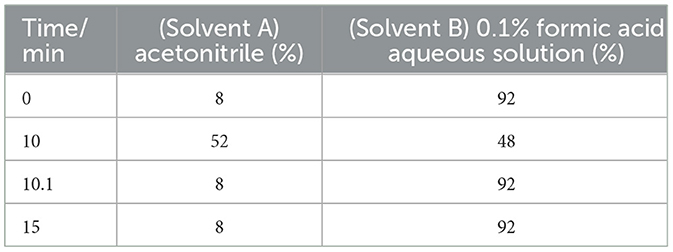
Table 1. Gradient elution schedule.
2.3 Preparation of solutions
Sodium saccharin standard stock solution: 1 ml of sodium saccharin standard solution (1 mg/ml) was accurately drawn to 10 ml in a volumetric flask to prepare a standard stock solution of sodium saccharin at a concentration of 100 μg/ml.
o-sulfamoylbenzoic acid standard stock solution: 2 mg of o-sulfamoylbenzoic acid standard was accurately weighed, dissolved in primary water, and then diluted to 2 ml with a volumetric flask to prepare the standard stock solution of o-sulfamoylbenzoic acid at a concentration of 1 mg/ml. Then, 1 ml of the configured o-sulfamoylbenzoic acid solution (1 mg/ml) was carefully measured and diluted to a final volume of 10 ml using a volumetric flask. This results in an o-sulfamoylbenzoic acid solution with a concentration of 100 μg/ml that needs to be reconfigured in each experiment and stored at 4 °C under, protected from light.
Mixed standard solution preparation: 100 μl of each of the sodium saccharin standard reserve solution and o-sulfamoylbenzoic acid reserve solution (both at a concentration of 1 mg/ml) was accurately measured and made into a mixture of sodium saccharin and o-sulfamoylbenzoic acid standard solution (both at a concentration of 100 μg/ml) by adding a constant volume of primary water to 1 ml.
2.4 Experimental methodology
2.4.1 Ultraviolet wavelength determination
The UV absorption wavelengths of sodium saccharin and o-sulfamoylbenzoic acid standard stock solutions were measured using a UV spectrophotometer. The two solutions to be measured were transferred to a cuvette for online detection, and the maximum absorption wavelength was determined to be 264 nm after full-wavelength scanning of sodium saccharin and o-sulfamoylbenzoic acid standard stock solutions using high-performance liquid chromatography DAD.
2.4.2 Sodium saccharin frying experiment
For this experiment, 0.1 ml of 100 μg/ml of sodium saccharin standard reserve solution was pipetted and mixed thoroughly with 1 ml of corn cooking oil in a test tube. Then, the test tubes were placed in a constant-temperature sand bath instrument at different frying temperatures (160, 170, 180, 190, and 200 °C) while the frying time was maintained. Alternatively, changing frying times, the test tubes were placed in a constant temperature sand bath instrument, and frying times were adjusted to 10, 20, 30, 40, and 50 min, while maintaining a constant frying temperature. According to the national standard GB 5009.97 (China), after pretreating the sample from high-temperature frying, the processed products containing sodium saccharin were ready for machine testing.
2.4.3 Sample preparation
Sample I: 1 ml of corn oil that cannot be used.
Sample II: this sample was prepared by placing sample I in a sand bath instrument to process at a frying temperature of 190 °C for 40 min.
Sample III: 0.1 ml of 100 μg/ml sodium saccharin standard reserve solution was pipetted and mixed with 1 ml of corn oil, which cannot be used for thorough mixing.
Sample IV: sample III was placed in a sand bath and processed at a frying temperature of 190 °C for 40 min.
Sample V: 0.1 ml of 100 μg/ml o-sulfamoylbenzoic acid standard stock solution was pipetted and mixed with 1 ml of corn oil, which cannot be used.
Sample VI: sample V was placed in a sand bath instrument and processed at a frying temperature of 190 °C for 40 min.
2.5 Standard curves
Standard solutions of sodium saccharin at concentrations of 0.0, 10, 20, 50, and 100 μg/ml were pipetted into separate containers. Then, the test solution was determined by following the HPLC conditions described in Section 2.2. The peak area for each standard solution was calculated. The standard curve was plotted using the mass concentration of sodium saccharin (μg/ml) as the horizontal coordinate and the peak area as the vertical coordinate, and the correlation coefficient was calculated. The standard curve of o-sulfamoylbenzoic acid was established similarly to that of sodium saccharin.
3 Results and discussion
3.1 Frying experiments
3.1.1 Sodium saccharin frying test
The sodium saccharin standard was processed, according to the method in Section 2.4.2, in corn oil, and the results are shown in Figure 1a. Upon increasing the frying time within the high-temperature frying temperature range of 160–180 °C, changes in the content of the sodium saccharin standard were not significant. When the frying temperature exceeded 190 °C, the content of sodium saccharin began to decrease. The sodium saccharin standard was subjected to high-temperature frying experiments, and it was found that its content decreased with an increase in frying temperature; the content also decreased with an increase in frying time. Sodium saccharin can be found to be completely decomposed at 190 °C for 40 min by frying.
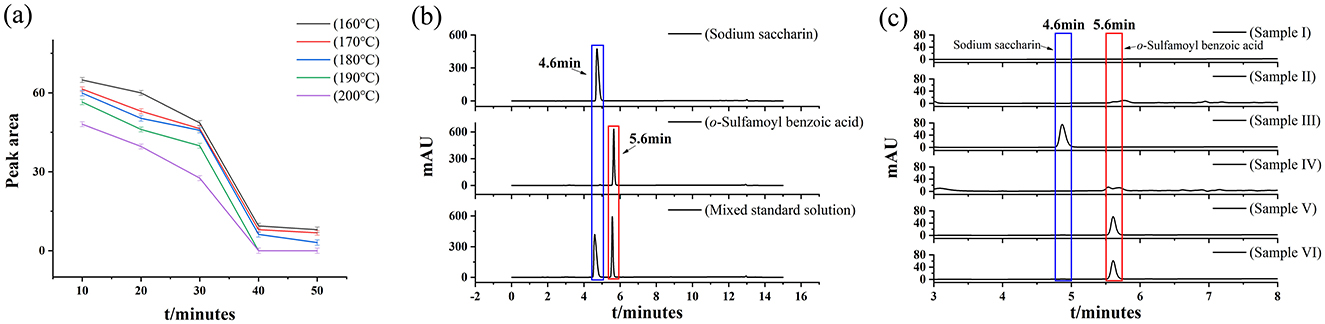
Figure 1. (a) Effect of frying time and temperature for sodium saccharin, (b) Chromatograms of sodium saccharin, o-sulfamoylbenzoic acid, and mixed standard solution, and (c) samples I, II, III, IV, V, and VI by frying.
3.1.2 Determination of target peaks
According to Figure 1b, standard solutions of sodium saccharin and o-sulfamoylbenzoic acid at different concentrations were analyzed and detected according to the method described in Section 2.2. The retention time of the two substances at different concentrations is obtained using a calibrated HPLC instrument to ensure that the determination results of sodium saccharin and o-sulfamoylbenzoic acid would not interfere with each other and to avoid the peak drift phenomenon. The mixed standard solution of sodium saccharin and o-sulfamoylbenzoic acid was also examined, and the peak times of both substances were found to be consistent with the peak times of the above expressions. Sodium saccharin exhibited a peak at 4.6 min and o-sulfamoylbenzoic acid exhibited a peak at 5.6 min.
3.1.3 Sample controls
The prepared samples I, II, III, IV, V, and VI were tested by HPLC under the conditions described in Section 2.2. As shown in Figure 1c, Samples I and II did not interfere with the detection results of samples III, IV, V, and VI. There was a significant difference between the liquid chromatograms of samples III and IV, with sample III being treated by frying to reduce the content and produce new substances. The peak times of sample IV and sample V were identical at 5.6 min; the decomposition product of Sample III was determined to be o-sulfamoylbenzoic acid. The content of sample VI did not change after frying. It was determined that o-sulfamoylbenzoic acid was not affected by frying conditions. As shown in Figure 1c, when the sodium saccharin standard was treated under frying conditions (190 °C for 40 min), a decomposition product appeared. The peak time of the decomposition product was consistent with that of o-sulfamoylbenzoic acid, and the decomposition product was identified as o-sulfamoylbenzoic acid.
3.2 Determination of UV wavelength
Full-band DAD scanning of sodium saccharin and o-sulfamoylbenzoic acid was performed according to the method described in Section 2.4.1. Figure 2a shows the chromatograms of four samples: sample I, sodium saccharin, o-sulfamoylbenzoic acid, and the mixed standard solution. As seen in the figure, compared with sample I, sodium saccharin peaked at a retention time of 4.6 min, o-sulfamoylbenzoic acid had a significant peak at 5.6 min, and the mixed standard had significant peaks at retention times of 4.6 and 5.6 min. The interference of Sample I with sodium saccharin and o-sulfamoylbenzoic acid was excluded. It was also determined that the peaks of sodium saccharin and o-sulfamoylbenzoic acid did not interfere with each other. It showed the spectra of sodium saccharin and o-sulfamoylbenzoic acid. The figure clearly shows that the maximum spectral peak areas appeared at 264 nm, and the best separation was achieved for both substances in Figure 2a.
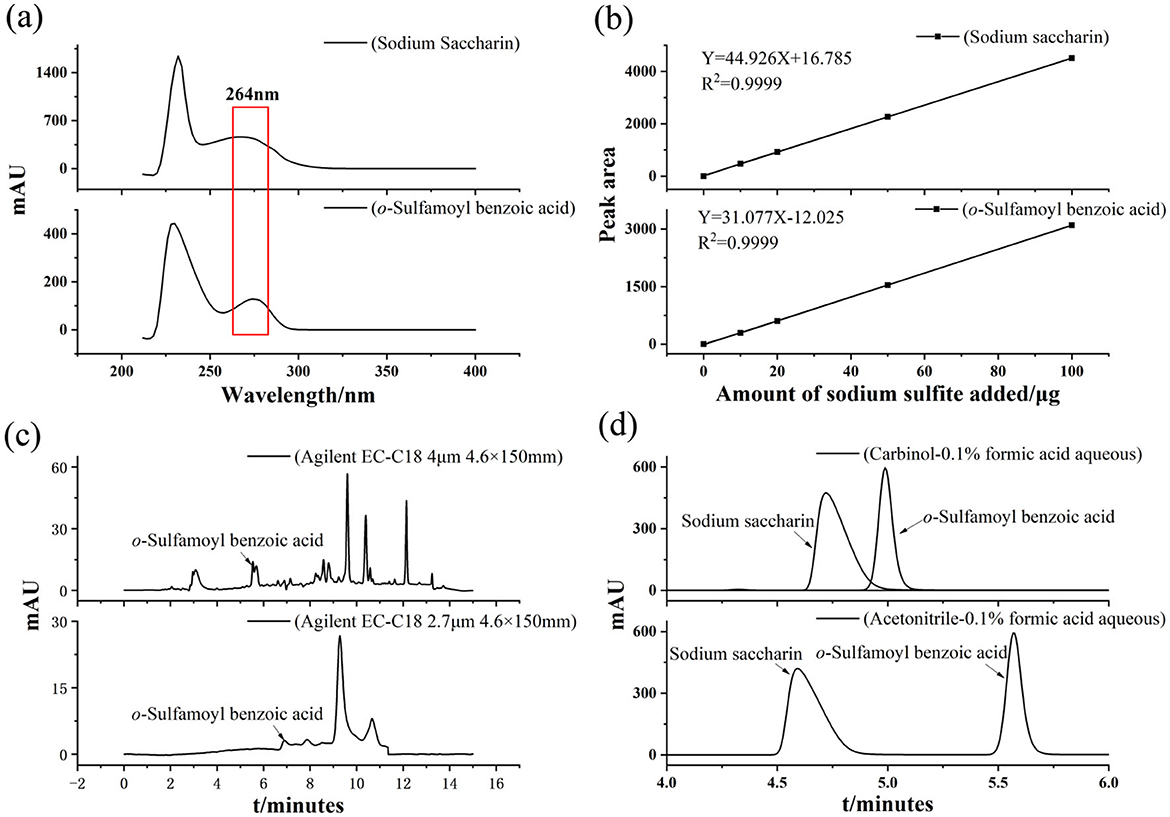
Figure 2. (a) Spectra of sodium saccharin and o-sulfamoylbenzoic acid (b) Standard curve for sodium saccharin and o-sulfamoylbenzoic acid (c) Chromatograms of sample IV detected by (Agilent 1260) HPLC columns Agilent EC-C18 4 μm 4.6 × 150 mm and Agilent EC-C18 2.7 μm 4.6 × 150 mm, and (d) Effect of the mobile phase system.
3.3 Establishment of standard curves
3.3.1 Establishment of sodium saccharin standard curve
The standard curve of the sodium saccharin standard was established according to the method in Section 2.5 (Figure 2b), using the peak area as the ordinate and the amount of standard sodium saccharin added as the abscissa. The linear equation for sodium saccharin is Y = 44.926X + 16.785, R2 = 0.9999. In the range of 0–100 μg/ml, the peak area of sodium saccharin showed a good linear relationship with the concentration of the corresponding standard solution.
3.3.2 Establishment of a standard curve for o-sulfamoylbenzoic acid
The standard curve of the o-sulfamoylbenzoic acid standard was established according to the method in Section 2.5 (Figure 2b), using the peak area as the ordinate and the amount of standard o-sulfamoylbenzoic acid added as the abscissa. The linear equation for o-sulfamoylbenzoic acid is Y = 31.077X – 12.025, R2 = 0.9999. The peak areas of o-sulfamoylbenzoic acid, a decomposition product of sodium saccharin, showed good linearity with the concentrations of the corresponding standard solutions in the range of 0–100 μg/ml.
3.4 Chromatographic conditions
3.4.1 Comparison of chromatographic columns
Sample III was placed in a sand bath instrument. Sample III was fried at 190 °C for 40 min. They were detected by Agilent 1260 HPLC columns equipped with Agilent EC-C18 (4 μm, 4.6 × 150 mm) and Agilent EC-C18 (2.7 μm, 4.6 × 150 mm). As shown in Figure 2d, the decomposition product of sample III (o-sulfamoylbenzoic acid) could not be effectively separated from the heterogeneous peaks. From Figure 2c, it was found that the decomposition product of sample III (o-sulfamoylbenzoic acid) could be effectively separated from the hetero peaks with a better response. Based on the above analysis, if the focus is on detection efficiency and cost, then an ordinary column was selected; if the focus is on high separation, then a high-performance chromatographic column was opted. In this study, an Agilent EC-C18 4 μm 4.6 × 150 mm column was used to establish the detection method for the samples.
3.4.2 Mobile phase selection
Acetonitrile was selected as the organic phase because it separates compounds better than methanol and ethanol and has a lower baseline noise. In the aqueous phase, the effect of pure water and 0.1% formic acid aqueous solution systems on separation was investigated. As shown in Figure 2d, when a 0.1% formic acid aqueous solution and methanol were selected as the mobile phases, peak aggregation and poor separation occurred. As shown in Figure 2d, when a 0.1% formic acid aqueous solution and acetonitrile were used as the mobile phase system, acetonitrile had a stronger elution ability than methanol. This resulted in improved separation of the target substances. Therefore, the mobile phase selected for this process was an acetonitrile-0.1% formic acid aqueous solution.
3.4.3 Elution method
Experimentally selected gradient elution separated the target peaks. The ratio of the mobile phase and elution rate was continuously adjusted according to the degree of elution. Then, the ratio of gradient elution was continuously adjusted according to the observation of the separation degree of the chromatogram, and the gradient elution conditions were finally determined. The liquid phase gradient elution conditions are shown in Table 1.
3.4.4 Flow rate
When the mobile phase flow rate is gradually reduced, the separation degree increases, and the peak shape is stable and improved to a small extent; however, it also leads to the prolongation of the peak time of the target substance, which increases the detection and time costs. Taking the above considerations into account, a flow rate of 1.2 ml/min was adopted to effectively improve the detection efficiency and reduce the detection cost.
3.5 Determination of detection limits
Samples IV, V, and VI were tested according to the conditions outlined in Section 2.2, and the results are shown in Figure 1c. The unknown target peak appeared at a retention time of 5.6 min in the sample IV chromatogram, which was the same as the peak in the o-sulfamoylbenzoic acid chromatogram (sample V). It was indicated that the o-sulfamoylbenzoic acid substance did not decompose under the conditions of a frying temperature of 190 °C and frying for 40 min. The spiked experiments were carried out by taking 10 μg/ml and 100 μg/ml mixed standard solutions of sodium saccharin and o-sulfamoylbenzoic acid, respectively, and detected under the conditions described in Section 2.2. The analysis of HPLC detection of sample IV confirmed that the decomposition product of the sodium saccharin in the conditions of the high-temperature frying temperature of 190 °C for 40 min was o-sulfamoylbenzoic acid.
Samples III and V were processed, analyzed, and tested according to the research methods mentioned in Sections 2.2 and 2.4.2, and the results are shown in Figure 3a. The limit of detection (LOD) for sodium saccharin was calculated as 0.045 mg/kg based on a threefold signal-to-noise ratio (S/N = 3), and the limit of quantification (LOQ) was calculated as 0.135 mg/kg based on a 10-fold signal-to-noise ratio (S/N = 10). The limit of detection (LOD) for o-sulfamoylbenzoic acid was calculated to be 0.056 mg/kg based on a threefold signal-to-noise ratio (S/N = 3), and the limit of quantification (LOQ) was calculated to be 0.167 mg/kg based on a 10-fold signal-to-noise ratio (S/N = 10). This indicates that the method has good sensitivity.
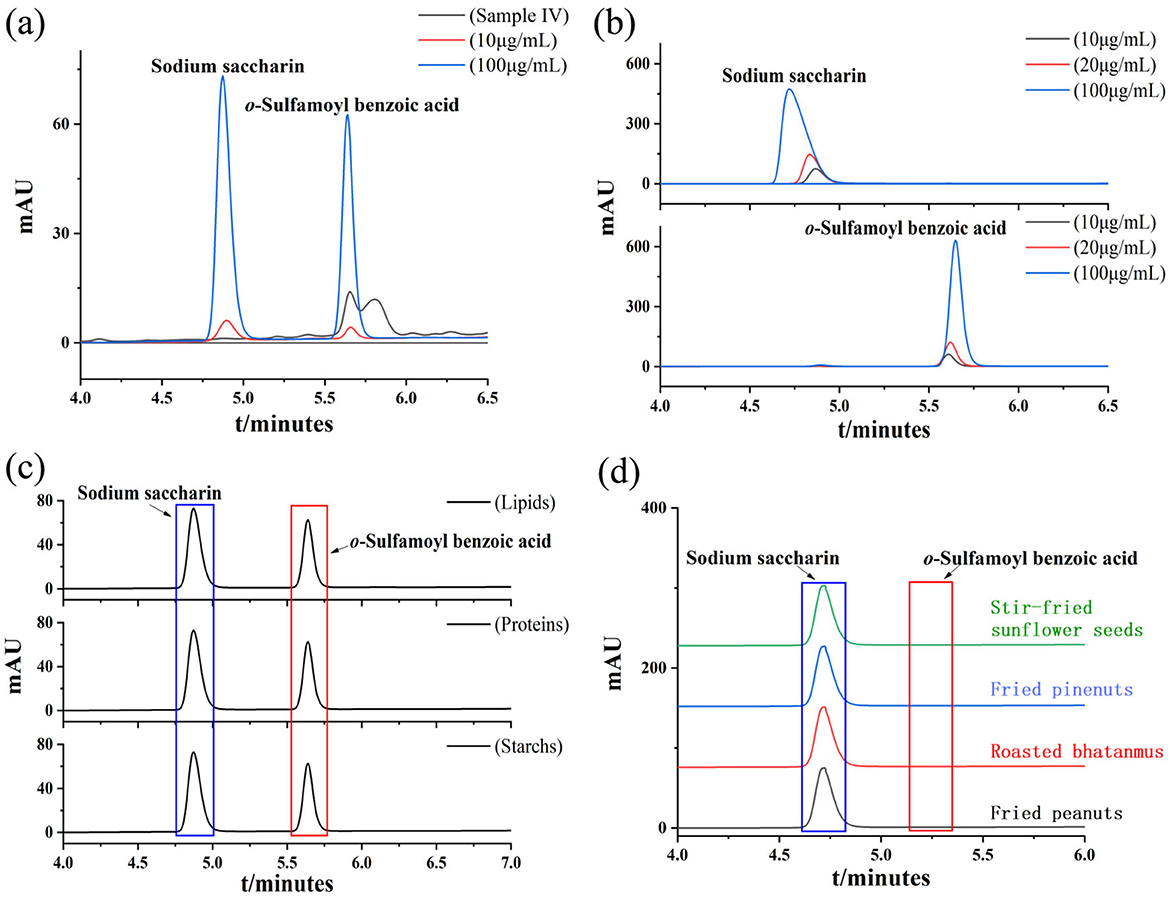
Figure 3. (a) Chromatograms of LOD and LOQ of sodium saccharin and o-sulfamoylbenzoic acid (b) Spiked recoveries and precision of sodium saccharin and o-sulfamoylbenzoic acid (c) Chromatograms of matrix stabilization experiments, and (d) Chromatograms of actual samples.
3.6 Recovery experiments and precision
Three mass concentration levels of the sodium saccharin standard solution were added according to the method described in Section 2.2, with the addition range of 10–100 μg/ml, and the spiked amounts were 10, 20, and 100 μg/ml, respectively, and the results are shown in Table 2 and Figure 3b. o-sulfamoylbenzoic acid was subjected to the same spiked recovery test as that for sodium saccharin, and the results are shown in Table 2 and Figure 3d. Each sample was prepared six times in parallel for determination, and the spiked recoveries were calculated using the formula (Equation 1). In Equation 1, P denotes the spiked recovery, and C1 represents the total mass of sodium saccharin when the standard solution of sodium saccharin was added to the product of sodium saccharin after frying. C2 refers to the mass of sodium saccharin. The spiked recoveries of o-sulfamoylbenzoic acid were calculated as Equation 1. The relative standard deviations of sodium saccharin after frying and o-sulfamoylbenzoic acid were calculated using the formula (Equation 2). Sodium saccharin spiked with a recovery rate in the range of 105.67%112.16% with relative standard deviations (RSDs) in the range of 0.24%−1.39%. The recovery rate of o-sulfamoylbenzoic acid spiked to 98.67%−108.16% with relative standard deviations (RSDs) in the range of 0.13%−1.51%. The results obtained by using the experimental analytical method showed that the method had good precision and high accuracy.
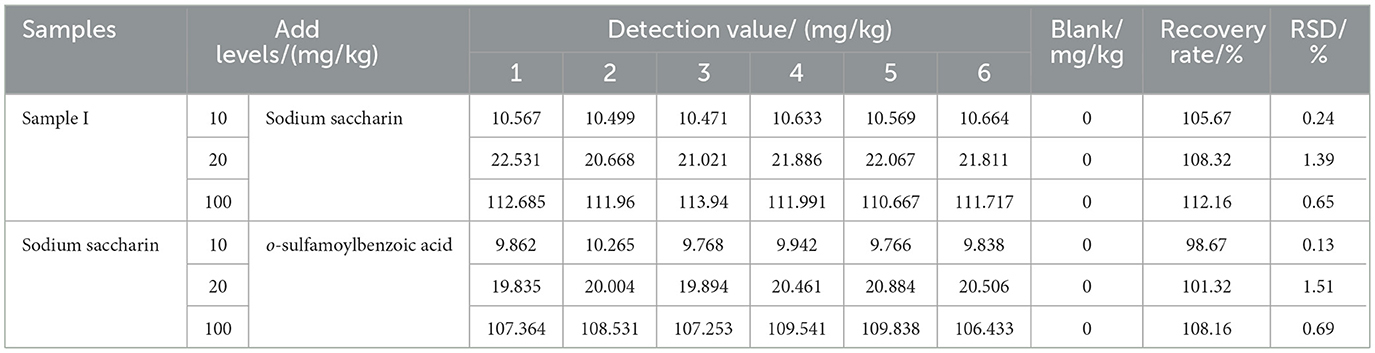
Table 2. Spiked recovery rate and precision.
3.7 Matrix stabilization experiments
To examine the stability of two substances, sodium saccharin and o-sulfamoylbenzoic acid, stability tests with different matrices were carried out. Considering the complexity of the substances in the measured food samples, the food samples and standard solutions were examined separately to avoid influencing the test results. The pre-treatment followed the national standard GB 5009.28-2016, and the treated sample solution was stored at 4 °C under the condition of light protection. The samples were injected and measured at intervals of 1 h according to the conditions described in Section 2.2 to explore the stability of the situation. The data obtained were analyzed, and the results for the compounds that remained stable within 10 h of the test are shown in Table 3. The two substances, sodium saccharin and o-sulfamoylbenzoic acid, were stable in fried peanuts, roasted bhatanmu, fried pine nuts, and stir-fried sunflower seeds.
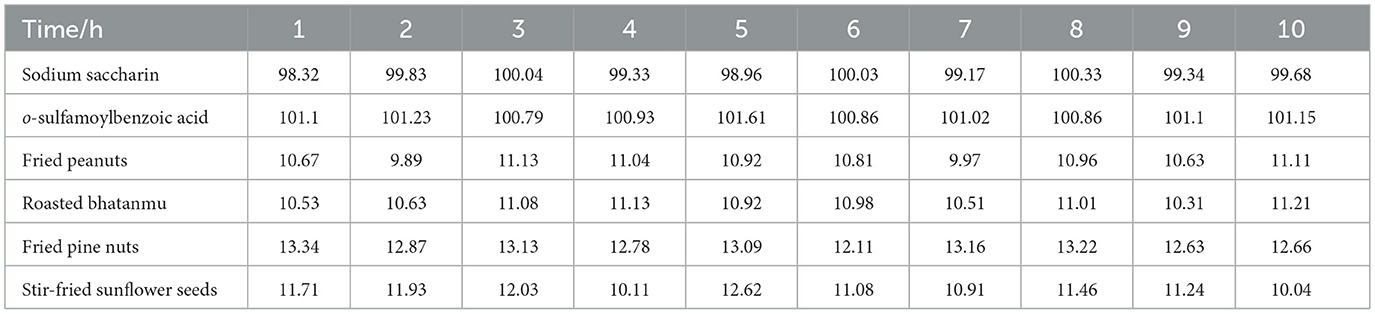
Table 3. Matrix stabilization experiments 1–10 h (as indexed by peak area).
3.8 Matrix effect evaluation method
The matrix effect was calculated from the results of HPLC detection, respectively, using the peak area as an indicator, and the specific formula for calculating the matrix effect (ME) based on the peak area ratio is shown in Equation 3, which indicates that the matrix has an enhanced effect when ME > 100%. When ME <100%, the matrix exhibited a weakening effect. When ME = 100%, the matrix interference is negligible. It is generally believed that 80% <ME <120% indicates that the matrix effect is not significant, while when ME > 120% or ME <80%, the analysis showed a stronger matrix effect, two and two control experimental matrices, a total of three groups (starch/lipid, starch/protein, and lipid/protein), and the combined results of the calculations are shown in Table 4 and Figure 3c. The available data were all within the range of 80% <ME <120%. It can also be observed from the data that the different matrices did not have a significant effect on the available data.
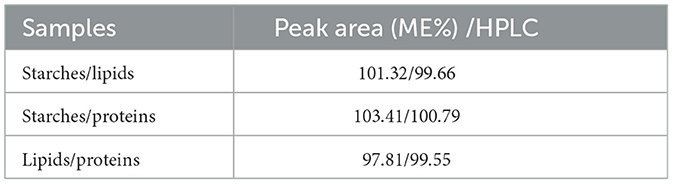
Table 4. Matrix effect calculation results.
3.9 Actual sample test
In this study, the above-established HPLC method was used to analyze the contents of sodium saccharin and o-sulfamoylbenzoic acid in commercially available recreational food products, such as fried peanuts, roasted bhatanmu, fried pine nuts, and stir-fried sunflower seeds. Two parallel samples were used for the analysis. The results are shown in Table 5 and Figure 3d. Sodium saccharin was detected, while o-sulfamoylbenzoic acid was not detected.
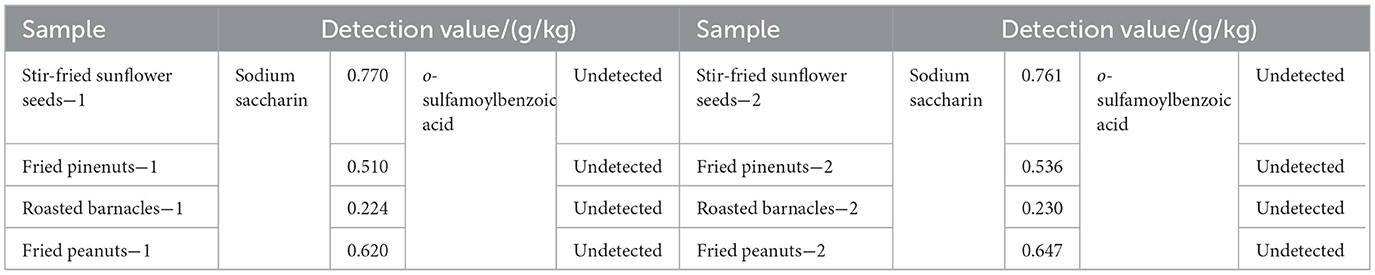
Table 5. Results of the actual samples.
4 Conclusion
In this study, the detection methods of sodium saccharin standard and o-sulfamoylbenzoic acid standard were established by HPLC. By HPLC, the peak time of sodium saccharin was 4.6 min, the detection limit was 0.045 mg/kg, the quantification limit was 0.135 mg/kg, the recovery rate was in the range of 105.67%−112.16%, and the relative standard deviations (RSDs) were in the range of 0.24–1.39%. The peak time of o-sulfamoylbenzoic acid was 5.6 min, the limit of detection (LOD) was 0.056 mg/kg, the limit of quantification (LOQ) was 0.167 mg/kg, the recovery rate was in the range of 98.67%−108.16%, and the relative standard deviations (RSDs) were in the range of 0.13%−1.51%.
Sodium saccharin would have decomposition products of o-sulfamoylbenzoic acid after a frying temperature of 190 °C with a frying time of 40 min. Sodium saccharin and its decomposition product, o-sulfamoylbenzoic acid, were detected and determined by the established HPLC method. The established detection method was applied to analyze commercially available fried leisure foods, such as fried peanuts, fried pine nuts, roasted bhatanmu, and stir-fried sunflower seeds (sodium saccharin was added to all four food labels), and all of them detected sodium saccharin, but not o-sulfamoylbenzoic acid.
Consumers are concerned about the nutritional value of food and food safety hazards. Sodium saccharin is an artificial sweetener added to food, and during repeated high-temperature frying over a long period, it thermally decomposes into o-sulfamoylbenzoic acid. In this study, only the detection method for sodium saccharin and o-sulfamoylbenzoic acid was established, and it was found and determined that o-sulfamoylbenzoic acid was indeed present in sodium saccharin under repeated high-temperature frying conditions. From the perspective of food safety considerations, sodium saccharin after repeated high-temperature frying should be considered, and the direct consumption of o-sulfamoylbenzoic acid, whether there are hazards, needs to be studied by relevant professionals.
Data availability statement
The original contributions presented in the study are included in the article/supplementary material, further inquiries can be directed to the corresponding authors.
Author contributions
LM: Conceptualization, Project administration, Writing – original draft, Writing – review & editing. QL: Methodology, Formal analysis, Software, Writing – review & editing. SS: Data curation, Investigation, Writing – original draft. YL: Data curation, Software, Validation, Writing – original draft. ZG: Investigation, Validation, Writing – original draft. LZ: Supervision, Resources, Writing – original draft. YX: Validation, Writing – original draft. GL: Conceptualization, Methodology, Resources, Writing – review & editing.
Funding
The author(s) declare that no financial support was received for the research and/or publication of this article.
Acknowledgments
The first author (Li Mu) acknowledges the support received from the Jilin Province Product Quality Supervision and Inspection Institute.
Conflict of interest
The authors declare that the research was conducted in the absence of any commercial or financial relationships that could be construed as a potential conflict of interest.
Generative AI statement
The author(s) declare that no Gen AI was used in the creation of this manuscript.
Any alternative text (alt text) provided alongside figures in this article has been generated by Frontiers with the support of artificial intelligence and reasonable efforts have been made to ensure accuracy, including review by the authors wherever possible. If you identify any issues, please contact us.
Publisher's note
All claims expressed in this article are solely those of the authors and do not necessarily represent those of their affiliated organizations, or those of the publisher, the editors and the reviewers. Any product that may be evaluated in this article, or claim that may be made by its manufacturer, is not guaranteed or endorsed by the publisher.
References
1. Hong QY, Huang Y, Yang J, Su LT, Dai ZR, Zhao CF. Food sweeteners: angels or clowns for human health? Curr Res Food Sci. (2025) 10:101032. doi: 10.1016/j.crfs.2025.101032
2. de Brito de Paula MS, Fernandes NAT, Simoes LA. Sustainable sweeteners: unveiling biotechnological promise of novel yeast strains for low-calorie sweetener production. Appl Biochem Microbiol. (2025) 6:354–61. doi: 10.1134/S0003683824604177
3. An J-P, Wang Y, Munger SD, Tang X. A review on natural sweeteners, sweet taste modulators and bitter masking compounds: structure- activity strategies for the discovery of novel taste molecules, Crit Rev Food Sci Nutr. (2024) 65:1–24. doi: 10.1080/10408398.2024.2326012
4. Wang Q-L, Yang Q, Kong X-P, Chen H-Q. Effect of pre-drying and post-frying holding treatments on the oil absorption and quality of fried batter-coated peanuts. Food Chem. (2024) 443:138617. doi: 10.1016/j.foodchem.2024.138617
5. Bampidis V, Azimonti G, Bastos ML, Christensen H, Dusemund B, Fašmon Durjava M, et al. Safety of a feed additive consisting of sodium saccharin for suckling and weaned piglets, fattening pigs, calves for rearing and for fattening (FEFANA asbl). EFSA J. (2023) 21:e07710. doi: 10.2903/j.efsa.2023.7710
6. Rebeschini ARG, Fioravante VC, Santos BM, Martinez FE, Pinheiro PFF. Fetal programming by sodium saccharin and damage on male offspring reproductive. BioRxiv. [preprint] (2021). doi: 10.1101/2021.10.15.464538
7. Abdelrahman FM, Hayes RB. EPR investigation of temporal and thermal stability of irradiated sweeteners. Health Phys. (2022) 123:476–85. doi: 10.1097/HP.0000000000001614
8. Sylvetsky AC, Rebolledo N, Krieger JW. Nonsugar sweeteners-time for transparency and caution. JAMA Pediatr. (2024) 178:217–8. doi: 10.1001/jamapediatrics.2023.6041
9. García-Almeida JM, Casado Fdez GM, García Alemán J. A current and global review of sweeteners. Regulat Aspects Nutr Hosp. (2013) 28:17–31. doi: 10.3305/nh.2013.28.sup4.6793
10. Qiao S, Huang W, Kuzma D, Kormendi A. Acesulfame and other artificial sweeteners in a wastewater treatment plant in Alberta, Canada: occurrence, degradation, and emission. Chemosphere. (2024) 365:141893. doi: 10.1016/j.chemosphere.2024.141893
11. Siddiqui WA, Khalid M, Shafiq I, Ashraf A, Parvez M, Imran M, et al. Antibacterial metal complexes of o-sulfamoylbenzoic acid: synthesis, characterization, and DFT study. Appl Organometallic Chem. (2021) 36:1–17. doi: 10.1002/aoc.6464
12. Salvador PJ, Jacobs HB, Alnouri L, Fee A, Utley LM, Mabry M, et al. Synthesis and in silico evaluation of novel uridyl sulfamoylbenzoate derivatives as potential anticancer agents targeting M1 subunit of human ribonucleotide reductase (hRRM1). Med Chem Res. (2022) 31:1109–19. doi: 10.1007/s00044-021-02840-4
13. de Sousa RCS, Custódio FB, Gloria MBA, Gomides MdF, Costa K, Cunha MRR, et al. Optimization and validation of an analytical method for the determination of sweeteners in beverages by HPLC-ELSD. Food Anal Methods. (2024) 17:207–25. doi: 10.1007/s12161-023-02562-w
14. Li Z, Zhang F, Zhao J, Liu X, Chen X, Su Y, et al. High-throughput quantification of sodium saccharin in foods by ambient flame ionization mass spectrometry. Talanta. (2018) 182:241–6. doi: 10.1016/j.talanta.2018.01.071
15. Han C, Yao Y, Wang W, Qu L, Bradley L, Sun S, et al. Rapid and sensitive detection of sodium saccharin in soft drinks by silver nanorod array SERS substrates. Sens Actuators B Chem. (2017) 251:272–9. doi: 10.1016/j.snb.2017.05.051
16. Lee Y, Do B, Lee G, Lim HS, Yun SS, Kwon H. Simultaneous determination of sodium saccharin, aspartame, acesulfame-K and sucralose in food consumed in Korea using high-performance liquid chromatography and evaporative light-scattering detection. Food Addit Contam Part A. (2017) 34:1–12. doi: 10.1080/19440049.2017.1284348
17. Zheng W, Tian W, Liu X, Zhang Q, Zong C, Lai J, et al. In situ photochemical deposition of Ag nanoparticles on polyester fiber membranes as flexible SERS substrates for sensitive detection of sodium saccharin in soft drinks. Microchem J. (2021) 164:106003. doi: 10.1016/j.microc.2021.106003
18. Liu S, Xu J, Sun J, Jiang X, Lv M, Wang L. Rapid HPLC–MS/MS detection of aliphatic aldehyde formation in four vegetable oils from different frying processes. Food Anal Methods. (2021) 14:2651–9. doi: 10.1007/s12161-021-02096-z
19. Tmall Food Industry Trend Insights. CBNData (2019). Available online at: http://www.cbndata.com/report/1393/detail?isReading=report&page=1 (Accessed January 28, 2022).
20. Campostrini FG, Díaz MF, Rivero RC, Sosa N. Characterization and stability of a sweet confection made with alternative sweeteners. Int J Gastronomy Food Sci. (2022) 28:100542. doi: 10.1016/j.ijgfs.2022.100542
21. Zöldhegyi A, Horváth K, Kormány R. Revisiting column selectivity choices in ultra-high performance liquid chromatography–Using multidimensional analytical Design Spaces to identify column equivalency. J Chromatography A. (2024) 1719:464738. doi: 10.1016/j.chroma.2024.464738
22. Jiang L, Yu Z. Zhao Ya, Yin D. Obesogenic potentials of environmental artificial sweeteners with disturbances on both lipid metabolism and neural responses. Sci Total Environ. (2024) 919:170755. doi: 10.1016/j.scitotenv.2024.170755
Keywords: sodium saccharin, o-sulfamoylbenzoic acid, high temperature frying, high performance liquid chromatography (HPLC), stability
Citation: Mu L, Liu Q, Sun S, Liu Y, Gao Z, Zhang L, Xu Y and Li G (2025) Stability analysis of sodium saccharin in fried nuts and seeds—Determination of sodium saccharin and o-sulfamoylbenzoic acid by HPLC. Front. Nutr. 12:1645604. doi: 10.3389/fnut.2025.1645604
Received: 12 June 2025; Accepted: 29 September 2025;
Published: 24 October 2025.
Edited by:
Martin Grootveld, De Montfort University, United KingdomReviewed by:
Gehan Fawzy Abdel Raoof, National Research Centre, EgyptBeatrix Sik, Széchenyi István University, Hungary
Copyright © 2025 Mu, Liu, Sun, Liu, Gao, Zhang, Xu and Li. This is an open-access article distributed under the terms of the Creative Commons Attribution License (CC BY). The use, distribution or reproduction in other forums is permitted, provided the original author(s) and the copyright owner(s) are credited and that the original publication in this journal is cited, in accordance with accepted academic practice. No use, distribution or reproduction is permitted which does not comply with these terms.
*Correspondence: Li Mu, bXVsQGNjdS5lZHUuY24=; Gang Li, MzQxODgyNzA4QHFxLmNvbQ==