 Zhuolin Qin
 Longqian Li
 Ming Hou
 Cheng Wang
- 1The Second Clinical Medical College, Lanzhou University, Lanzhou, China
- 2Department of Thoracic Surgery, Lanzhou University Second Hospital, Lanzhou, Gansu, China
Objective: This study aimed to evaluate the prognostic value of the Prognostic Nutritional Index (PNI), derived from serum albumin and lymphocyte count, in predicting all-cause mortality among lung cancer patients, using both a hospital-based cohort and an external validation dataset.
Methods: A hospital-based retrospective cohort study was conducted, supplemented with external validation using the NHANES database. Univariate and multivariate Cox proportional hazards regression analyses were performed to assess associations between PNI, its components, and mortality. Variance inflation factor (VIF) testing was used to evaluate multicollinearity. Kaplan–Meier (KM) curves and log-rank tests were employed to compare survival across PNI tertiles. Restricted cubic spline (RCS) models were applied to examine non-linear relationships between continuous variables and mortality risk.
Results: In the hospital cohort, univariate Cox analysis revealed significant associations between PNI (HR = 0.89, 95% CI: 0.85–0.93, p < 0.01), albumin (HR = 0.88, 95% CI: 0.86–0.92, p < 0.01), lymphocyte count (HR = 0.60, 95% CI: 0.50–0.80, p < 0.01), and mortality. After multivariate adjustment and VIF testing (all VIF < 5), PNI remained an independent predictor of mortality. KM curves showed significant survival differences across PNI tertiles (log-rank p < 0.001). RCS analysis indicated a non-linear relationship between PNI and mortality risk (p for nonlinear = 0.007). External validation using NHANES data consistently supported the association between PNI and mortality, with significant survival differences in KM analysis (log-rank p = 0.011) and a non-linear trend in RCS.
Conclusion: PNI and its components—albumin and lymphocyte count—are significantly associated with all-cause mortality in lung cancer patients. PNI demonstrates promise as a practical and reproducible prognostic indicator, potentially aiding in risk stratification and clinical decision-making.
1 Introduction
Lung cancer continues to be a leading cause of cancer-related deaths globally, with millions of new cases diagnosed annually (1). Despite significant advancements in diagnostics and treatment strategies, including the development of targeted therapies and immunotherapies, the prognosis for lung cancer patients remains grim (2). The complexity of lung cancer biology and its heterogeneous clinical behavior necessitates the identification of robust biomarkers capable of providing accurate prognostic information and guiding personalized treatment approaches (3, 4).
The PNI has gained attention as a composite indicator that encapsulates both nutritional and immune aspects of patient health (5). Derived from serum albumin levels and peripheral blood lymphocyte count, PNI provides a holistic evaluation of an individual’s immune and nutritional status (6). Serum albumin, a major protein constituent of human plasma, serves as a key marker of nutritional status (7). It is intricately involved in maintaining osmotic pressure, transporting various substances, and supporting metabolic functions (8). Low albumin levels are frequently observed in patients with chronic diseases and are associated with increased mortality (9). Lymphocytes, produced by lymphoid organs, are central to immune responses. They participate in both cell-mediated and humoral immunity, helping to identify, target, and eliminate cancer cells. A low lymphocyte count often indicates compromised immune function and is linked to adverse outcomes in various diseases (10, 11).
Since its initial development for assessing preoperative nutritional status and predicting postoperative complications in surgical patients, PNI has been investigated across diverse clinical contexts. Emerging evidence suggests that PNI may serve as a prognostic biomarker in various conditions, including chronic kidney disease, heart failure, and several types of cancer (12–14). For instance, studies have demonstrated that a lower PNI is associated with increased mortality in patients with chronic kidney disease. Similarly, in oncology, PNI has shown promise in predicting outcomes in patients with colorectal cancer, gastric cancer, and hepatocellular carcinoma (15, 16). However, the role of PNI in lung cancer prognosis remains underexplored, with limited studies addressing its potential utility (17, 18).
Given the high mortality associated with lung cancer and the need for effective prognostic markers to guide clinical decision-making, exploring the relationship between PNI and lung cancer outcomes is of significant importance. A better understanding of how PNI and its individual components (albumin and lymphocyte count) influence mortality risk could provide valuable insights for patient care. This hospital-based cohort study, supplemented with external validation using the NHANES database, aims to comprehensively investigate the association between PNI and all-cause mortality in lung cancer patients. By employing a multifaceted analytical approach, including Kaplan–Meier survival analysis, Cox proportional hazards regression, and RCS models, this study seeks to elucidate the complex relationship between PNI and mortality risk. The findings may not only enhance our understanding of the prognostic significance of PNI in lung cancer but also contribute to the development of more personalized and effective management strategies for this deadly disease.
2 Methods
2.1 Study population and inclusion/exclusion criteria
This hospital-based cohort study included lung cancer patients diagnosed between the 2016–2018 year wave. Inclusion criteria were patients aged ≥20 years with available data on PNI and its components (albumin and lymphocyte count). Exclusion criteria included missing data for albumin, lymphocyte count, or other key variables. For external validation, data from the NHANES database (1999–2018 year wave) were used. The initial study cohort comprised 450 patients, with 104 lost to follow-up and 23 excluded due to missing albumin or lymphocyte data, resulting in 323 subjects for the final analysis. The NHANES database included 10,1,316 individuals, with 111 lung cancer patients selected after excluding 46,235 participants with age < 20, 48,671 missing lung cancer diagnoses and 6,299 missing albumin or lymphocyte values (Figure 1).
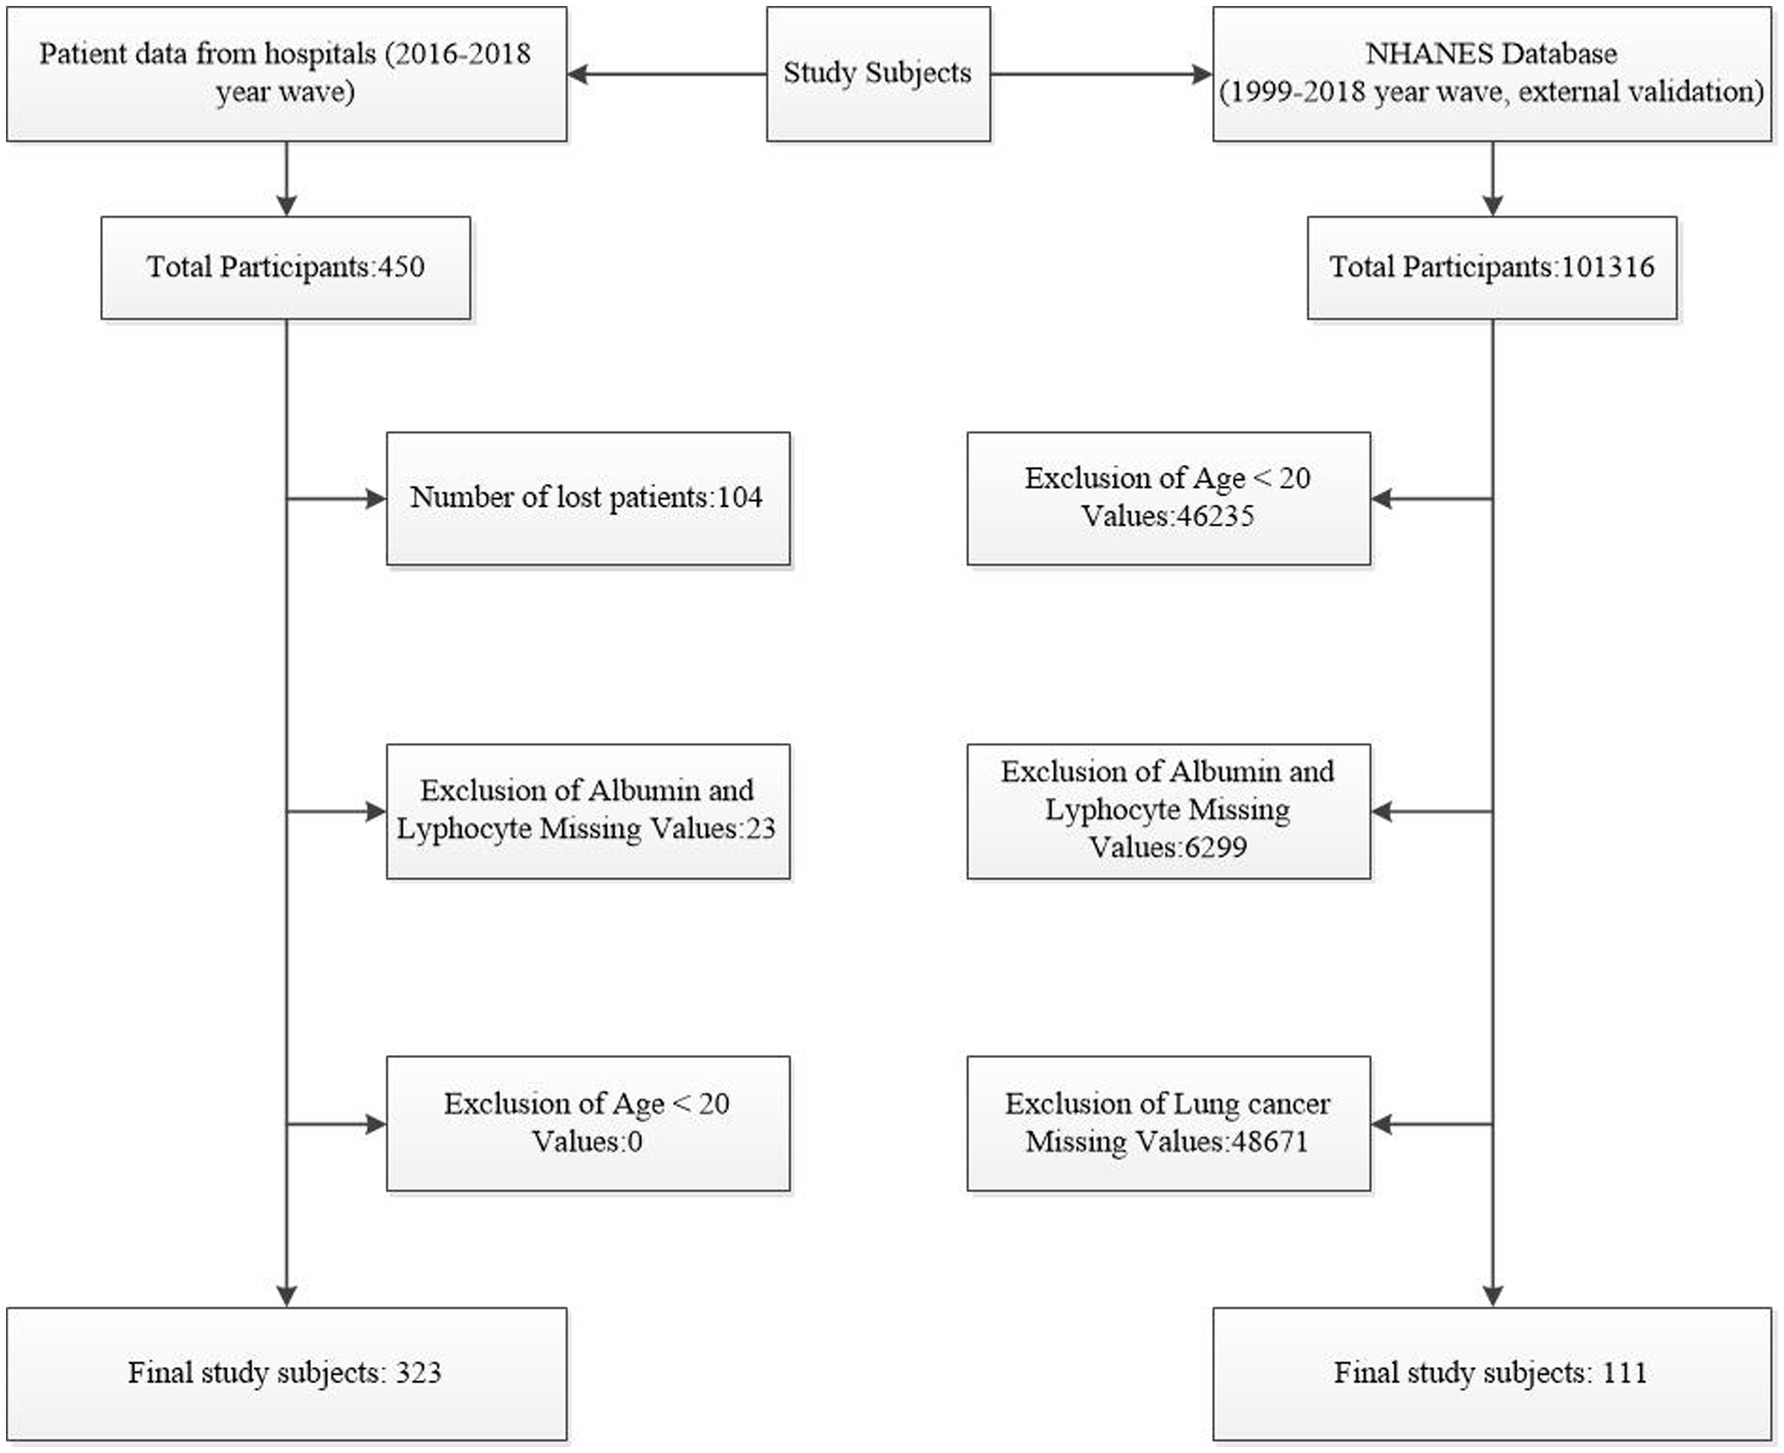
Figure 1. Flowchart of Subject Selection. This figure illustrates the process of selecting subjects from hospital data and the NHANES database.
2.2 Variables and definitions
The primary outcome was all-cause mortality. The main exposure was the PNI, calculated as 10 × albumin (g/L) + 0.005 × lymphocyte count (/mm3). Variables assessed included age, sex, smoking status, alcohol consumption, hypertension, fasting blood glucose, liver function tests (ALT, AST), renal function tests (serum creatinine, blood urea nitrogen), lipid profiles (triglyceride, total cholesterol, HDL, LDL), and hematological parameters (WBC, lobulated neutrophils, lymphocyte number, RBC distribution width, PLT, Hb).
2.3 Cox proportional hazards regression analysis
Univariate Cox regression was first performed to identify factors associated with mortality in lung cancer patients (19). This step helped to screen out potentially relevant variables for further analysis. Next, variance inflation factor (VIF) testing was conducted to detect multicollinearity among the variables. A VIF value greater than 10 typically indicates significant multicollinearity; however, in this study, all VIF values were below 5, suggesting that multicollinearity was not a major issue (20, 21). Subsequently, multivariate Cox regression was carried out to control for confounding variables and determine the independent association of the PNI and its components (albumin and lymphocyte count) with mortality (22). The results were presented as hazard ratios (HRs) with 95% confidence intervals (CIs).
2.4 Survival analysis and non-linear relationship assessment
The KM survival curves were plotted to visualize the survival differences across different levels of PNI, albumin, and lymphocyte count. The log-rank test was used to assess the significance of these differences. To further explore the relationship between continuous variables and mortality risk, RCS models were applied. These models allowed us to assess potential non-linear relationships and provided a more comprehensive understanding of how PNI and its components might influence mortality risk (23).
2.5 Two-piecewise linear regression analysis
To evaluate the relationship between the Prognostic Nutritional Index (PNI) and lung cancer mortality, we employed a two-piecewise linear regression model. This model allows for the identification of potential threshold effects by examining changes in the slope of the relationship at a specific inflection point. The model was specified to include two segments: one for PNI values below the inflection point and another for values above it. The inflection point was determined using a likelihood ratio test to optimize model fit. This approach helps to identify whether a specific PNI value significantly alters the relationship with the outcome.
2.6 Statistical analysis
Measured variables were presented as the mean (standard deviation) or median (tertiles), and count variables were presented as frequencies (percentages). The Kolmogorov–Smirnov test was used to assess the normality of variables. For normally distributed data, intergroup differences were analyzed using t-tests or analysis of variance. For skewed data, the Mann–Whitney U test or Kruskal–Wallis H test was used for intergroup comparisons. Chi-square tests or Fisher’s exact tests were used for count data. PNI was treated as a continuous variable and divided into tertiles in the analysis to minimize the impact of its distribution on the results. Kaplan–Meier (KM) curves (with the log-rank test) were used to evaluate the effect of baseline PNI categories on all-cause mortality. Univariate and multivariate Cox proportional hazards models were used to estimate hazard ratios and 95% confidence intervals, and restricted cubic spline models were employed to assess potential non-linear effects. The ‘segmented’ package in R was utilized to conduct a two-piecewise linear regression analysis, identifying the inflection point in the relationship between PNI and lung cancer mortality. In all analyses, a two-tailed p-value of less than 0.05 was considered statistically significant. All data analyses were performed using R version 4.4.2.
3 Results
3.1 Identifying key prognostic factors
The hospital-based single-factor Cox regression analysis revealed that PNI, albumin, and lymphocyte count were significantly associated with lung cancer mortality (Tables 1, 2). Specifically, PNI had an HR of 0.89 (95% CI: 0.85–0.93, p < 0.01), indicating a 10% decrease in mortality risk with each unit increase in PNI. Albumin, with an HR of 0.88 (95% CI: 0.86–0.92, p < 0.01), showed that higher albumin levels were linked to lower mortality risks. Lymphocyte count, with an HR of 0.60 (95% CI: 0.50–0.80, p < 0.01), suggested that patients with higher lymphocyte counts had significantly reduced mortality risks. These findings point to PNI and its components as crucial prognostic factors for lung cancer patients.

Table 1. Univariate Cox analysis of hospital patients and external validation via NHANES database.

Table 2. Baseline characteristics of hospital patients and external validation via NHANES database.
3.2 Ensuring analytical reliability
Before the hospital-based multivariate Cox regression analysis, VIF testing was conducted to check for multicollinearity among variables (Table 3). All variables had VIF values below 5, such as age (VIF = 1.1) and TOTAL CHOLESTEROL (VIF = 1.3), indicating no severe multicollinearity. As VIF values above 10 suggest significant multicollinearity, the results here imply that the multivariate analysis outcomes were reliable and valid for evaluating the independent connection between PNI, its components, and mortality.

Table 3. Variance inflation factor (VIF) analysis.
3.3 Independent prognostic value of PNI
In the hospital-based multivariable Cox regression analysis model (Adjustment Model I), PNI was independently associated with lung cancer mortality (Table 4). Compared to the low group, the hazard ratio (HR) for the medium group was 0.75 (95% CI: 0.40–1.45, p = 0.13), and for the high group was 0.30 (95% CI: 0.10–0.55, p = 0.03), indicating a significant reduction in mortality risk with increasing PNI levels. Additionally, in this model, compared to the low group, patients with high lymphocyte counts had an HR of 0.92 (95% CI: 0.48–2.45, p = 0.88), and those with high albumin levels had an HR of 0.90 (95% CI: 0.30–2.45, p = 0.80). These results confirm the important independent prognostic value of PNI and its components, albumin and lymphocyte count, in predicting lung cancer mortality. This suggests that clinicians should pay attention to these indicators when assessing patient prognoses.
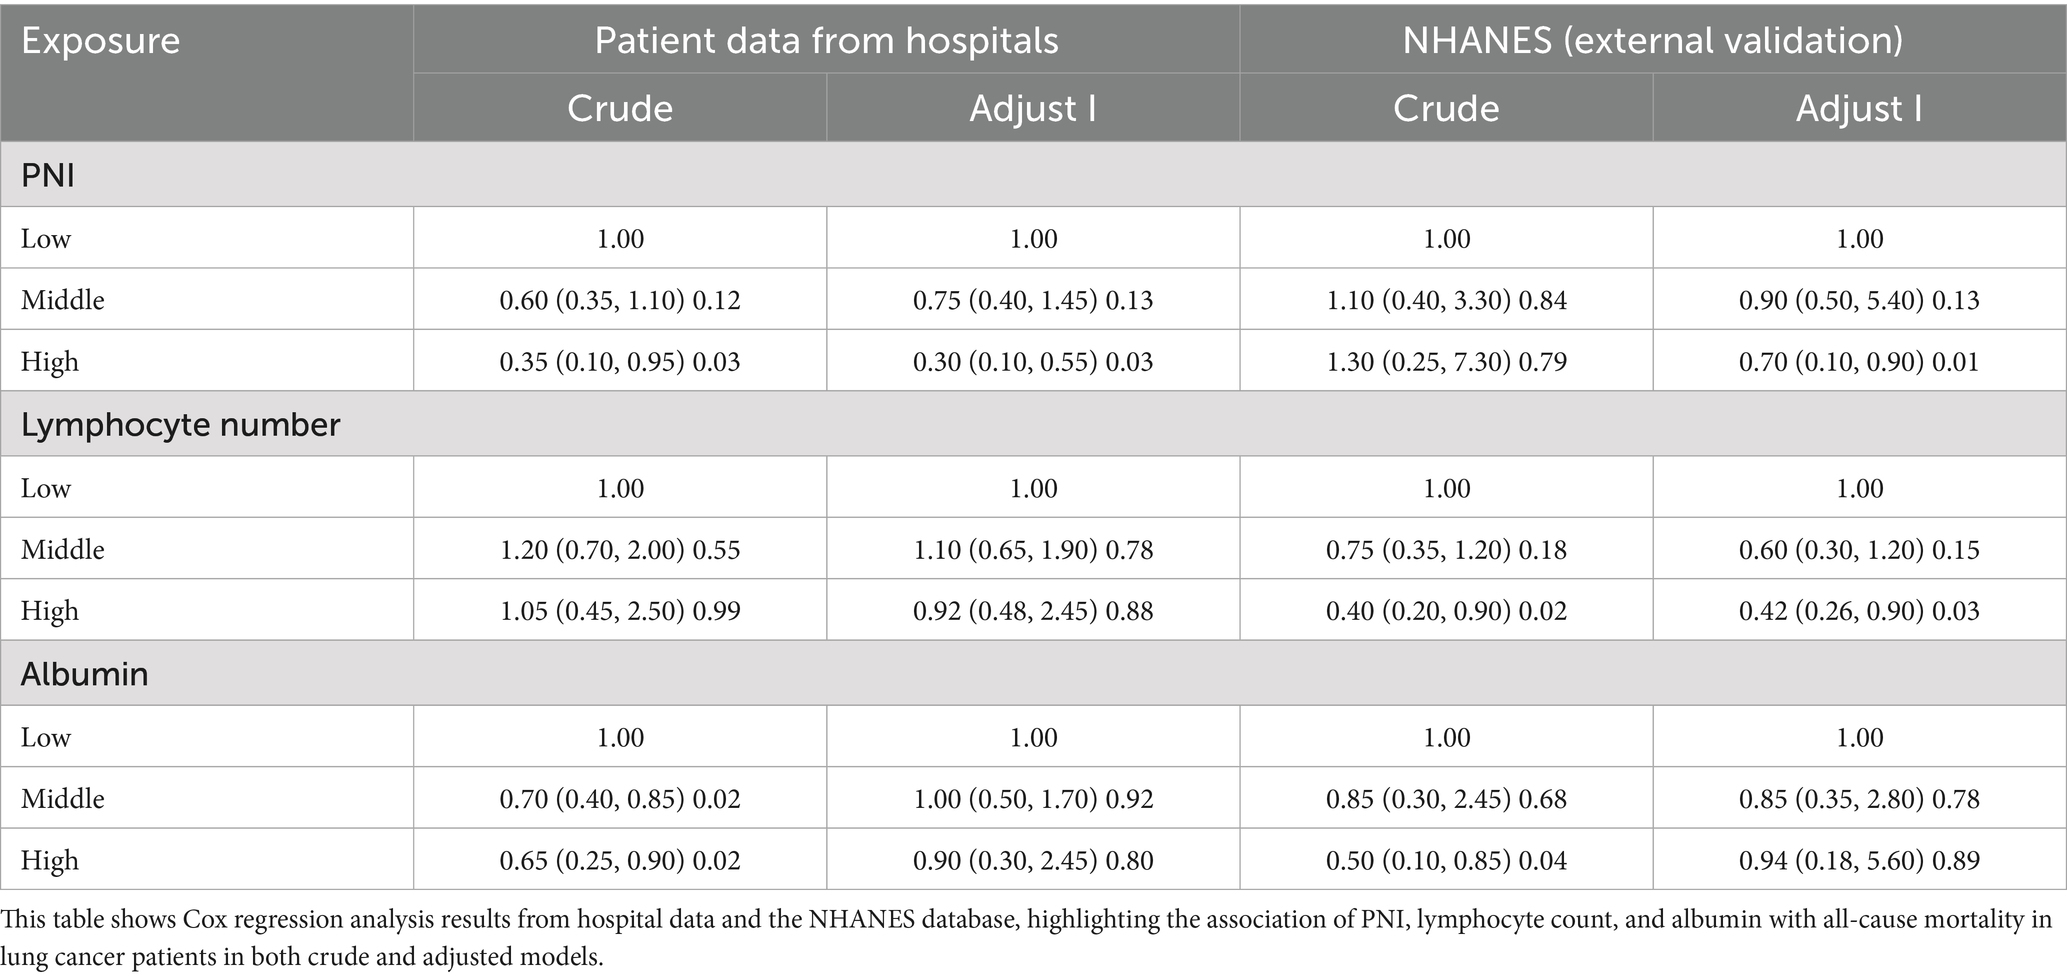
Table 4. Association between PNI, lymphocyte count, albumin and mortality.
3.4 Survival differences revealed by Kaplan–Meier curves
The Kaplan–Meier survival curves based on hospital data clearly showed survival rate differences among patients with different levels of PNI, albumin, and lymphocyte count (Figures 2A–C). In the PNI analysis, the high-PNI group had a significantly higher survival rate than the medium- and low-PNI groups (log-rank p < 0.001), indicating better survival outcomes with higher PNI levels. Similarly, patients with high albumin levels had a higher survival rate than those with low levels (log-rank p < 0.001), highlighting albumin’s positive impact on long-term survival as a nutritional indicator. Patients with high lymphocyte counts also had a higher survival rate (log-rank p < 0.001), likely due to lymphocytes’ key role in immune defense and tumor surveillance. These significant survival differences validate the predictive value of these indicators for lung cancer patient prognoses and suggest that monitoring them can aid in risk stratification and individualized treatment decisions.

Figure 2. Kaplan–Meier survival curves for PNI, albumin, and lymphocyte count in lung cancer patients. Panels (A–C) display the Kaplan–Meier survival curves for PNI, albumin, and lymphocyte count based on hospital data, showing survival differences across different levels (PNI: log-rank p < 0.001; Albumin: log-rank p < 0.001; Lymphocyte count: log-rank p < 0.001). Panels (D–F) present the Kaplan–Meier survival curves for these factors based on the NHANES database (PNI: log-rank p = 0.011; Albumin: log-rank p = 0.012; Lymphocyte count: log-rank p = 0.002).
3.5 Exploring non-linear relationships
The RCS analysis delved into the potential non-linear relationships between PNI, albumin, lymphocyte count, and mortality risk (Figures 3A–C). The analysis showed a significant non-linear relationship between PNI and mortality risk (P for overall <0.001, P for non-linear = 0.007), suggesting that PNI increases were associated with mortality risk decreases within a certain range, but the relationship wasn’t strictly linear. There might be an optimal PNI range for the best patient survival outlook. Similarly, a significant non-linear relationship was found between albumin and mortality risk (P for overall <0.001, P for non-linear = 0.154), indicating that albumin levels might have a threshold effect on mortality risk. However, no significant non-linear relationship was found between lymphocyte count and mortality risk (P for overall = 0.167, P for non-linear = 0.906). This could be due to sample size, variation in lymphocyte counts, or other confounding factors. Overall, the RCS analysis indicates that the effects of PNI and albumin on mortality might be more complex and require further research to clarify their dose-response relationships.

Figure 3. Non-linear relationships between PNI, albumin, lymphocyte count and all-cause mortality. Panels (A–C) show the non-linear relationships between PNI, albumin, lymphocyte count and all-cause mortality based on hospital data (PNI: P for overall < 0.001, P for non-linear = 0.007; Albumin: P for overall < 0.001, P for non-linear = 0.154; Lymphocyte count: P for overall = 0.167, P for non-linear = 0.906). Panels (D–F) show these relationships based on the NHANES database (PNI: P for overall = 0.041, P for non-linear = 0.138; Albumin: P for overall = 0.043, P for non-linear = 0.088; Lymphocyte count: P for overall = 0.031, P for non-linear = 0.299).
3.6 Confirming the effectiveness of predictive indicators through external validation
External validation results confirmed the significant association between PNI and mortality, aligning with the hospital-based findings (Tables 1–4 and Figures 2D–F). The Kaplan–Meier survival curve analysis showed significant survival rate differences among patients with different PNI levels in the NHANES database (log-rank p = 0.011), echoing the hospital-based results. This indicates that PNI has good predictive power across different populations. In the multivariate Cox regression analysis, the high-PNI group showed a significantly reduced mortality risk (HR = 0.70, 95% CI: 0.10–0.90, p = 0.01) compared to the low group. This underscores PNI’s predictive value in the external validation dataset. RCS analysis of the NHANES data indicated no significant non-linear relationships between PNI, albumin, lymphocyte count, and mortality risk (P for overall were 0.041, 0.043, and 0.031, respectively; P for non-linear were 0.138, 0.088, and 0.299, Figures 3D–F). This suggests a more linear relationship between these indicators and mortality risk in the external validation data, differing from the non-linear relationships in the hospital-based data. Overall, external validation results strongly support the validity of PNI and its components as mortality-risk predictive indicators. However, their performance varies across populations, indicating a need for further research to optimize PNI application strategies and enhance its predictive accuracy across different groups.
3.7 Threshold effects of PNI on lung cancer mortality
Table 5 shows that the relationship between PNI and lung cancer mortality has a significant threshold effect. In the NHANES external validation data, the inflection point of PNI is 42.70. When PNI is below 42.70, there is no significant association between PNI and lung cancer mortality (HR = 1.08, 95% CI: 0.89–1.30, p = 0.43). However, when PNI is greater than or equal to 42.70, PNI is significantly negatively correlated with lung cancer mortality (HR = 0.79, 95% CI: 0.64–0.99, p = 0.04). In the hospital patient data, the inflection point of PNI is 55.95. When PNI is below 55.95, PNI is significantly negatively correlated with lung cancer mortality (HR = 0.90, 95% CI: 0.88–0.93, p < 0.001). However, when PNI is greater than or equal to 55.95, there is no significant association between PNI and lung cancer mortality (HR = 1.05, 95% CI: 0.89–1.23, p = 0.59). These results indicate that the impact of PNI on lung cancer mortality varies significantly at different levels, and the inflection points also differ between data sources. This suggests that in clinical practice, the threshold of PNI should be determined based on specific data sources and patient groups to more accurately assess the prognosis of lung cancer patients.
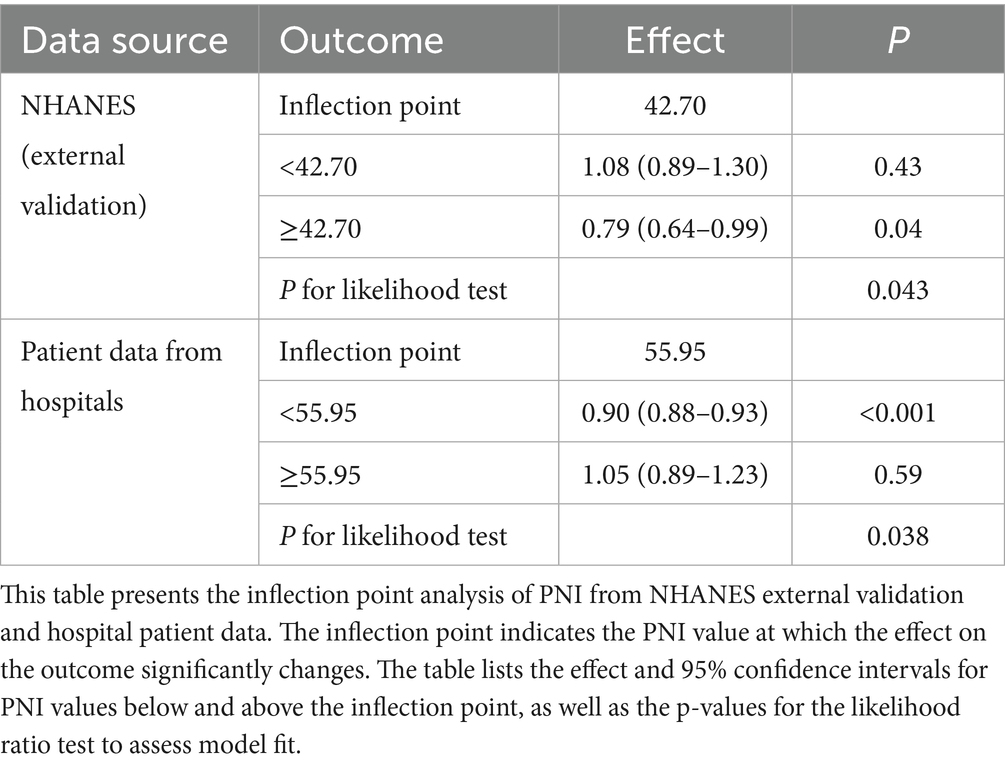
Table 5. Inflection point analysis of PNI and its impact on lung cancer mortality.
4 Discussion
Our study robustly establishes the PNI as a significant predictor of all-cause mortality in lung cancer patients, with consistent results across various analytical methods and datasets. This consistency strengthens the validity of PNI as a prognostic tool. PNI captures both nutritional and immune statuses, which are crucial for cancer progression and treatment outcomes (24).
The biological basis of PNI’s effectiveness lies in the interplay between nutrition and immunity (25). Serum albumin, reflecting nutritional status, is vital for immune function and metabolic support. Adequate nutrition enhances immune responses, while malnutrition and hypoalbuminemia weaken them, increasing infection and treatment complication risks (26, 27). Lymphocytes, key players in adaptive immunity, mediate immune responses against cancer. A low lymphocyte count indicates impaired immune surveillance, facilitating tumor growth (28). By integrating albumin and lymphocyte count, PNI provides a comprehensive assessment of a patient’s physiological state.
Numerous studies support our findings. For instance, a multicenter retrospective study by Fan et al. found that immune-nutritional parameters, including PNI, significantly predict postoperative complications and mortality in elderly lung cancer patients (29). Another study demonstrated that preoperative PNI is an independent predictor of surgical prognosis in hepatocellular carcinoma patients undergoing open hepatectomy (30). These studies reinforce PNI’s validity as a prognostic indicator across different cancer types. Furthermore, to gain a deeper understanding of the clinical utility of PNI, we compared it with other well-established prognostic scoring systems, such as the Glasgow Prognostic Score (GPS) and the Controlling Nutritional Status (CONUT) score. In contrast to GPS, which is more sensitive in assessing the inflammatory status, PNI, by incorporating lymphocyte count, may offer an advantage in predicting responses to immunotherapy (31). Compared to the CONUT score, PNI’s streamlined scoring system could be more readily implemented in clinical practice, potentially reducing variability due to laboratory testing errors (32). This comparison underscores the potential of PNI as a valuable tool in the prognostic assessment of lung cancer patients.
The non-linear relationship between PNI and mortality risk observed in our hospital-based data suggests an optimal PNI range for the best survival outcomes. This may reflect the complex balance between nutritional support and immune activation. Extremely high or low albumin or lymphocyte levels may disrupt this balance, leading to suboptimal outcomes. In contrast, the more linear relationship in the NHANES data indicates that population-specific factors can influence the PNI-mortality association. Furthermore, we have noted that the relationship between PNI and mortality risk exhibits non-linear characteristics in the hospital-based cohort, while it appears more linear in the NHANES cohort. This difference may be associated with the threshold effects of inflammation, the regulatory role of nutritional status, and physiological response variations among different populations. Specifically, the interplay between inflammation and nutrition may influence mortality risk in a non-linear fashion at different PNI levels, and genetic and environmental factors may further modulate this relationship (33). Additionally, a higher proportion of severely ill patients in the hospital cohort may contribute to the stronger non-linear association observed. To better understand these differences, future research is needed across a broader and more diverse range of populations to optimize the application of PNI across various demographics.
In clinical practice, PNI could facilitate individualized treatment strategies. Identifying patients with low PNI values enables early interventions, such as nutritional support or immunotherapy, potentially improving survival outcomes (34). For example, a study by Xia et al. (35) showed that PNI is a significant predictor of survival in patients with non-small cell lung cancer, highlighting its utility in clinical decision-making. Additionally, monitoring PNI changes during treatment could provide real-time prognostic information, allowing timely treatment adjustments (36).
In addition, our study highlights PNI as a significant predictor of all-cause mortality in lung cancer patients, offering a comprehensive assessment of their nutritional and immune statuses. The potential of PNI extends beyond mere prediction; it can also guide the development of personalized treatment plans, including early interventions and decisions regarding immunotherapy. Integrating PNI into electronic health records can enhance evidence-based patient management. However, integrating PNI into clinical workflows presents several challenges. Firstly, a cost–benefit analysis is necessary to evaluate the relationship between the costs of PNI testing and the potential health benefits derived from improved prognostic assessments. Secondly, establishing optimal PNI cutoff values is crucial for ensuring accuracy across diverse populations. Additionally, comorbidities such as infections or chronic liver diseases may affect the components of PNI, thereby impacting its predictive accuracy. Lastly, integrating PNI into electronic health records and clinical decision support systems may require additional technical support and training. Despite these challenges, through multidisciplinary collaboration and further research, PNI has the potential to be effectively incorporated into clinical workflows, ultimately improving prognostic assessments and treatment decisions for lung cancer patients.
Future research should explore the therapeutic implications of targeting PNI components. Nutritional interventions to boost albumin levels and immunotherapies to enhance lymphocyte counts could be evaluated for their potential to improve patient outcomes. Furthermore, investigating the molecular mechanisms underlying the PNI-mortality relationship may uncover new therapeutic targets. For example, research on the role of albumin in modulating the tumor microenvironment and the specific immune mechanisms by which lymphocytes combat cancer cells could provide deeper insights into cancer biology.
In conclusion, our study provides robust evidence highlighting the association of PNI with all-cause mortality in lung cancer patients. The biological plausibility of PNI, as supported by existing literature, and its demonstrated predictive power across different datasets, suggest that PNI could serve as a valuable tool for risk assessment and potentially inform treatment planning. However, our findings do not establish causality, and further research is needed to explore the underlying mechanisms and the therapeutic implications of targeting PNI components. Future studies should aim to elucidate the causal pathways linking PNI to mortality outcomes and to determine how PNI could be optimally integrated into clinical workflows to enhance patient care.
5 Limitations
This study recognizes several limitations. The observed differences between hospital and NHANES data may be attributed to demographic and lifestyle variations, as well as differing clinical environments. The smaller sample size of the NHANES cohort could potentially impact the accuracy of our findings. Furthermore, although our research indicates a significant association between PNI and lung cancer patient mortality, we acknowledge that the components of PNI—albumin and lymphocyte count—may be influenced by factors such as inflammation, liver and kidney function, and acute infections. These factors could act as potential confounders affecting the relationship between PNI and mortality. However, due to the constraints of our study design, we were unable to fully control for all these potential confounding variables. Future research employing more sophisticated statistical methods, such as propensity score matching or multivariate regression models, could better account for these confounders, thereby offering more precise estimates of causal relationships.
Data availability statement
The original contributions presented in the study are included in the article/supplementary material, further inquiries can be directed to the corresponding author.
Ethics statement
The studies involving humans were approved by Lanzhou University Second Hospital. The studies were conducted in accordance with the local legislation and institutional requirements. The participants provided their written informed consent to participate in this study. Written informed consent was obtained from the individual(s) for the publication of any potentially identifiable images or data included in this article.
Author contributions
ZQ: Software, Visualization, Writing – original draft. LL: Visualization, Writing – original draft. MH: Investigation, Visualization, Writing – original draft. CW: Writing – review & editing, Methodology, Supervision, Data curation, Validation.
Funding
The author(s) declare that no financial support was received for the research and/or publication of this article.
Acknowledgments
We thank all the participants and staff in NHANES for their selfless dedication.
Conflict of interest
The authors declare that the research was conducted in the absence of any commercial or financial relationships that could be construed as a potential conflict of interest.
Generative AI statement
The authors declare that no Gen AI was used in the creation of this manuscript.
Any alternative text (alt text) provided alongside figures in this article has been generated by Frontiers with the support of artificial intelligence and reasonable efforts have been made to ensure accuracy, including review by the authors wherever possible. If you identify any issues, please contact us.
Publisher’s note
All claims expressed in this article are solely those of the authors and do not necessarily represent those of their affiliated organizations, or those of the publisher, the editors and the reviewers. Any product that may be evaluated in this article, or claim that may be made by its manufacturer, is not guaranteed or endorsed by the publisher.
References
1. Sung, H, Ferlay, J, Siegel, RL, Laversanne, M, Soerjomataram, I, Jemal, A, et al. Global cancer statistics 2020: GLOBOCAN estimates of incidence and mortality worldwide for 36 cancers in 185 countries. CA Cancer J Clin. (2021) 71:209–49. doi: 10.3322/caac.21660
2. Li, Y, Yan, B, and He, S. Advances and challenges in the treatment of lung cancer. Biomed Pharmacother. (2023) 169:115891. doi: 10.1016/j.biopha.2023.115891
3. Buma, AIG, Schuurbiers, MMF, van Rossum, HH, and van den Heuvel, MM. Clinical perspectives on serum tumor marker use in predicting prognosis and treatment response in advanced non-small cell lung cancer. Tumour Biol. (2024) 46:S207–s217. doi: 10.3233/tub-220034
4. Skřičková, J, Nebeský, T, Kadlec, B, Hejduk, K, Májek, O, Vašáková, M, et al. Lung cancer-dia nosis and early detection. Klin Onkol. (2021) 34:6–19. doi: 10.48095/ccko2021S6
5. Peng, P, Chen, L, Shen, Q, Xu, Z, and Ding, X. Prognostic nutritional index (PNI) and controlling nutritional status (CONUT) score for predicting outcomes of breast cancer: a systematic review and meta-analysis. Pak J Med Sci. (2023) 39:1535–41. doi: 10.12669/pjms.39.5.7781
6. Zhang, Q, Bao, J, Zhu, ZY, and Jin, MX. Prognostic nutritional index as a prognostic factor in lung cancer patients receiving chemotherapy: a systematic review and meta-analysis. Eur Rev Med Pharmacol Sci. (2021) 25:5636–52. doi: 10.26355/eurrev_202109_26783
7. Fanali, G, di Masi, A, Trezza, V, Marino, M, Fasano, M, and Ascenzi, P. Human serum albumin: from bench to bedside. Mol Asp Med. (2012) 33:209–90. doi: 10.1016/j.mam.2011.12.002
8. Belinskaia, DA, Voronina, PA, Shmurak, VI, Jenkins, RO, and Goncharov, NV. Serum albumin in health and disease: esterase, antioxidant, transporting and signaling properties. Int J Mol Sci. (2021) 22:22 20210925. doi: 10.3390/ijms221910318
9. Manolis, AA, Manolis, TA, Melita, H, Mikhailidis, DP, and Manolis, AS. Low serum albumin: a neglected predictor in patients with cardiovascular disease. Eur J Intern Med. (2022) 102:24–39. doi: 10.1016/j.ejim.2022.05.004
10. Wang, S, Sun, J, Chen, K, Ma, P, Lei, Q, Xing, S, et al. Perspectives of tumor-infiltrating lymphocyte treatment in solid tumors. BMC Med. (2021) 19:140. doi: 10.1186/s12916-021-02006-4
11. Wu, Y, Yuan, M, Wang, C, Chen, Y, Zhang, Y, and Zhang, J. T lymphocyte cell: a pivotal player in lung cancer. Front Immunol. (2023) 14:20230127. doi: 10.3389/fimmu.2023.1102778
12. Zhang, J, Chen, Y, Zou, L, and Gong, R. Prognostic nutritional index as a risk factor for diabetic kidney disease and mortality in patients with type 2 diabetes mellitus. Acta Diabetol. (2023) 60:235–45. doi: 10.1007/s00592-022-01985-x
13. Kim, H, Shin, DM, Lee, JH, Cho, ES, Lee, HS, Shin, SJ, et al. Combining prognostic nutritional index (PNI) and controlling nutritional status (CONUT) score as a valuable prognostic factor for overall survival in patients with stage I-III colorectal cancer. Front Oncol. (2023) 13:20230130. doi: 10.3389/fonc.2023.1026824
14. Guo, H, Yang, L, Liu, J, Yu, X, Chen, L, and Huang, Y. Prognostic nutritional index and the risk of postoperative complications after spine surgery: a meta-analysis. World Neurosurg. (2024) 185:e572–81. doi: 10.1016/j.wneu.2024.02.077
15. Chen, SB, Liu, DT, and Chen, YP. The impact of preoperative nutritional status on the survival of patients with esophageal squamous cell carcinoma. Front Surg. (2021) 8:752792. doi: 10.3389/fsurg.2021.752792
16. Ye, J, Xie, Y, Ran, B, and Han, P. Prognostic impact of nutritional indicators based on lasso-cox regression for non-muscle-invasive bladder cancer. Front Nutr. (2025) 12:20250428. doi: 10.3389/fnut.2025.1560655
17. Li, D, Yuan, X, Liu, J, Li, C, and Li, W. Prognostic value of prognostic nutritional index in lung cancer: a meta-analysis. J Thorac Dis. (2018) 10:5298–307. doi: 10.21037/jtd.2018.08.51
18. Wang, Z, Wang, Y, Zhang, X, and Zhang, T. Pretreatment prognostic nutritional index as a prognostic factor in lung cancer: review and meta-analysis. Clin Chim Acta. (2018) 486:303–10. doi: 10.1016/j.cca.2018.08.030
19. Zhang, W, Ji, L, Wang, X, Zhu, S, Luo, J, Zhang, Y, et al. Nomogram predicts risk and prognostic factors for bone metastasis of pancreatic cancer: a population-based analysis. Front Endocrinol. (2021) 12:752176. doi: 10.3389/fendo.2021.752176
20. Pant, A, Sharma, G, Saini, S, Jain, A, Barnwal, RP, Singh, G, et al. Quality by design-steered development and validation of analytical and bioanalytical methods for raloxifene: application of Monte Carlo simulations and variance inflation factor. Biomed Chromatogr. (2023) 37:e5641. doi: 10.1002/bmc.5641
21. Hsieh, FY, Lavori, PW, Cohen, HJ, and Feussner, JR. An overview of variance inflation factors for sample-size calculation. Eval Health Prof. (2003) 26:239–57. doi: 10.1177/0163278703255230
22. Li, Y, Zhao, L, Yu, Y, Zhang, K, Jiang, Y, Wang, Z, et al. Conservative oxygen therapy in critically ill and perioperative period of patients with sepsis-associated encephalopathy. Front Immunol. (2022) 13:20221019. doi: 10.3389/fimmu.2022.1035298
23. Rich, JT, Neely, JG, Paniello, RC, Voelker, CCJ, Nussenbaum, B, and Wang, EW. A practical guide to understanding Kaplan-Meier curves. Otolaryngol Head Neck Surg. (2010) 143:331–6. doi: 10.1016/j.otohns.2010.05.007
24. Zeng, D, Wen, NY, Wang, YQ, Cheng, NS, and Li, B. Prognostic roles nutritional index in patients with resectable and advanced biliary tract cancers. World J Gastroenterol. (2025) 31:97697. doi: 10.3748/wjg.v31.i6.97697
25. Zhang, L, Ma, W, Qiu, Z, Kuang, T, Wang, K, Hu, B, et al. Prognostic nutritional index as a prognostic biomarker for gastrointestinal cancer patients treated with immune checkpoint inhibitors. Front Immunol. (2023) 14:20230721. doi: 10.3389/fimmu.2023.1219929
26. Eckart, A, Struja, T, Kutz, A, Baumgartner, A, Baumgartner, T, Zurfluh, S, et al. Relationship of nutritional status, inflammation, and serum albumin levels during acute illness: a prospective study. Am J Med. (2020) 133:713–22. doi: 10.1016/j.amjmed.2019.10.031
27. Zhang, Z, Pereira, SL, Luo, M, and Matheson, E. Evaluation of blood biomarkers associated with risk of malnutrition in older adults: a systematic review and Meta-analysis. Nutrients. (2017) 9:9 20170803. doi: 10.3390/nu9080829
28. De Fonseka, D, Arnold, DT, Morley, AJ, Brett, M, Bhatt, N, Edey, A, et al. Lymphocyte predominance in blood, pleural fluid, and tumour stroma; a prognostic marker in pleural mesothelioma. BMC Pulm Med. (2022) 22:173. doi: 10.1186/s12890-022-01968-2
29. Fan, R, Chen, Y, Xu, G, Pan, W, Lv, Y, and Zhang, Z. Combined systemic immune-inflammatory index and prognostic nutritional index predict outcomes in advanced non-small cell lung cancer patients receiving platinum-doublet chemotherapy. Front Oncol. (2023) 13:20230403. doi: 10.3389/fonc.2023.996312
30. Liu, C, Zhao, H, Zhang, R, Guo, Z, Wang, P, and Qu, Z. Prognostic value of nutritional and inflammatory markers in patients with hepatocellular carcinoma who receive immune checkpoint inhibitors. Oncol Lett. (2023) 26:437. doi: 10.3892/ol.2023.14024
31. Zhang, CL, Fan, K, Gao, MQ, and Pang, B. Prognostic value of Glasgow prognostic score in non-small cell lung Cancer: a systematic review and Meta-analysis. Pathol Oncol Res. (2022) 28:20220215. doi: 10.3389/pore.2022.1610109
32. Chen, J, Song, P, Peng, Z, Liu, Z, Yang, L, Wang, L, et al. The controlling nutritional status (CONUT) score and prognosis in malignant tumors: a systematic review and meta-analysis. Nutr Cancer. (2022) 74:3146–63. doi: 10.1080/01635581.2022.2059091
33. Zhou, C, Zhou, Y, Wang, T, Wang, Y, Liang, XY, and Kuang, X. Association of prognostic nutritional index with all-cause mortality and cardiovascular mortality: a nationwide population-based cohort study. Front Nutr. (2025) 12:20250714. doi: 10.3389/fnut.2025.1530452
34. He, M, Fan, Q, Zhu, Y, Liu, D, Liu, X, Xu, S, et al. The need for nutritional assessment and interventions based on the prognostic nutritional index for patients with femoral fractures: a retrospective study. Perioper Med. (2021) 10:20211220. doi: 10.1186/s13741-021-00232-1
35. Xia, H, Zhang, W, Zheng, Q, Zhang, Y, Mu, X, Wei, C, et al. Predictive value of the prognostic nutritional index in advanced non-small cell lung cancer patients treated with immune checkpoint inhibitors: a systematic review and meta-analysis. Heliyon. (2023) 9:e17400. doi: 10.1016/j.heliyon.2023.e17400
Keywords: PNI, NHANES, cox proportional hazards regression, RCS, VIF
Citation: Qin Z, Li L, Hou M and Wang C (2025) The relationship between prognostic nutritional index and its components (albumin and lymphocyte count) and all-cause mortality in lung cancer patients: a hospital-based study with database external validation. Front. Nutr. 12:1649334. doi: 10.3389/fnut.2025.1649334
Edited by:
Gang Ye, Sichuan Agricultural University, ChinaReviewed by:
Chuanlong Zhang, Capital Medical University, ChinaPinar Peker, Ministry of Health, Türkiye
Copyright © 2025 Qin, Li, Hou and Wang. This is an open-access article distributed under the terms of the Creative Commons Attribution License (CC BY). The use, distribution or reproduction in other forums is permitted, provided the original author(s) and the copyright owner(s) are credited and that the original publication in this journal is cited, in accordance with accepted academic practice. No use, distribution or reproduction is permitted which does not comply with these terms.
*Correspondence: Cheng Wang, d2FuZ2NoZW5neHcxMjNAc2luYS5jb20=
†These authors have contributed equally to this work and share first authorship