 Mingchen Xie1,2,3†
 Yahui Zhang1,3†
 Haitao Wu1,3†Zeyu Wu1Hao Han1,3Xun Xie1,3Rui Zhang2*
 Jianhua Cheng1*
 Jian Xu1*
- 1Department of Neurosurgery (Diabetes Critical Care Research Consortium), The Affiliated Hospital of Qingdao University, Qingdao, China
- 2Department of Neurological Intensive Care Unit, The Affiliated Hospital of Qingdao University, Qingdao, China
- 3Qingdao University Medical College, Qingdao University, Qingdao, China
Background: Hyperglycemic crisis events (HCEs)—encompassing diabetic ketoacidosis (DKA) and hyperosmolar hyperglycemic state (HHS)—constitute lethal determinants for patients with diabetic mellitus (DM) in intensive care. The triglyceride-glucose (TyG) index, an emergent insulin resistance surrogate, lacks rigorous investigation regarding HCE occurrence trajectories and prognostic sequelae among critically ill diabetics. This study aims to evaluate the relationship between the TyG index and HCE incidence/clinical outcomes in critically ill patients with DM and to construct a risk prediction model using machine-learning algorithms.
Methods: This multi-center retrospective investigation leveraged clinical repositories from Medical Information Mart for Intensive Care IV (MIMIC-IV) and eICU Collaborative Research Database (eICU-CRD). Inclusion criteria encompassed critically ill subjects with diabetes possessing computable TyG indices within 24 h post-admission. The main study endpoints included death occurring during hospitalization and death within the intensive care unit. TyG index-outcome interrelationships underwent interrogation via logistic regression, restricted cubic spline (RCS), correlation, and linear analytical methodologies. Overlap weighting (OW), inverse probability treatment weighting (IPTW), and propensity score matching (PSM) mitigated confounding influences. Stratified examinations occurred per determinant factors. Five machine-learning architectures constructed mortality prognostication frameworks, with SHapley Additive exPlanations (SHAP) delineating pivotal predictors.
Results: Among 4,098 critically ill patients with DM, 328 developed HCE. Patients with HCE had significantly higher TyG levels [10.2 (9.6–11.0) vs. 9.4 (8.9–9.9)] than non-HCE patients, demonstrating TyG’s discriminative ability for HCE. Through multivariate logistic regression, TyG was pinpointed as a separate risk element for both in-hospital (OR 1.956) and ICU death (OR 2.260), linked to extended hospital stays. RCS established a direct positive correlation between increased TyG levels and death rates (nonlinear p = 0.161 and 0.457), continuing even after adjusting for PSM, OW, and IPTW. Subgroup analyses reinforced TyG’s consistent mortality correlation. Machine-learning models, particularly XGBoost, achieved higher predictive accuracy, with TyG as a key component.
Conclusion: Elevated TyG index shows a notable correlation with the occurrence of HCE and negative results in critically ill patients with DM. Advanced multivariate machine-learning models are adept at pinpointing patients at high risk, thereby facilitating prompt clinical action.
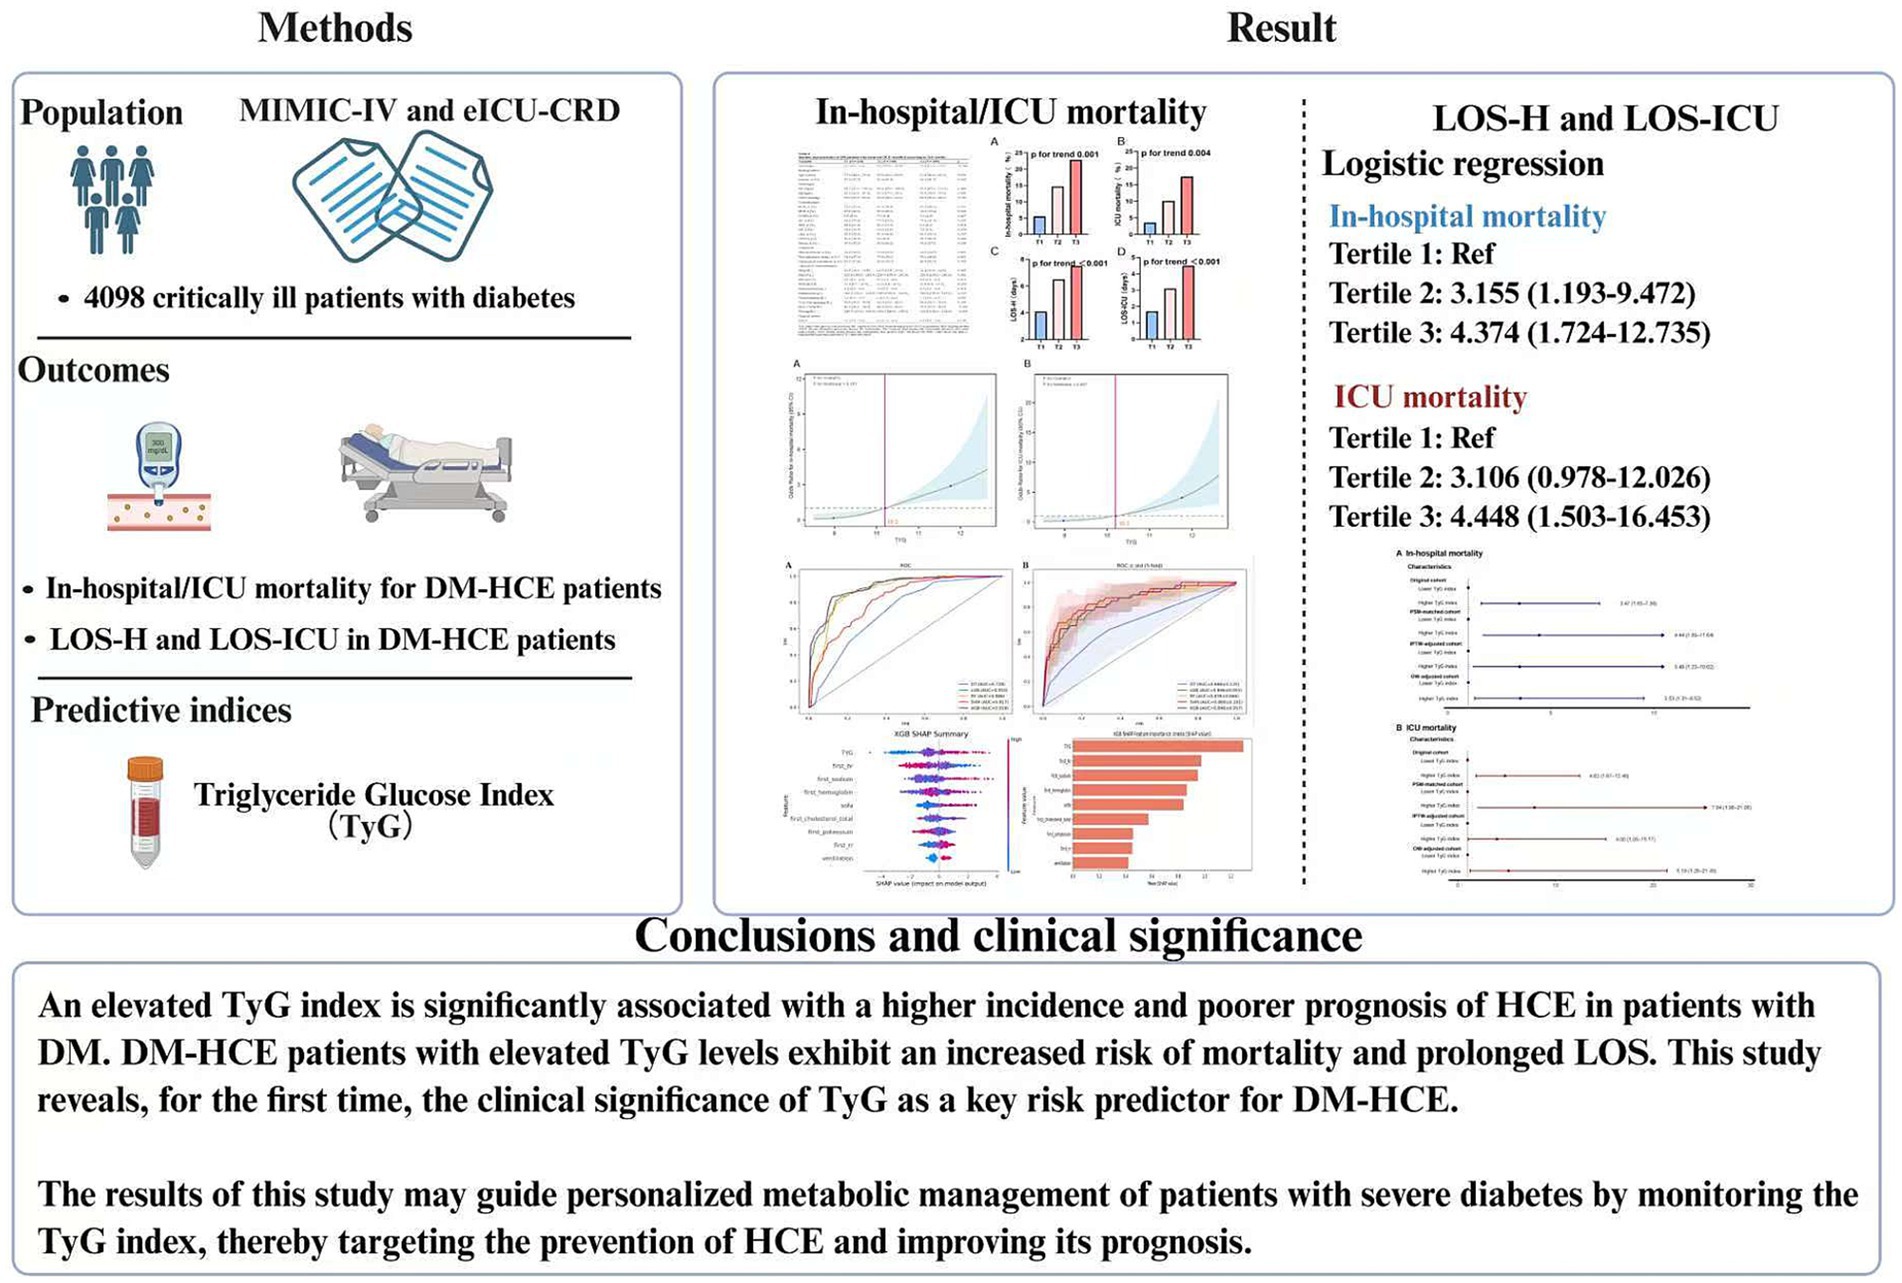
Graphical Abstract.
Introduction
The hyperglycemic crisis event (HCE), encompassing conditions like diabetic ketoacidosis (DKA) and hyperosmolar hyperglycemic state (HHS), stands as the gravest immediate metabolic issue in patients with diabetes mellitus (DM) (1), with a mortality rate within hospitals reaching 5–20% (2–6). These crises frequently stem from a mix of various elements, such as infections, disruptions in insulin treatment, and metabolic strain (4, 7). Particularly in severely ill patients with DM, the likelihood of HCE escalates markedly because of the metabolic imbalances of the condition and the immediate stress condition. However, there is a lack of effective early warning indicators in clinical practice, and traditional prediction methods mostly rely on laboratory test results after the onset of the crisis, making it difficult to provide a sufficient time window for preventive intervention (8–11). Consequently, investigating dependable biomarkers for early detection of high-risk patients holds clinical importance.
The triglyceride-glucose (TyG) index has garnered extensive recognition recently as an emergent insulin resistance metric (12–15). Synthesizing fasting triglycerides and blood glucose concentrations, this indicator offers enhanced holistic characterization of organismal metabolic dysregulation (16, 17). Current evidence substantiates TyG’s robust correlation not merely with type 2 diabetes onset but also its predictive efficacy regarding chronic sequelae including cardiovascular pathologies (18, 19). Nevertheless, its prognostic utility concerning acute metabolic decompensation, specifically HCE, remains inadequately investigated. Concurrently, critical care informatics evolution and large-scale public repository establishment—notably MIMIC-IV and eICU-CRD—have furnished indispensable investigative substrates (12, 20, 21). These repositories capture expansive clinical parameters, laboratory surveillance metrics, plus granular therapeutic and prognostic documentation, enabling a profound exploration of metabolic indicator-outcome relationships.
The study utilized a retrospective cohort method across multiple centers. Preliminary studies employed logistic regression to evaluate how the TyG index independently correlates with both the occurrence and clinical results of HCE. Subsequently, we utilized machine-learning techniques to develop a predictive model that amalgamated clinical indices, lab parameters, and details of complications. Compared with traditional statistical methods, machine learning can better handle nonlinear relationships and interactions in high-dimensional data, which is expected to improve the accuracy of prediction (22, 23). The study’s findings aim to broaden the comprehension of the TyG index’s clinical significance and offer a useful instrument for risk evaluation in clinical settings, facilitating early detection and accurate treatment for HCE.
Methods
Study design and population
This multi-institutional retrospective observational cohort investigation sought to evaluate TyG index associations with HCE incidence and clinical trajectories among critically ill patients with diabetes, plus construct a multivariable predictor integrating indicators via machine-learning algorithms. We compiled 4,098 admission records from MIMIC-IV and eICU-CRD repositories. All diagnoses underwent dual corroboration through ICD-9/10 classification coding and clinical assessment benchmarks (Supplementary Table S1) (24). Post-screening for critical illness diabetes confirmation, exclusion criteria comprised: (1) age <18 years; (2) absent fasting glucose or triglyceride documentation within 24 h post-admission; (3) gestational or secondary DM (e.g., pancreatic origin). For recurrent admissions, solely, the initial ICU records underwent extraction.
The study analysis consisted of three main parts: first, the difference in TyG levels between critically ill patients with DM who developed HCE and those who did not was examined. Next, subgroup analyses of the DM-HCE population were performed based on TyG levels or mortality status. Ultimately, the application of machine-learning techniques led to the development of predictive models that amalgamate various indicators.
Data source
MIMIC-IV constitutes a publicly available repository originating solely from Beth Israel Deaconess Medical Center, housing exhaustive high-fidelity clinical records for ICU admissions. This investigation incorporated patient histories, diagnostic evaluations, and therapeutic measures spanning 2008–2019 (20). BIDMC’s Institutional Review Board provided ethics authorization, dispensing with individual consent mandates. Researcher MCX executed dataset curation.
The eICU-CRD serves as an extensive database, encompassing clinical data from more than 200,000 admissions to intensive care units in 208 U.S. healthcare institutions. In this research, scientists employed patient information gathered from 2014 to 2015, which included comprehensive records of physiological factors, diagnostic test results, and drug therapies. This openly available database is maintained through official channels. The data collection was conducted by investigator MCX.
Data extraction
Data acquisition deployed Navicat Premium (v16.3.11). Extracted datasets encompassed: (a) Anthropometric records: age, gender; (b) physiological metrics: pulse rate, respiration frequency, mean arterial pressure within initial hospitalization day; (c) comorbidity documentation: hypertension (HTN), hyperlipidemia (HLP), chronic obstructive pulmonary disease (COPD), heart failure (HF), ischemic heart disease (IHD), myocardial infarction (MI), acute kidney injury (AKI), chronic kidney disease (CKD), and sepsis; (d) laboratory data within 24 h of admission, including hemoglobin (Hb), platelets (Plt), red blood cells (RBC), white blood cells (WBC), potassium, sodium, creatinine, blood urea nitrogen, high-density lipoprotein cholesterol (HDL-C), total cholesterol (TC), triglycerides (TG), and fasting blood glucose; (e) treatments during hospitalization, including glucocorticoids, hypoglycemic therapy, and mechanical ventilation; (f) disease severity scores, such as the Sequential Organ Failure Assessment (SOFA) score. Personal identifiers remained undisclosed. TyG index computation employed: lnfasting TG (mg/dL) * FBG (mg/dL)/2 (25).
Endpoints
Key outcomes focused on mortality within the hospital and in the ICU among individuals suffering from DM-HCE. The secondary goals encompassed the length of stay in hospitalization (LOS-H) and the length of stay in the ICU (LOS-ICU).
Statistical analysis
Analytical procedures utilized R software, GraphPad Prism, and DecisionLinnc software (26). Continuous variable normality underwent Shapiro–Wilk evaluation: normally distributed parameters appeared as mean ± SD, subjected to Student’s t-test or one-way ANOVA; non-normal variables manifested as median (IQR), analyzed via Wilcoxon rank-sum testing. Categorical elements emerged as frequency counts (percentages), examined through χ2 testing or Fisher’s exact methodology. Multicollinearity assessment employed variance inflation factors (VIF), with VIF >5 triggering variable exclusion from multivariate modeling (27). Variables exceeding 10% missing data underwent omission. For 5–10% missing value prevalence, multiple imputation predicted absent values utilizing optimal datasets. Parameters with under 5% missingness received mean value substitution. Statistical significance threshold remained α = 0.05.
Mortality risk associations with the TyG index underwent scrutiny via univariate and multivariate logistic regression frameworks. Analyses treated the TyG index as a categorical or continuous metric. Confounding variables underwent selection predicated upon statistically significant baseline characteristic disparities and acknowledged clinical pertinence. Mortality and LOS trajectories underwent assessment through the TyG index ordinal categorization. Restricted cubic spline (RCS) curves probed potential nonlinear death risk relationships among patients with DM-HCE. Post-stratification of the aggregate DM-HCE cohort per RCS-derived critical thresholds (TyG index <10.2 or ≥10.2), propensity score matching (PSM) protocols, inverse probability treatment weighting (IPTW) adjustments, and overlap weighting (OW) methodologies implemented additional population variation rectification and bias mitigation. Multivariate linear regression alongside correlation assessment evaluated TyG linkages with clinical continuity markers—encompassing LOS and SOFA scores. AUC disparities underwent comparative analysis via DeLong testing. Subgroup stratification occurred by sex, age, comorbidity status, and SOFA severity. Multivariate logistic regression models deployed comprehensive Model 3 covariate adjustment excluding stratification variables. Conclusively, sensitivity analysis evaluated study robustness through exclusionary criteria: subjects manifesting incomplete covariate documentation or ≥1 hypoglycemic episode.
Construction and performance evaluation of machine-learning models
To ascertain paramount predictive factors, Lasso regression implemented feature selection. Study subjects underwent randomized partition into dual cohorts: 80% designated training, 20% testing. Utilizing identified variables, five distinct machine-learning architectures were engineered: Decision Tree (DT), Random Forest (RF), Extreme Gradient Boosting (XGB), Support Vector Machine (SVM), and Light Gradient Boosting Machine (LGB). Fivefold cross-validation mitigated potential bias from singular data partitioning while furnishing enhanced model performance robustness.
Model efficacy underwent appraisal via multiple metrics—receiver operating characteristic curve area (AUROC), specificity, sensitivity, accuracy, and F1-score—with AUROC constituting the predominant evaluative benchmark. The premier model emerged as this investigation’s pivotal predictive instrument. Calibration scrutiny probed congruence between empirical outcomes and projected results; decision curve analysis (DCA) quantified clinical applicability. Supplementary interpretability exploration occurred through SHapley Additive exPlanations (SHAP) value analysis (28).
Results
Elevated TyG index observed in DM population experiencing HCE
Figure 1 depicts a diagrammatic representation of the patient screening procedure, encompassing a total of 4,098 patients [median age: 67.0 (IQR 57.0–77.0); 41.8% female (n = 1,712)]. Within these instances, 328 cases experienced HCE. Table 1 encapsulates the fundamental traits of critically ill patients with DM who experienced HCE in contrast to those who did not.
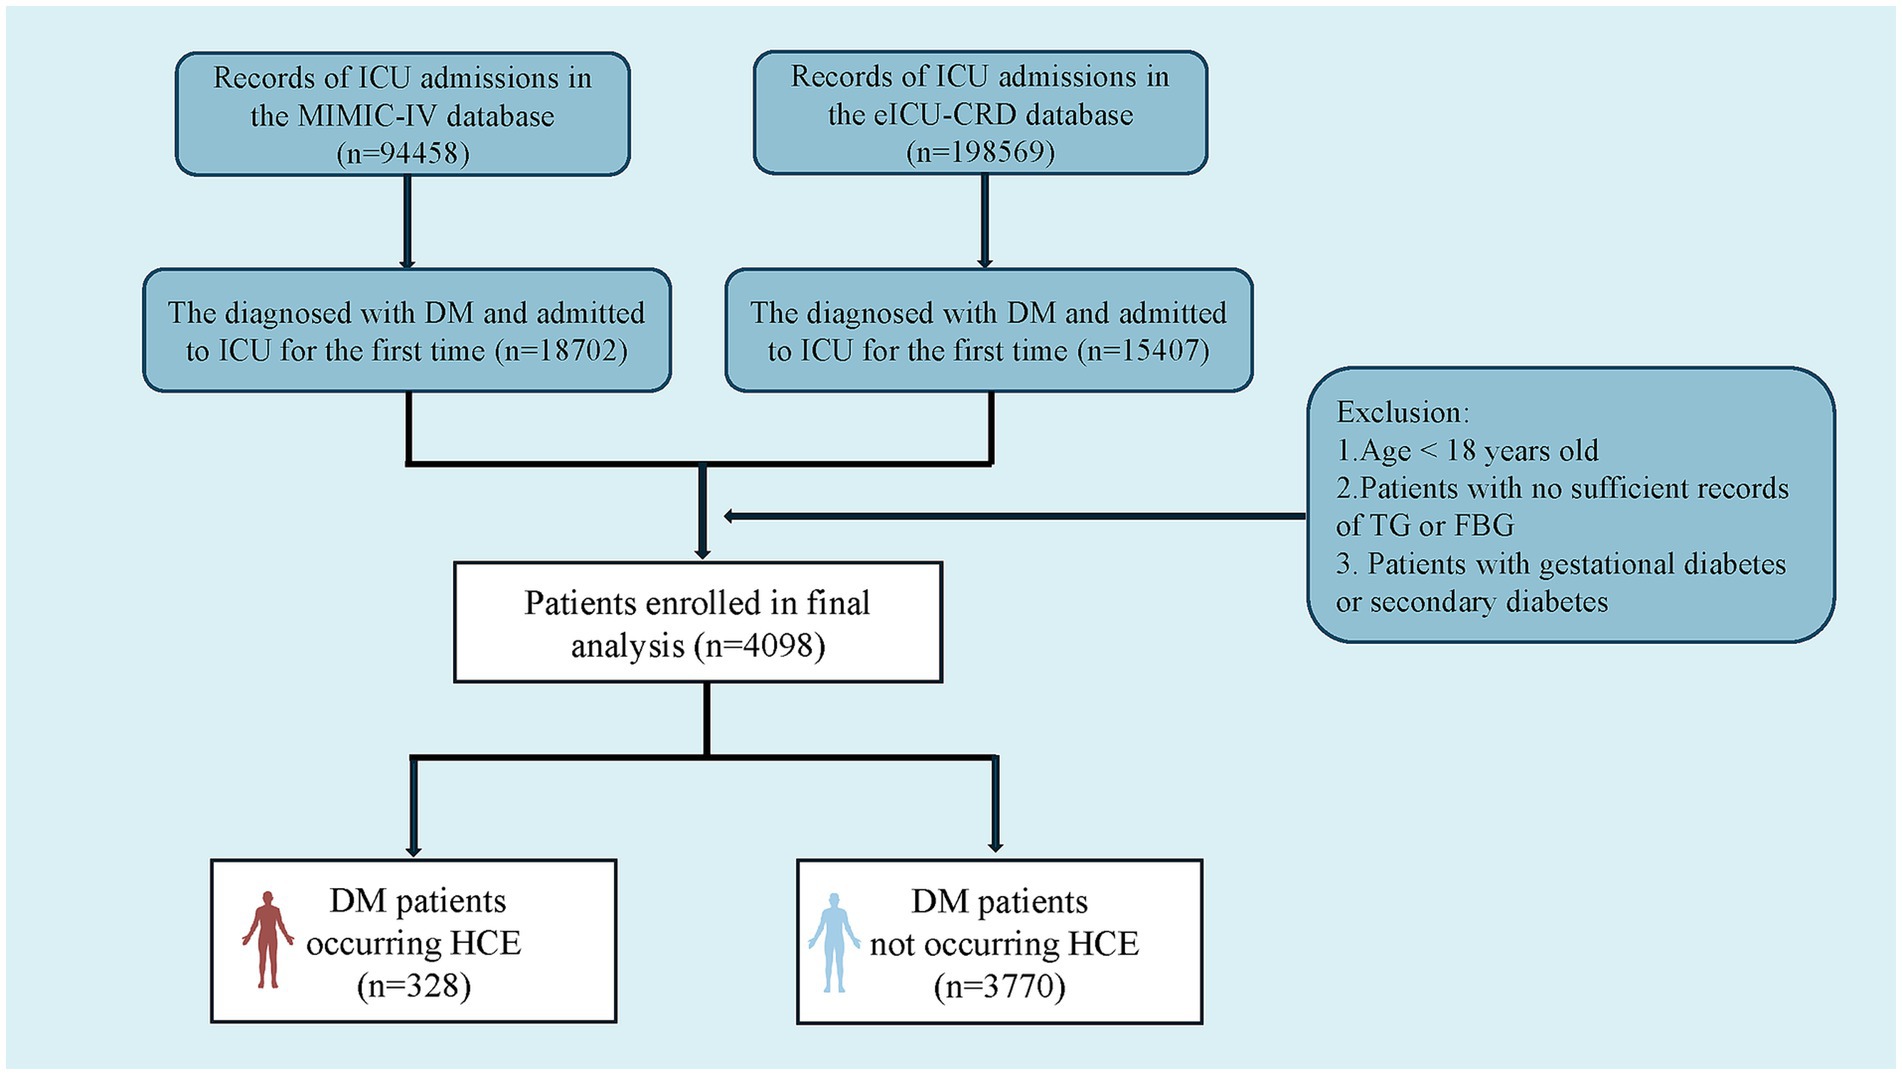
Figure 1. Flowchart of patient selection from the eICU-CRD and the MIMIC-IV databases. TG, triglyceride; FBG, fasting blood glucose; DM, diabetes mellitus; HCE, hyperglycemic crisis episodes; eICU-CRD, eICU Collaborative Research Database; MIMIC-IV, Medical Information Mart for Intensive Care-IV.
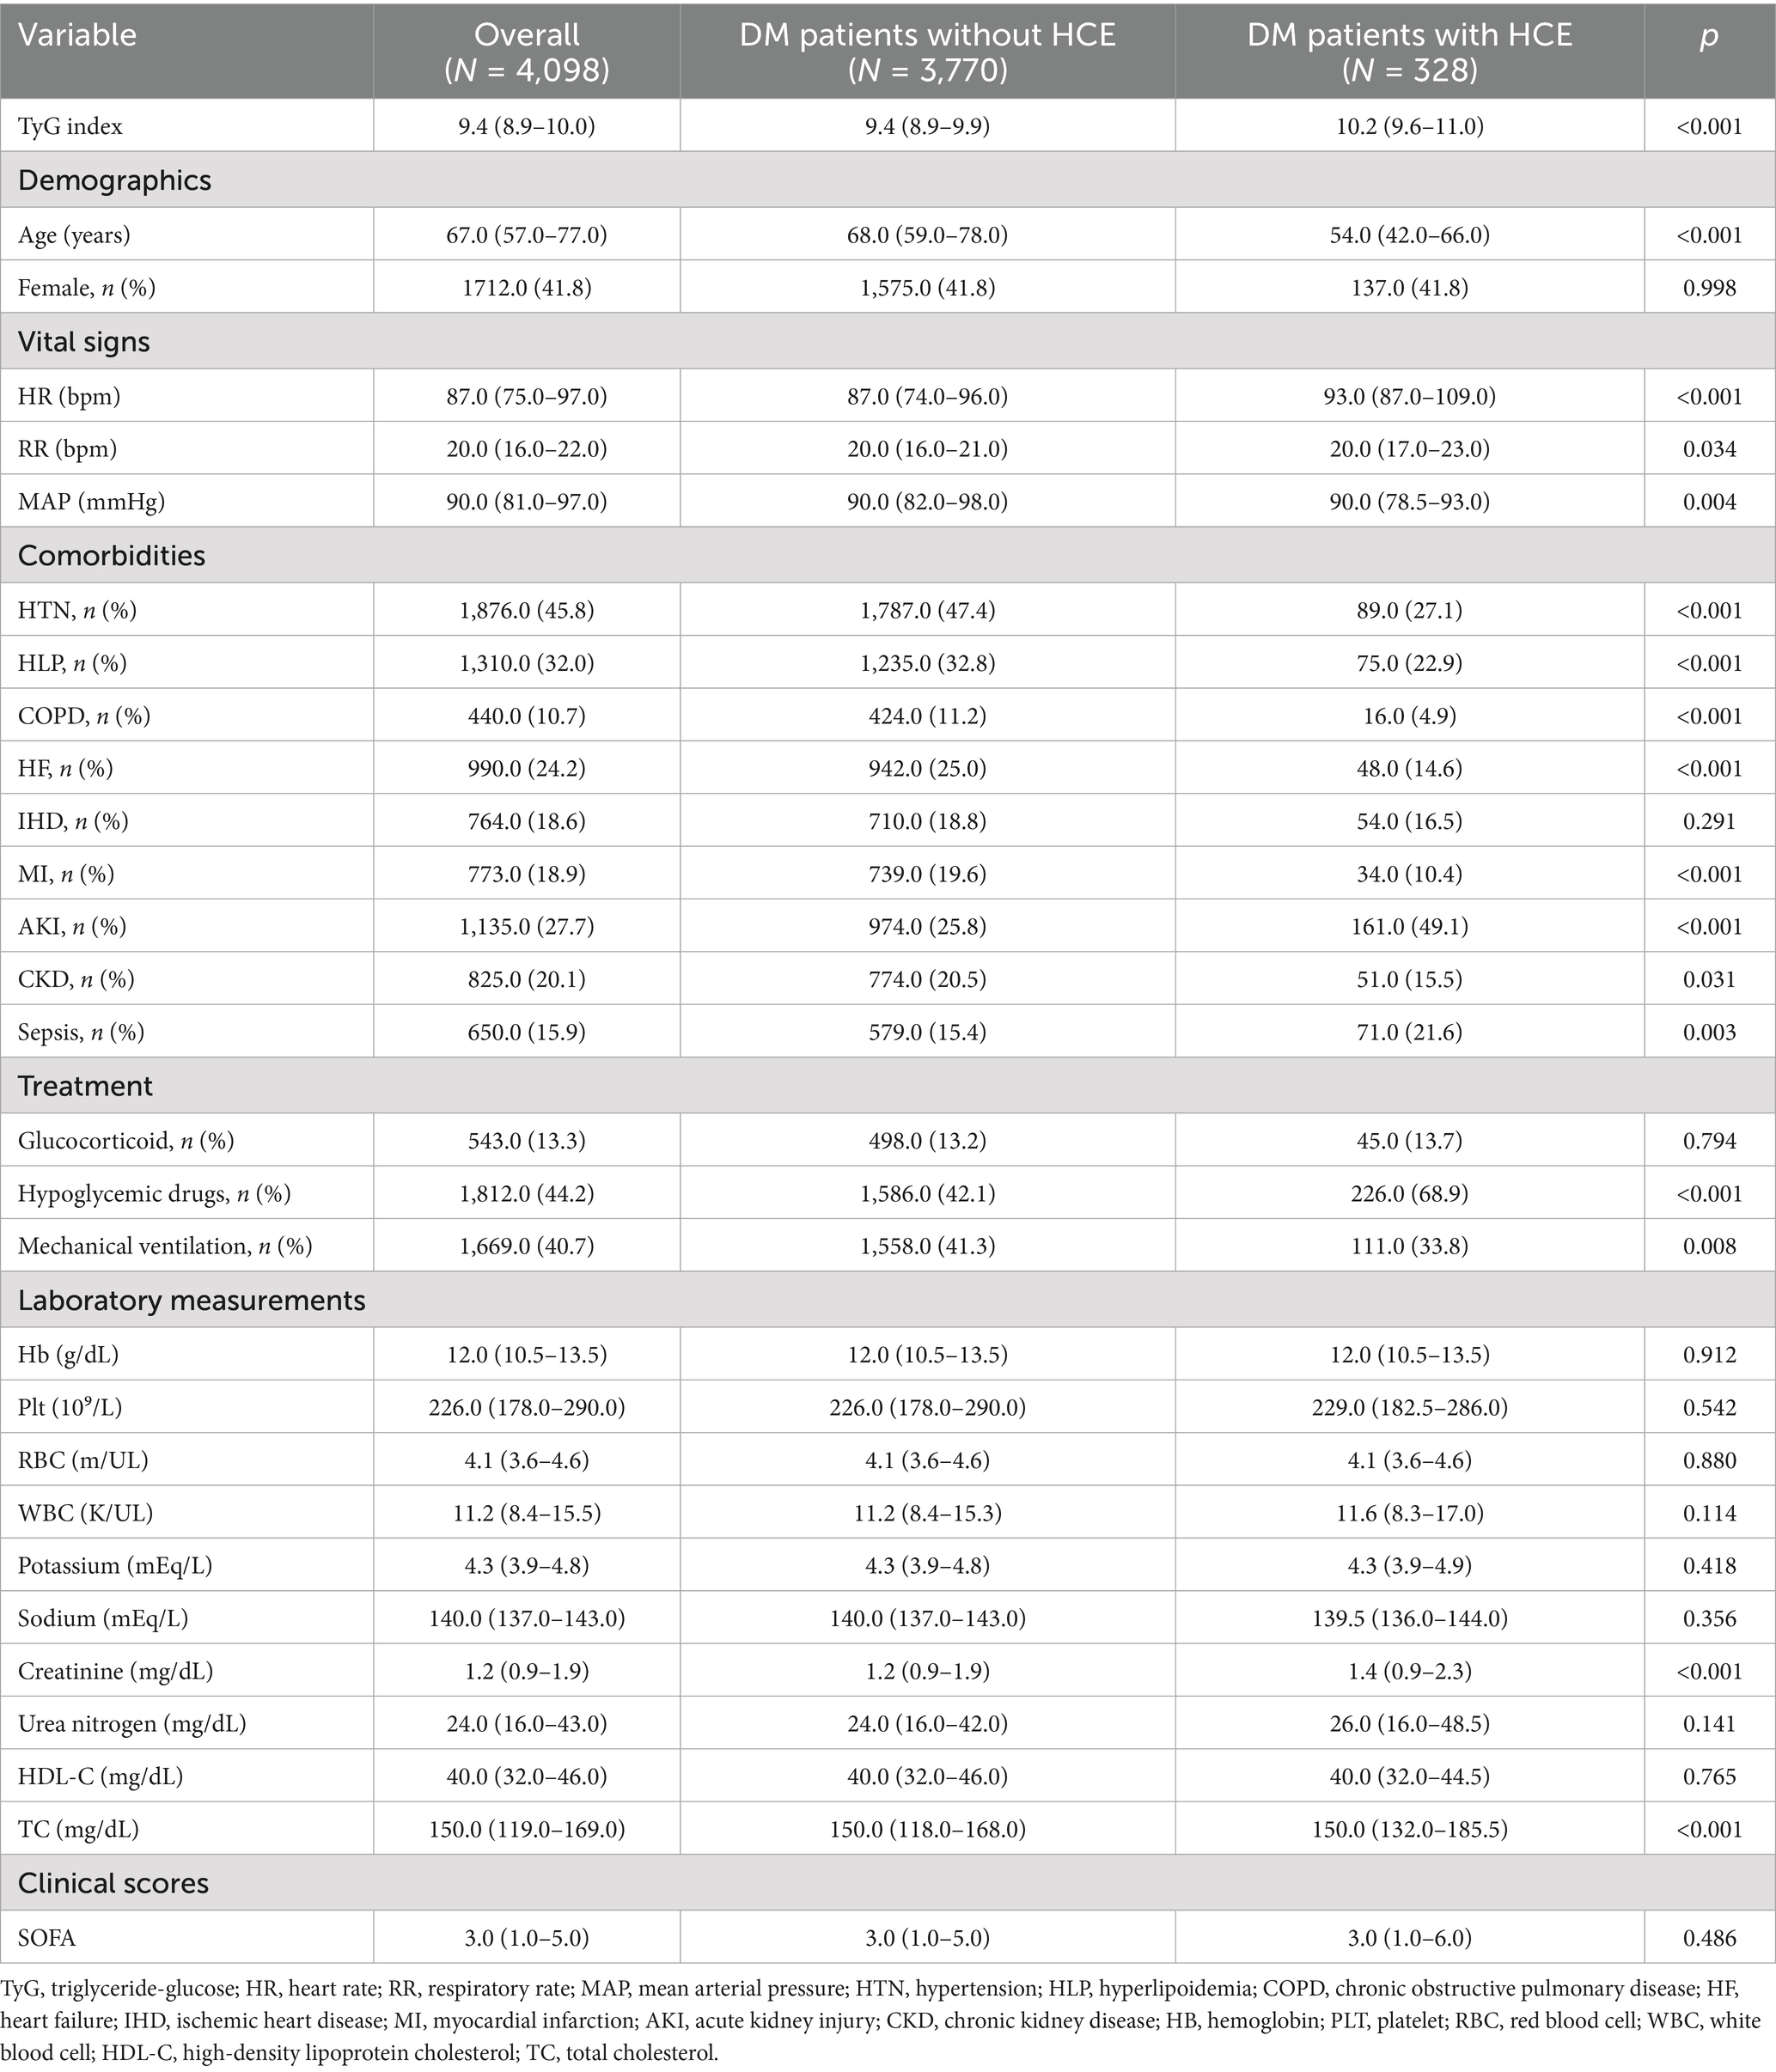
Table 1. Baseline characteristics between DM patients with and without HCE.
Strikingly, critically ill subjects with diabetes manifesting HCE demonstrated considerably amplified TyG index concentrations versus non-HCE counterparts [10.2 (9.6–11.0) vs. 9.4 (8.9–9.9)]. Subsequent logistic regression (Table 2) evaluated TyG’s linkage to HCE propensity among diabetics. The crude model identified TyG as a substantial HCE hazard determinant (OR 2.510; 95% CI: 2.230–2.831). This relationship endured following adjustment for covariates spanning age, sex, HTN, HLP, COPD, HF, MI, AKI, CKD, and sepsis (OR 1.795; 95% CI: 1.576–2.049). Within the fully adjusted Model 3, elevated TyG maintained significant incident HCE linkage (OR 1.806; 95% CI: 1.556–2.101).
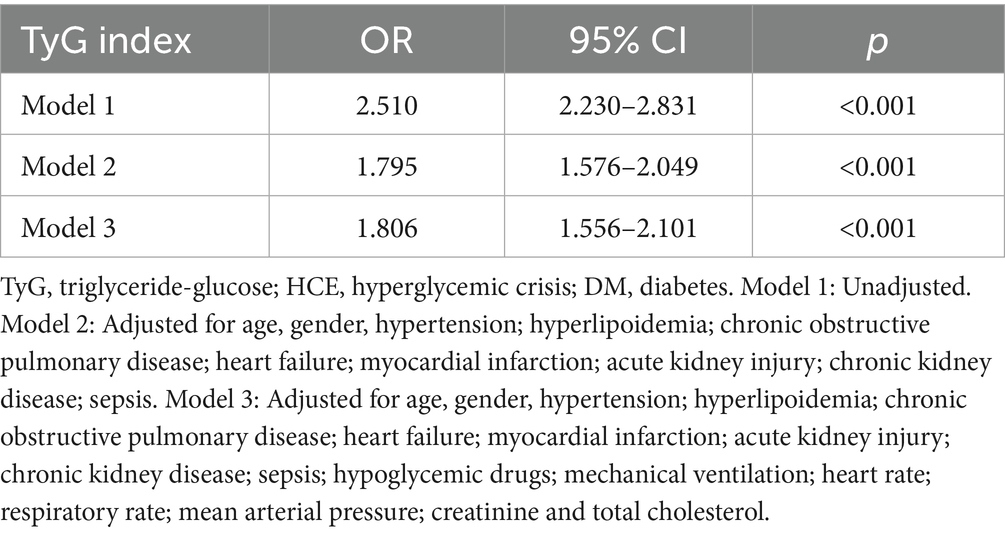
Table 2. Logistic regression analyses for the correlation between the TyG index and the occurrence of HCE among DM populations.
Additionally, the receiver operating characteristic (ROC) curve analysis (refer to Figure 2) revealed TyG’s effective predictive value for HCE in severely ill patients with DM (AUC 0.740, 95% CI: 0.711–0.769). Its predictive performance surpassed that of age, sex, HR, RR, MAP, HTN, HLP, COPD, HF, IHD, MI, AKI, CKD, sepsis, glucocorticoid therapy, hypoglycemic drug therapy, mechanical ventilation, TC, creatinine, and SOFA score (Supplementary Table S2).
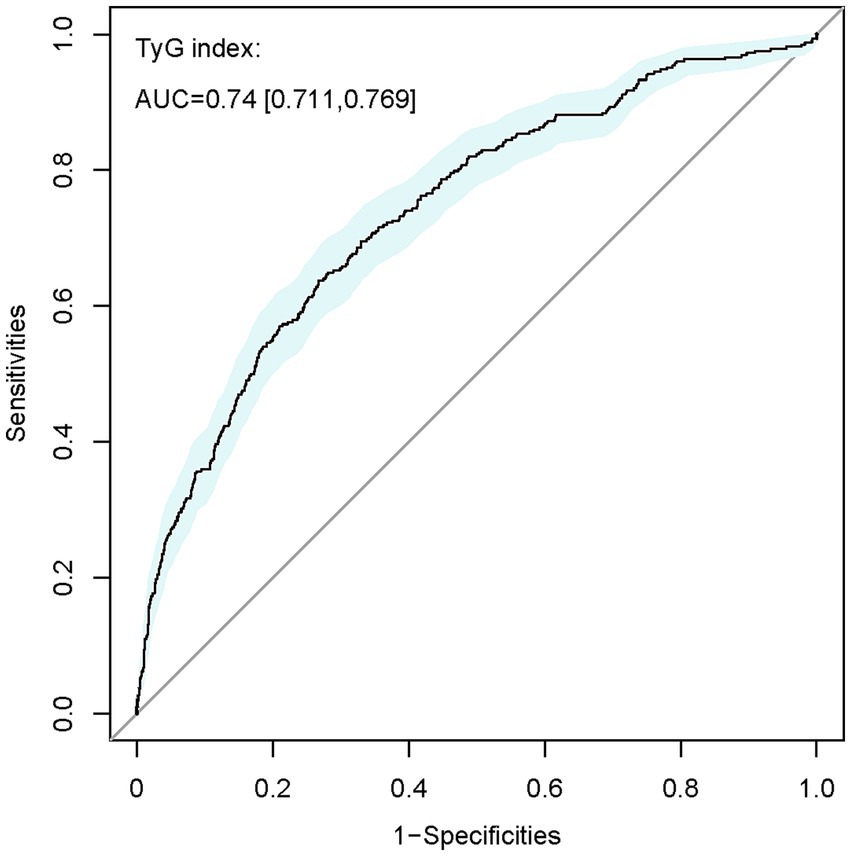
Figure 2. ROC curve of TyG index for identifying patients diagnosed with HCE from the overall DM population. TyG, triglyceride-glucose; AUC, area under the curve.
To sum up, the research verifies a positive correlation between increased TyG levels and the risk of HCE in severely ill patients with DM, indicating the TyG index as a possible forecaster of HCE in this group.
Baseline characteristics and clinical outcomes of the DM-HCE population across different TyG tertiles
We further examined TyG index linkages with clinical sequelae in individuals with DM-HCE. Supplementary Tables S3, S4 document that among 328 critically ill DM subjects developing HCE, 47 succumbed during hospitalization, while 34 expired within ICU confinement. Conspicuously, TyG concentrations proved substantially depressed among hospital discharge survivors [10.1 (9.5–10.8) versus 11.0 (10.2–11.8)] and ICU transfer survivors [10.2 (9.5–10.8) versus 11.5 (10.4–12.0)] relative to corresponding mortality cohorts. Multiple additional baseline parameters diverged considerably between survivor and fatality groups (Supplementary Tables S3, S4). Subsequently, we stratified HCE cases into three cohorts per admission TyG index tertiles (Table 3). Findings indicated that elevated-TyG cohort members demonstrated a propensity for diminished age alongside augmented Hb, RBC, potassium, creatinine, and TC concentrations, coupled with depressed HDL-C levels. Moreover, the uppermost TyG tertile manifested heightened comorbid CKD prevalence.
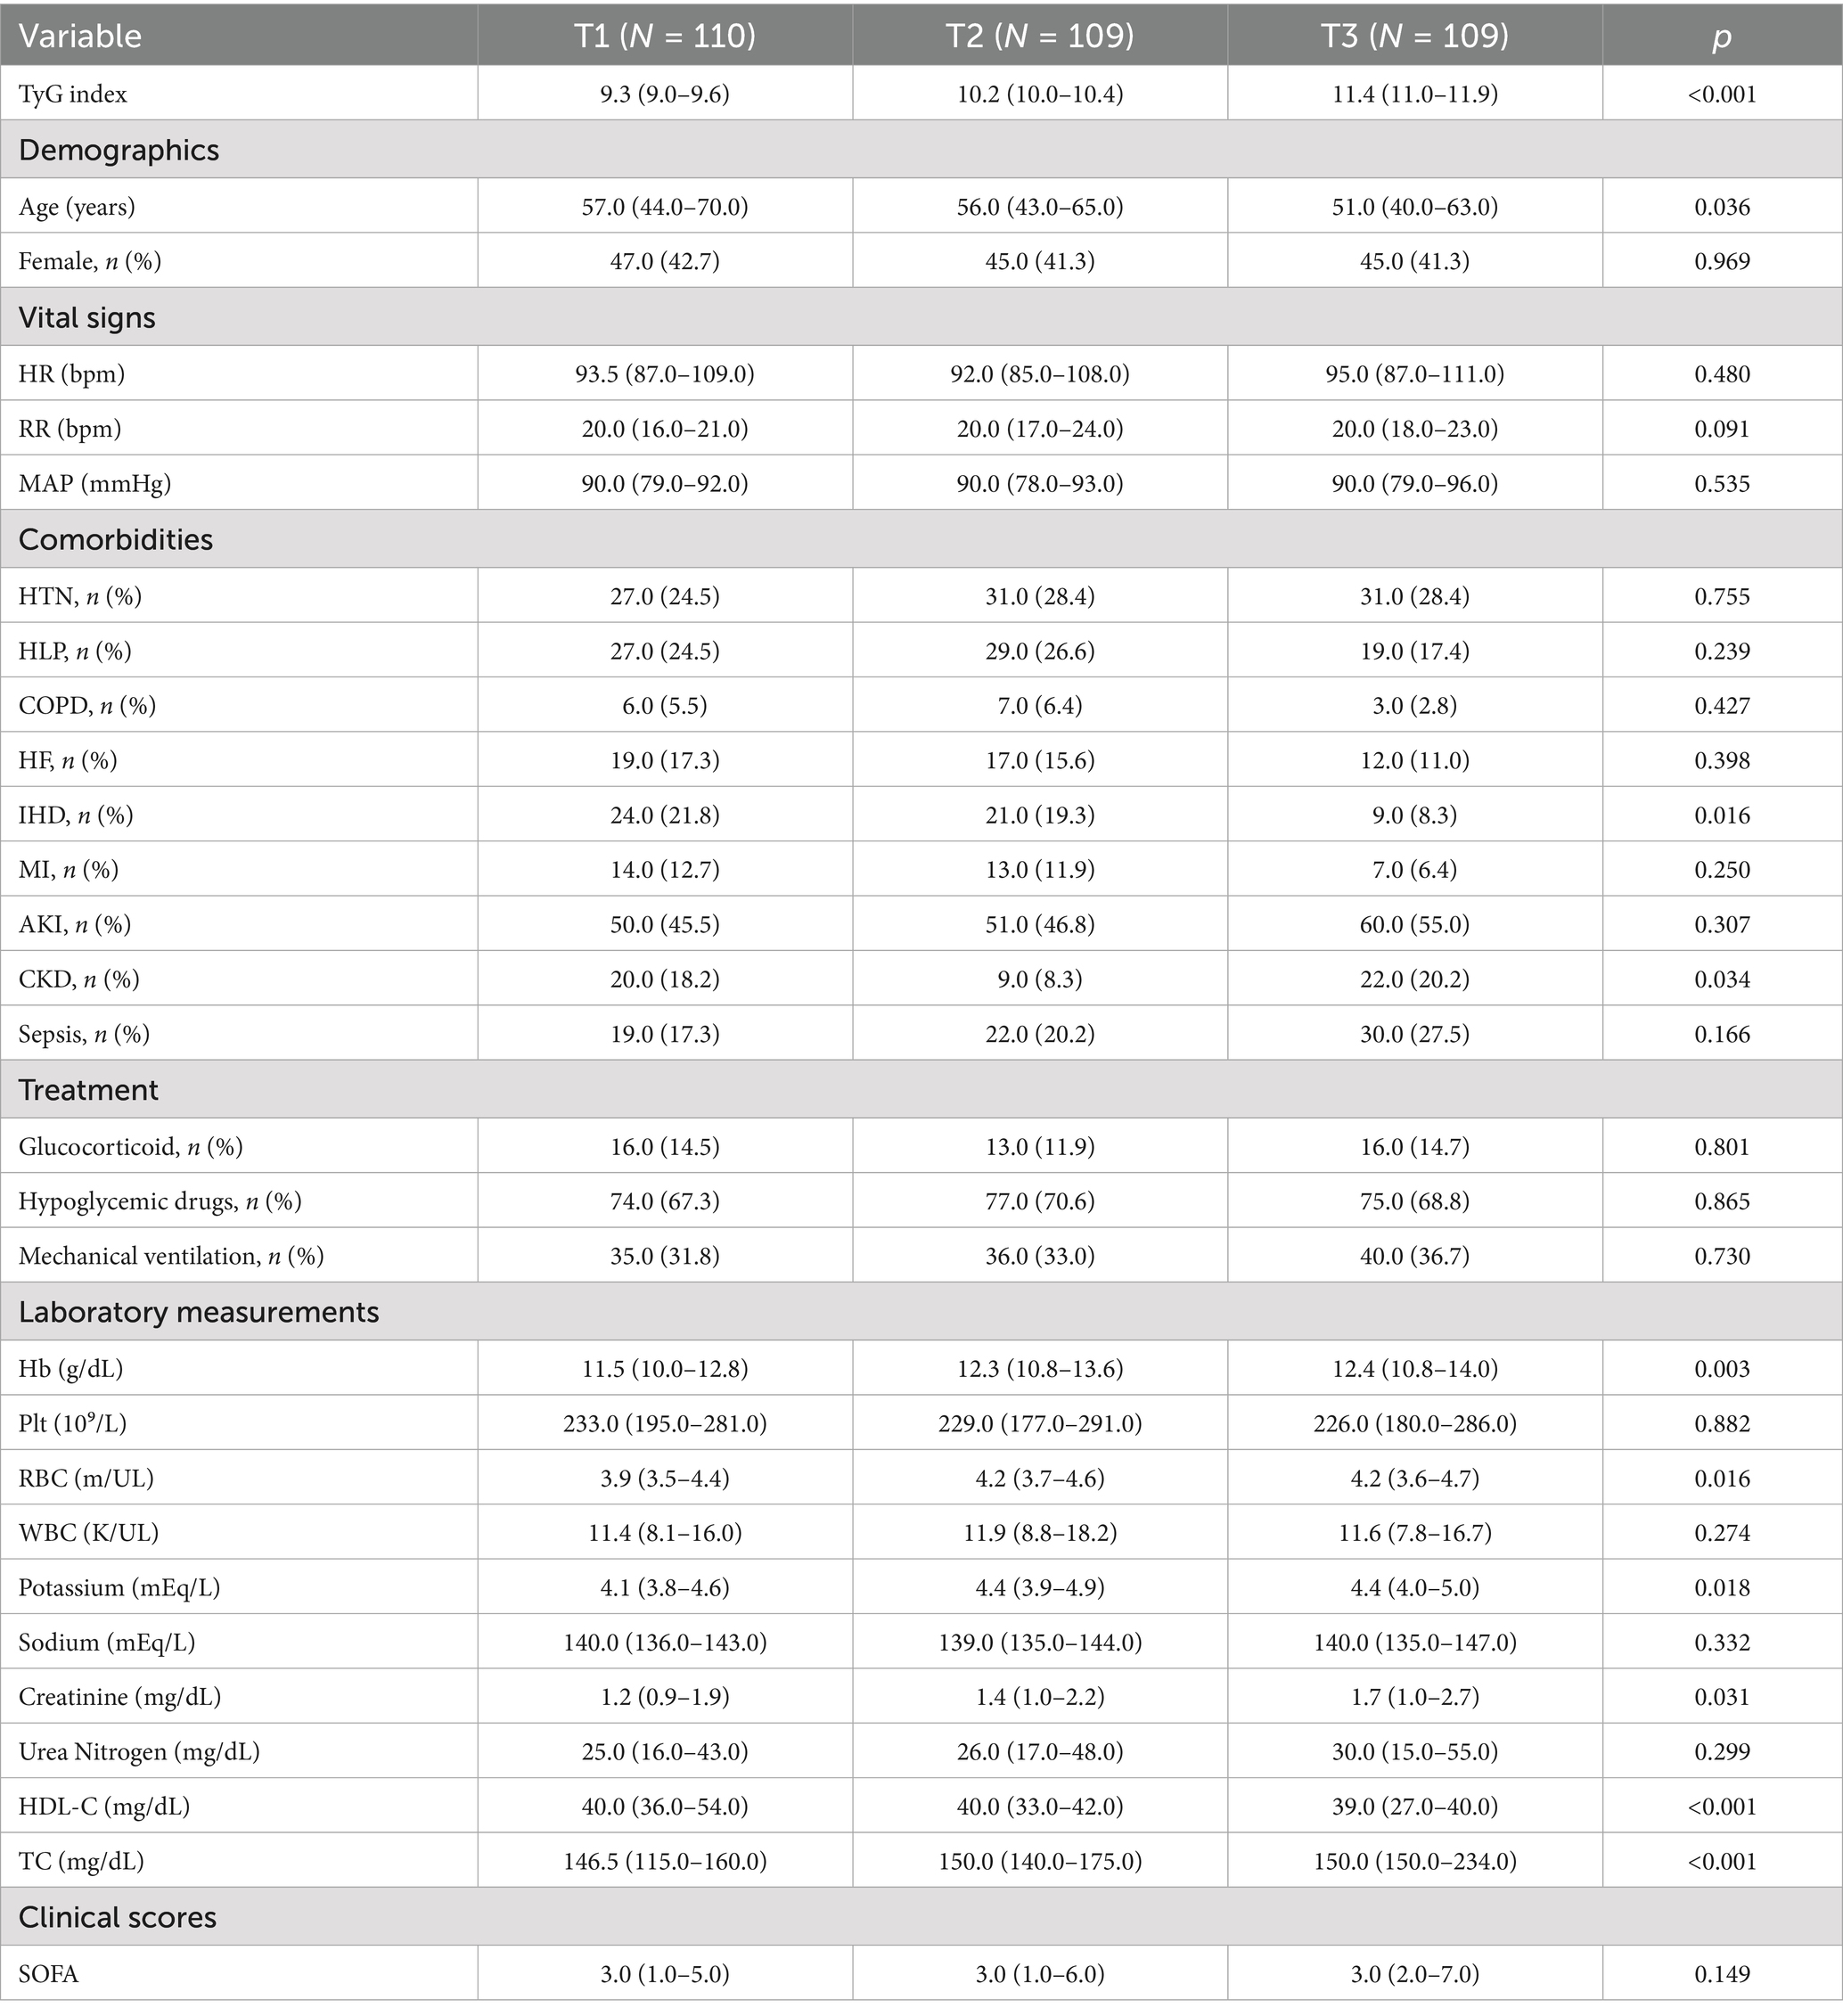
Table 3. Baseline characteristics of DM patients who occurred HCE stratified according to TyG tertiles.
Clinical endpoint event comparisons across the three cohorts are itemized in Table 4. Relative to low-TyG subjects, intermediate- and high-TyG groups manifested substantially elevated in-hospital mortality (5.5% vs. 14.7% vs. 22.9%) and ICU mortality (3.6% vs. 10.1% vs. 17.4%), whereas both LOS-H (4.1 vs. 6.5 vs. 7.5 days) and LOS-ICU (1.7 vs. 3.1 vs. 4.5 days) were markedly protracted. Trend scrutiny (Figure 3) confirmed significant mortality ascension—both in-hospital and ICU—with increasing TyG quartile (trend p < 0.005). Analogously, LOS-H and LOS-ICU exhibited progressive trajectories across tiers (trend p < 0.001).
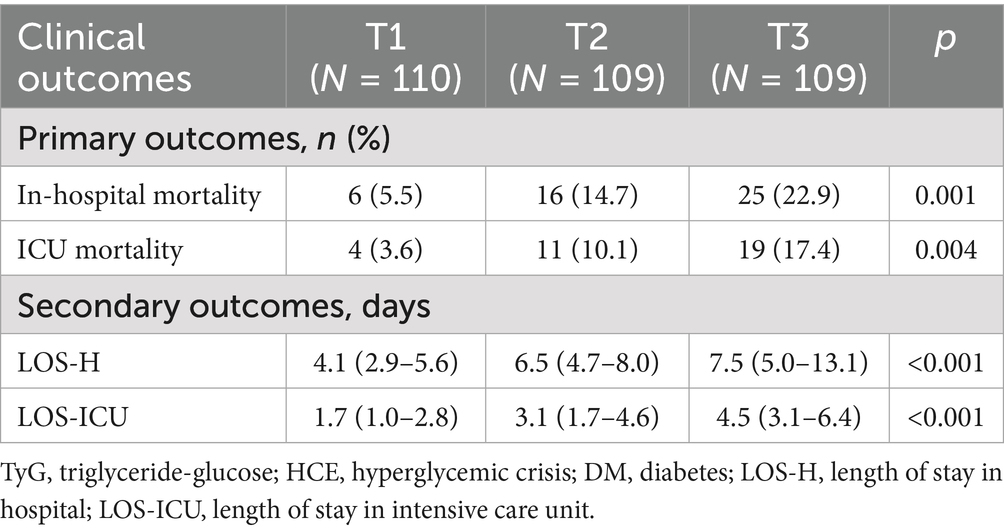
Table 4. Clinical outcome of DM patients who occurred HCE stratified according to TyG tertiles.
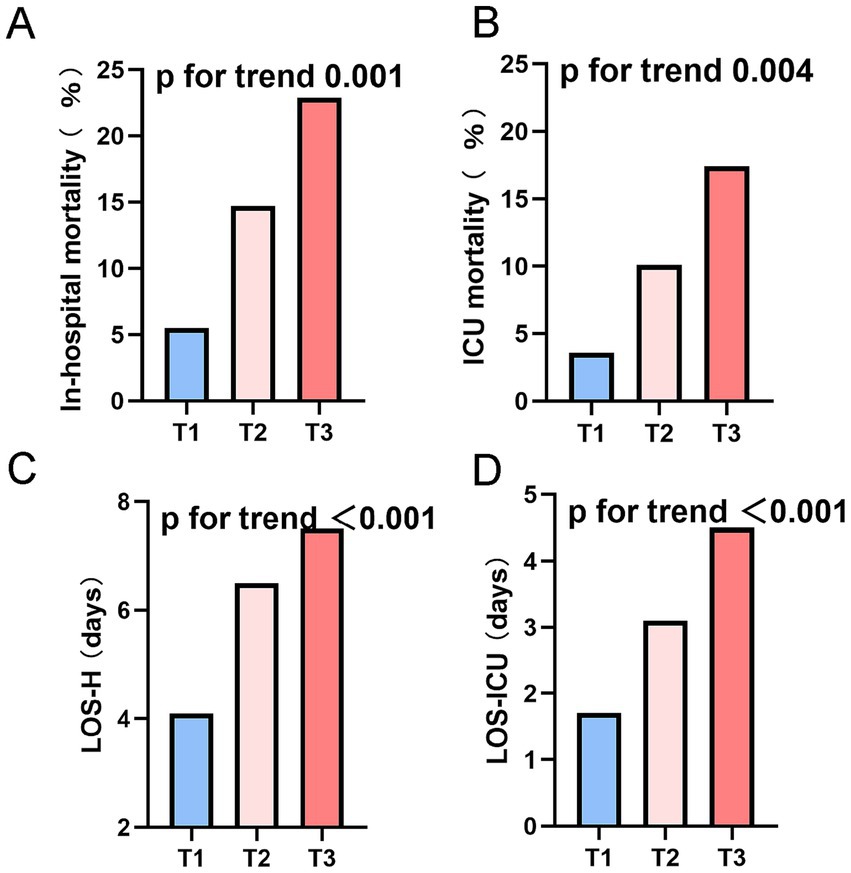
Figure 3. Endpoints stratified by tertiles of the TyG index in the DM-HCE patient population. (A) In-hospital mortality. (B) ICU mortality. (C) LOS-H. (D) LOS-ICU. ICU, intensive care unit; LOS-H, length of stay in hospital; LOS-ICU, length of stay in intensive care unit; T, tertile.
Together, these results imply a potential link between a high TyG index and unfavorable outcomes in DM patients suffering from HCE.
Correlation analysis of TyG index with clinical endpoints in patients with DM-HCE
To probe exhaustively the association binding TyG index and mortality hazard in subjects with DM-HCE, we executed logistic regression analysis (Table 5). Univariate scrutiny disclosed TyG, as a continuous metric, correlated significantly with fatality risk: in-hospital mortality OR = 2.067 (95% CI: 1.555–2.798) and ICU mortality OR = 2.416 (95% CI: 1.744–3.440). Augmented investigation demonstrated that mortality hazard was magnified to 5.159-fold for in-hospital death (95% CI: 2.147–14.412) and 5.594-fold for ICU demise (95% CI: 2.016–19.831) among uppermost versus lowest TyG tertile cohorts. After correcting for confounders, both TyG as a continuous variable (partially corrected model: ORHOS (hospital): 2.038, ORICU: 2.402; fully adjusted model: ORHOS: 1.956, ORICU: 2.260) and a categorical variable (T3 vs. T1: model 2: ORHOS: 4.367, ORICU: 4.483; model 3: ORHOS: 4.374, ORICU: 4.448), this correlation remained statistically significant. The trend analysis revealed a notable gradual increase in mortality risk correlating with rising TyG quartiles (p-value below 0.05 across all trends).
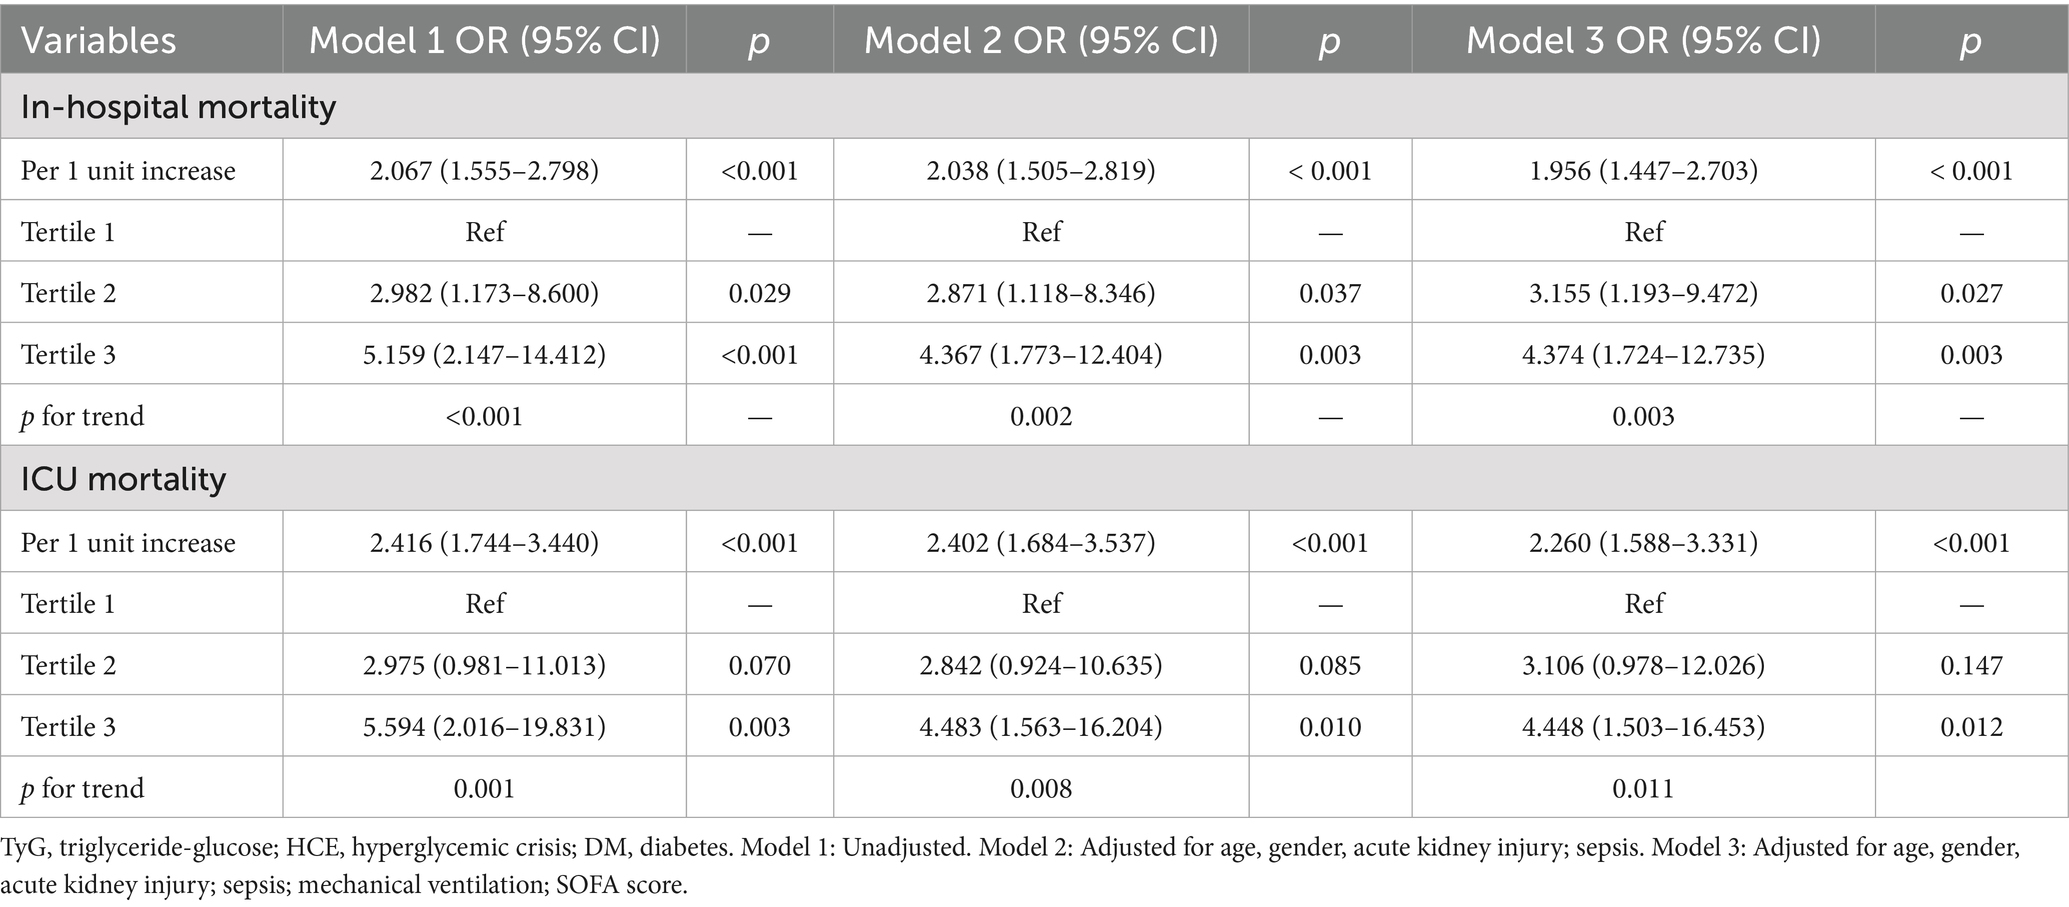
Table 5. Logistic regression analyses for the correlation between the TyG index and in-hospital mortality in DM populations post-HCE.
Correlation assessment revealed statistically meaningful associations between TyG concentrations and parameters encompassing LOS-H, LOS-ICU, Hb, RBC, potassium, creatinine, HDL-C, and TC (p < 0.05); conversely, no significant statistical linkage emerged with WBC, sodium, or SOFA scores (Supplementary Table S5). Concurrently, multivariate linear regression modeling outcomes established significant correlations relating TyG to LOS-H (β = 1.141, p < 0.001) and LOS-ICU (β = 1.003, p = 0.039) (Supplementary Table S6).
The results established a strong link between a high TyG index and unfavorable outcomes, also serving as a standalone risk element for death and extended LOS in patients with DM-HCE.
Elevated TyG index was associated with higher mortality risk and extended hospitalization duration in patients with DM-HCE
Post-adjustments for age and gender, the analysis of the RCS curve revealed a notable and direct positive correlation between the TyG index and the likelihood of mortality within the hospital (nonlinear p = 0.161) as well as in the ICU (nonlinear p = 0.457) for TyG levels exceeding 10.2 (Figure 4). Using the TyG cutoff value of 10.2 identified through RCS analysis, we categorized patients with DM-HCE into distinct groups, with their baseline characteristics comparison presented in Supplementary Table S7. In an effort to mitigate possible confounding factors, we conducted additional analyses using PSM, IPTW, and OW. The initial traits of the group, modified for PSM, IPTW, and OW, are elaborated in Supplementary Tables S8–S10, with most covariates exhibiting a balanced distribution.
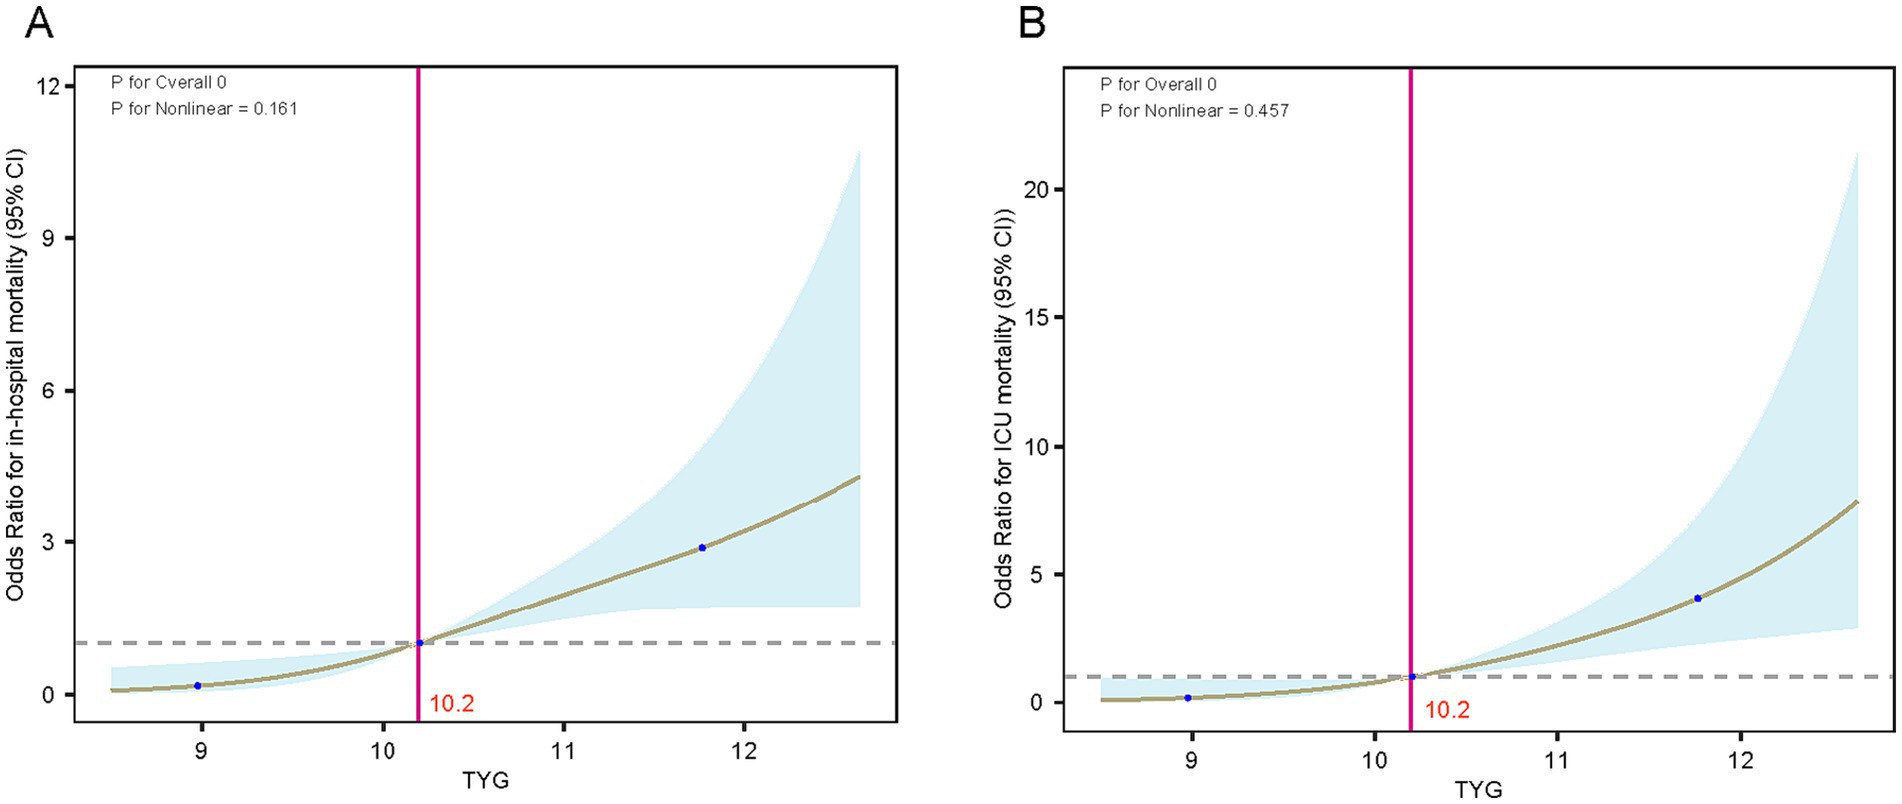
Figure 4. RCS curves of the TyG index in relation to mortality in the DM-HCE patient population. (A) In-hospital mortality. (B) ICU mortality. ICU, intensive care unit; TyG, triglyceride-glucose; CI, confidence interval.
Exhibit Supplementary Table S11 reveals that in the initial group, individuals with high TyG levels (>10.2) experienced a notably greater rate of in-hospital occurrences (6.7% vs. 22.0%) and ICU (3.7% vs. 17.1%) mortality rates, and significantly prolonged LOS-H (4.8 days vs. 6.9 days) and LOS-ICU (1.9 days vs. 4.0 days). This trend was maintained in the PSM-corrected cohort (HOS: 7.4% vs. 24.5%, ICU: 2.1% vs. 17.0%), IPTW-corrected cohort (HOS: 6.6% vs. 17.4%, ICU: 4.3% vs. 13.2%), and OW-corrected cohort (HOS: 5.9% vs. 17.1%, ICU: 2.7% vs. 11.6%) all maintained statistical significance. Notably, the results of the analysis of length of hospitalization also showed consistent regularity: the PSM-corrected cohort (LOS-H: 4.9 days vs. 6.8 days, LOS-ICU: 1.9 days vs. 4.0 days), the IPTW-corrected cohort (LOS-H: 4.4 days vs. 7.3 days, LOS-ICU: 1.7 days vs. 4.0 days), and the OW-corrected cohort (LOS-H: 4.8 days vs. 6.9 days, LOS-ICU: 1.9 days vs. 4.0 days) in the high TyG group showed longer hospitalization cycles. Furthermore, logistic regression analysis revealed a significant link between increased TyG levels and mortality in the hospital and ICU, in both the initial group and those adjusted for PSM, OW, or IPTW (all p-values were less than 0.05) (Figure 5).
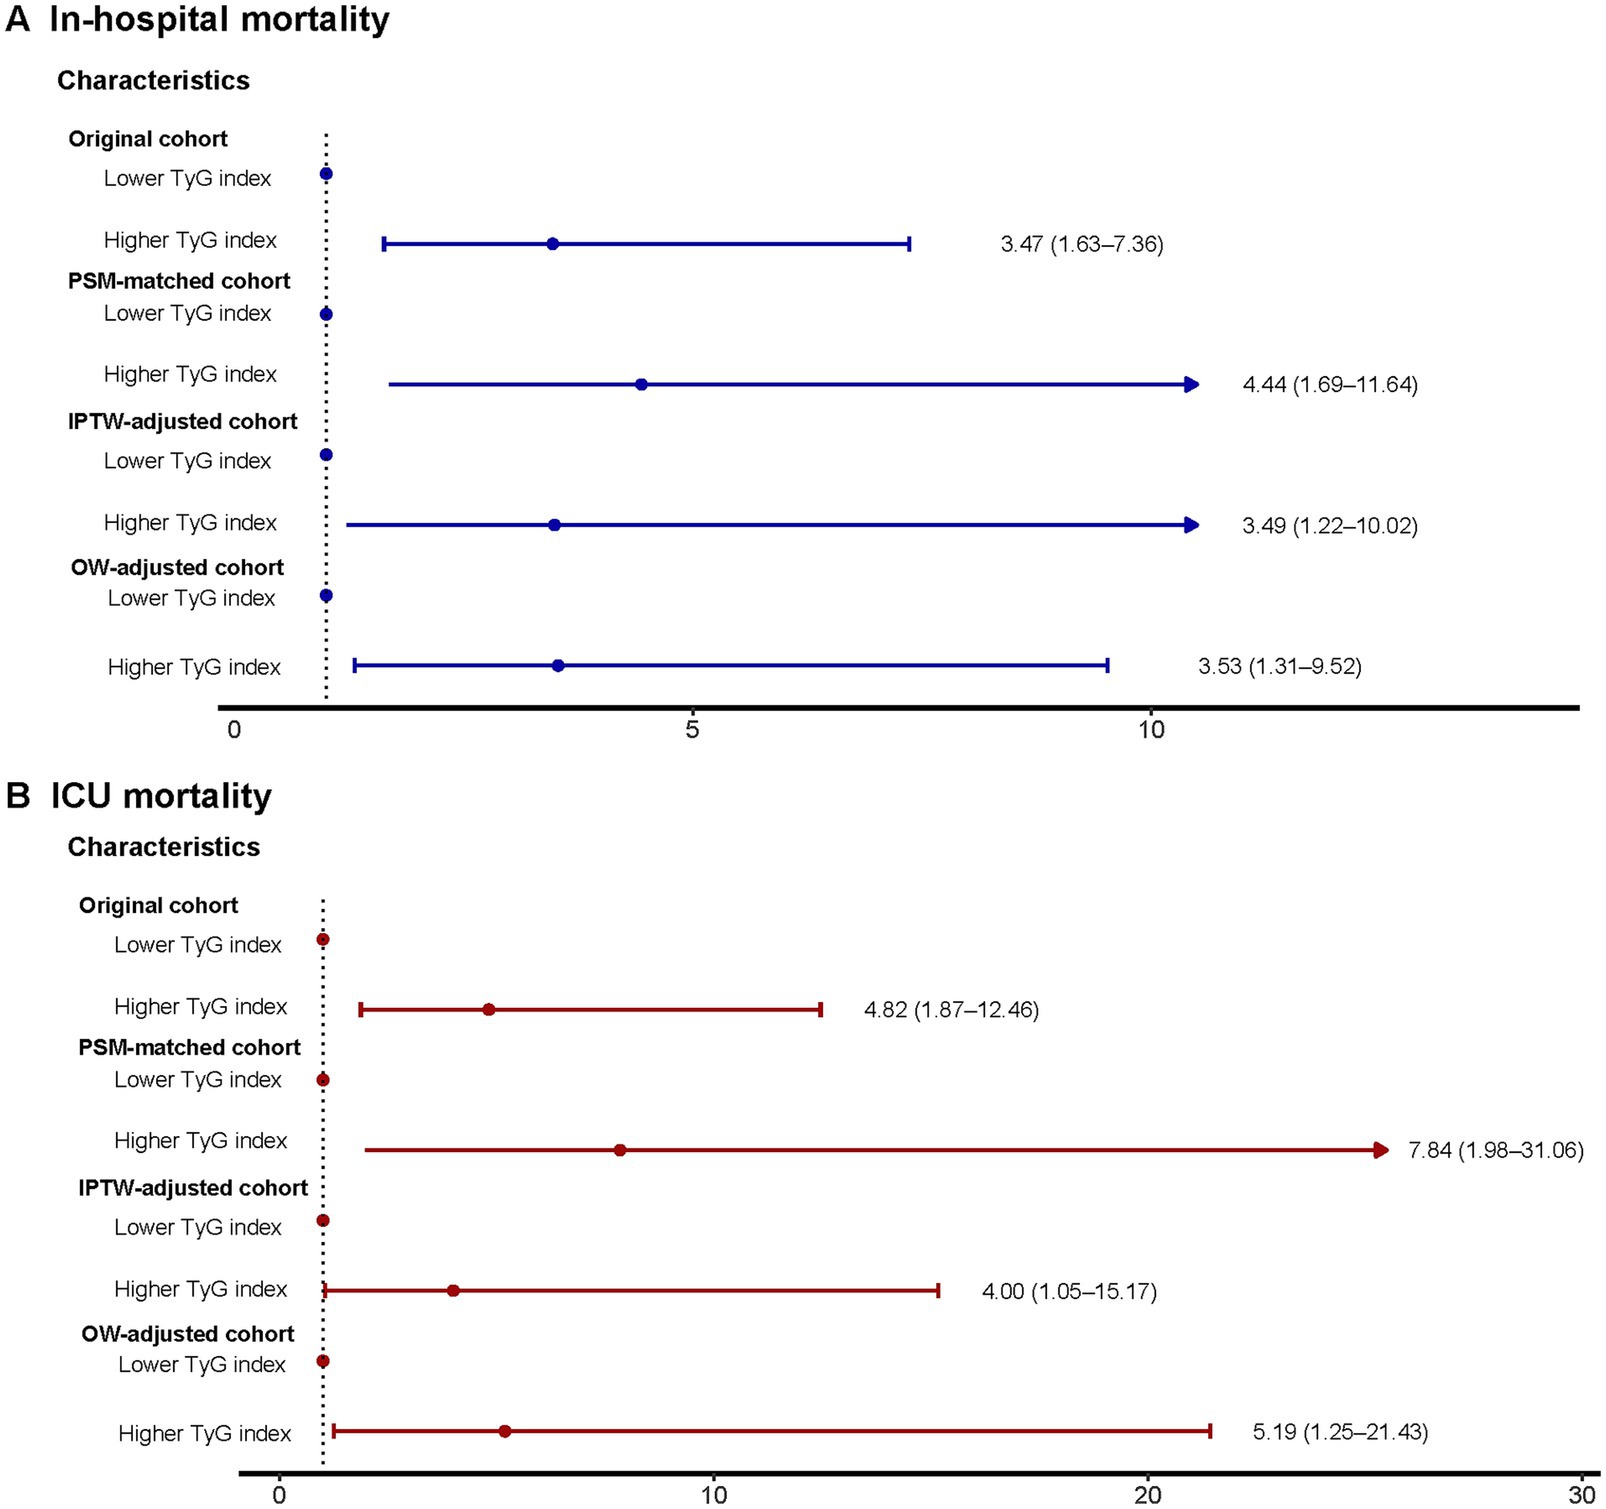
Figure 5. Logistic regression model to explore mortality risks associated with higher TyG index in the original, PSM-, OW-, and IPTW-adjusted cohorts. (A) In-hospital mortality. (B) ICU mortality. TyG, triglyceride-glucose; ICU, intensive care unit; PSM, propensity score matching; IPTW, inverse probability of treatment weighting; OW, overlap weighting; OR, odds ratio; CI, confidence interval.
The aggregated study revealed that, post-adjustment through various statistical techniques, a higher TyG index remained closely and positively linked to a rise in death rates and extended hospital stays in patients with DM-HCE.
Subgroup analysis
Our analysis dichotomized the cohort by age, gender, comorbid conditions, and SOFA metrics to evaluate the TyG index’s prognostic capacity for fatal outcomes across patient strata (Figure 6). Elevated TyG exhibited significant correlation with heightened in-hospital and ICU mortality risk within these cohorts: patients aged <65 years, those ≥65 years, men, women, individuals with or without sepsis, subjects with or without AKI, persons with or without CKD, and non-HF patients. Furthermore, analyses detected no significant interactive effects linking the TyG index to remaining stratification variables (all interaction p-values exceeding 0.05).
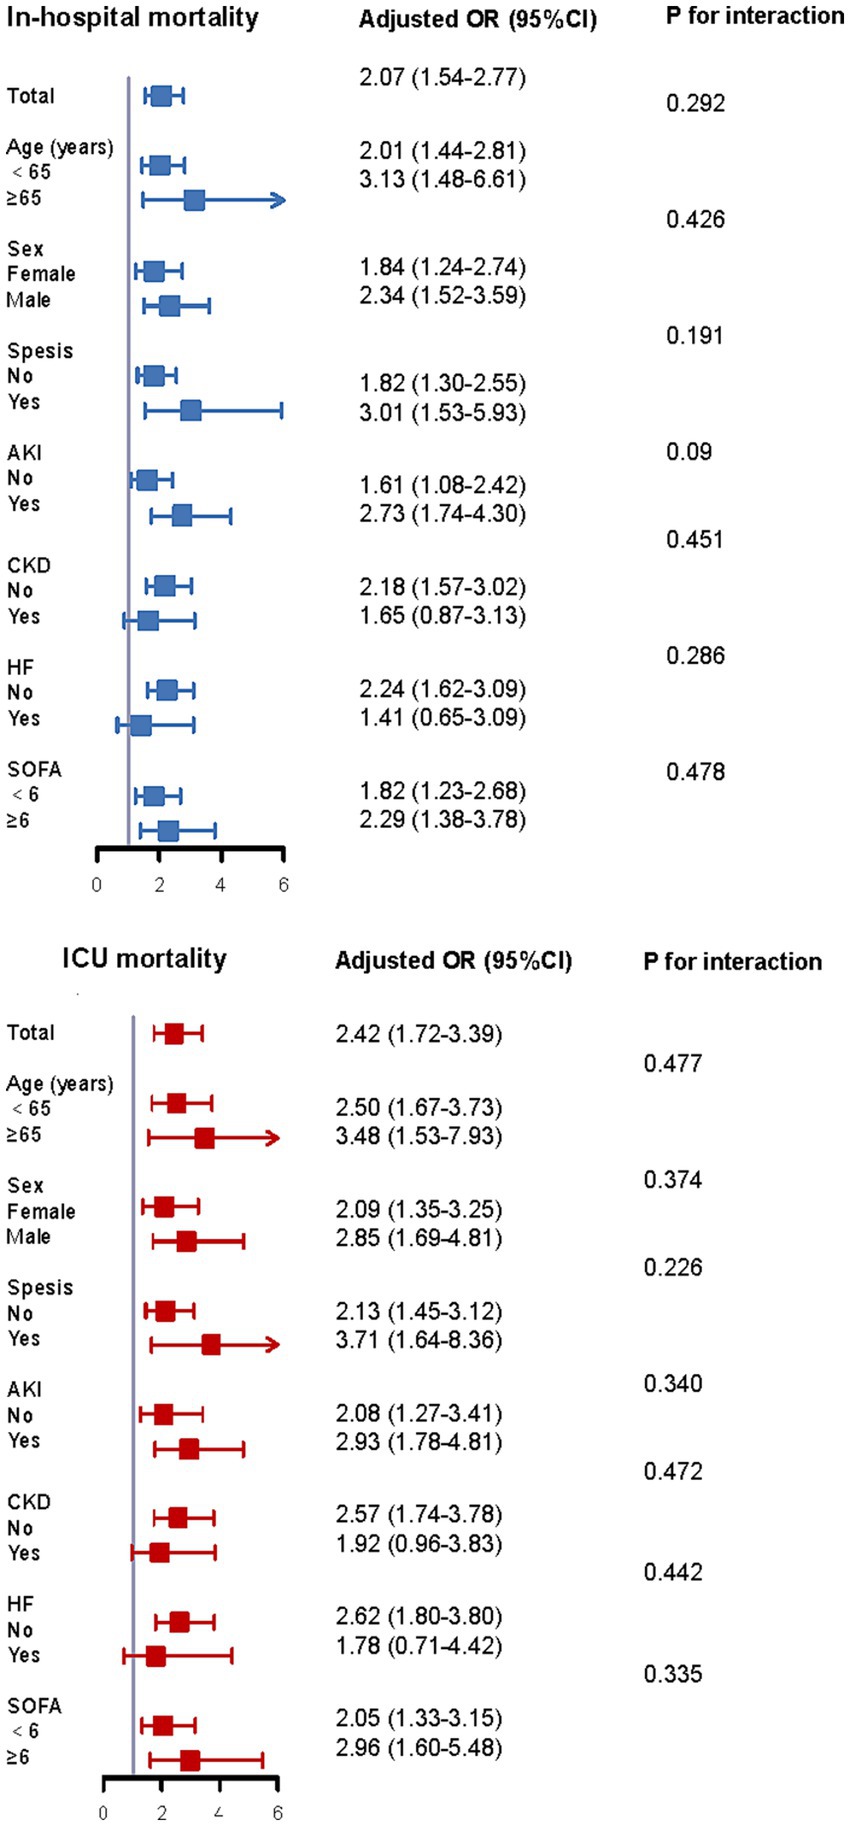
Figure 6. Subgroup analysis of the correlation between TyG index and mortality according to age, sex, comorbidity status, and SOFA score. SOFA, sequential organ failure assessment; ICU, intensive care unit; OR, additive ratio; CI, confidence interval.
Sensitivity analyses
The solidity of our research findings was confirmed by conducting multiple sensitivity analyses. Initially, by omitting 56 patients who had a minimum of one episode of hypoglycemia while in the ICU, the logistic regression analysis outcomes aligned with those of the main analyses (refer to Supplementary Tables S12, S13). Furthermore, by omitting 1,610 participants with incomplete data, the correlation between TyG index and ECM occurrence in severely ill patients with DM, as well as prognosis, aligned with the main results (Supplementary Tables S14, S15). The outcomes of these sensitivity tests validated the dependability and applicability of the primary study’s results.
Machine learning—TyG and in-hospital mortality
Lasso regression selected variables materially contributing to the predictive model’s efficacy. Coefficient fluctuation patterns appear delineated within Supplementary Figure S1. Utilizing these chosen features, we trained and tested five distinct models forecasting in-hospital mortality among subjects with DM-HCE: XGBoost, LGB, RF, SVM, and DT. The XGBoost paradigm exhibited superior predictive capacity (LGB: AUC = 0.910; RF: 0.886; SVM: 0.817; DT: 0.728), securing an AUC of 0.919. This model concurrently manifested elevated sensitivity (0.847), specificity (0.861), accuracy (0.854), and F1-score (0.853)—detailed in Figure 7A. Counteracting overfitting necessitated five-fold cross-validation; therein, XGBoost sustained peak average performance (AUC = 0.846 ± 0.057), visualized via Figure 7B. Comparative common performance metrics across models populate Supplementary Table S16. DCA curves alongside decision curves for all quintet models reside in Supplementary Figure S2. Consequently, XGBoost emerged as the definitive risk prognostication instrument.
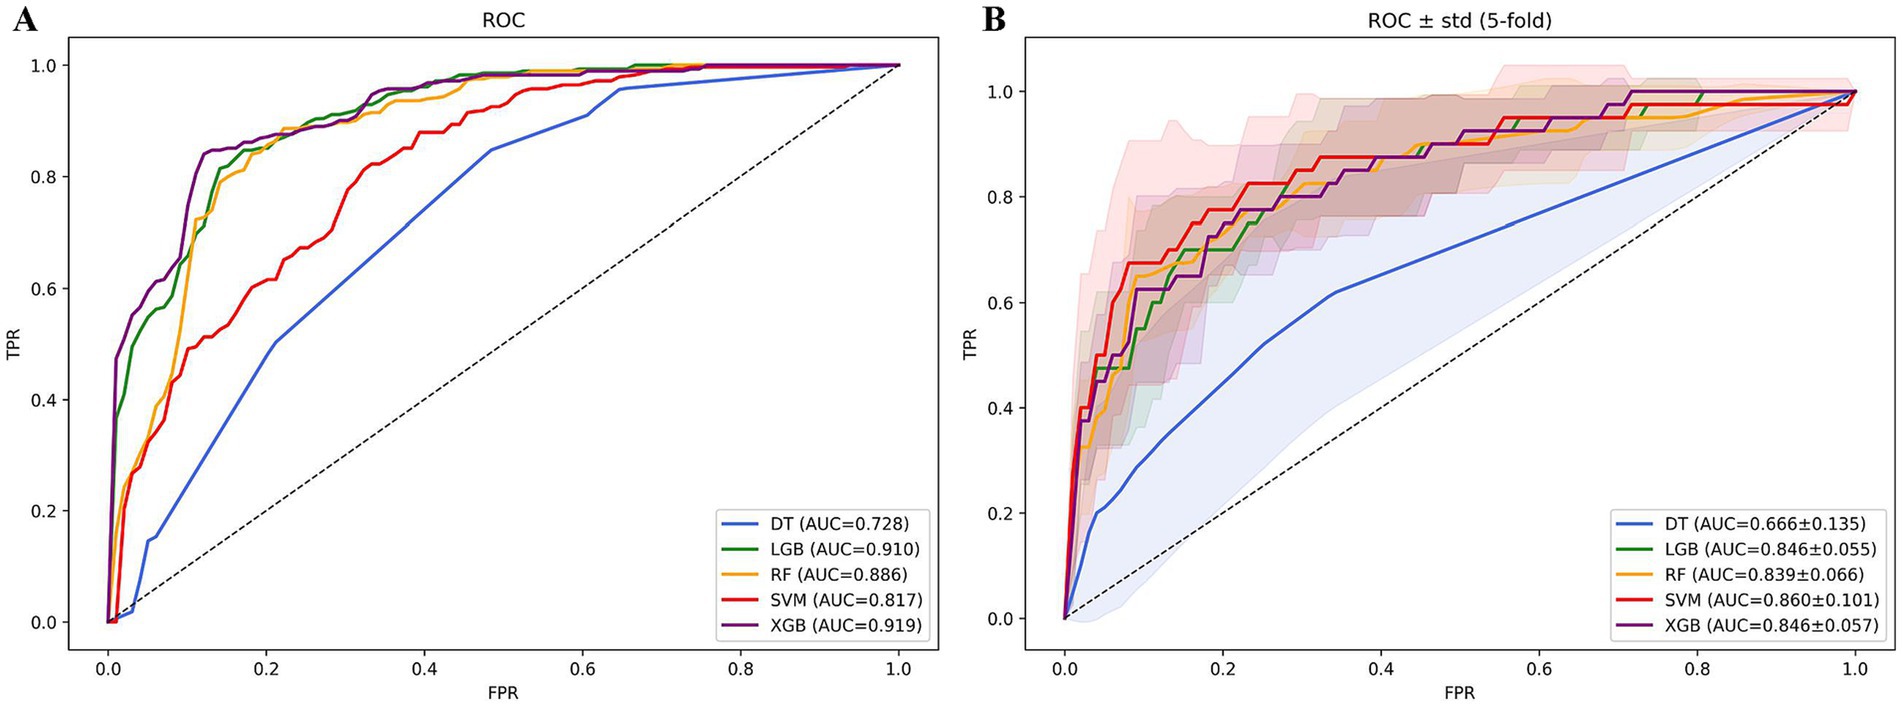
Figure 7. ROC curves of in-hospital mortality prediction models based on machine learning algorithms. (A) ROC curve analysis of 5 machine learning algorithms. (B) Average AUC performance of 5 machine learning models subjected to 5-fold cross-validation.
Figure 8 renders a scatter plot of mortality-associated risk factors plus the paramount model’s average importance histogram. The SHAP plot furnishes visual elucidation concerning the predictor variables’ outcome impact. SHAP value magnitude (chromatically encoded) and horizontal axis trajectory (denoting adverse outcome probability) underscore variable effects. Illustratively, both the TyG index and sodium demonstrate expansive chromatic spectrum variance across specimens. These factors concurrently possess the most elongated importance bars situated at the right periphery, mirroring their considerable influence.
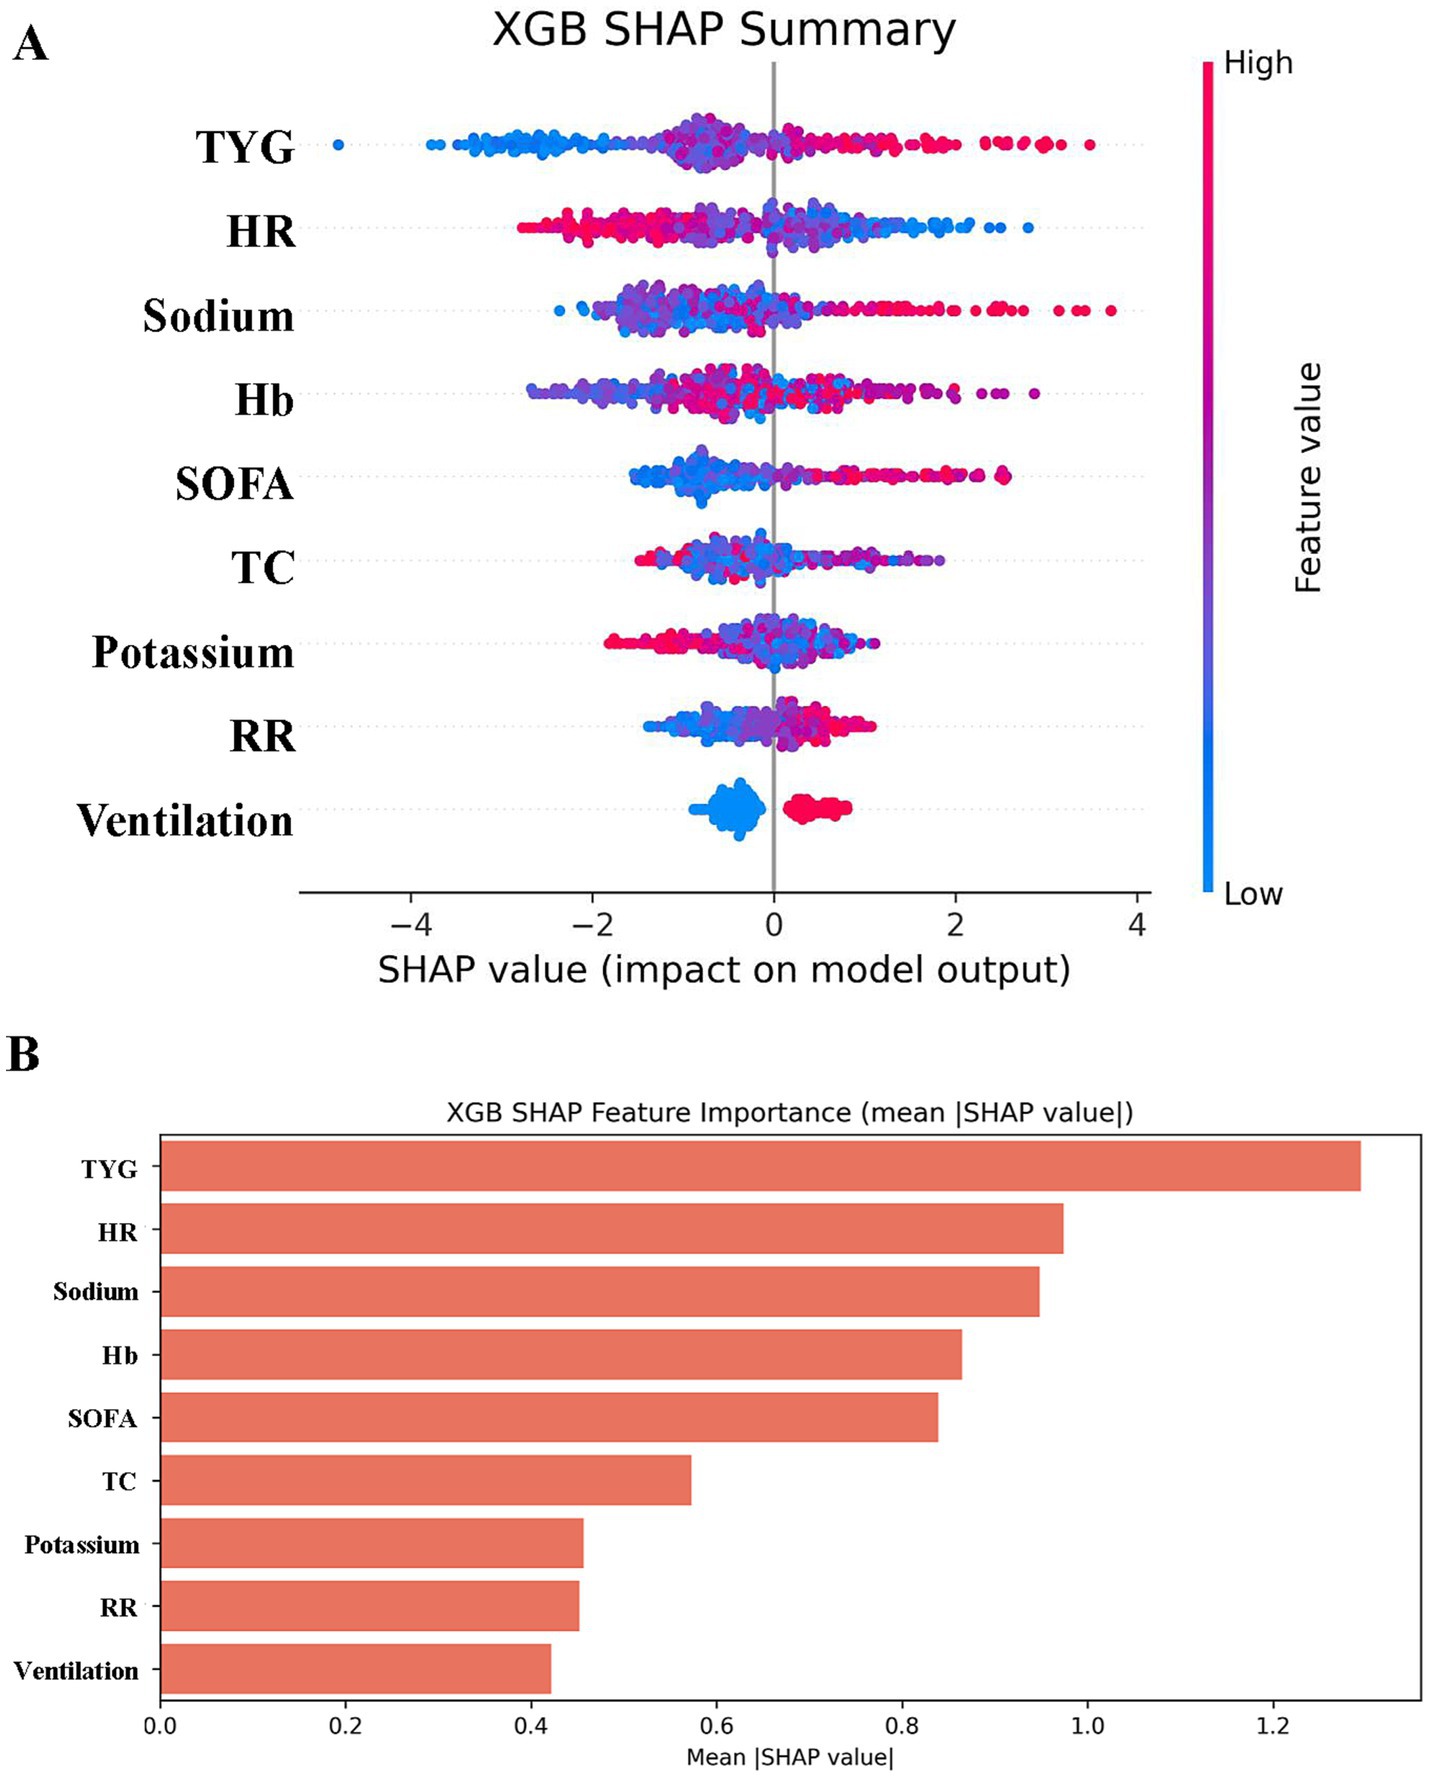
Figure 8. SHAP analysis of XGBoost modeling to predict in-hospital mortality in patients with HCE. (A) SHAP summary bar plot. This plot evaluates the contribution of each feature to the model using mean SHAP values, displayed in descending order. (B) SHAP summary dot plot. Each dot represents a patient’s SHAP value for a given feature, with red indicating higher feature values and blue indicating lower values. Dots are stacked vertically to show density.
Discussion
This investigation pioneers a methodological appraisal of the TyG index correlations with HCE incidence and clinical trajectories among critically ill diabetic populations, deploying algorithmic risk stratification architectures to refine prognostic precision. Analysis of 4,098 intensive care diabetes cases identified 328 HCE-manifesting individuals exhibiting statistically significant TyG elevations relative to non-HCE counterparts, with TyG demonstrating discriminatory superiority in high-risk cohort identification. Elevated TyG autonomously correlated with escalated fatality rates across hospital and intensive care settings alongside substantially extended LOS durations. These outcomes posit TyG as a premonitory biomarker, furnishing an original paradigm for HCE risk stratification and clinical trajectory governance in critical diabetes care. Machine learning integration substantiates TyG’s centrality within multivariate forecasting frameworks while establishing a clinical decision-support framework for therapeutic interventions.
The TyG index reflects IR status (29, 30), and its association with HCE may be mediated through multiple metabolic and inflammatory pathways (14). IR can induce β-cell dysfunction and excessive free fatty acid release, thereby promoting ketone body production and hyperosmolar states (31). Additionally, elevated TyG levels are often accompanied by enhanced oxidative stress and endothelial dysfunction, which may exacerbate microvascular complications and tissue hypoxia, contributing to HCE development (12, 14, 32–39). Significantly, the TyG index is linked to persistent inflammatory indicators (such as C-reactive protein) and irregularities in neuroendocrine function, both recognized as factors in the advancement of HCE (40, 41). For instance, IR activates the sympathetic nervous system, leading to elevated adrenaline levels that inhibit insulin secretion and worsen hyperglycemia (42). Together, these processes lend biological credibility to the TyG index as an extensive indicator of metabolic imbalance.
Although traditional scoring systems such as SOFA and APACHE-IV are widely used for prognostic assessment in critically ill patients (43, 44), these tools do not directly incorporate glycolipid metabolic parameters. In contrast, the TyG index more precisely captures metabolic dysregulation under acute stress by integrating triglyceride and glucose measurements. Furthermore, its significant association with LOS suggests it may reflect the cumulative systemic organ dysfunction caused by metabolic disturbances. These findings identify a novel target for clinical optimization of HCE management through interventions targeting TyG-related metabolic pathways (e.g., improving insulin resistance), which may reduce mortality and shorten hospital stays.
To minimize confounding bias, this study employed three statistical methods—PSM, IPTW, and OW—for cohort adjustment. Post-adjustment, increased TyG levels continued to show significant correlations with mortality rates in hospitals and ICUs, accompanied by ongoing LOS disparities. The findings are consistent with contemporary research on TyG’s role in predicting sepsis outcomes, affirming its independence from interfering variables. The RCS study additionally confirmed a direct correlation between TyG and the risk of death, suggesting the absence of any limit to its impact on risk and underscoring the necessity for ongoing surveillance in all severely ill sufferers with DM. Subgroup analyses demonstrated stable predictive value across age, gender, and comorbidity status, reinforcing its generalizability.
This study innovatively applied machine-learning algorithms to risk prediction in patients with DM-HCE, with the XGBoost model demonstrating optimal predictive performance (AUC = 0.919). The SHAP analysis indicated that the TyG index was a crucial predictive element of the model, thereby reinforcing its value in clinical decision-making. Compared with traditional statistical models, machine-learning methods exhibit superior capability in capturing nonlinear relationships and interaction effects within high-dimensional data, thereby enhancing predictive accuracy (45–47). These findings establish a foundation for developing intelligent clinical decision support tools in the future. Additionally, the calibration curve of the model showed a strong alignment between forecasted probabilities and real-world observations, and the analysis of the decision curve validated its overall clinical advantage over a broad range, indicating its statistical importance and potential for practical use. The study also identified that beyond the TyG index, SOFA scores and electrolyte levels emerged as key predictive factors, suggesting that HCE patient prognosis may be collectively determined by multiple factors, such as metabolic disorders, organ dysfunction, and electrolyte imbalances.
Nonetheless, this research is subject to multiple constraints. Initially, the backward-looking approach fails to confirm a cause-and-effect link between TyG and HCE, necessitating future validation of the cohort. Second, key details such as insulin use were not recorded, which may have impaired mechanistic elucidation. In addition, the data were limited to 2019, which may not capture the impact of recent therapeutic strategies (e.g., SGLT2 inhibitors) (48). Future studies should explore whether TyG-oriented metabolic management (e.g., insulin intensification or nutritional support) can improve prognosis in intervention trials. Moreover, TyG-based dynamic prediction models (e.g., combined with continuous glucose monitoring) and multicenter randomized controlled trials will be critical to validate its clinical value. Nonetheless, this study provides an innovative framework for metabolic risk monitoring in critically ill patients with diabetes.
Conclusion
A higher TyG index is closely linked to an increased occurrence and a less favorable outlook for HCE in individuals with DM. Patients with DM-HCE and high TyG levels face a heightened risk of death and extended LOS. For the first time, this research uncovers the medical importance of TyG in forecasting the risk of DM-HCE. Additional comprehensive research is needed to ascertain if early detection and intervention focusing on increased TyG levels can enhance clinical results in this severely ill diabetic group.
Data availability statement
The original contributions presented in the study are included in the article/Supplementary material, further inquiries can be directed to the corresponding authors.
Ethics statement
Ethical approval was not required for the study involving humans in accordance with the local legislation and institutional requirements. Written informed consent to participate in this study was not required from the participants or the participants’ legal guardians/next of kin in accordance with the national legislation and the institutional requirements. Written informed consent was obtained from the individual(s) for the publication of any potentially identifiable images or data included in this article.
Author contributions
MX: Investigation, Data curation, Writing – review & editing, Software, Visualization, Writing – original draft, Formal analysis, Validation. YZ: Writing – review & editing, Validation, Writing – original draft, Visualization. HW: Writing – original draft, Visualization, Writing – review & editing. ZW: Writing – review & editing, Writing – original draft, Methodology. HH: Software, Writing – review & editing, Writing – original draft. XX: Writing – review & editing, Writing – original draft, Visualization. RZ: Supervision, Conceptualization, Writing – review & editing, Writing – original draft. JC: Writing – original draft, Funding acquisition, Conceptualization, Supervision, Writing – review & editing. JX: Supervision, Conceptualization, Writing – review & editing, Resources, Funding acquisition, Formal analysis, Writing – original draft, Project administration.
Funding
The author(s) declare that financial support was received for the research and/or publication of this article. This work was supported by grants from Shandong Province Medical and Health Science and Technology Project (202304041486) to JX and the Special Funds for the Taishan Scholars Project of Shandong Province (tsqn202408393) to JC.
Conflict of interest
The authors declare that the research was conducted in the absence of any commercial or financial relationships that could be construed as a potential conflict of interest.
Generative AI statement
The authors declare that no Gen AI was used in the creation of this manuscript.
Any alternative text (alt text) provided alongside figures in this article has been generated by Frontiers with the support of artificial intelligence and reasonable efforts have been made to ensure accuracy, including review by the authors wherever possible. If you identify any issues, please contact us.
Publisher’s note
All claims expressed in this article are solely those of the authors and do not necessarily represent those of their affiliated organizations, or those of the publisher, the editors and the reviewers. Any product that may be evaluated in this article, or claim that may be made by its manufacturer, is not guaranteed or endorsed by the publisher.
Supplementary material
The Supplementary material for this article can be found online at: https://www.frontiersin.org/articles/10.3389/fnut.2025.1649553/full#supplementary-material
References
1. Huang, CC, Weng, SF, Tsai, KT, Chen, PJ, Lin, HJ, Wang, JJ, et al. Long-term mortality risk after hyperglycemic crisis episodes in geriatric patients with diabetes: a national population-based cohort Study. Diabetes Care. (2015) 38:746–51. doi: 10.2337/dc14-1840
2. Karslioglu French, E, Donihi, AC, and Korytkowski, MT. Diabetic ketoacidosis and hyperosmolar hyperglycemic syndrome: review of acute decompensated diabetes in adult patients. BMJ. (2019) 365:l1114. doi: 10.1136/bmj.l1114
3. Bragg, F, Holmes, MV, Iona, A, Guo, Y, Du, H, Chen, Y, et al. Association between diabetes and cause-specific mortality in rural and urban areas of China. JAMA. (2017) 317:280–9. doi: 10.1001/jama.2016.19720
4. Umpierrez, G, and Korytkowski, M. Diabetic emergencies—ketoacidosis, hyperglycaemic hyperosmolar state and hypoglycaemia. Nat Rev Endocrinol. (2016) 12:222–32. doi: 10.1038/nrendo.2016.15
5. Pasquel, FJ, and Umpierrez, GE. Hyperosmolar hyperglycemic state: a historic review of the clinical presentation, diagnosis, and treatment. Diabetes Care. (2014) 37:3124–31. doi: 10.2337/dc14-0984
6. Pasquel, FJ, Tsegka, K, Wang, H, Cardona, S, Galindo, RJ, Fayfman, M, et al. Clinical outcomes in patients with isolated or combined diabetic ketoacidosis and hyperosmolar hyperglycemic state: a retrospective, hospital-based cohort study. Diabetes Care. (2020) 43:349–57. doi: 10.2337/dc19-1168
7. Dhatariya, KK, and Umpierrez, GE. Guidelines for management of diabetic ketoacidosis: time to revise? Lancet Diabetes Endocrinol. (2017) 5:321–3. doi: 10.1016/S2213-8587(17)30093-1
8. Shaka, H, Aguilera, M, Aucar, M, El-Amir, Z, Wani, F, Muojieje, CC, et al. Rate and predictors of 30-day readmission following diabetic ketoacidosis in type 1 diabetes mellitus: a US analysis. J Clin Endocrinol Metab. (2021) 106:2592–9. doi: 10.1210/clinem/dgab372
9. Elangovan, A, Cattamanchi, S, Farook, AR, and Trichur, RV. Validation of predicting hyperglycemic crisis death score: a risk stratification tool for appropriate disposition of hyperglycemic crisis patients from the emergency department. J Emerg Trauma Shock. (2018) 11:104–10. doi: 10.4103/JETS.JETS_2_17
10. Huang, CC, Kuo, SC, Chien, TW, Lin, HJ, Guo, HR, Chen, WL, et al. Predicting the hyperglycemic crisis death (PHD) score: a new decision rule for emergency and critical care. Am J Emerg Med. (2013) 31:830–4. doi: 10.1016/j.ajem.2013.02.010
11. Ogbera, AO, Awobusuyi, J, Unachukwu, C, and Fasanmade, O. Clinical features, predictive factors and outcome of hyperglycaemic emergencies in a developing country. BMC Endocr Disord. (2009) 9:9. doi: 10.1186/1472-6823-9-9
12. Kitabchi, AE, Umpierrez, GE, Miles, JM, and Fisher, JN. Hyperglycemic crises in adult patients with diabetes. Diabetes Care. (2009) 32:1335–43. doi: 10.2337/dc09-9032
13. Li, H, Zuo, Y, Qian, F, Chen, S, Tian, X, Wang, P, et al. Triglyceride-glucose index variability and incident cardiovascular disease: a prospective cohort study. Cardiovasc Diabetol. (2022) 21:105. doi: 10.1186/s12933-022-01541-5
14. Tao, LC, Xu, JN, Wang, TT, Hua, F, and Li, JJ. Triglyceride-glucose index as a marker in cardiovascular diseases: landscape and limitations. Cardiovasc Diabetol. (2022) 21:68. doi: 10.1186/s12933-022-01511-x
15. Li, X, Chan, JSK, Guan, B, Peng, S, Wu, X, Lu, X, et al. Triglyceride-glucose index and the risk of heart failure: evidence from two large cohorts and a Mendelian randomization analysis. Cardiovasc Diabetol. (2022) 21:229. doi: 10.1186/s12933-022-01658-7
16. Tahapary, DL, Pratisthita, LB, Fitri, NA, Marcella, C, Wafa, S, Kurniawan, F, et al. Challenges in the diagnosis of insulin resistance: focusing on the role of HOMA-IR and tryglyceride/glucose index. Diabetes Metab Syndr. (2022) 16:102581. doi: 10.1016/j.dsx.2022.102581
17. Zhang, Q, Xiao, S, Jiao, X, and Shen, Y. The triglyceride-glucose index is a predictor for cardiovascular and all-cause mortality in CVD patients with diabetes or pre-diabetes: evidence from NHANES 2001–2018. Cardiovasc Diabetol. (2023) 22:279. doi: 10.1186/s12933-023-02030-z
18. Huo, RR, Liao, Q, Zhai, L, You, XM, and Zuo, YL. Interacting and joint effects of triglyceride-glucose index (TyG) and body mass index on stroke risk and the mediating role of TyG in middle-aged and older Chinese adults: a nationwide prospective cohort study. Cardiovasc Diabetol. (2024) 23:30. doi: 10.1186/s12933-024-02122-4
19. Li, W, Shen, C, Kong, W, Zhou, X, Fan, H, Zhang, Y, et al. Association between the triglyceride glucose-body mass index and future cardiovascular disease risk in a population with cardiovascular-kidney-metabolic syndrome stage 0–3: a nationwide prospective cohort study. Cardiovasc Diabetol. (2024) 23:292. doi: 10.1186/s12933-024-02352-6
20. Johnson, AEW, Bulgarelli, L, Shen, L, Gayles, A, Shammout, A, Horng, S, et al. Author correction: MIMIC-IV, a freely accessible electronic health record dataset. Sci Data. (2023) 10:219. doi: 10.1038/s41597-023-02136-9
21. Fong, N, Langnas, E, Law, T, Reddy, M, Lipnick, M, and Pirracchio, R. Availability of information needed to evaluate algorithmic fairness—a systematic review of publicly accessible critical care databases. Anaesth Crit Care Pain Med. (2023) 42:101248. doi: 10.1016/j.accpm.2023.101248
22. Stumpo, V, Staartjes, VE, Esposito, G, Serra, C, Regli, L, Olivi, A, et al. Machine learning and intracranial aneurysms: from detection to outcome prediction. Acta Neurochir Suppl. (2022) 134:319–31. doi: 10.1007/978-3-030-85292-4_36
23. Frizzell, JD, Liang, L, Schulte, PJ, Yancy, CW, Heidenreich, PA, Hernandez, AF, et al. Prediction of 30-day all-cause readmissions in patients hospitalized for heart failure: comparison of machine learning and other statistical approaches. JAMA Cardiol. (2017) 2:204–9. doi: 10.1001/jamacardio.2016.3956
24. Johnson, AEW, Bulgarelli, L, Shen, L, Gayles, A, Shammout, A, Horng, S, et al. MIMIC-IV, a freely accessible electronic health record dataset. Sci Data. (2023) 10:1. doi: 10.1038/s41597-022-01899-x
25. Guerrero-Romero, F, Simental-Mendia, LE, Gonzalez-Ortiz, M, Martinez-Abundis, E, Ramos-Zavala, MG, Hernandez-Gonzalez, SO, et al. The product of triglycerides and glucose, a simple measure of insulin sensitivity. Comparison with the euglycemic-hyperinsulinemic clamp. J Clin Endocrinol Metab. (2010) 95:3347–51. doi: 10.1210/jc.2010-0288
26. Team DC. DecisionLinnc is a platform that integrates multiple programming language environments and enables data processing, data analysis, and machine learning through a visual interface. Hangzhou: Statsape Co., Ltd. (2023).
27. Yan, F, Chen, X, Quan, X, Wang, L, Wei, X, and Zhu, J. Association between the stress hyperglycemia ratio and 28-day all-cause mortality in critically ill patients with sepsis: a retrospective cohort study and predictive model establishment based on machine learning. Cardiovasc Diabetol. (2024) 23:163. doi: 10.1186/s12933-024-02265-4
28. Yu, Q, Fu, Q, Ma, X, Wang, H, Xia, Y, Chen, Y, et al. Impact of glycemic control metrics on short- and long-term mortality in transcatheter aortic valve replacement patients: a retrospective cohort study from the MIMIC-IV database. Cardiovasc Diabetol. (2025) 24:135. doi: 10.1186/s12933-025-02684-x
29. Thai, PV, Tien, HA, Van Minh, H, and Valensi, P. Triglyceride glucose index for the detection of asymptomatic coronary artery stenosis in patients with type 2 diabetes. Cardiovasc Diabetol. (2020) 19:137. doi: 10.1186/s12933-020-01108-2
30. Tian, X, Chen, S, Xia, X, Xu, Q, Zhang, Y, Zheng, C, et al. Pathways from insulin resistance to incident cardiovascular disease: a Bayesian network analysis. Cardiovasc Diabetol. (2024) 23:421. doi: 10.1186/s12933-024-02510-w
31. Brereton, MF, Rohm, M, and Ashcroft, FM. β-cell dysfunction in diabetes: a crisis of identity? Diabetes Obes Metab. (2016) 18:102–9. doi: 10.1111/dom.12732
32. Yao, H, Sun, Z, Yuan, W, Shao, C, Cai, H, Li, L, et al. Relationship between the triglyceride-glucose index and type 2 diabetic macroangiopathy: a single-center retrospective analysis. Diabetes Metab Syndr Obes. (2022) 15:3483–97. doi: 10.2147/DMSO.S387040
33. Reaven, GM. Role of insulin resistance in human disease (syndrome X): an expanded definition. Annu Rev Med. (1993) 44:121–31. doi: 10.1146/annurev.me.44.020193.001005
34. DeFronzo, RA. Insulin resistance, lipotoxicity, type 2 diabetes and atherosclerosis: the missing links. The Claude Bernard Lecture 2009. Diabetologia. (2010) 53:1270–87. doi: 10.1007/s00125-010-1684-1
35. Caturano, A, Galiero, R, Vetrano, E, Sardu, C, Rinaldi, L, Russo, V, et al. Insulin-heart axis: bridging physiology to insulin resistance. Int J Mol Sci. (2024) 25:8369. doi: 10.3390/ijms25158369
36. Esposito, K, Marfella, R, and Giugliano, D. Stress hyperglycemia, inflammation, and cardiovascular events. Diabetes Care. (2003) 26:1650–1. doi: 10.2337/diacare.26.5.1650-a
37. Monnier, L, Mas, E, Ginet, C, Michel, F, Villon, L, Cristol, JP, et al. Activation of oxidative stress by acute glucose fluctuations compared with sustained chronic hyperglycemia in patients with type 2 diabetes. JAMA. (2006) 295:1681–7. doi: 10.1001/jama.295.14.1681
38. Cao, B, Guo, Z, Li, DT, Zhao, LY, Wang, Z, Gao, YB, et al. The association between stress-induced hyperglycemia ratio and cardiovascular events as well as all-cause mortality in patients with chronic kidney disease and diabetic nephropathy. Cardiovasc Diabetol. (2025) 24:55. doi: 10.1186/s12933-025-02610-1
39. Yamamoto, Y, and Yamamoto, H. RAGE-mediated inflammation, type 2 diabetes, and diabetic vascular complication. Front Endocrinol. (2013) 4:105. doi: 10.3389/fendo.2013.00105
40. Vasques, AC, Novaes, FS, de Oliveira, MS, Souza, JR, Yamanaka, A, Pareja, JC, et al. TyG index performs better than HOMA in a Brazilian population: a hyperglycemic clamp validated study. Diabetes Res Clin Pract. (2011) 93:e98–e100. doi: 10.1016/j.diabres.2011.05.030
41. de Luca, C, and Olefsky, JM. Inflammation and insulin resistance. FEBS Lett. (2008) 582:97–105. doi: 10.1016/j.febslet.2007.11.057
42. Shamoon, H, Hendler, R, and Sherwin, RS. Synergistic interactions among antiinsulin hormones in the pathogenesis of stress hyperglycemia in humans. J Clin Endocrinol Metab. (1981) 52:1235–41. doi: 10.1210/jcem-52-6-1235
43. Marmiere, M, D’Amico, F, Monti, G, and Landoni, G. Mastering the sequential organ failure assessment score: critical choices of score statistic, timing, imputations, and competing risk handling in major trials-a systematic review. Crit Care Med. (2025) 53:e1116–24. doi: 10.1097/CCM.0000000000006532
44. Zimmerman, JE, and Kramer, AA. Outcome prediction in critical care: the acute physiology and chronic health evaluation models. Curr Opin Crit Care. (2008) 14:491–7. doi: 10.1097/MCC.0b013e32830864c0
45. Li, M, Han, S, Liang, F, Hu, C, Zhang, B, Hou, Q, et al. Machine learning for predicting risk and prognosis of acute kidney disease in critically ill elderly patients during hospitalization: internet-based and interpretable model study. J Med Internet Res. (2024) 26:e51354. doi: 10.2196/51354
46. Raita, Y, Goto, T, Faridi, MK, Brown, DFM, Camargo, CA Jr, and Hasegawa, K. Emergency department triage prediction of clinical outcomes using machine learning models. Crit Care. (2019) 23:64. doi: 10.1186/s13054-019-2351-7
47. Kalimouttou, A, Lerner, I, Cheurfa, C, Jannot, AS, and Pirracchio, R. Machine-learning-derived sepsis bundle of care. Intensive Care Med. (2023) 49:26–36. doi: 10.1007/s00134-022-06928-2
Keywords: triglyceride-glucose index, hyperglycemic crisis, critical care, machine learning, mortality prediction
Citation: Xie M, Zhang Y, Wu H, Wu Z, Han H, Xie X, Zhang R, Cheng J and Xu J (2025) Correlation of triglyceride-glucose index with the incidence and prognosis of hyperglycemic crises in critically ill patients with diabetes mellitus: a machine-learning-based multicenter retrospective cohort study. Front. Nutr. 12:1649553. doi: 10.3389/fnut.2025.1649553
Edited by:
Mithun Rudrapal, Vignan’s Foundation for Science, Technology and Research, IndiaReviewed by:
Samiksha Garse, DY Patil Deemed to be University, IndiaKratika Singh, Centre of Bio-Medical Research (CBMR), India
Copyright © 2025 Xie, Zhang, Wu, Wu, Han, Xie, Zhang, Cheng and Xu. This is an open-access article distributed under the terms of the Creative Commons Attribution License (CC BY). The use, distribution or reproduction in other forums is permitted, provided the original author(s) and the copyright owner(s) are credited and that the original publication in this journal is cited, in accordance with accepted academic practice. No use, distribution or reproduction is permitted which does not comply with these terms.
*Correspondence: Rui Zhang, enp0Z0AxNjMuY29t; Jianhua Cheng, Y2poMTk5NDAzMTdAMTYzLmNvbQ==; Jian Xu, eHVqaWFucWRtY0AxMjYuY29t
†These authors have contributed equally to this work