 Hongyu Zhang
 Da Wang1†
 Mengge Zhao
- 1College of Food Science and Engineering, Northwest A&F University, Yangling, Shaanxi, China
- 2Department of Urology, Xijing Hospital of Air Force Medical University, Xi'an, Shaanxi, China
Hyperuricemia (HUA) is a worldwide metabolic disorder characterized by abnormally elevated serum uric acid (SUA) levels, and recent studies suggest that probiotics have potential in mitigating HUA. This study aimed to evaluate the efficacy of Lactobacillus paracasei N1115 in alleviating HUA in mice and explore its underlying mechanisms. The results demonstrated that both high and low-dose L. paracasei N1115 reduced SUA levels in vivo by 29.18 and 27.29%, respectively (p < 0.05), effectively mitigating HUA. Additionally, the probiotic protected renal function, mitigated tissue damages and inflammation. Mechanically, it effected uric acid (UA) metabolism by regulating the UA-production related enzymes xanthine oxidase (XOD), adenosine deaminase (ADA), and 5′-nucleotidase (5′-NT), as well as the urate transpoters urate transporter 1 (URAT1) and glucose transporter 9 (GLUT9), and organic anion transporter 3 (OAT3). Moreover, L. paracasei N1115 reshaped the gut microbiota and significantly increased the abundance of Bifidobacterium, while modulating renal metabolism and elevating butyric acid levels in gut. These findings suggest that L. paracasei may alleviate HUA by enhancing butyrate levels through a cross-feeding interaction with Bifidobacterium. Although further experiments are required to substantiate underlying mechanisms, this study provides a basis for HUA-targeting functional foods research.
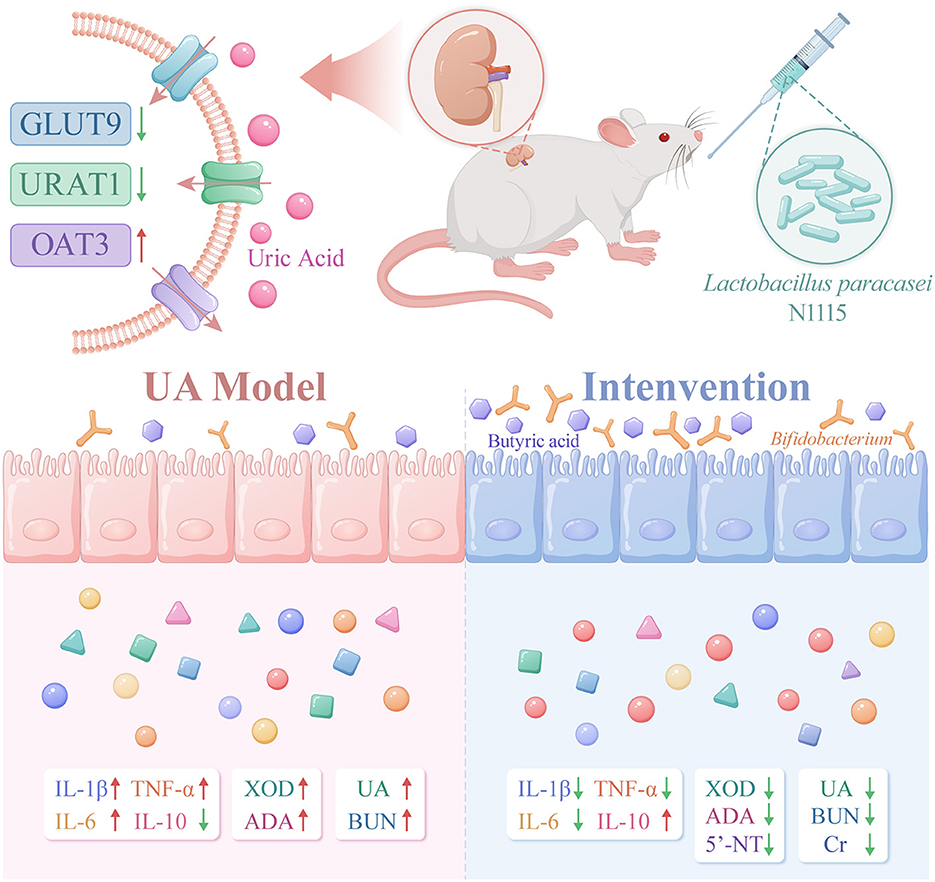
GRAPHICAL ABSTRACT. The image depicts the changes in gut microbiota, metabolites, transport proteins, inflammatory factors, and UA-producing enzymes in HUA mice after intervention with Lactobacillus paracasei N1115. After the intervention, the expression of GLUT9 and URAT1 in the kidneys of the mice decreased, while the expression of OAT3 increased. The abundance of Bifidobacterium in the gut and the level of butyrate rose. Serum indicators showed that after the intervention, the levels of UA, BUN, and Cr decreased, the anti-inflammatory ability was enhanced, and the activity of enzymes related to UA production declined.
1 Introduction
Hyperuricemia (HUA) is a metabolic disorder characterized by abnormally elevated serum uric acid (SUA) levels, primarily resulting from an imbalance between uric acid (UA) production and excretion (1). Recent studies indicate that the overall prevalence of HUA is 19.37%, with 27.72% in men and 10.69% in women, and the incidence of HUA in China has significantly increased, particularly in developed regions (2, 3). HUA is also associated with various diseases, including cardiovascular disease, chronic kidney disease, metabolic syndrome, and type 2 diabetes, etc (4–6). Studies have shown that for every 10 mg/L increase in SUA levels, the risk of hypertension increases by 13%, and HUA as a risk factor can accelerate the progression of atherosclerosis and heart failure (7). In addition, when SUA are too high, crystalline precipitation occurs, which can lead to complications such as gout in joints and cartilage areas (8). Therefore, patients with HUA need to take effective measures to reduce SUA.
With ongoing research into the anti-HUA functional foods, probiotics have emerged as a promising strategy for HUA intervention. Recent studies have increasingly demonstrated a significant association between gut microbiota and the progression of HUA, and probiotics have shown potential therapeutic value through the multi-target regulation of UA metabolism. Specifically, certain probiotics, such as Levilactobacillus brevis grx821, competitively inhibit the absorption of exogenous purines in the gut, thereby reducing the accumulation of precursors for UA synthesis and lowering SUA levels (9). Additionally, probiotics can modulate the gut microbiota composition, restore microbial balance, enhance intestinal barrier function, which can promote UA metabolism (10, 11). In terms of anti-inflammatory and immune modulation, some probiotics can alleviate systemic inflammatory responses induced by HUA, which in turn helps improve HUA-related metabolic syndrome (12). Metabolites of probiotics, including short-chain fatty acids (SCFAs), polyamines, and indole derivatives, directly or indrectly participate in UA metabolism. For instance, acetate, a type of SCFAs, can inhibit XOD activity, while butyrate has been widely recognized for its protective effect on the intestinal mucosal barrier and HUA remittence (13, 14). Probiotics can also influence the expression of urate transporters in the gut and kidneys, thereby enhancing UA excretion (15). Moreover, probiotics can treat HUA by affecting other metabolic pathways in the host. For example, Lactobacillus rhamnosus UA260 and Lactobacillus plantarum YU28 can mitigate HUA via regulating tryptophan metabolism, particularly the production of indole-3-lactic acid (IPA) and indole-3-acetic acid (IAA), which were correlated with XOD activity, colonic injury, and the expression of the UA transporter protein ATP-binding Cassette Sub-family G Member 2 (ABCG2) during treatment (16). Therefore, probiotics are considered to exert their effects on HUA through multiple mechanistic targets. Such multifaceted actions highlight their potential as natural candidates for the functional foods with anti-HUA properties.
Recently, numerous studies have demonstrated the UA-lowering ability of certain lactic acid bacteria. In this study, we assessed the anti-HUA effect of L. paracasei N1115 through the in vitro and in vivo experiments of HUA mouse model. Additionally, we aimed to elucidate the possible mechanisms underlying its ability to mitigate HUA through analyses of HUA associated biomarkers, histopathological examination, urate-producing enzymes, transporter protein expression, gut microbiota composition, renal metabolism and SCFAs.
2 Materials and methods
2.1 In vitro experiments
2.1.1 Strain cultivation and supernatant collection
Methods were as previously described, with slight modifications (16). L. paracasei N1115 (from Junlebao Dairy Co., Ltd., Hebei, China) was selected and activated. The cultures were incubated statically at 37 °C for 24 h. Subsequently, 2 ml of each culture was centrifuged at 12,000 g and 4 °C for 10 min, and the supernatant was collected for the XOD inhibition assay.
2.1.2 XOD activity inhibition assay
A centrifuge tube was sequentially loaded with 550 μl of PBS buffer (pH 7.4), 50 μl of the sample, and 200 μl of 0.2 U/ml XOD solution. Before mixing, the pH of the supernatant was adjusted to neutral. The mixture was thoroughly mixed, followed by the addition of 200 μl of 0.2 g/L xanthine solution. The XOD and xanthine solutions were preheated to 37 °C prior to use. The mixture was incubated for 5 min, with absorbance measured at 295 nm at 1-min intervals. Linear regression was performed to determine the slope k1. For the blank control, 50 μl of MRS was added in place of the sample, and the corresponding slope k0 was determined. The relative inhibition rate of XOD was calculated using formula (1). Methods were as previously described, with some modifications (16).
2.2 Animal experiments
2.2.1 Animal experimental design
Specific pathogen-free (SPF) Kunming mice (7-week-old, male, n = 30) were obtained from Si Pei Fu (Beijing) Biotechnology Co., Ltd. [Animal Qualification Certificate No. SCXK (Beijing) 2019-0004, Beijing, China]. At the end of the acclimatization period, the mice were randomly divided into five groups: control group (CON group), HUA model group (UA group), high-dose L. paracasei N1115 group (HLP group), low-dose L. paracasei N1115 group (LLP group), and febuxostat group (FB group). The doses and treatments for each group are shown in Figure 1. During the first 2 weeks, all groups, except the CON group, were administered 600 mg/kg of hypoxanthine and 350 mg/kg of potassium oxonate via gavage daily. In the 3rd week, the UA, HLP, LLP, and FB groups ceased hypoxanthine intervention. The HLP and LLP groups were gavaged 1 × 10¹⁰ CFU/ml and 1 × 10⁸ CFU/ml of L. paracasei N1115 per day, respectively (17). The FB group daily received 8 mg/kg of febuxostat. Potassium oxonate (350 mg/kg) continued to provide in UA, HLP, LLP, and FB groups once every 3 days to inhibit uricase in mice, as uricase can convert UA into allantoin (18, 19). The potassium oxonate and anti-HUA interventions were administered at intervals of at least 8 h. All animals used in this study were maintained under SPF conditions with a temperature of 18–24 °C and humidity of 35%−60% and 12 h light/dark cycle and free access to food and water. Reagents used in the animal experiments were purchased from Shanghai Aladdin Biochemical Technology Co., Ltd. (Shanghai, China).
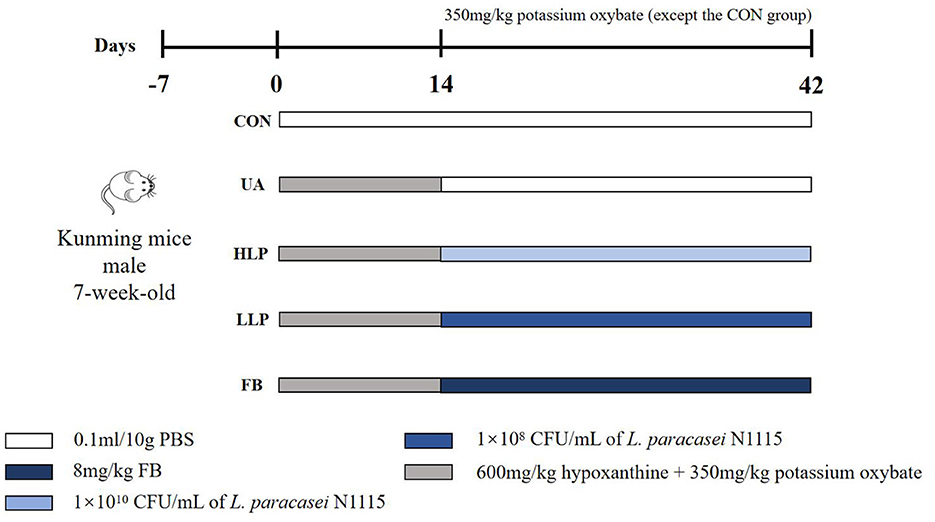
Figure 1. Animal experimental groups and respective treatments. From days 0 to 14, all groups, except the CON group, were orally administered 600 mg/kg of hypoxanthine and 350 mg/kg of potassium oxonate by gavage each day. From days 14 to 42, the UA, HLP, LLP, and FB groups discontinued hypoxanthine administration. The HLP and LLP groups were administered L. paracasei N1115 by gavage at concentrations of 1 × 10¹⁰ CFU/ml and 1 × 10⁸ CFU/ml per day, respectively. The FB group was administered 8 mg/kg of febuxostat daily. Potassium oxonate (350 mg/kg) continued to be administered to the UA, HLP, LLP, and FB groups once every 3 days. Potassium oxonate and the anti-hyperuricemia interventions were administered at intervals of no less than 8 h.
At the end of the experiment (day 42), the mice were fasted for 12 h, anesthetized with isoflurane, and then euthanized. Feces, organs, and blood were collected for subsequent analyses. Serum was obtained by centrifuging the collected blood samples. The research methods were approved by the Animal Ethics Committee of Northwest A&F University (Certificate No.: SCXK [SHAAN] 2017-003; Approval Number: IACUC2024-0715).
2.2.2 Weights and organ coefficients
Weights were measured and recorded weekly. The weights of the liver and kidneys were also recorded, and organ coefficients were calculated using the following formulas:
2.3 Post-mortem analyses
2.3.1 Serum analysis
The kits were used to measure the levels of SUA, blood urea nitrogen (BUN), creatinine (Cr), xanthine oxidase (XOD), adenosine deaminase (ADA; Beijing Solarbio Science & Technology Co., Ltd., Beijing, China), and 5′-nucleotidase (5′-NT; Jiangsu Meibiao Biotechnology Co., Ltd., Jiangsu, China) in serum, following the manufacturer's instructions.
2.3.2 Inflammatory factors
Protein levels of interleukin-1β (IL-1β), interleukin-6 (IL-6), tumor necrosis factor-α (TNF-α), and interleukin-10 (IL-10) were measured using ELISA kits (Jiangsu Meibiao Biotechnology Co., Ltd., Jiangsu, China), following the manufacturer's instructions.
2.3.3 Histopathological examination
After euthanizing the mice, the kidneys, liver, and duodenum were harvested and processed into H&E-stained sections by Wuhan Servicebio Technology Co., Ltd. (Hubei, China). The stained sections were examined under a microscope (M205FCA, Leica, Germany) and photographed.
2.3.4 Immunohistochemistry and immunofluorescence
The sections were prepared as previously described, with minor modifications (16, 20). The tissue sections were deparaffinized, rehydrated, permeabilized, and subjected to antigen retrieval. After blocking with 3% hydrogen peroxide (H2O2), the sections were incubated with primary antibodies overnight. Immunohistochemical staining was performed on sagittal kidney sections using antibodies specific for urate transporter 1 (URAT1), organic anion transporter 1 (OAT1), organic anion transporter 3 (OAT3), and nucleoside phosphate transporter 1 (NPT1). After primary antibody incubation, the sections were incubated with a secondary antibody conjugated to a histochemical reagent, followed by DAB staining after hematoxylin counterstaining. Immunofluorescence staining for glucose transporter 9 (GLUT9) was conducted on sagittal kidney sections. These sections were incubated with primary antibodies, followed by incubation with a fluorescent secondary antibody and DAPI staining. The sections were then sealed with an antifluorescence quenching agent. Observations were made using a fluorescence microscope (M205FCA, Leica, Germany), and quantitative analysis was performed using ImageJ software. All antibodies were purchased from Affinity Biosciences Co., Ltd. (Jiangsu, China).
2.3.5 16S rRNA gut microbiota profiling
After the mice were anesthetized and euthanized, fresh feces were collected from the intestines using sterile forceps and stored at −80 °C for subsequent microbiological analysis (n = 4). Genomic DNA was extracted from the samples using the CTAB/SDS method, and the variable region (V3-V4) of the 16S rRNA gene was amplified with the forward primer 338F (ACTCCTACGGGGAGGCAGC) and the reverse primer 806R9 (GGACTACHVGGGGTWTCTAAT). The libraries were sequenced on the appropriate platforms to obtain the sequences. The experiment was conducted by Biomarker Technologies Co., Ltd. (Qingdao, Shandong), and the data were analyzed using BMKCloud (http://www.biocloud.net).
2.3.6 Renal non-targeted metabolomics
Samples were analyzed using an Ultra-Performance Liquid Chromatography system coupled with a time-of-flight mass spectrometer. Four samples were randomly selected from each group for omics analysis. A 2.1 mm × 100 mm, 1.7 μm BEH Amide column, maintained at 40 °C, was used to separate the analytes before mass spectrometric analysis. The mass spectrometer was operated in positive ion electrospray ionization full scan mode. Automatic calibration of the spectral peaks was performed to correct any deviations in the lock mass. The experiment was conducted by BestMs Technologies Co., Ltd. (Qingdao, Shandong), and analysis was performed using BestMsCloud (http://www.bestms.cn).
2.3.7 SCFAs concentration analysis
The concentration of SCFAs was determined as previously described (21). Fecal water was prepared by homogenizing the fecal samples with MilliQ water (1 ml) for 10 min using a vortex mixer. Diethyl ether (1.6 ml) and H2SO4 (50%, w/w) were added to the samples, followed by 20 min of oscillation on a table concentrator at 4 °C. The mixture was then centrifuged at 15,000 g for 5 min (4 °C), and the supernatant was filtered through 0.2 μm filters to remove bacteria and other solids. It was transferred to a 250 μl insert, which was placed in a 2 ml GC vial. The SCFAs of samples were analyzed by using gas chromatograph (Japan, Shimadzu Corporation, GC-2014C), and 2-ethylbutyric acid (Sigma) was used as the internal standard. A standard curve was constructed as well, and Varian Star Chromatography Workstation (version 6.0) was performed to analyze the peak profiles.
2.4 Statistical analysis
All data are presented as mean ± SD. Statistical differences between each group were assessed for significance using one-way analysis of variance (ANOVA). All statistical analyses were conducted using GraphPad Prism (version 8.0). p-values less than 0.05 were considered statistically significant.
3 Results
3.1 L. paracasei N1115 reduced SUA and improved serum biochemical indicators
The SUA level in the UA group was significantly higher than the CON group by 49.43% (p < 0.05; Figure 2A), confirming successful establishment of the HUA mouse model. After L. paracasei N1115 intervention, SUA levels were significantly reduced in both high and low-dose groups compared with the UA group, deceasing by 29.18 and 27.29%, respectively (p < 0.05), comparable to the CON and FB groups (p > 0.05). BUN and Cr levels are considered to be indicators of renal function (22). The BUN level in the UA group was significantly higher than that in the CON group (p < 0.05; Figure 2B), indicating impaired renal function. Following probiotic intervention, BUN levels in both HLP and LLP groups returned to the normal level. Although, the BUN in the FB group was reduced, the difference compared with the UA group was not statistically significant (p > 0.05). Additionally, both high-dose L. paracasei N1115 and Febuxostat effectively reduced serum Cr levels (Figure 2C). These findings suggest that L. paracasei N1115 is effective in regulating SUA levels in mice and may offer potential renal protection.
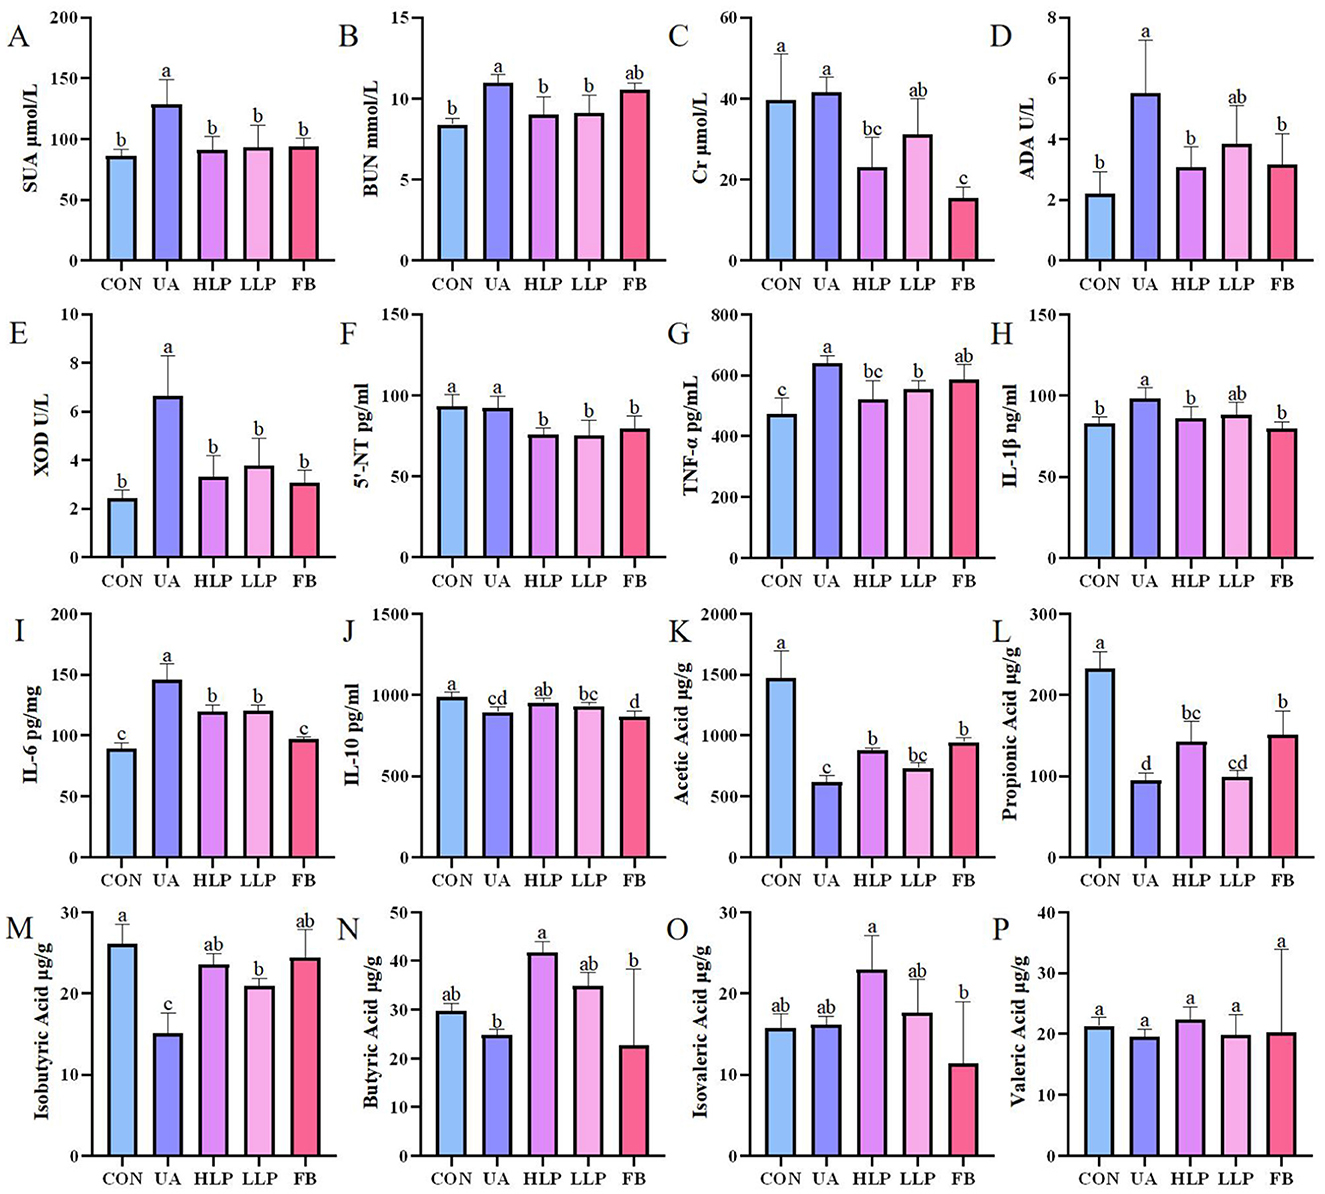
Figure 2. L. paracasei N1115 regulated UA metabolism and SCFAs. (A) SUA levels, (B) BUN levels, (C) Cr levels, (D) ADA activities, (E) XOD activities, (F) 5′-NT levels, (G) TNF-α levels, (H) IL-1β levels, (I) IL-6 levels, and (J) IL-10 levels in serum (n = 6), as well as (K) acetic acid levels, (L) propionic acid levels, (M) isobutyric acid levels, (N) butyric acid levels, (O) isovaleric acid levels, and (P) valeric acid levels in feces (n = 4). Values are expressed as the means ± SD. Different letters marked above the bar indicate significant difference (p < 0.05).
3.2 L. paracasei N1115 inhibited UA metabolism enzymes
Enzymes such as 5′-NT, ADA, and XOD play crucial roles in the pathway of UA synthesis (23). In vitro experiments showed that the metabolic products of L. paracasei N1115 inhibited XOD activity by 62.14%, demonstrating a strong inhibitory effect. The activities of ADA, XOD, and the content of 5′-NT in serum were also measured to investigate the effect of L. paracasei N1115 on UA metabolizing enzymes in mice. The results showed that the activities of ADA and XOD were significantly elevated in the UA group compared with the CON group (p < 0.05; Figures 2D, E). Both ADA and XOD activities were significantly inhibited in the HLP group, with reductions of 44.00 and 49.95%, respectively (p < 0.05), and were comparable to the FB group (p > 0.05). The inhibitory ability of ADA and XOD in the LLP group was weaker than those in the HLP group, but the difference was not statistically significant (p > 0.05). Regarding 5′-NT, no significant difference was observed between the CON and UA groups (p > 0.05; Figure 2F), suggesting that hypoxanthine and potassium oxonate had little effect on 5′-NT level. However, compared with CON and UA groups, both L. paracasei N1115 and febuxostat were able to reduce 5′-NT levels (p < 0.05), which may be vital for lowering SUA levels.
3.3 L. paracasei N1115 ameliorated systemic inflammation
Subsequently, the protein levels of IL-10, IL-6, IL-1β, and TNF-α were measured to analyze the effects of L. paracasei N1115 on inflammatory factors. The results showed that the pro-inflammatory factors TNF-α (Figure 2G), IL-1β (Figure 2H), and IL-6 (Figure 2I) were significantly increased in serum and the anti-inflammatory factor IL-10 (Figure 2J) was significantly decreased in the UA group compared with the CON group (p < 0.05). Both the HLP and LLP groups exhibited a significant reduction in the levels of TNF-α, IL-1β, and IL-6, along with a modest increase in IL-10. Specifically, compared with UA group, the TNF-α levels in the HLP and LLP groups decreased by 18.40% (p < 0.05) and 13.22% (p < 0.05); IL-1β decreased by 12.52% (p < 0.05) and 10.06% (p > 0.05); IL-6 decreased by 22.68% (p < 0.05) and 21.67% (p < 0.05); and IL-10 increased by 6.55% (p < 0.05) and 4.18% (p > 0.05), respectively. The observed increase in anti-inflammatory capacity is of significant importance for HUA mice. Febuxostat was also effective in reducing the pro-inflammatory cytokines IL-1β and IL-6 (p < 0.05), but the level of the anti-inflammatory cytokine IL-10 decreased rather than increased, indicating that its anti-inflammatory effect was less pronounced than that of L. paracasei N1115.
3.4 L. paracasei N1115 alleviated weight loss and structural damage in the kidney, liver, and duodenum induced by HUA
By measuring body weight and coefficients on liver and kidney in mice, it was found that L. paracasei N1115 was effective in mitigating weight loss induced by HUA (Figure 3A). Liver coefficients and kidney coefficients were significantly increased in the UA group compared with the CON group (p < 0.05; Figures 3B, C), and the intervention of febuxostat and probiotics significantly reversed these indices. To assess the effect of probiotics on tissue structural damage under HUA conditions, pathological sections of liver, kidney and duodenum were examined (Figure 3D). In the UA group, small intestinal villi were shortened, accompanied by noticeable inflammatory infiltration. Additionally, a significant reduction in goblet cells was observed in FB group. After intervention with L. paracasei N1115, inflammation was alleviated, and villus length was restored. In the CON group, the morphology of hepatocytes was normal, while the UA group exhibited numerous vacuoles. In contrast, the HLP group, LLP group, and FB group demonstrated significant improvement. Renal tubules in the UA group were markedly dilated, along with glomerular atrophy and cellular edema, while the FB group displayed severe glomerular deformation. L. paracasei N1115 ameliorated the aforementioned adverse symptoms.
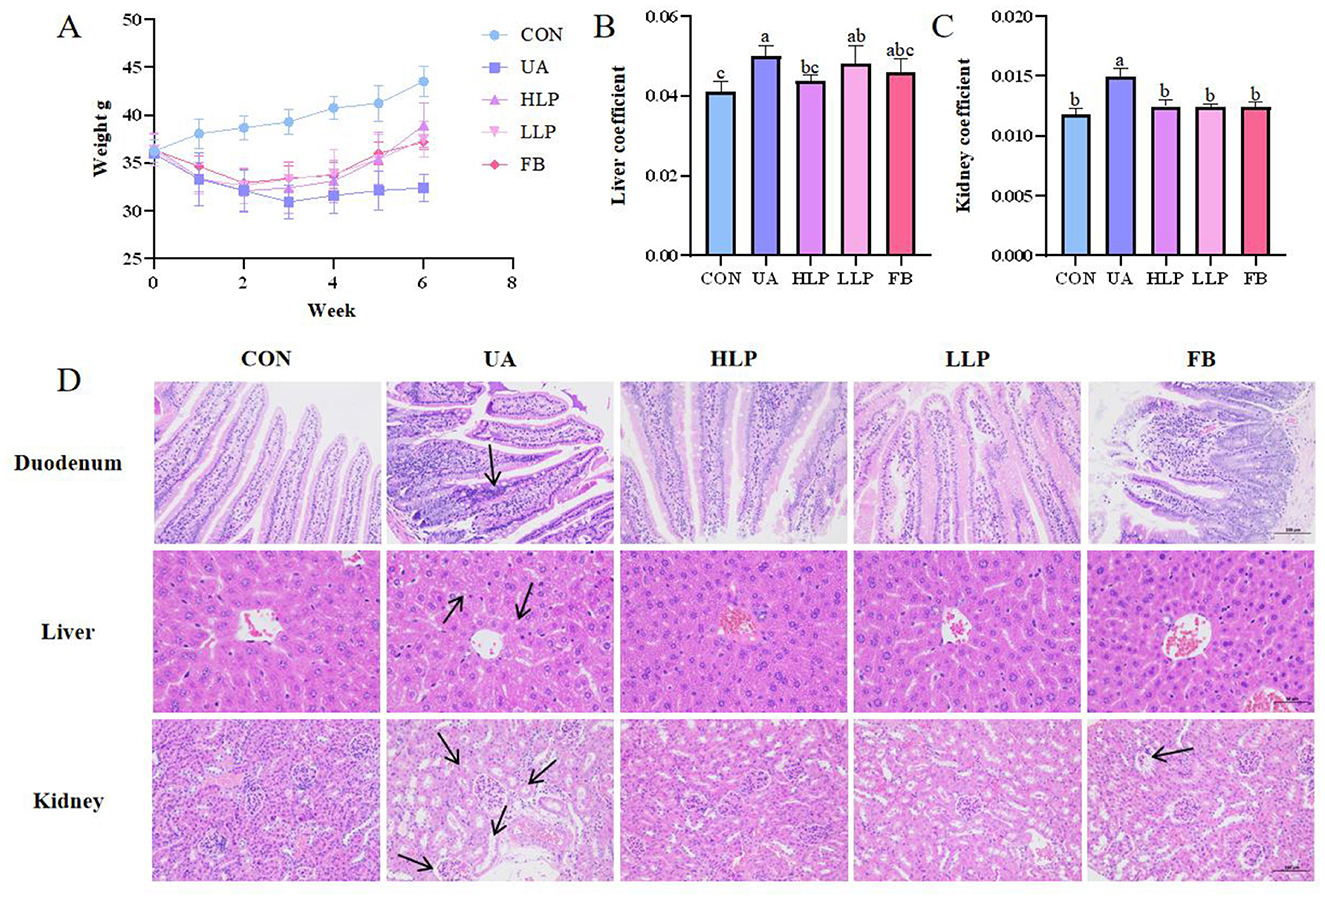
Figure 3. Effects of L. paracasei N1115 on weight and tissue damages in HUA mice. (A) Weight line. (B) Liver coefficient. (C) Kidney coefficient. (D) Representative images of H&E staining in the duodenum (×200), liver (×400), and kidney (×200). Values are expressed as the means ± SD (n = 6). Different letters marked above the bar indicate significant difference (p < 0.05).
3.5 L. paracasei N1115 affected the expression of renal urate transporters
Next, the levels of URAT1, GLUT9, OAT1, OAT3, and NPT1 were measured to investigate the effects of L. paracasei N1115 on renal transporters in mice. As shown in Figure 4, compared with the CON group, the expression of URAT1 and GLUT9 was significantly elevated in the UA group (p < 0.05; Figures 4B, F), while the expression of OAT1 and OAT3 was significantly reduced (p < 0.05; Figures 4C, D). However, there was no significant change in the expression of NPT1 (p > 0.05; Figure 4E). After the intervention of L. paracasei N1115, the expression of URAT1 decreased by 57.27% (p < 0.05) and 39.94% (p > 0.05) in the HLP and LLP groups, respectively, with no significant difference from the FB group (p > 0.05). Similarly, GLUT9 expression decreased by more than 14% in both high and low-dose groups (p < 0.05). In addition, excretory transporter protein OAT3 increased by 136.04% (p < 0.05) and 78.08% (p > 0.05) in the HLP and LLP groups, respectively. Febuxostat showed superior regulatory effects on OAT3 and GLUT9 compared with L. paracasei N1115. Unfortunately, no significant effects of L. paracasei N1115 on OAT1 and NPT1 was observed (p > 0.05). These findings suggest that L. paracasei N1115 may promote UA excretion by modulating the reabsorption transporter proteins URAT1 and GLUT9, as well as the excretion transporter protein OAT3.
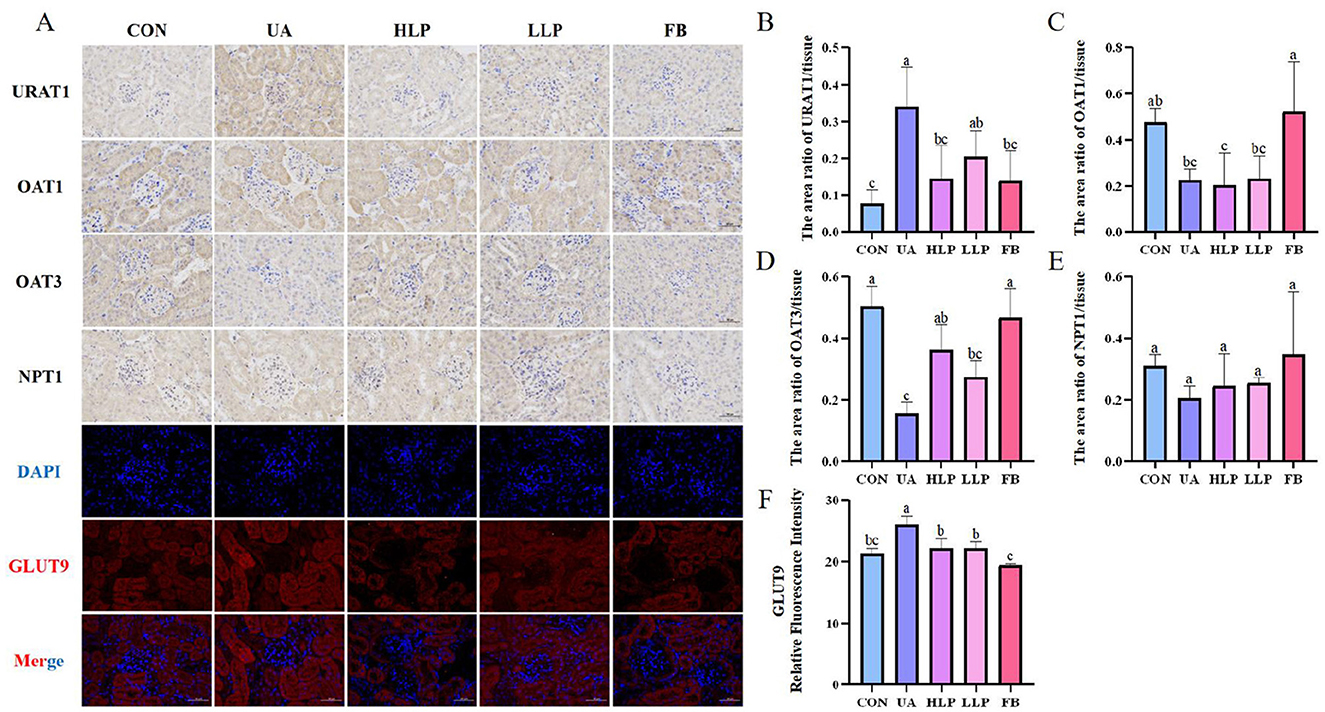
Figure 4. Effects of L. paracasei N1115 on renal excretory and reabsorptive transporter proteins. (A) Representative images (×400) of URAT1, OAT1, OAT3, NPT1 proteins immunohistochemistry, and GLUT9 protein immunofluorescence. Blue and red letters represent DAPI and GLUT9, respectively. (B) The area ratio of URAT1/tissue. (C) The area ratio of OAT1/tissue. (D) The area ratio of OAT3/tissue. (E) The area ratio of NPT1/tissue. (F) The relative fluorescence intensity of GLUT9. Values are expressed as the means ± SD (n = 4). Different letters marked above the bar indicate significant difference (p < 0.05).
3.6 L. paracasei N1115 remodeled intestinal microbiota structure in HUA mice
In this study, 16S rDNA region 3 and 4 sequencing analysis was performed to understand the effects of L. paracasei N1115 on the gut microbiota. Shannon's index indicated that exposure to hypoxanthine and potassium oxonate reduced the overall microbial community diversity. After treatment with L. paracasei N1115, species richness increased, with a slightly higher value in the LLP group compared with the HLP group (Figure 5A). Statistical analysis of operational taxonomic units (OTUs), displayed in the Venn diagram, revealed significant differences in composition between the groups (Figure 5B).
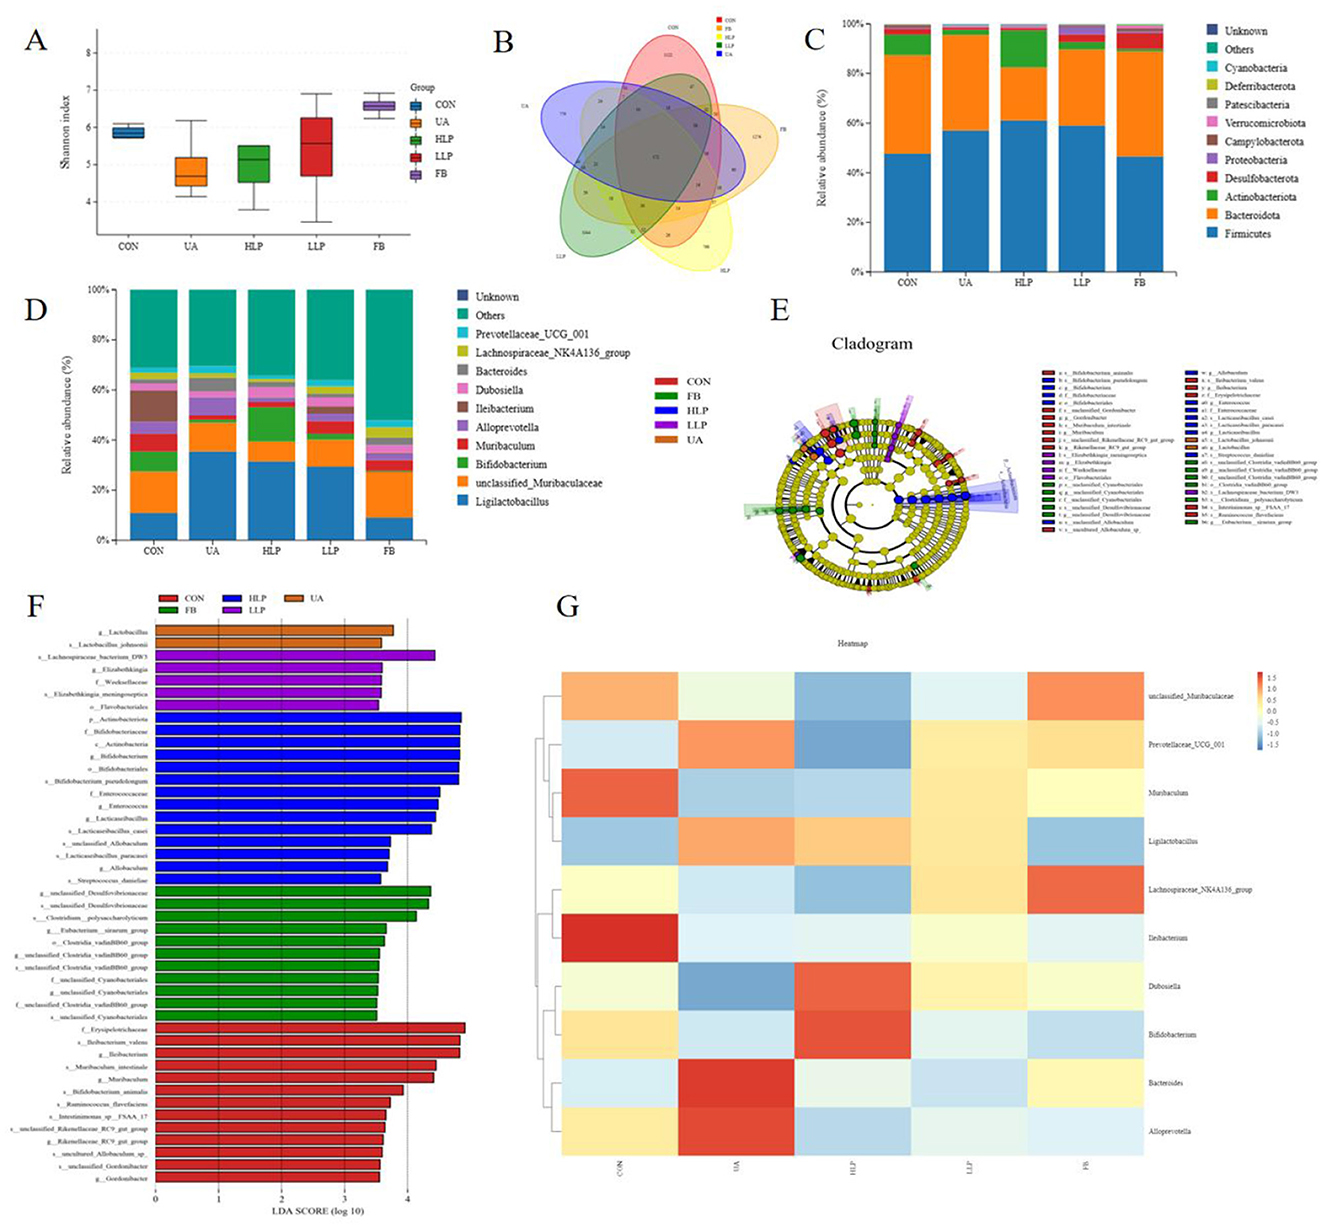
Figure 5. Effect of L. paracasei N1115 on the structure of the gut microbiota in HUA mice. (A) Shannon index. (B) Venn diagram. (C) Bar graphs showing the relative abundance of different bacteria at the phylum level. (D) Bar graphs showing the relative abundance of different bacteria at the genus level (n = 6). (E) The cladogram generated from LEfSe analysis. (F) Diagram of significantly different species with LDA score greater than 3.5. (G) Heat map depicting the composition of gut microbiota species. Data are expressed as mean ± SD (n = 4).
The species relative abundance of the gut microbiota was analyzed as well. At the phylum level, the CON group predominantly featured Firmicutes (47.70%), Bacteroidota (39.69%), Actinobacteriota (8.33%), Desulfobacterota (2.34%), and Campylobacterota (1.01%). The relative abundance of microbial communities in the UA group changed significantly, with a decrease in Actinobacteriota (2.10%), Desulfobacterota (0.93%), and a significant increase in Firmicutes (57.10%). Following intervention with L. paracasei N1115, Firmicutes increased moderately (HLP group: 61.11%; LLP group: 59.04%) and Bacteroidota decreased substantially (HLP group: 21.33%; LLP group: 30.66%). Notably, the abundance of Actinobacteriota (14.91%) was significantly higher in the HLP group. In the FB group, the abundance of Firmicutes (46.57%) was similar to the CON group, while Desulfobacterota (6.46%) showed a significant increase (Figure 5C). At the genus level, the five most abundant genera in the CON group were unclassified_Muribaculaceae (16.57%), Ileibacterium (12.60%), Ligilactobacillus (10.88%), Bifidobacterium (7.92%), and Muribaculum (7.08%). Compared with the CON group, the UA group showed a marked augmentation in Ligilactobacillus (35.46%), and substantial decrease in unclassified_Muribaculaceae (11.45%), Bifidobacterium (1.15%), Muribaculum (1.80%), and Ileibacterium (0.05%). Following probiotic intervention, Ligilactobacillus (HLP group: 31.48%; LLP group: 29.40%) decreased after probiotic intervention. Apart from that, Bifidobacterium (13.64%) increased significantly in the HLP group. In the FB group, the abundance of unclassified_Muribaculaceae (18.30%) and Ligilactobacillus (8.96%) was similar to the CON group, while Ileibacterium (0.44%) and Bifidobacterium (0.40%) were extremely low (Figure 5D). Linear discriminant analysis (LDA) and cladogram graph revealed a significant increase in the relative abundance of Ligilactobacillus in UA group. High-dose L. paracasei N1115 significantly increased the abundance of Bifidobacterium, Lacticaseibacillus, and Allobaculum and other genera (Figures 5E, F). Ultimately, heat map was generated to showcase the composition of gut microbiota species (Figure 5G).
3.7 The impact of L. paracasei N1115 on the renal metabolism
In order to explore the effect of L. paracasei N1115 on renal metabolism, an untargeted metabolomics analysis was conducted on the kidney samples. Differential metabolite analysis of UA group and HLP group was performed, and the pathway enrichment analysis identified significant enrichment in the tryptophan metabolism, Cysteine and methionine metabolism as well as the neomycin, kanamycin, and gentamicin biosynthesis between the UA and HLP groups (Figures 6A, B). Then the fold change bar chart reveals that the content of L-Tryptophan, Piperitone oxide, Gentamicin A (the presence of Gentamicin A may due to misannotation or contamination during LC-MS untargeted profiling as normally it is not an endogenous metabolite) in HLP group significantly elevated compared with UA group (Figure 6C). L-Tryptophan is an essential amino acid that plays a vital role in numerous physiological processes (24). Moreover, previous studies have demonstrated that tryptophan metabolism is closely associated with HUA (16).
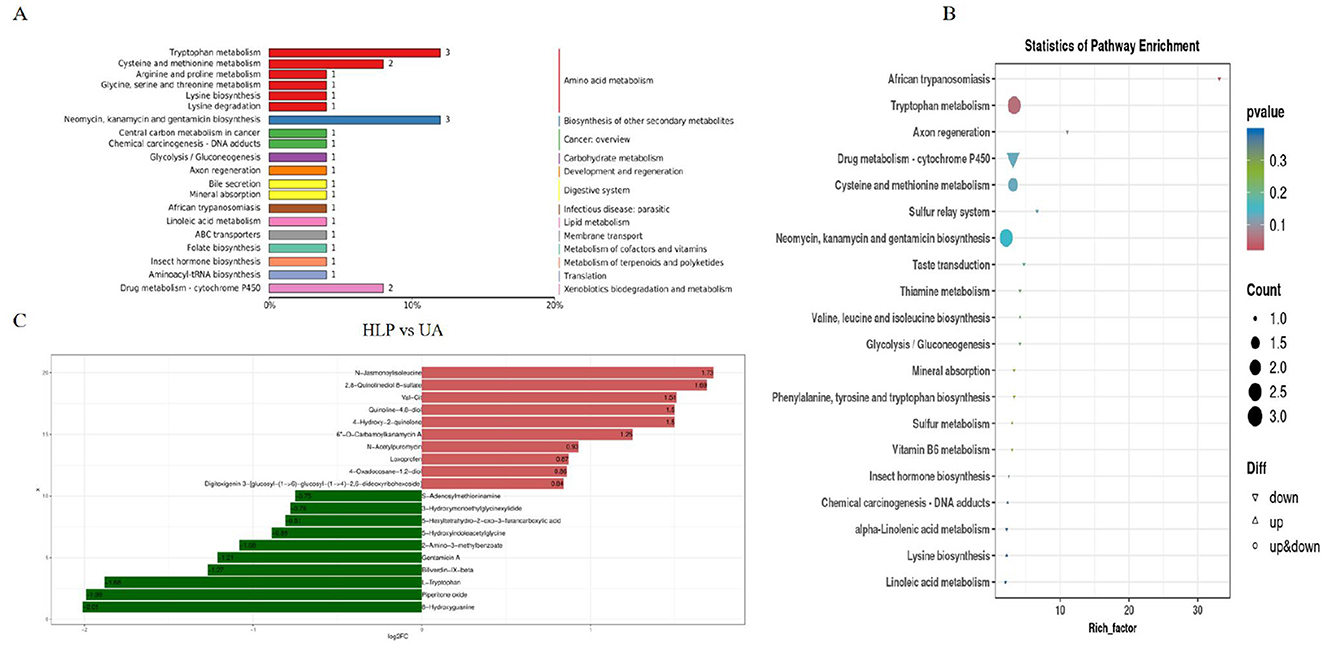
Figure 6. Effects of L. paracasei N1115 on the renal metabolism in HUA mice. (A) Pathway classification map of differential metabolites. (B) KEGG enrichment map of differential metabolites. (C) Fold change bar chart.
3.8 L. paracasei N1115 modulated the generation of SCFAs in gut
Ultimately, gas chromatography was used to analyze the impact of L. paracasei N1115 on SCFAs in mouse gut. Owing to misoperation, only four data were obtained in the CON group. To unify the sample number, we randomly selected four out of six samples from other groups for analysis. As illustrated in Figures 2K–P, the SCFAs levels in the UA group were markedly reduced, particularly acetic acid, propionic acid, and isobutyric acid, which decreased by 58.14%, 47.13%, and 25.95%, respectively (p < 0.05). L. paracasei N1115 significantly improved SCFA levels in the intestine; however, both high-dose and low-dose treatments still exhibited a considerably low levels in SCFAs than that of the CON group, particularly in acetic and propionic acid (p < 0.05). Notably, compared with the UA group, butyric and isobutyric acid levels were significantly elevated (p < 0.05), with butyric acid levels surpassing those found in healthy control mice (p > 0.05). Butyrate is known to play an active role in UA metabolism (13). Furthermore, gut microbiota analysis revealed a substantial increase in the abundance of Bifidobacterium following probiotic intervention, which is typically positively correlated with butyrate production (25). These findings reveal that L. paracasei N1115 may promote UA excretion by enhancing the abundance of butyrate-producing bacteria.
4 Discussion
The primary objective of this study was to evaluate the UA-lowering potential of L. paracasei N1115. After confirming in vitro that its metabolites were able to inhibit XOD, animal experiments were subsequently conducted, with both high- and low-dose groups established to examine whether dosage influenced its efficacy, as we hypothesized that a higher dose of probiotics would exert a stronger effect on HUA intervention (17). It was observed that both high- and low-dose groups significantly reduced the SUA in the mice by approximately 30%, with an effect comparable to that of febuxostat. Although both HLP and LLP groups can effectively alleviate HUA in mice, no significant differences were observed between these groups in terms of regulating SUA, BUN, Cr, and most inflammatory factors. We propose two possible explanations for this phenomenon. First, the intervention period may have been sufficiently long to allow the low-dose group to regulate UA metabolism. Second, the dosage administered to the low-dose group might have already been relatively high. Normally, HUA leads to obesity (26). However, in this study, HUA resulted in weight loss in mice. This may be due to HUA damaging the intestinal barrier, which reduced energy absorption (27). Following probiotic intervention, the low body weight of HUA-affected mice increased considerably in both HLP and LLP groups. Furthermore, HUA-induced tissue damage in the liver, kidneys, and duodenum was effectively mitigated by L. paracasei N1115. BUN and Cr are widely considered indicators of renal function, and their reduction reflects the protective effect of L. paracasei N1115 on kidney function (22).
Moreover, HUA is frequently accompanied by inflammatory responses. Studies have shown that UA crystals can bind to Toll-like receptors (TLR), which are essential membrane-bound receptors in innate immunity, thereby inducing inflammation (28). Specifically, TLR-2, TLR-4, and myeloid differentiation primary response protein 88 (MyD88) are crucial for the inflammatory response of macrophages to UA crystals. These crystals directly interact with these receptors, initiating signal transduction pathways that ultimately activate the nuclear factor kappa B (NF-κB) pathway, inducing the production of various pro-inflammatory factors such as IL-1β (29). Notably, after treatment with L. paracasei N1115, these pro-inflammatory factors tended to return to normal levels, and the expression of the anti-inflammatory factor IL-10 is elevated compared with the UA group, effectively alleviating inflammation, consistent with previous reports on other L. paracasei (30, 31). It is believed that this attenuation of inflammation is closely associated with the increased butyrate content in the gut. Butyrate can act as a ligand for peroxisome proliferator-activated receptor gamma (PPARγ), thereby suppressing NF-κB activity and simultaneously upregulating anti-inflammatory cytokines such as IL-10, ultimately alleviating inflammatory responses (32). However, whether a “L. paracasei N1115-butyrate-inflammation axis” exists remains to be confirmed in future studies.
Additionaly, L. paracasei N1115 can modulate HUA by effecting UA metabolism. UA metabolism mainly contains two main parts: its production and its excretion. Both processes must be harmonized to ensure the balance of UA metabolism. In humans, UA is the final product of purine metabolism, catalyzed by different enzymes at various stages (19). 5′-NT, ADA, and XOD are key catalysts participating in UA production. 5′-NT has low substrate specificity and can catalyze the hydrolysis of hypoxanthine nucleotide and adenylate to generate corresponding nucleosides (23). ADA participates in the deamination of adenosine to form hypoxanthine nucleoside (33, 34). After the conversion of hypoxanthine nucleoside to hypoxanthine, the product is oxidized to xanthine under the participation of XOD, and then further oxidized to UA (35). Among these enzymes, XOD has emerged as a drug target for the treatment of HUA (36). In vitro experiments showcased that the metabolic products of L. paracasei N1115 has a strong inhibitory effect to XOD. Plus, in vivo studies also demonstrated that L. paracasei N1115 can effectively reduce the activity of ADA and XOD in mice as well as the content of 5′-NT, in a manner similar to febuxostat. These findings suggest that L. paracasei N1115 may inhibit the activity or content of enzymes related to UA production through its metabolic products. The extent of the decrease in enzyme activity is comparable to previous reports on other L. paracasei (31, 37). However, the present study only demonstrated the inhibitory effects of these metabolites through in vitro and in vivo characterization. The specific metabolites responsible for inhibiting UA-producing enzymes have yet to be identified and need to be confirmed in future studies.
UA excretion also plays an equally important role in UA metabolism. Renal excretion accounts for approximately two-thirds of UA elimination, mediated by multiple several transport proteins including URAT1, GLUT9, OAT1, OAT3, and NPT1. URAT1 acts as a urate reabsorption transporter, reclaiming about 90% of filtered urate back into the bloodstream following glomerular filtration. GLUT9 facilitates the trans-epithelial urate reabsorption by mediating basolateral efflux of UA into systemic circulation, thus consistently exerting inhibitory effects on urate excretion. OAT1 and OAT3, located on the basolateral membrane of the proximal tubule, function as urate/dicarboxylate exchangers responsible for UA excretion. NPT1, which exhibits a weak to moderate correlation with altered SUA levels, facilitates both the absorption and efflux of UA. It participates in sodium-phosphate cotransport (29, 38). Notably, studies have shown that L. paracasei N1115 effectively downregulates URAT1 and GLUT9 expression while upregulating OAT3 levels. Overall, the regulatory capacity of the HLP group was stronger than that of the LLP group on those transporters. However, this probiotic strain did not affect the expression of OAT1 or NPT1. These findings suggest that L. paracasei N1115 may modulate the expression of URAT1, GLUT9, and OAT3 through a specific signaling pathway, ultimately enhancing renal urate excretion and reducing systemic reabsorption. This collective effect likely contributes to the reduction of serum UA levels in mice models (Figure 4). Existing animal experimental evidence has indicated that L. paracasei can lower UA levels in HUA mice by modulating urate transporters. For example, L. paracasei MJM60396 has been reported to upregulate OAT1 and OAT3, while downregulating URAT1 and GLUT9 (11). Additionally, intervention with L. paracasei LT12 significantly downregulated URAT1 and GLUT9, while upregulating OAT1 and ABCG2 (37). These findings are broadly consistent with the results obtained in our study. However, reports explaining the specific molecular mechanisms remain limited. In study evaluating the UA-lowering potential of L. paracasei LT12, an increase in butyrate levels was also observed (37). Previous studies have also found that supplementation with butyrate alone can modulate certain transporters, such as GLUT9 and ABCG2 (39). Future studies could incorporate metabolomics of L. paracasei to further explore the specific molecular mechanisms underlying its regulation of transporters.
Although no particularly significant differences were observed between the high- and low-dose groups in most parameters, we found that they differed in shaping the intestinal microbiota. The gut microbiota exhibits a complex interaction UA metabolism. On one hand, UA functions as both an antioxidant and immunomodulatory agent, significantly influencing the composition of the gut microbiota (40, 41). Conversely, the gastrointestinal tract plays a crucial role in UA excretion, with the gut microbial ecosystem actively contributing to this metabolic process (42). UA is transported into the intestinal lumen via specific transporter proteins, where it undergoes either direct excretion or microbial-mediated decomposition (43–45). This study demonstrated that excessive UA accumulation disrupted gut microbiota structure. The L. paracasei N1115 increased the microbiota richness of HUA mice. Unexpectedly, differential effects were observed between high-dose and low-dose L. paracasei N1115 on microbial community abundance. High-dose administration resulted in a decreased species richness compared with low-dose treatment (Figure 5A). This may be attributed to high-dose probiotics competing with native gut microorganisms for limited resources, such as nutrients and space, thereby inhibiting the growth and reproduction of some native species and reducing overall microbial richness. However, the potential side effects of this phenomenon remain undetermined. Overall, after L. paracasei N1115 intervention, the abundance of Bifidobacterium increased significantly, and Ligilactobacillus levels were also higher compared with those in healthy control mice. Previous literature has also reported that certain strains of L. paracasei, such as L. paracasei JY062 and L. paracasei L9, can increase the relative abundance of Bifidobacterium (46, 47). Lactobacillus and Bifidobacterium have a cross-feeding relationship in the gut. Bifidobacterium uses Lactobacillus-produced lactic acid and other metabolites as growth substrates (48). Previous studies have indicated that Bifidobacterium is negatively correlated with SUA (49). Additionally, some Ligilactobacillus can directly degrade purine compounds, thereby reducing UA production (50). Apart from that, Ligilactobacillus generates lactic acid, which helps maintain the acidic environment of the gut to inhibit the growth of harmful bacteria. Plus, it plays a role in enhancing the immune system and improving gut barrier integrity as well (51, 52). Notably, after high-dose intervention, the abundance of Allobaculum also increased. Although the research on Allobaculum is less extensive than that on other probiotics, studies have shown that it can help maintain gut health (53).
Following L. paracasei N1115 intervention, not only is microbial diversity improved, but the production of specific SCFAs, such as butyric acid, is also enhanced (Figures 2M, N). SCFAs are believed to play a key role in UA metabolism and serve as crucial factors of the kidney-gut axis. For instance, acetate can lower the intestinal pH, inhibit the growth of harmful bacteria, and strengthen the intestinal barrier. Once absorbed in the small intestine, acetate circulates throughout the body and is able to inhibit XOD activity in the kidneys and bloodstream (14). As mentioned before, butyrate, another SCFAs, regulates the expression of the transporter protein ABCG2 and GLUT9, which are widely distributed in both the gut and the kidneys (13, 39). Consequently, the gut microbiota can influence renal UA metabolism through the butyrate pathway. Additionally, butyrate exhibits anti-inflammatory and immunoregulatory properties by inhibiting the activation of the NF-κB pathway, thus mitigating systemic inflammation—an effect particularly important for maintaining UA homeostasis and the health of kidney-gut axis (54, 55). Numerous studies have reported that L. paracasei can increase intestinal butyrate levels (56). However, it is noteworthy that L. paracasei itself is unable to produce butyrate, indicating that the source of butyrate warrants further attention. In the present study, we observed that L. paracasei N1115 administration, particularly in the high-dose group, markedly increased the abundance of Bifidobacterium. This may be attributed to a cross-feeding relationship between Bifidobacterium and L. paracasei, as noted (48). Previous studies have demonstrated a positive correlation between the abundance of Bifidobacterium and intestinal butyrate levels (57). The metabolites of Bifidobacterium can serve as prebiotics for butyrate-producing bacteria, such as Anaerostipes caccae and Roseburia intestinalis, thereby enhancing intestinal butyrate concentrations (25). Therefore, our findings suggest that L. paracasei N1115 may alleviate HUA by increasing butyrate levels through a cross-feeding relationship with Bifidobacterium, which warrants further validation in future studies.
In addition to the SCFAs regulation, this study demonstrated that L. paracasei N1115 also exerts a pronounced impact on renal metabolic pathways, especially that of tryptophan metabolism (Figures 6A, B). Even if the present experiments could not fully substantiate underlying mechanisms of this regulation, the hypothesis based on the studies and existing papers is as followed: Bifidobacterium can enhance the production of tryptophan metabolites, especially indole-3-lactic acid (ILA), an intermediate in IPA production (58, 59). As a consequence, Bifidobacterium is strongly associated with the elevation of IPA level (60, 61). IPA can activate the aryl hydrocarbon receptor (AhR), thereby suppressing inflammation associated with NLRP3/GSDMD pyroptosis in the colon. Furthermore, IPA can upregulate ABCG2 expression, facilitating UA excretion (16, 62). These suggest that L. paracasei N1115 may indirectly modulate UA metabolism via influencing Bifidobacterium, leading to enhanced expression of transporter proteins such as ABCG2 and regulation of other related metabolism pathways, such as tryptophan metabolism. Therefore, further experimental studies will be arranged to explore this hypothesis.
5 Conclusion
The experimental results demonstrate that L. paracasei N1115 can alleviate HUA in mice. Firstly, in vitro experiments showed that the metabolic products of L. paracasei N1115 has a strong inhibitory effect to XOD. In vivo experiments, L. paracasei N1115 intervention reduced SUA, protected kidney function, mitigated tissue damages and inflammation induced by HUA. Additionally, it effected UA production by modulating enzymes related to UA synthesis, including 5′-NT, ADA, and XOD. L. paracasei N1115 also promoted UA excretion by reducing the urate reabsorption proteins GLUT9 and URAT1 and enhancing the UA excretion protein OAT3. Futhermore, L. paracasei N1115 reshaped the gut microbiota and significantly increased the abundance of Bifidobacterium, while modulating renal metabolism elevating butyric acid levels in gut. These findings suggest that L. paracasei N1115 may improve the urate metabolism via enhancing butyric acid levels through cross-feeding relationship with Bifidobacterium. Although further experiments are required to substantiate underlying mechanisms, this study provides a basis for anti-HUA functional foods development.
Data availability statement
The datasets presented in this study have been deposited to the NCBI (https://www.ncbi.nlm.nih.gov) with the accession number PRJNA1329173. Further inquiries can be directed to the corresponding authors.
Ethics statement
The animal study was approved by Animal Ethics Committee of Northwest A&F University (Certificate No. SCXK [SHAAN] 2017-003; Approval Number: IACUC2024-0715). The study was conducted in accordance with the local legislation and institutional requirements.
Author contributions
HZ: Methodology, Writing – original draft, Conceptualization, Investigation, Visualization, Writing – review & editing. DW: Writing – review & editing, Writing – original draft, Methodology, Conceptualization, Investigation. DL: Writing – review & editing, Investigation. BB: Writing – review & editing, Investigation. QC: Investigation, Writing – review & editing. SW: Writing – review & editing, Investigation. SH: Methodology, Conceptualization, Writing – review & editing. MZ: Supervision, Conceptualization, Writing – review & editing, Methodology.
Funding
The author(s) declare that financial support was received for the research and/or publication of this article. This study was financially supported by the grant of the National Key Research and Development Program of China (NO. 2024YFE0112200), and the Key Research and Development Program of Shaanxi Province (NO. 2025NC-YBXM-177).
Conflict of interest
The authors declare that the research was conducted in the absence of any commercial or financial relationships that could be construed as a potential conflict of interest.
Generative AI statement
The author(s) declare that no Gen AI was used in the creation of this manuscript.
Any alternative text (alt text) provided alongside figures in this article has been generated by Frontiers with the support of artificial intelligence and reasonable efforts have been made to ensure accuracy, including review by the authors wherever possible. If you identify any issues, please contact us.
Publisher's note
All claims expressed in this article are solely those of the authors and do not necessarily represent those of their affiliated organizations, or those of the publisher, the editors and the reviewers. Any product that may be evaluated in this article, or claim that may be made by its manufacturer, is not guaranteed or endorsed by the publisher.
Abbreviations
HUA, hyperuricemia; UA, uric acid; SUA, serum uric acid; BUN, blood urea nitrogen; Cr, creatinine; XOD, xanthine oxidase; ADA, adenosine deaminase; 5′-NT, 5′-nucleotidase; SCFAs, short-chain fatty acids; IPA, indole-3-lactic acid; IAA, indole-3-acetic acid; ABCG2, ATP-binding Cassette Sub-family G Member 2; IL-1β, interleukin-1β; IL-6, interleukin-6; TNF-α, tumor necrosis factor-α; IL-10, interleukin-10; URAT1, urate transporter 1; OAT1, organic anion transporter 1; OAT3, organic anion transporter 3; NPT1, nucleoside phosphate transporter 1; CON group, control group; UA group, HUA model group; HLP group, high-dose L. paracasei N1115 group; LLP group, low-dose L. paracasei N1115 group; FB group, febuxostat group; TLR, toll-like receptors; PPARγ, peroxisome proliferator-activated receptor gamma; MyD88, myeloid differentiation primary response protein 88; NF-κB, nuclear factor kappa B; GLUT9, glucose Transporter 9; ILA, indole-3-lactic acid; AhR, aryl hydrocarbon receptor; OTUs, operational taxonomic units.
References
1. Bardin T, Richette P. Definition of hyperuricemia and gouty conditions. Curr Opin Rheumatol. (2014) 26:186–91. doi: 10.1097/BOR.0000000000000028
2. Feng TX Li CC, Zheng JL, Xu YQ, Wang XX Li YS, Wang YL, Zhu BL, et al. Prevalence of and risk factors for hyperuricemia in urban chinese check-up population. Int J Endocrinol. (2024) 2024:10. doi: 10.1155/2024/8815603
3. He HJ, Guo P, He JS, Zhang JB, Niu YJ, Chen S, et al. Prevalence of hyperuricemia and the population attributable fraction of modifiable risk factors: evidence from a general population cohort in China. Front Public Health. (2022) 10:11. doi: 10.3389/fpubh.2022.936717
4. Grassi D, Desideri G, Di Giacomantonio AV, Di Giosia P, Ferri C. Hyperuricemia and cardiovascular risk. High Blood Press Cardiovasc Prev. (2014) 21:235–42. doi: 10.1007/s40292-014-0046-3
5. Li CG, Hsieh MC, Chang SJ. Metabolic syndrome, diabetes, and hyperuricemia. Curr Opin Rheumatol. (2013) 25:210–6. doi: 10.1097/BOR.0b013e32835d951e
6. Khadka M, Pantha B, Karki L. Correlation of uric acid with glomerular filtration rate in chronic kidney disease. J Nepal Med Assoc. (2018) 56:724–7. doi: 10.31729/jnma.3700
7. Grayson PC, Kim SY, LaValley M, Choi HK. Hyperuricemia and incident hypertension: a systematic review and meta-analysis. Arthritis Care Res. (2011) 63:102–10. doi: 10.1002/acr.20344
8. Dalbeth N, Gosling AL, Gaffo A, Abhishek A. Gout. Lancet. (2021) 397:1843–55. doi: 10.1016/S0140-6736(21)00569-9
9. Wang H, Dai J, Han Y, Wa Y, Chen D, Yang R, et al. Screening and evaluation of a novel nucleotide-degrading Levilactobacillus brevis grx821 with anti-hyperuricemia ability. Food Bioscience. (2024) 60:104337. doi: 10.1016/j.fbio.2024.104337
10. Cao JY, Wang T, Liu YS, Zhou W, Hao HN, Liu QQ, et al. Correction: Lactobacillus fermentum F40-4 ameliorates hyperuricemia by modulating the gut microbiota and alleviating inflammation in mice. Food Funct. (2024) 15:2328. Correction doi: 10.1039/D4FO90016B
11. Lee Y, Werlinger P, Suh JW, Cheng JH. Potential probiotic Lacticaseibacillus paracasei MJM60396 prevents hyperuricemia in a multiple way by absorbing purine, suppressing xanthine oxidase and regulating urate excretion in mice. Microorganisms. (2022) 10:20. doi: 10.3390/microorganisms10050851
12. Meng YP, Hu YS, Wei M, Wang KM, Wang YY, Wang SL, et al. Amelioration of hyperuricemia by Lactobacillus acidophilus F02 with uric acid-lowering ability via modulation of NLRP3 inflammasome and gut microbiota homeostasis. J Funct Food. (2023) 111:11. doi: 10.1016/j.jff.2023.105903
13. Li Y, Li H, Wang R, Yu Y, Liu X, Tian Z. Protective effect of sodium butyrate on intestinal barrier damage and uric acid reduction in hyperuricemia mice. Biomed Pharmacother. (2023) 161:114568. doi: 10.1016/j.biopha.2023.114568
14. Olaniyi KS, Amusa OA, Akinnagbe NT, Ajadi IO, Ajadi MB, Agunbiade TB, et al. Acetate ameliorates nephrotoxicity in streptozotocin-nicotinamide-induced diabetic rats: involvement of xanthine oxidase activity. Cytokine. (2021) 142:155501. doi: 10.1016/j.cyto.2021.155501
15. Hussain A, Rui BQ, Ullah H, Dai PP, Ahmad K, Yuan JL, et al. Limosilactobacillus reuteri HCS02-001 attenuates hyperuricemia through gut microbiota-dependent regulation of uric acid biosynthesis and excretion. Microorganisms. (2024) 12:23. doi: 10.3390/microorganisms12040637
16. Wang Q, Liang J, Zou Q, Wang W, Yan G, Guo R, et al. Tryptophan metabolism-regulating probiotics alleviate hyperuricemia by protecting the gut barrier integrity and enhancing colonic uric acid excretion. J Agric Food Chem. (2024) 72:26746–61. doi: 10.1021/acs.jafc.4c07716
17. Mazhar MU, Naz S, Khan JZ, Khalid S, Ghazanfar S, Selim S, et al. Safety Evaluation and antioxidant potential of new probiotic strain Bacillus subtilis (NMCC-path-14) in Balb/c mice by sub-acute repeated dose toxicity. Heliyon. (2024) 10:e38581. doi: 10.1016/j.heliyon.2024.e38581
18. de Souza MR, de Paula CA, Pereira de. Resende ML, Grabe-Guimarães A, de Souza Filho JD, Saúde-Guimarães DA. Pharmacological basis for use of Lychnophora trichocarpha in gouty arthritis: anti-hyperuricemic and anti-inflammatory effects of its extract, fraction and constituents. J Ethnopharmacol. (2012) 142:845–50. doi: 10.1016/j.jep.2012.06.012
19. Liu Y, Jarman JB, Low YS, Augustijn HE, Huang S, Chen H, et al. A widely distributed gene cluster compensates for uricase loss in hominids. Cell. (2023) 186:3400–13.e3420. doi: 10.1016/j.cell.2023.06.010
20. Zhao Y, Jia M, Ding C, Bao B, Li H, Ma J, et al. Time-restricted feeding mitigates Alzheimer's disease-associated cognitive impairments via a B. pseudolongum-propionic acid-FFAR3 axis. Imeta. (2025) 4:e70006. From NLM. doi: 10.1002/imt2.70006
21. Yuan M, Chang L, Gao P, Li J, Lu X, Hua M, et al. Synbiotics containing sea buckthorn polysaccharides ameliorate DSS-induced colitis in mice via regulating Th17/Treg homeostasis through intestinal microbiota and their production of BA metabolites and SCFAs. Int J Biol Macromol. (2024) 276:133794. doi: 10.1016/j.ijbiomac.2024.133794
22. Huang F, Dai Q, Ma Q, Zheng K, Wu Y, Sun D, et al. Skipjack Tuna (Katsuwonus pelamis) dark muscle hydrolysate ameliorates hyperuricemia in mice via regulating gut microbiota and serum metabolism. J Food Sci. (2025) 90:e70232. doi: 10.1111/1750-3841.70232
23. Yang Y, Zhang ZC, Zhou Q, Yan JX, Zhang JL, Su GH. Hypouricemic effect in hyperuricemic mice and xanthine oxidase inhibitory mechanism of dietary anthocyanins from purple sweet potato (Ipomoea batatas L). J Funct Food. (2020) 73:9. doi: 10.1016/j.jff.2020.104151
24. Richard DM, Dawes MA, Mathias CW, Acheson A, Hill-Kapturczak N, Dougherty DM. L-tryptophan: basic metabolic functions, behavioral research and therapeutic indications. Int J Tryptophan Res. (2009) 2:45–60. doi: 10.4137/IJTR.S2129
25. Mann, ER Lam, YK Uhlig, HH. Short-chain fatty acids: linking diet, the microbiome and immunity. Nat Rev Immunol. (2024) 24:577–95 doi: 10.1038/s41577-024-01014-8
26. Gong M, Wen S, Nguyen T, Wang CX, Jin JL, Zhou LG. Converging relationships of obesity and hyperuricemia with special reference to metabolic disorders and plausible therapeutic implications. Diabetes Metab Syndr Obes. (2020) 13:943–62. doi: 10.2147/DMSO.S232377
27. Liu Y, Sheng S, Wu L, Wang H, Xue H. Wang R. Flavonoid-rich extract of Paederia scandens (Lour) Merrill improves hyperuricemia by regulating uric acid metabolism and gut microbiota. Food Chem. (2025) 471:142857. doi: 10.1016/j.foodchem.2025.142857
28. Liu-Bryan R, Scott P, Sydlaske A, Rose DM, Terkeltaub R. Innate immunity conferred by Toll-like receptors 2 and 4 and myeloid differentiation factor 88 expression is pivotal to monosodium urate monohydrate crystal-induced inflammation. Arthritis Rheum. (2005) 52:2936–46. From NLM. doi: 10.1002/art.21238
29. Du L, Zong Y, Li H, Wang Q, Xie L, Yang B, et al. Hyperuricemia and its related diseases: mechanisms and advances in therapy. Signal Transduct Target Ther. (2024) 9:212. doi: 10.1038/s41392-024-01916-y
30. Chen W, Tian T, Zhou J, Yang D, Liang M, He Y, et al. Safety evaluation of human-derived uric acid degrading Lacticaseibacillus paracasei M2a and its impact on gut microbiota. Probiotics Antimicrob Proteins. (2025) doi: 10.1007/s12602-025-10562-x
31. Bi CM, Zhang LJ, Liu JY, Chen LH. Lactobacillus paracasei 259 alleviates hyperuricemia in rats by decreasing uric acid and modulating the gut microbiota. Front Nutr. (2024) 11:12. doi: 10.3389/fnut.2024.1450284
32. Dicks LMT. Butyrate produced by gut microbiota regulates atherosclerosis: a narrative review of the latest findings. Int J Mol Sci. (2025) 26:6744. doi: 10.3390/ijms26146744
33. Giuliani P, Zuccarini M, Buccella S, Rossini M, D'Alimonte I, Ciccarelli R, et al. Development of a new HPLC method using fluorescence detection without derivatization for determining purine nucleoside phosphorylase activity in human plasma. J Chromatogr B. (2016) 1009–1010:114–21. doi: 10.1016/j.jchromb.2015.12.012
34. Wan Y, Wang F. Zou, B, Shen, Y, Li, Y, Zhang, A, Fu, G. Molecular mechanism underlying the ability of caffeic acid to decrease uric acid levels in hyperuricemia rats. J Funct Food. (2019) 57:150–6. doi: 10.1016/j.jff.2019.03.038
35. Ahlawat J, Sharma M, Pundir CS. Advances in xanthine biosensors and sensors: a review. Enzyme Microb Technol. (2024) 174:13. Review doi: 10.1016/j.enzmictec.2023.110377
36. Sun ZG, Wu KX, Ullah I, Zhu HL. Recent advances in xanthine oxidase inhibitors. Mini-Rev Med Chem. (2024) 24:1177–86. doi: 10.2174/1389557523666230913091558
37. Tseng W-T, Kong X-R, Han Y-T, Lin W-Y, Yin D, Du L, et al. Lacticaseibacillus paracasei LT12—a probiotic strain that reduces hyperuricemia via inhibiting XO activity and regulating renal uric acid transportation protein. Fermentation. (2025) 11:96. doi: 10.3390/fermentation11020096
38. Enomoto A, Kimura H, Chairoungdua A, Shigeta Y, Jutabha P, Cha SH, et al. Molecular identification of a renal urate-anion exchanger that regulates blood urate levels. Nature. (2002) 417:447–52. doi: 10.1038/nature742
39. Renton N, Pillinger MH, Toprover M. Gout, hyperuricemia, and the intestinal microbiome. Inflammation. (2025). doi: 10.1007/s10753-025-02337-x
40. Gherghina ME, Peride I, Tiglis M, Neagu TP, Niculae A, Checherita IA. Uric acid and oxidative stress-relationship with cardiovascular, metabolic, and renal impairment. Int J Mol Sci. (2022) 23:16. doi: 10.3390/ijms23063188
41. Crane JK, Mongiardo KM. Pro-inflammatory effects of uric acid in the gastrointestinal tract. Immunol Invest. (2014) 43:255–66. doi: 10.3109/08820139.2013.864667
42. Kasahara K, Kerby RL, Zhang QJ, Pradhan M, Mehrabian M, Lusis AJ, et al. Gut bacterial metabolism contributes to host global purine homeostasis. Cell Host Microbe. (2023) 31:1038–53. doi: 10.1016/j.chom.2023.05.011
43. Wu XH, You CG. The biomarkers discovery of hyperuricemia and gout: proteomics and metabolomics. PeerJ. (2023) 11:29. doi: 10.7717/peerj.14554
44. Wei J, Zhang YQ, Dalbeth N, Terkeltaub R, Yang T, Wang YL, et al. Association between gut microbiota and elevated serum urate in two independent cohorts. Arthritis Rheumatol. (2022) 74:682–91. doi: 10.1002/art.42009
45. Wang J, Chen Y, Zhong H, Chen F, Regenstein J, Hu XS, et al. The gut microbiota as a target to control hyperuricemia pathogenesis: potential mechanisms and therapeutic strategies. Crit Rev Food Sci Nutr. (2022) 62:3979–89, Review doi: 10.1080/10408398.2021.1874287
46. Su Y, Ren J, Zhang J, Zheng J, Zhang Q, Tian Y, et al. Lactobacillus paracasei JY062 alleviates glucolipid metabolism disorders via the adipoinsular axis and gut microbiota. Nutrients. (2024) 16:267. doi: 10.3390/nu16020267
47. Sun NY, Chen S, Li Y. Lactobacillus paracasei L9 ameliorated obesity-associated metabolic parameters and relevant gut microbiota in mice fed a high-fat diet. Nutr Res. (2023) 115:26–37. doi: 10.1016/j.nutres.2023.04.003
48. Xiao M, Zhang C, Duan H, Narbad A, Zhao J, Chen W, et al. Cross-feeding of bifidobacteria promotes intestinal homeostasis: a lifelong perspective on the host health. NPJ Biofilms Microbiomes. (2024) 10:47. doi: 10.1038/s41522-024-00524-6
49. Gong H, Gao H, Ren Q, He J. The abundance of Bifidobacterium in relation to visceral obesity and serum uric acid. Sci Rep. (2022) 12:13073. doi: 10.1038/s41598-022-17417-3
51. Kajikawa A, Eguchi N, Suzuki S. Immunogenic modification of Ligilactobacillus agilis by specific amino acid substitution of flagellin. Appl Environ Microbiol. (2022) 88:12. doi: 10.1128/aem.01277-22
52. Qiu B, Zhu L, Zhang SB, Han SY, Fei YQ, Ba FR, et al. Prevention of loperamide-induced constipation in mice and alteration of 5-hydroxytryotamine signaling by Ligilactobacillus salivarius Li01. Nutrients. (2022) 14:15. doi: 10.3390/nu14194083
53. Zheng ZB, Lyu WT, Ren Y, Li XQ, Zhao SJ, Yang H, et al. Allobaculum involves in the modulation of intestinal ANGPTLT4 expression in mice treated by high-fat diet. Front Nutr. (2021) 8:690138. doi: 10.3389/fnut.2021.690138
54. Jia JL, Nie L, Liu Y. Butyrate alleviates inflammatory response and NF-κB activation in human degenerated intervertebral disc tissues. Int Immunopharmacol. (2020) 78:10. doi: 10.1016/j.intimp.2019.106004
55. Zhang MM, Zhou Q, Dorfman RG, Huang XL, Fan TT, Zhang H, et al. Butyrate inhibits interleukin-17 and generates Tregs to ameliorate colorectal colitis in rats. BMC Gastroenterol. (2016) 16:9. doi: 10.1186/s12876-016-0500-x
56. Ferrario C, Taverniti V, Milani C, Fiore W, Laureati M, De Noni I, et al. Modulation of fecal Clostridiales bacteria and butyrate by probiotic intervention with Lactobacillus paracasei DG varies among healthy adults. J Nutr. (2014) 144:1787–96. From NLM. doi: 10.3945/jn.114.197723
57. Chen M, Li Y, Zhai Z, Wang H, Lin Y, Chang F, et al. Bifidobacterium animalis subsp. lactis A6 ameliorates bone and muscle loss via modulating gut microbiota composition and enhancing butyrate production. Bone Res. (2025) 13:28. doi: 10.1038/s41413-024-00381-1
58. Qian X, Li Q, Zhu HY, Chen Y, Lin GP, Zhang H, et al. Bifidobacteria with indole-3-lactic acid-producing capacity exhibit psychobiotic potential via reducing neuroinflammation. Cell Rep Med. (2024) 5:23. doi: 10.1016/j.xcrm.2024.101798
59. Mercenier A, Vu LD, Poppe J, Albers R, McKay S, van den Abbeele P. Carrot-derived rhamnogalacturonan-I consistently increases the microbial production of health-promoting indole-3-propionic acid ex vivo. Metabolites. (2024) 14:13. doi: 10.3390/metabo14120722
60. Kim CS, Jung SH, Hwang GS, Shin DM. Gut microbiota indole-3-propionic acid mediates neuroprotective effect of probiotic consumption in healthy elderly: a randomized, double-blind, placebo-controlled, multicenter trial and in vitro study*. Clin Nutr. (2023) 42:1025–33. doi: 10.1016/j.clnu.2023.04.001
61. Yang M, Cai WH Li XX, Deng YX Li JJ, Wang X, et al. The effect of type 2 resistant starch and indole-3-propionic acid on ameliorating high-fat-diet-induced hepatic steatosis and gut dysbiosis. Foods. (2024) 13:18. doi: 10.3390/foods13111625
Keywords: Lactobacillus paracasei, hyperuricemia, uric acid metabolism, gut microbiota, short-chain fatty acids, Bifidobacterium, butyric acid
Citation: Zhang H, Wang D, Li D, Bao B, Chen Q, Wang S, Han S and Zhao M (2025) Lactobacillus paracasei N1115 alleviates hyperuricemia in mice: regulation of uric acid metabolism as well as its impact on gut microbiota and short-chain fatty acids. Front. Nutr. 12:1651214. doi: 10.3389/fnut.2025.1651214
Received: 21 June 2025; Accepted: 15 September 2025;
Published: 07 October 2025.
Edited by:
Omar Guzmán Quevedo, Higher Technological Institute of Tacambaro, MexicoReviewed by:
Puwich Chaikhumwang, University of Phayao, ThailandElizabeth Nascimento, Federal University of Pernambuco, Brazil
Wenlong Ma, Yangzhou University, China
Copyright © 2025 Zhang, Wang, Li, Bao, Chen, Wang, Han and Zhao. This is an open-access article distributed under the terms of the Creative Commons Attribution License (CC BY). The use, distribution or reproduction in other forums is permitted, provided the original author(s) and the copyright owner(s) are credited and that the original publication in this journal is cited, in accordance with accepted academic practice. No use, distribution or reproduction is permitted which does not comply with these terms.
*Correspondence: Shichao Han, aGFuc2hpY2hhb2hvbWVAMTYzLmNvbQ==; Mengge Zhao, emhhb21lbmdnZUBud2FmdS5lZHUuY24=
†These authors have contributed equally to this work