 Yanhua Tian
 Wenbo Sun2
 Jijun Song
- 1Department of Otorhinolaryngology, Zhoukou Central Hospital, Zhoukou Medical Science Research Center, Zhoukou, China
- 2Department of Pharmacy, Zhoukou Central Hospital, Zhoukou Medical Science Research Center, Zhoukou, China
Background: Oxidative stress has been implicated in the development of allergic rhinitis (AR), yet its population-level impact using composite oxidative metrics remains underexplored. This study aimed to investigate the association between the oxidative balance score (OBS), a composite indicator of pro- and antioxidant exposures, and AR in U.S. adults.
Methods: We analyzed data in the 2005–2006 NHANES. An OBS, comprising 16 dietary and 4 lifestyle factors, was calculated and analyzed as both a continuous variable and by quartiles. Associations with AR were assessed using multivariable logistic regression and restricted cubic spline (RCS) models. Survey-weighted analyses were additionally performed to account for the complex sampling design and assess national representativeness. Sensitivity analyses included dietary energy adjustment (residual method), exclusion of asthma or supplement users, and alternative AR definitions. Exploratory subgroup analyses were further conducted across demographic and clinical strata with false discovery rate (FDR) correction for multiple testing.
Results: Among 1,491 adults, higher total and dietary OBS were significantly associated with AR. In fully adjusted models, each unit increase in total OBS corresponded to 2% higher odds of AR (OR = 1.02; 95% CI: 1.01–1.04), and each SD increase to 19% higher odds (OR = 1.19; 95% CI: 1.06–1.34). Dietary OBS showed a similar association (OR = 1.03; 95% CI: 1.01–1.04), whereas lifestyle OBS was not significant (OR = 1.01; 95% CI: 0.93–1.08). Quartile analyses revealed dose–response relationships, with Q4 of total (OR = 1.67; 95% CI: 1.20–2.33) and dietary OBS (OR = 1.60; 95% CI: 1.16–2.22) showing significantly increased odds compared with Q1. In survey-weighted analyses, total OBS remained significantly associated with AR, whereas dietary and lifestyle OBS were not. These associations remained robust in sensitivity analyses.
Conclusion: In a nationally representative sample, higher OBS was associated with greater odds of AR after adjustment, with an approximately linear association. Associations were stronger for dietary than lifestyle OBS, and the positive association persisted for total OBS in survey-weighted models. Overall, these findings suggest OBS may serve as a practical composite marker of diet-related redox balance in AR epidemiology.
Introduction
Allergic rhinitis (AR) is a prevalent, nonfatal, chronic inflammatory disorder of the nasal mucosa, typically presenting with sneezing, nasal congestion, rhinorrhea, and nasal itching (1). It affects approximately 10–30% of the global population, with its prevalence rising notably in urbanized regions with high environmental exposure burdens over recent decades (2, 3). Although nonfatal, AR imposes a substantial burden on quality of life, work productivity, and healthcare resources (4). AR also frequently coexists with other atopic conditions such as asthma and atopic dermatitis and is recognized as part of the “atopic march”—a progressive sequence of allergic manifestations during early life (5). Its pathogenesis involves a complex interplay between IgE-mediated hypersensitivity and immune cell activation, typically triggered by environmental allergens (6, 7).
Emerging evidence has highlighted the pivotal role of oxidative stress in the pathogenesis of allergic diseases, including AR (8, 9). Oxidative stress results from an imbalance between the excessive generation of reactive oxygen species (ROS) and the antioxidant defense system (10). In AR, In AR, ROS such as O₂− and H₂O₂ can disrupt epithelial barrier integrity, activate redox-sensitive transcription factors such as NF-κB, and amplify the release of proinflammatory mediators, thereby enhancing allergen sensitization and perpetuating Th2-driven immune responses (8). Moreover, oxidative stress impairs epithelial tight junctions, increases mucosal permeability, and promotes mast cell and eosinophil activation, ultimately leading to nasal obstruction, rhinorrhea, and sneezing. Clinical and experimental studies consistently demonstrate that patients with AR exhibit elevated markers of oxidative stress and reduced antioxidant capacity (11). Collectively, these findings suggest that ROS are not merely byproducts of allergic inflammation but act as key drivers of epithelial dysfunction, immune dysregulation, and symptom exacerbation in AR. A schematic overview of these mechanisms is illustrated in Figure 1.
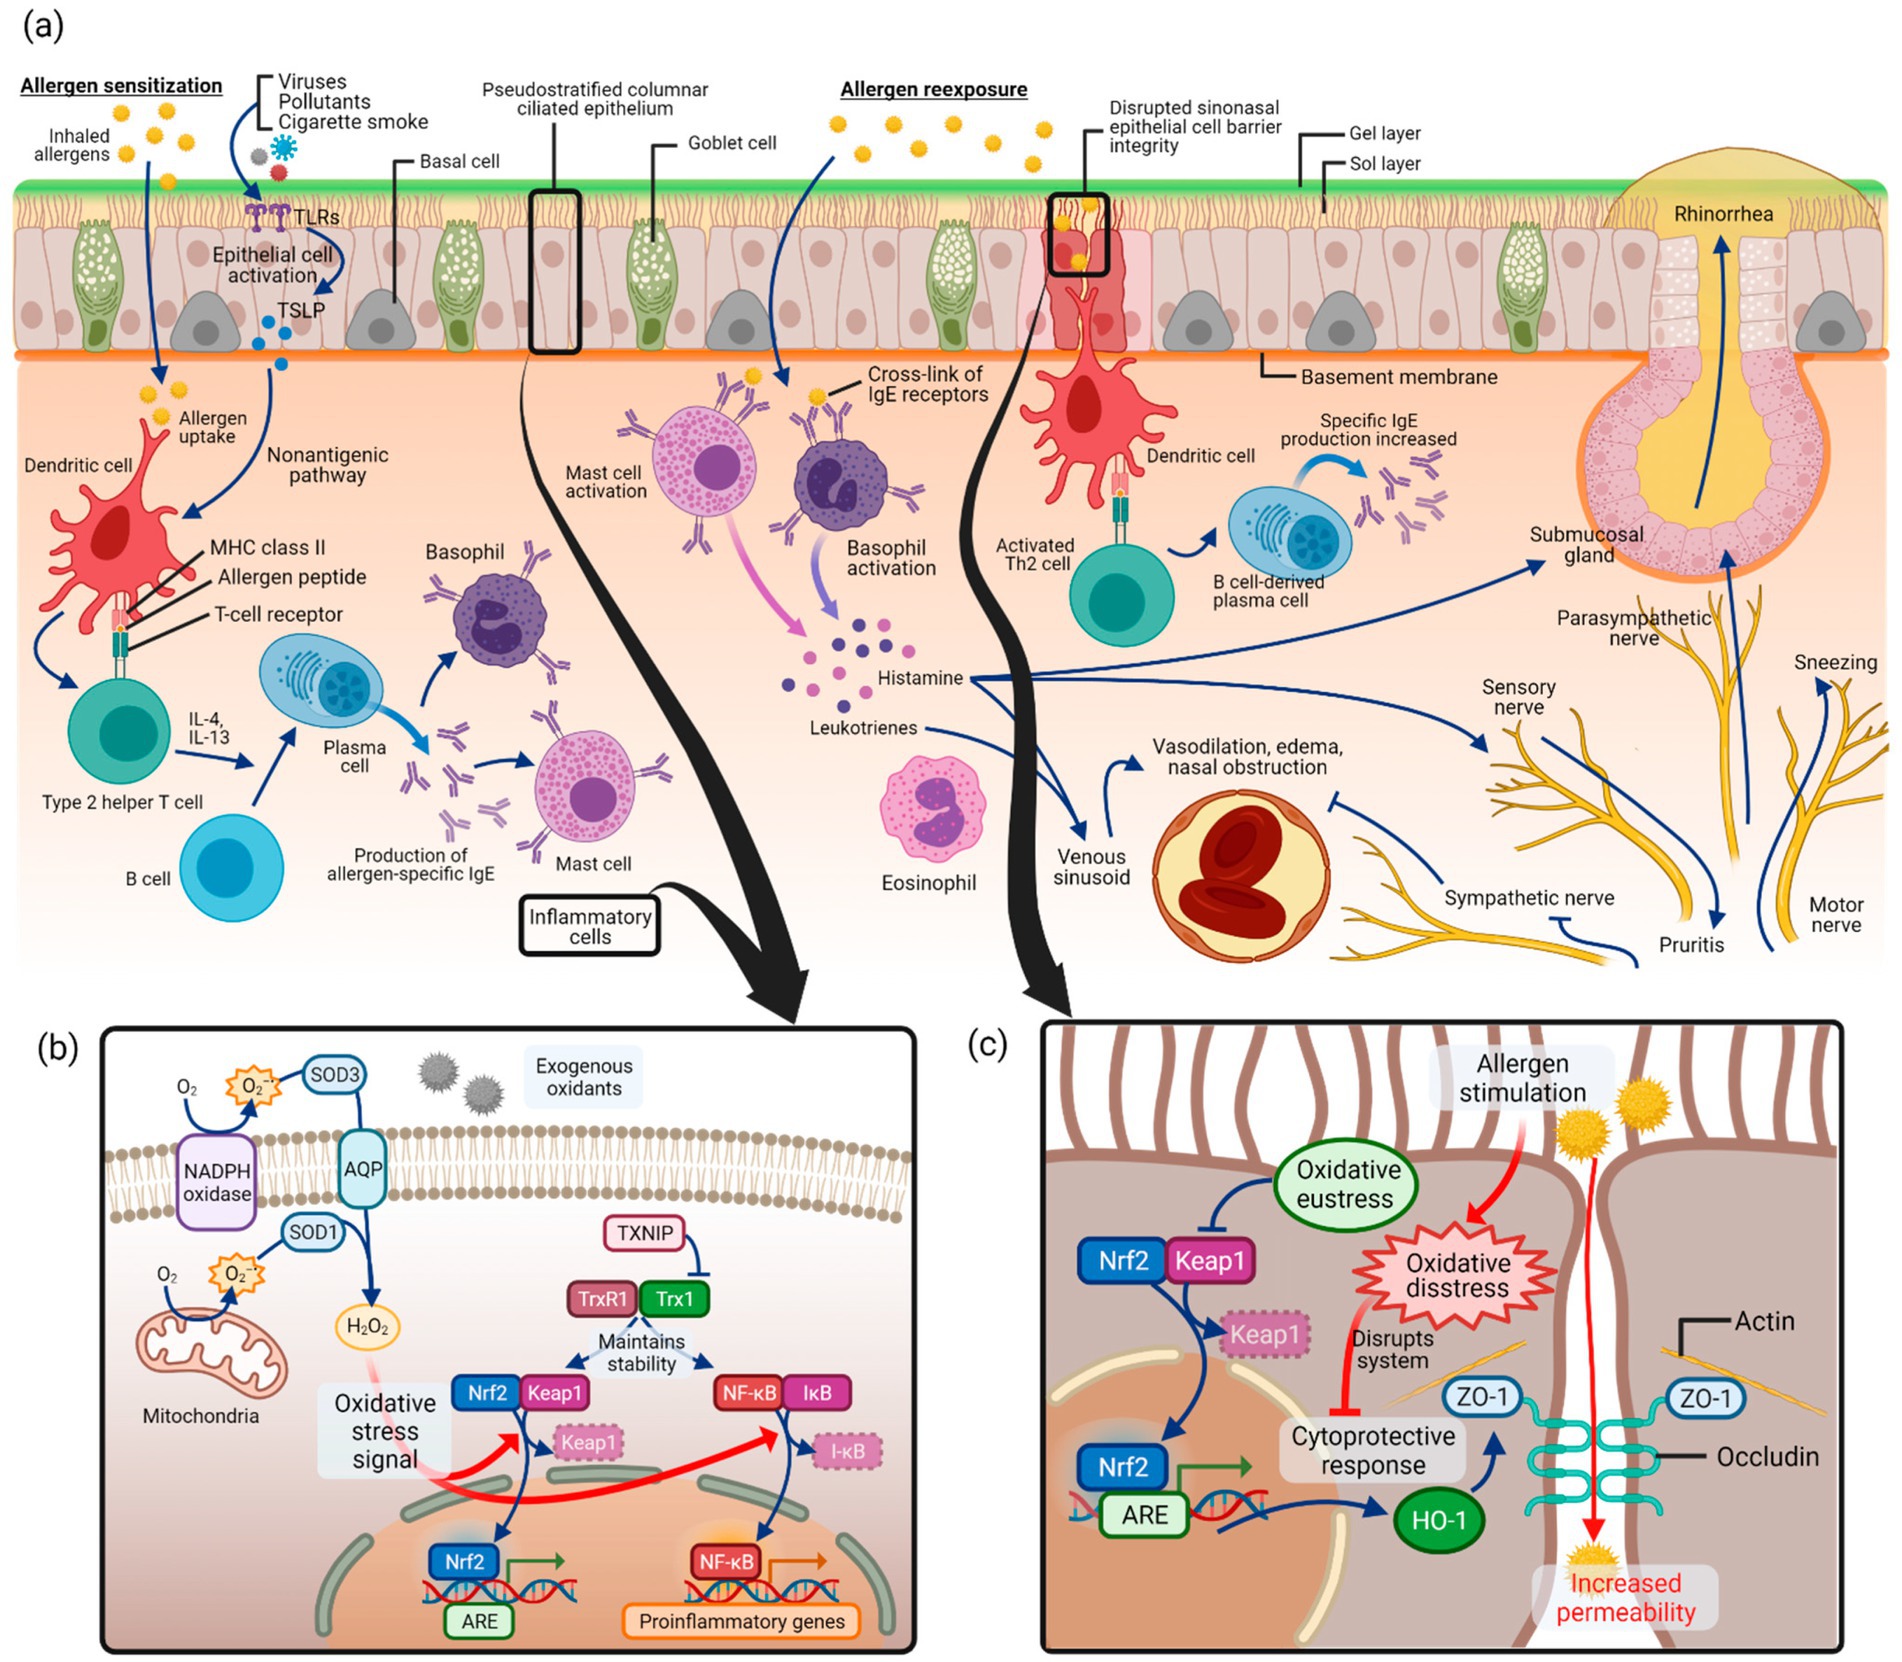
Figure 1. Proposed pathways linking oxidative stress and AR. Adapted from (11), licensed under CC BY 4.0. (a) Allergic sensitization and re-exposure trigger inflammatory responses. (b) Excessive reactive oxygen species (ROS: superoxide anion, O₂−; hydrogen peroxide, H₂O₂) activate oxidative stress signaling, particularly the NF-κB pathway, while Nrf2 mediates antioxidant defense. (c) Oxidative stress disrupts sinonasal epithelial barrier integrity, thereby enhancing allergen penetration and allergic inflammation. Created with BioRender.com.
The oxidative balance score (OBS) is a composite metric that quantifies the net balance of pro-oxidant and antioxidant exposures derived from both dietary and lifestyle factors (12, 13). A higher OBS reflects a more favorable oxidative status, potentially protective against oxidative damage and inflammation. Previous studies have linked elevated OBS with reduced risk of chronic conditions such as cardiovascular disease, metabolic syndrome, and cancer (14, 15). However, limited data are available regarding the relationship between OBS and allergic diseases such as AR. Given these gaps, we aimed to investigate the association between OBS and AR in U.S. adults using data from the 2005–2006 cycle of the National Health and Nutrition Examination Survey (NHANES).
Methods
Data source and study population
Data were derived from the NHANES, a large-scale, cross-sectional study conducted by the U.S. National Institutes of Health (NIH) and the Centers for Disease Control and Prevention (CDC), designed to assess the nutritional and health status of the U.S. population. NHANES protocols were approved by the National Center for Health Statistics (NCHS) Research Ethics Review Board, and informed consent was obtained from all participants before participation. This study utilized publicly available data from the NHANES 2005–2006 cycle. Initially, a total of 20,497 participants were included. Participants were excluded if they met any of the following criteria: (1) missing AR data; (2) incomplete data for OBS calculation; or (3) missing data on included covariates. A detailed description of the inclusion and exclusion process is provided in Figure 2.
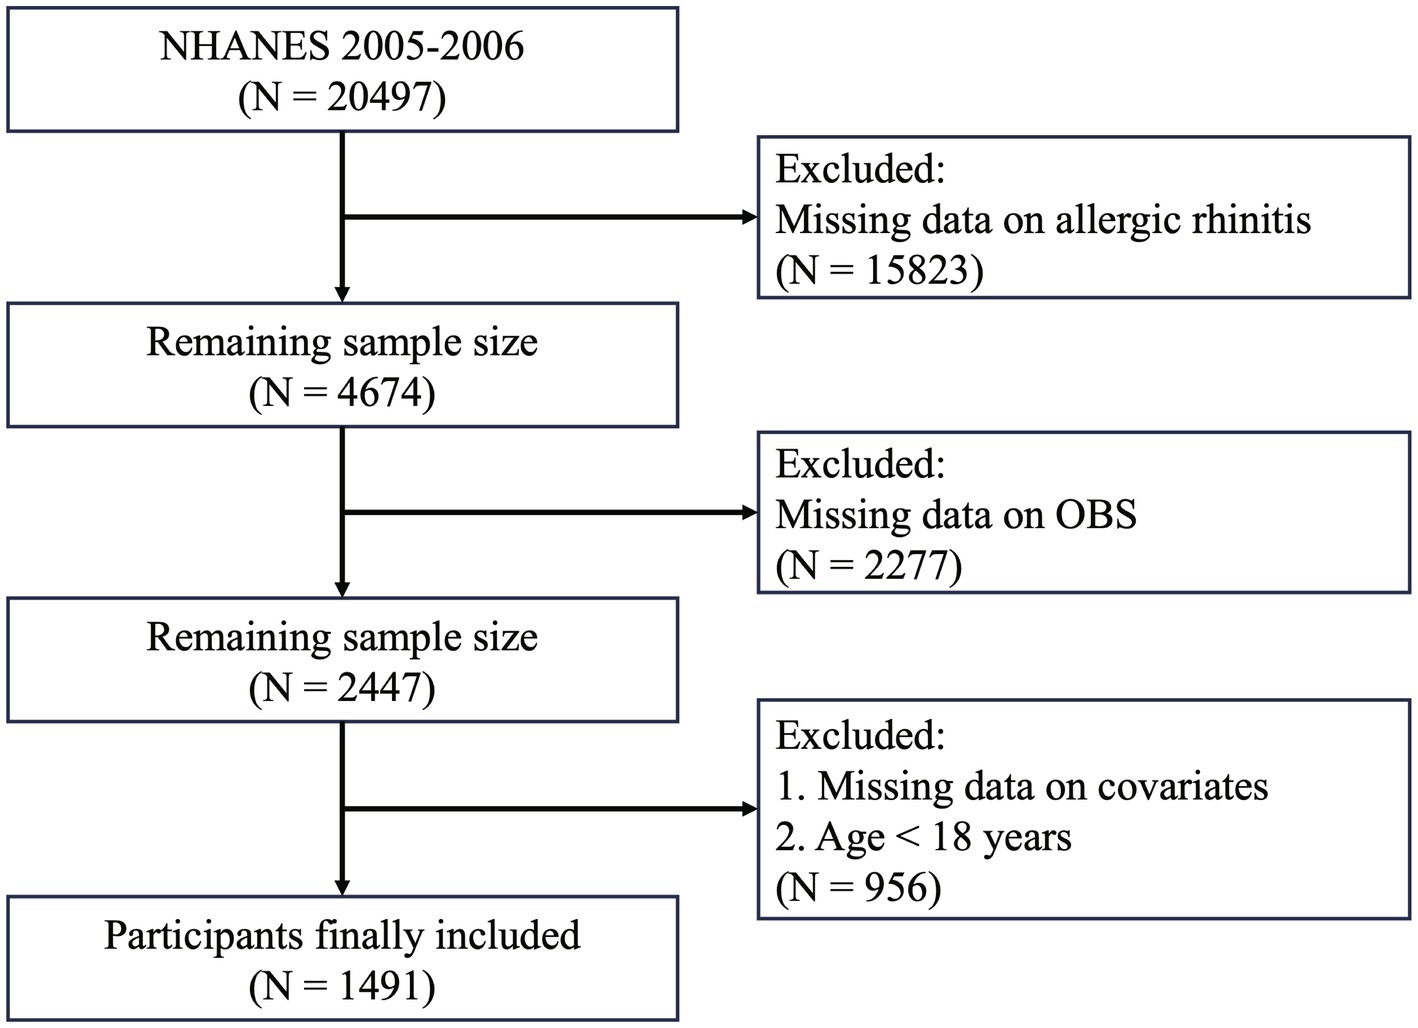
Figure 2. Participant selection flowchart.
Exposure assessment
The OBS was calculated by summing scores from 20 components, including 16 dietary and 4 lifestyle factors (13, 16). The dietary components were dietary fiber, carotene, riboflavin, niacin, vitamin B6, total folate, vitamin B12, vitamin C, vitamin E, calcium, magnesium, zinc, copper, selenium, total fat, and iron, while the four lifestyle components included physical activity, alcohol consumption, body mass index (BMI), and serum cotinine. Dietary data were obtained from the first 24-h dietary recall interview conducted in person at the Mobile Examination Center (MEC), and lifestyle information was collected through standardized questionnaires and laboratory tests. Based on prior evidence, total fat, alcohol, BMI, and cotinine were considered pro-oxidants, whereas the remaining components were treated as antioxidants. Antioxidants were scored from 0 to 2 (higher values indicating more favorable exposure), while pro-oxidants were inversely scored (2 to 0) to reflect risk.
Except for BMI, all other dietary and lifestyle components were stratified by sex where appropriate, to account for differences in daily energy intake and activity patterns between men and women. BMI was the only variable for which we did not apply gender-specific cut-offs, as the WHO adult classification uses the same thresholds for both sexes. Physical activity (antioxidant) was also divided into sex-specific tertiles and scored 0/1/2 from the lowest to the highest tertile within sex. Alcohol intake (pro-oxidant) was scored according to the Dietary Guidelines for Americans, 2020–2025 (9th ed.): non-drinkers = 2 points; moderate drinking = 1 point (≤14 g/day for women; ≤28 g/day for men); heavy drinking = 0 points (>14 g/day for women; >28 g/day for men). BMI was scored using WHO adult categories with the same thresholds for both sexes: <25.0 kg/m2 = 2 points; 25.0–29.9 kg/m2 = 1 point; ≥30.0 kg/m2 = 0 points. Serum cotinine (pro-oxidant) was divided into sex-specific tertiles and inversely scored (2/1/0 from the lowest to the highest tertile within sex). The total OBS was derived by summing all component scores, with higher scores representing more favorable oxidative balance. Full scoring details are provided in Supplementary Table S1.
Ascertainment of outcomes
The diagnosis of AR was based on a combination of questionnaire data and serum allergen-specific IgE measurements. Relevant data were obtained from the 2005–2006 cycle of the NHANES, which included both allergy-related questionnaire responses and laboratory-based IgE test results for 19 specific allergens.
Two questionnaire items were used: AGQ030 (“During the past 12 months, have you had an episode of hay fever?”) and AGQ100 (“During the past 12 months, have you had a problem with sneezing, or a runny, or blocked nose when (2) did not have a cold or the flu?”). Serum-specific IgE levels were considered positive if they were ≥0.35 kU/L.
Participants were classified as having AR if they answered “yes” to either AGQ030 or AGQ100 and had a positive serum-specific IgE result. The control group included participants who answered “no” to both questions and had negative IgE results. Individuals who did not meet either criterion were excluded from the analysis (17, 18).
Ascertainment of covariates
Covariates included in the analysis were age, gender, BMI, race/ethnicity, education, poverty-income ratio (PIR), smoking status, serum total IgE antibody, serum C-reactive protein (CRP), hypertension, diabetes, and cardiovascular disease (CVD). Race/ethnicity was categorized into five groups: Mexican American, Non-Hispanic Black, Non-Hispanic White, Other Hispanic, and Other Race. Education level was divided into three categories: above high school (college graduate or higher), high school or equivalent (high school diploma or GED), and below high school (including less than 9th grade, 9–11th grade, or no diploma). Smoking status was classified into three categories: never smokers (smoked fewer than 100 cigarettes in lifetime and currently do not smoke), former smokers (smoked at least 100 cigarettes in lifetime but no longer smoke), and current smokers (smoked at least 100 cigarettes in lifetime and currently smoke every day or on some days). Dietary supplement use was obtained from self-reported questionnaires, while total energy was assessed at the MEC using 24-h dietary recall interviews. Hypertension was defined by self-reported physician diagnosis, elevated average blood pressure (systolic ≥130 mmHg and/or diastolic ≥85 mmHg), or current use of antihypertensive medication. Diabetes was defined based on any of the following: fasting plasma glucose ≥7.0 mmol/L (126 mg/dL), 2-h oral glucose tolerance test (OGTT) result ≥11.1 mmol/L (200 mg/dL), hemoglobin A1c (HbA1c) ≥6.5%, or current use of insulin or oral hypoglycemic medications. CVD was defined using responses to the medical condition’s questionnaire. Participants were classified as having CVD if they reported ever being diagnosed by a physician with any of the following: coronary heart disease, congestive heart failure, stroke, myocardial infarction, or angina.
Statistical analyses
Continuous variables were summarized as means with standard deviations (SD), and categorical variables as frequencies and percentages. The OBS was examined in three ways: per unit increase, per 1-SD increase, and as a quartile-based categorical variable, and all forms were applied in the models to evaluate its association with AR.
To assess the robustness and national representativeness of our finding, additional weighted analyses were performed in line with NHANES analytic guidelines. These accounted for the complex survey design by incorporating the 2-year MEC examination weight (WTMEC2YR), strata (SDMVSTRA), and primary sampling units (SDMVPSU). Baseline differences between groups after applying survey weights were assessed using standardized mean differences (SMDs).
Three multivariable logistic regression models were constructed. Model 1 was unadjusted. Model 2 was adjusted for age, sex, and race/ethnicity. Model 3 included additional adjustments for education level, PIR, serum CRP, smoking status, dietary supplement, total energy, hypertension, diabetes, and CVD. Multicollinearity was assessed using the variance inflation factor (VIF). Dose–response relationships were explored using restricted cubic spline (RCS) models based on Model 3, with knot placement optimized via Akaike information criterion (AIC). If nonlinearity was detected, associations on either side of the inflection point were estimated separately.
Subgroup analyses and interaction tests were conducted to explore effect modification across different population strata. To address the issue of multiple comparisons, the Benjamini–Hochberg method was applied to control the false discovery rate (FDR). To evaluate the robustness of the results, four sensitivity analyses were conducted. First, participants with asthma were excluded. Second, considering the potential associations between dietary supplement use and participants’ dietary habits or behaviors, participants who reported dietary supplement use were excluded. Third, dietary components of the OBS were energy-adjusted using the residual method based on total energy intake estimated from the first 24-h dietary recall interview conducted in person at the MEC. Fourth, alternative definitions of AR were applied, including defining AR as the presence of any sIgE ≥0.35 kU/L, and using a higher cutoff of ≥0.7 kU/L for sIgE.
All statistical tests were two-sided, with p-values <0.05 considered statistically significant. All analyses were performed using R software (version 4.5.0).
Results
Baseline characteristics
Among the 1,491 participants, 513 were classified as having AR, and 978 as controls. Table 1 presents the baseline characteristics of the study population stratified by AR status. Compared with the control group, participants with AR were significantly younger. There were no significant differences in gender distribution, BMI, serum CRP levels, or the prevalence of diabetes, hypertension, and CVD between the two groups. However, race/ethnicity, education level, PIR, and smoking status differed significantly between groups. Serum total IgE levels were markedly higher in the AR group. Participants with AR also exhibited significantly higher total and dietary OBS, whereas lifestyle OBS did not differ between groups. In addition, the AR group reported higher total energy intake and a greater prevalence of dietary supplement use. After weighting, the differences between groups in gender, BMI, PIR, serum CRP, hypertension, and diabetes were minimal (all SMD <0.1). Detailed results are presented in Supplementary Table S2.
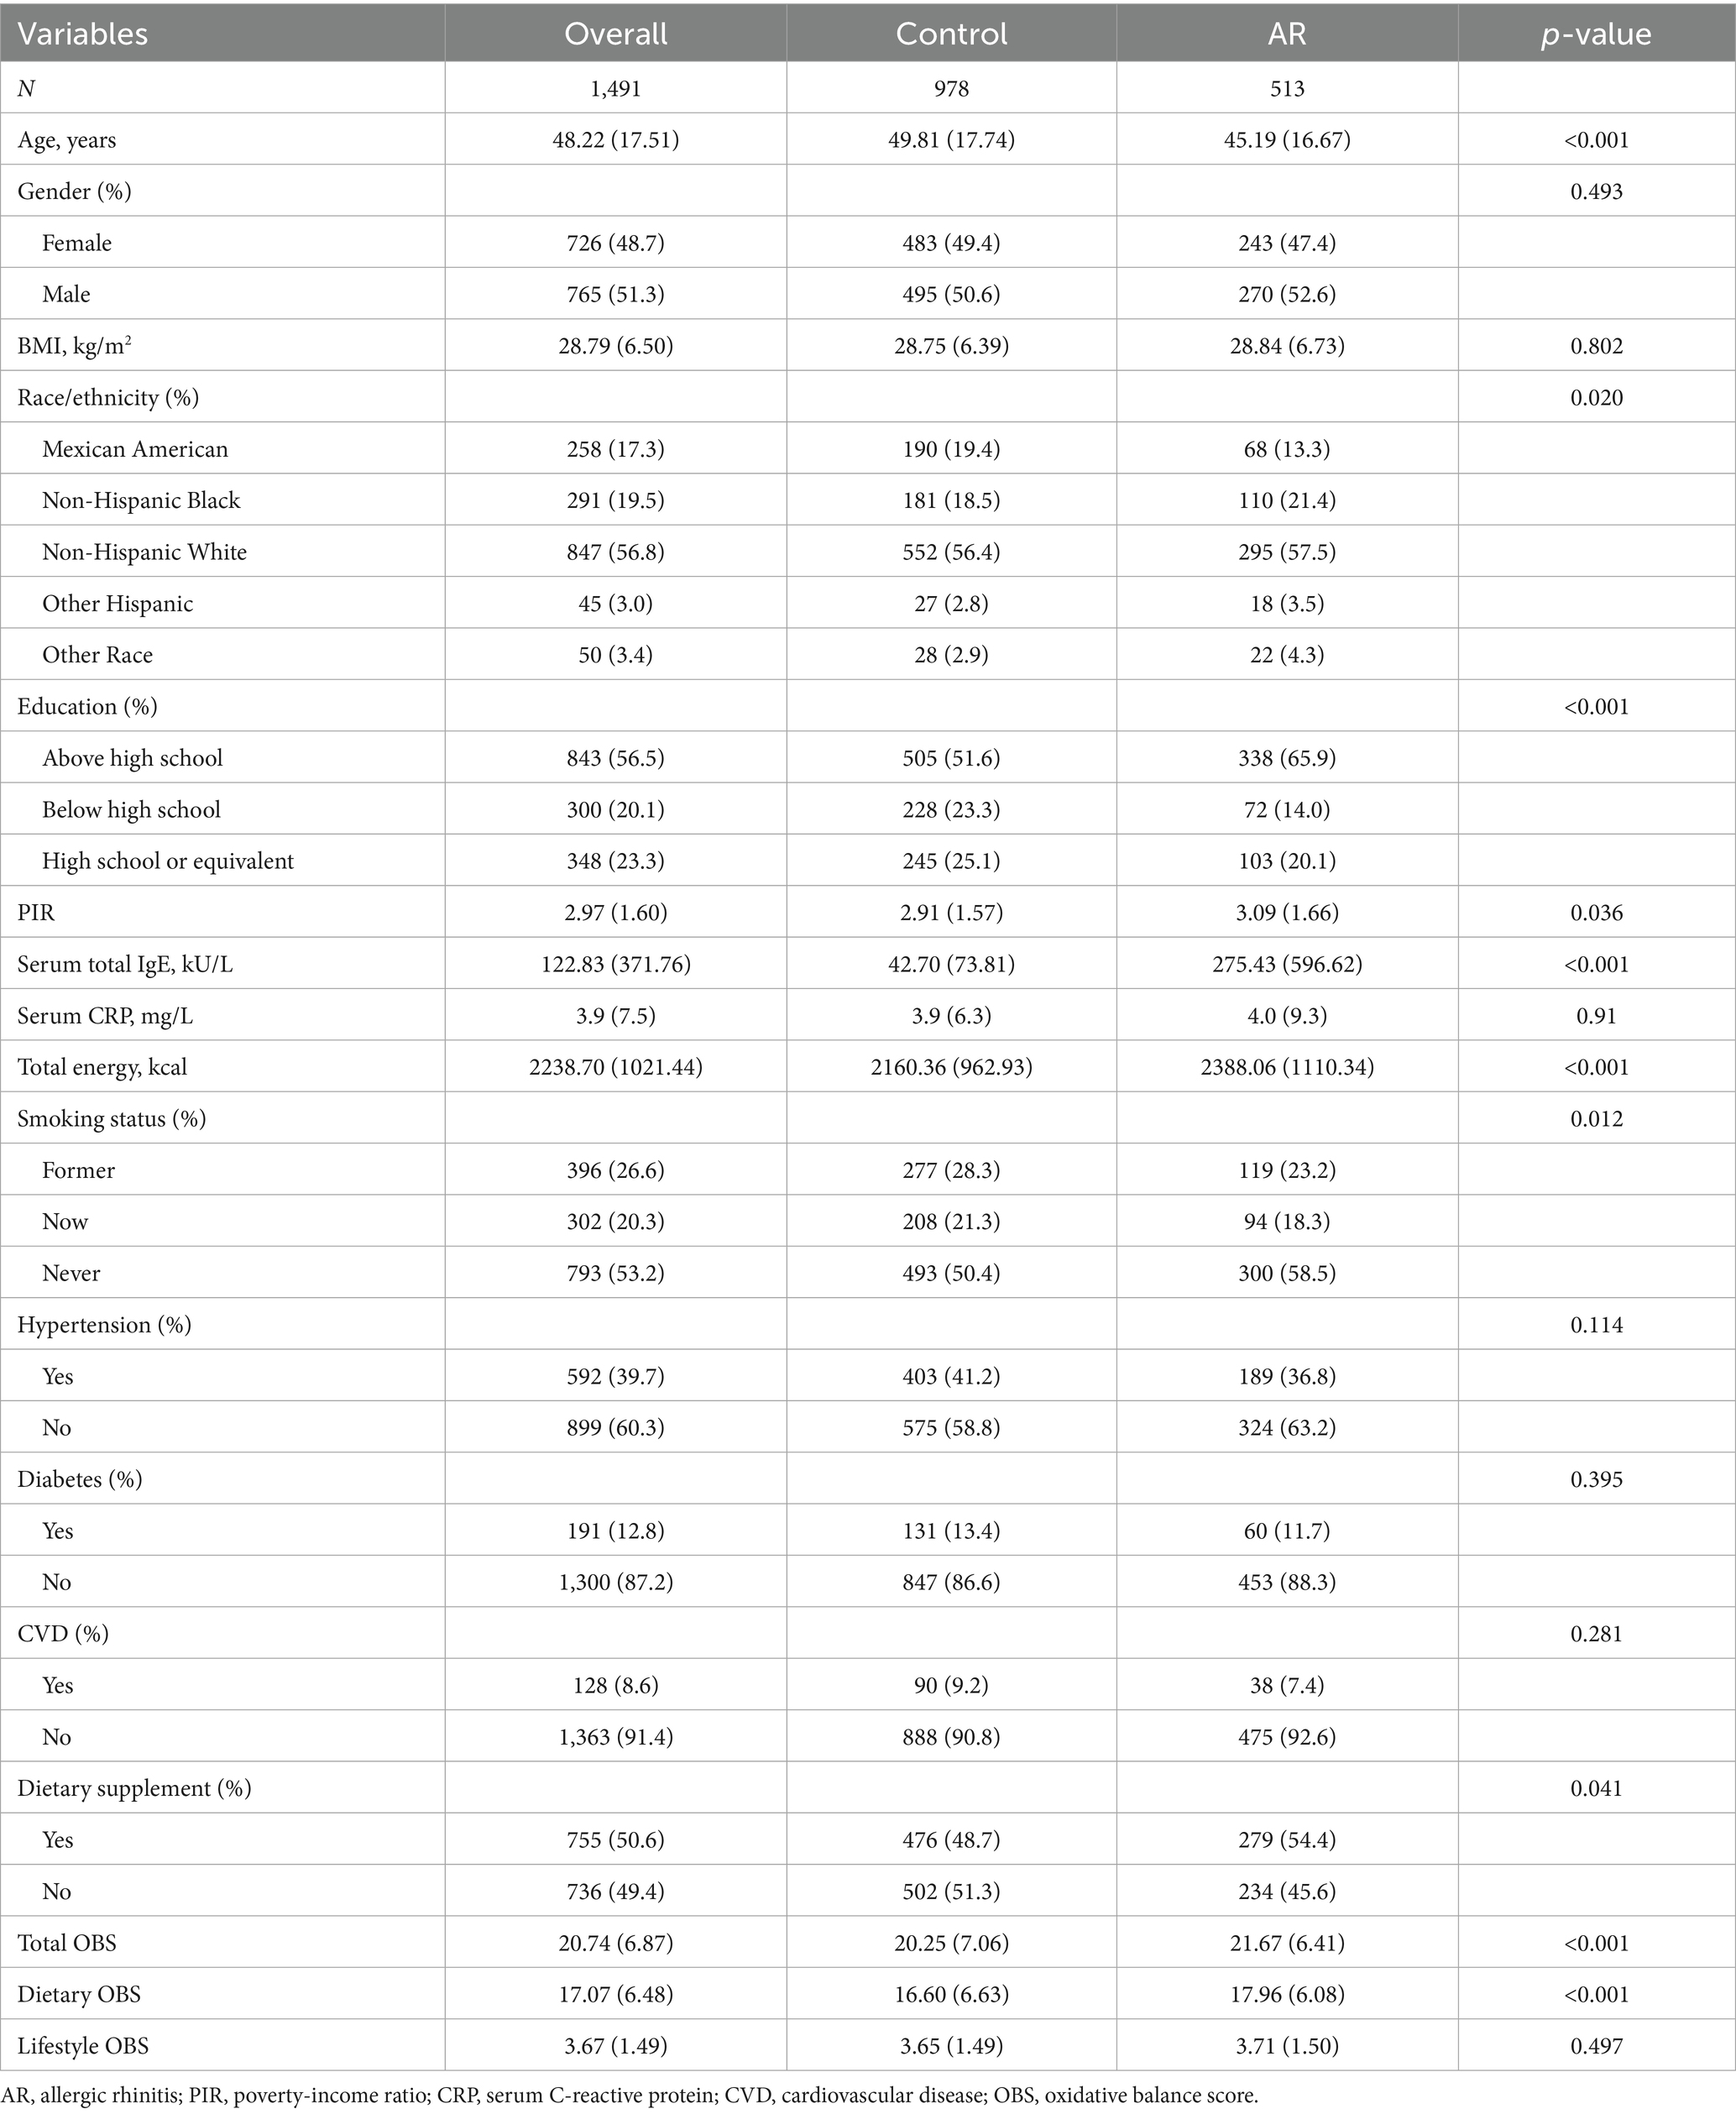
Table 1. Baseline characteristics of study participants stratified by AR status.
Association between OBS and allergic rhinitis
VIF analysis revealed no evidence of multicollinearity, with all VIF values below 5 (Supplementary Table S3). Table 2 shows the associations between OBS and AR across three logistic regression models.
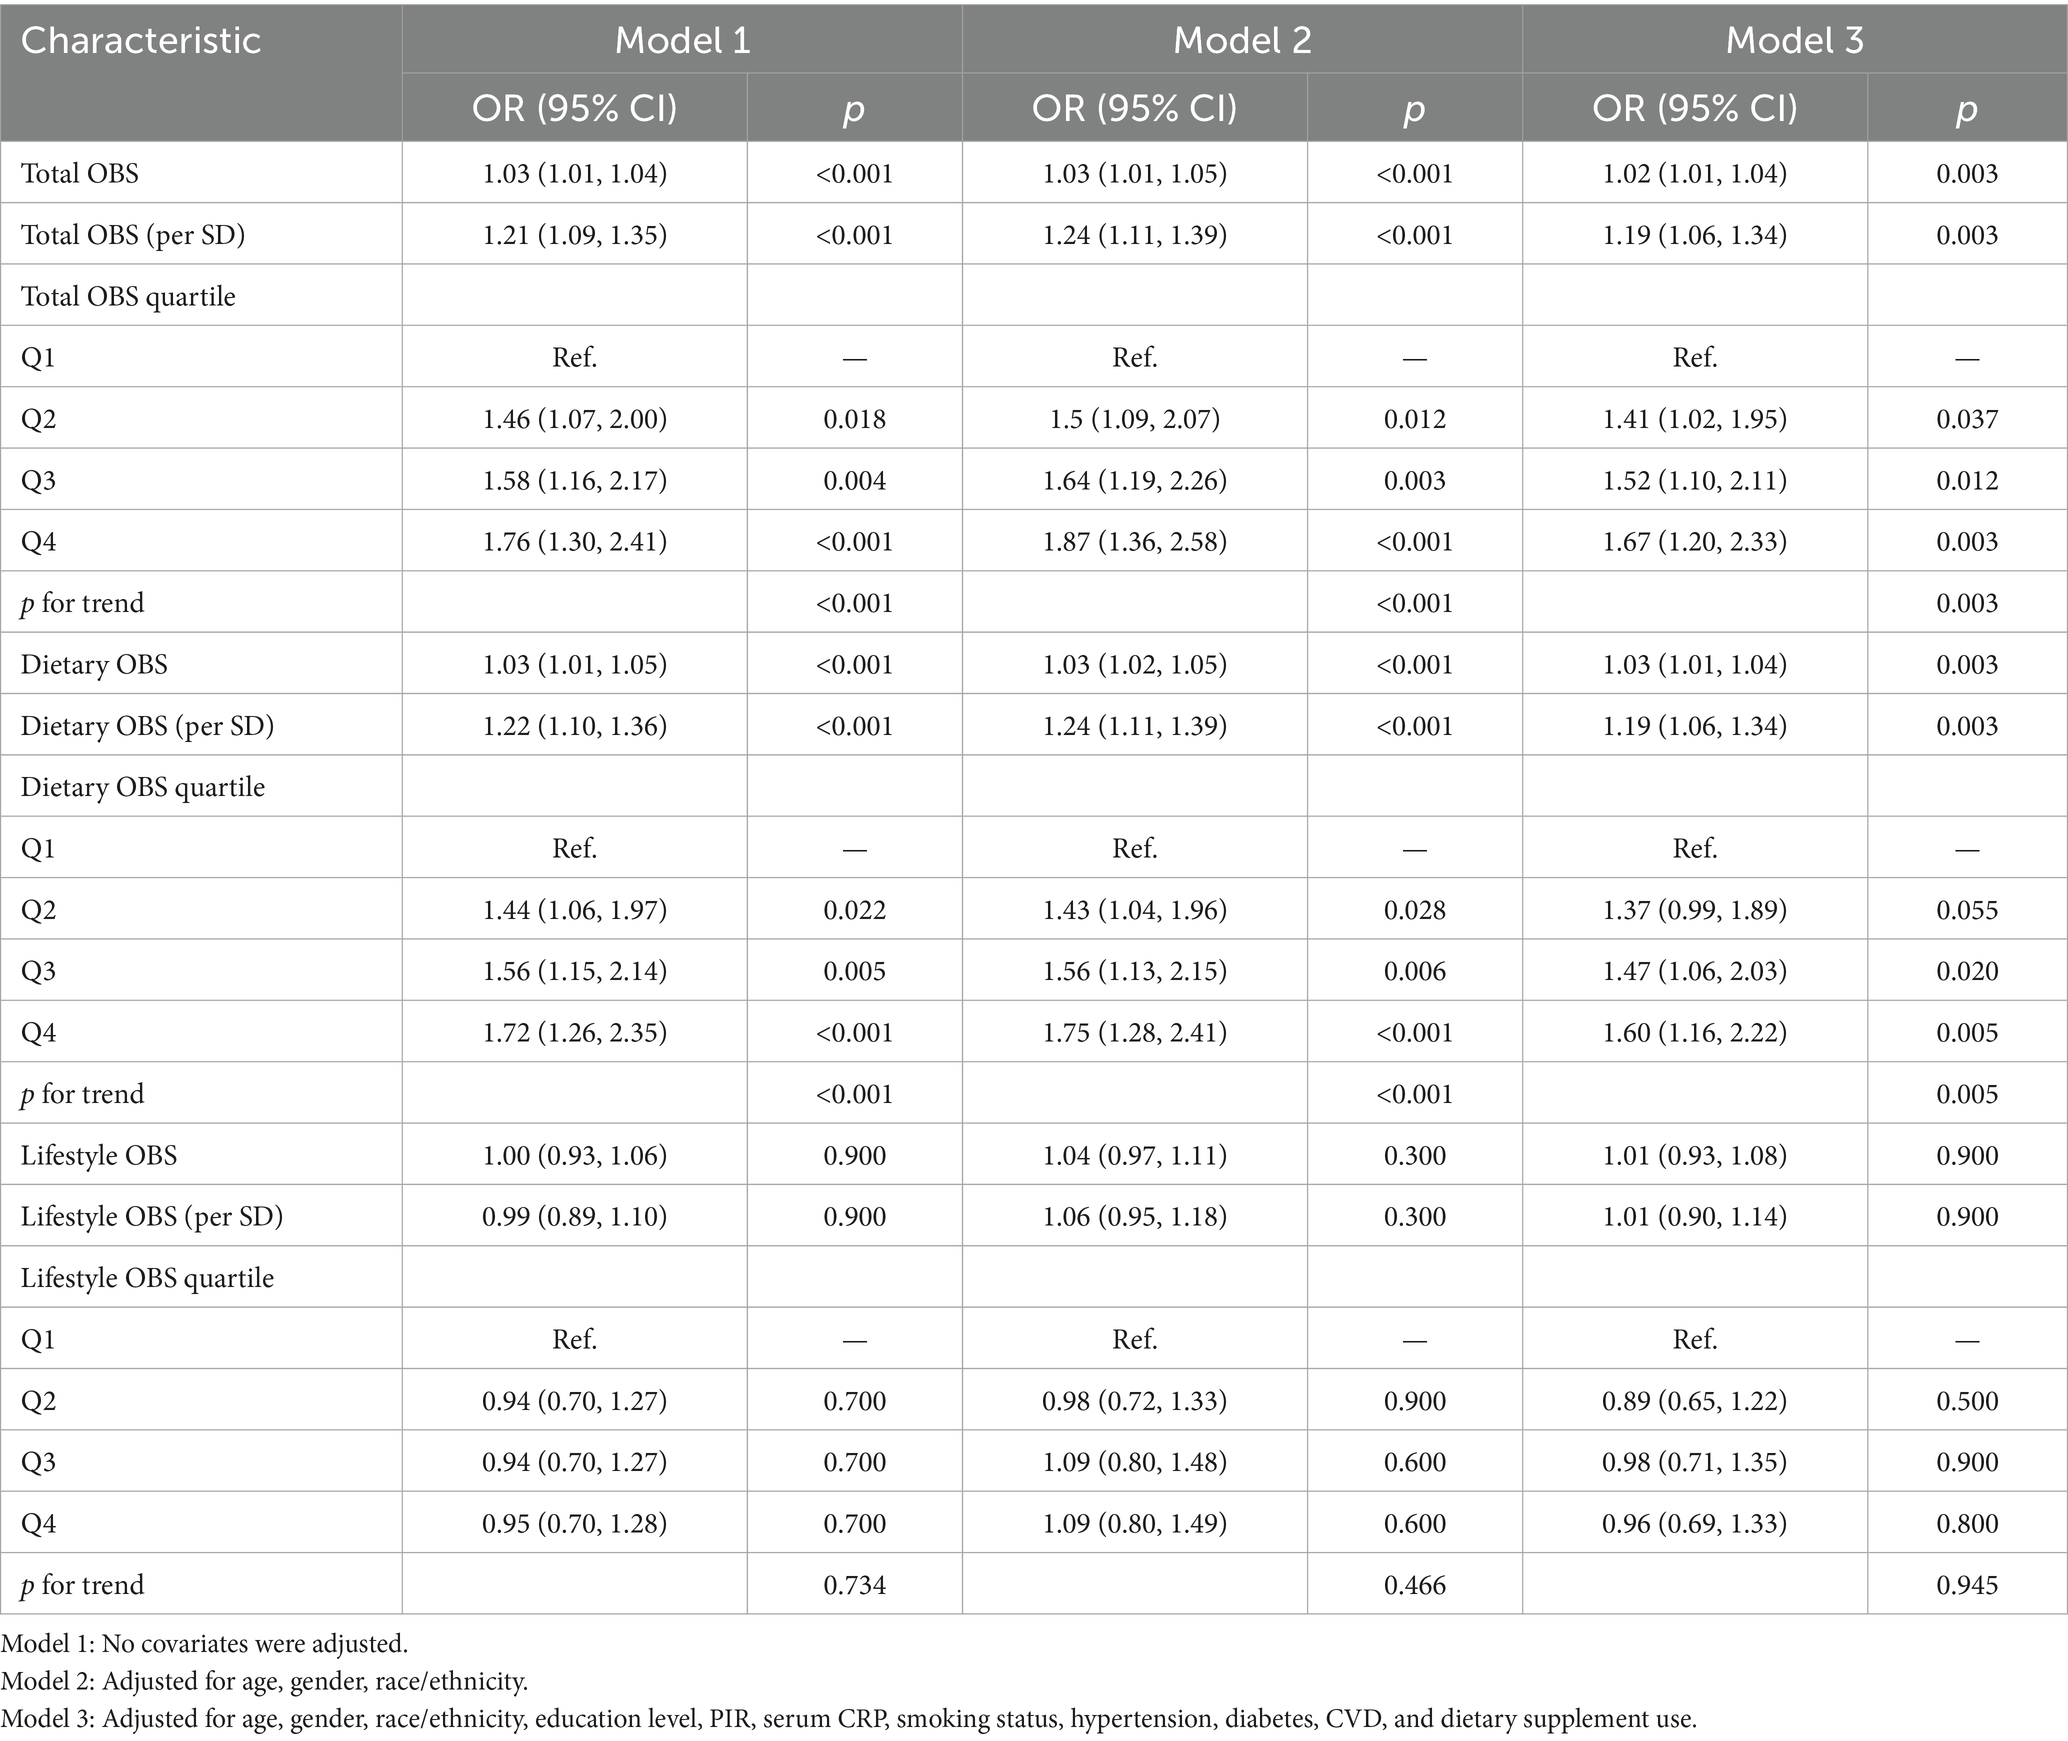
Table 2. Association between total, dietary, and lifestyle OBS and AR.
For total OBS, significant positive associations with AR were consistently observed. In the fully adjusted Model 3, each unit increase in total OBS was associated with a 2% higher likelihood of AR (OR = 1.02; 95% CI: 1.01, 1.04; p = 0.003). When expressed per SD increase, total OBS was associated with a 19% higher likelihood of AR (OR = 1.19; 95% CI: 1.06, 1.34; p = 0.003). Quartile-based analysis indicated a dose–response relationship, with participants in the highest OBS quartile (Q4) having significantly increased odds of AR compared to the lowest quartile (Q1) (OR = 1.67; 95% CI: 1.20, 2.33; p = 0.003). The trend across quartiles was statistically significant (p for trend = 0.003). Dietary OBS demonstrated a similar pattern. In Model 3, each unit increase in dietary OBS corresponded to a 3% higher likelihood of AR (OR = 1.03; 95% CI: 1.01, 1.04; p = 0.003). When expressed per SD increase, dietary OBS was associated with a 19% higher likelihood of AR (OR = 1.19; 95% CI: 1.06, 1.34; p = 0.003). Quartile analysis reinforced this association, with the highest dietary OBS quartile showing increased odds (OR = 1.60; 95% CI: 1.16, 2.22; p = 0.005) and a significant trend (p for trend = 0.005). Lifestyle OBS did not show significant associations with AR in either unit (OR = 1.01; 95% CI: 0.93–1.08; p = 0.900), per SD (OR = 1.01; 95% CI: 0.90–1.14; p = 0.900), or quartile analyses (all p > 0.05). RCS analyses (Figure 3) revealed significant linear relationships between OBS and AR, including total OBS (p for overall = 0.006) and dietary OBS (p for overall = 0.001).
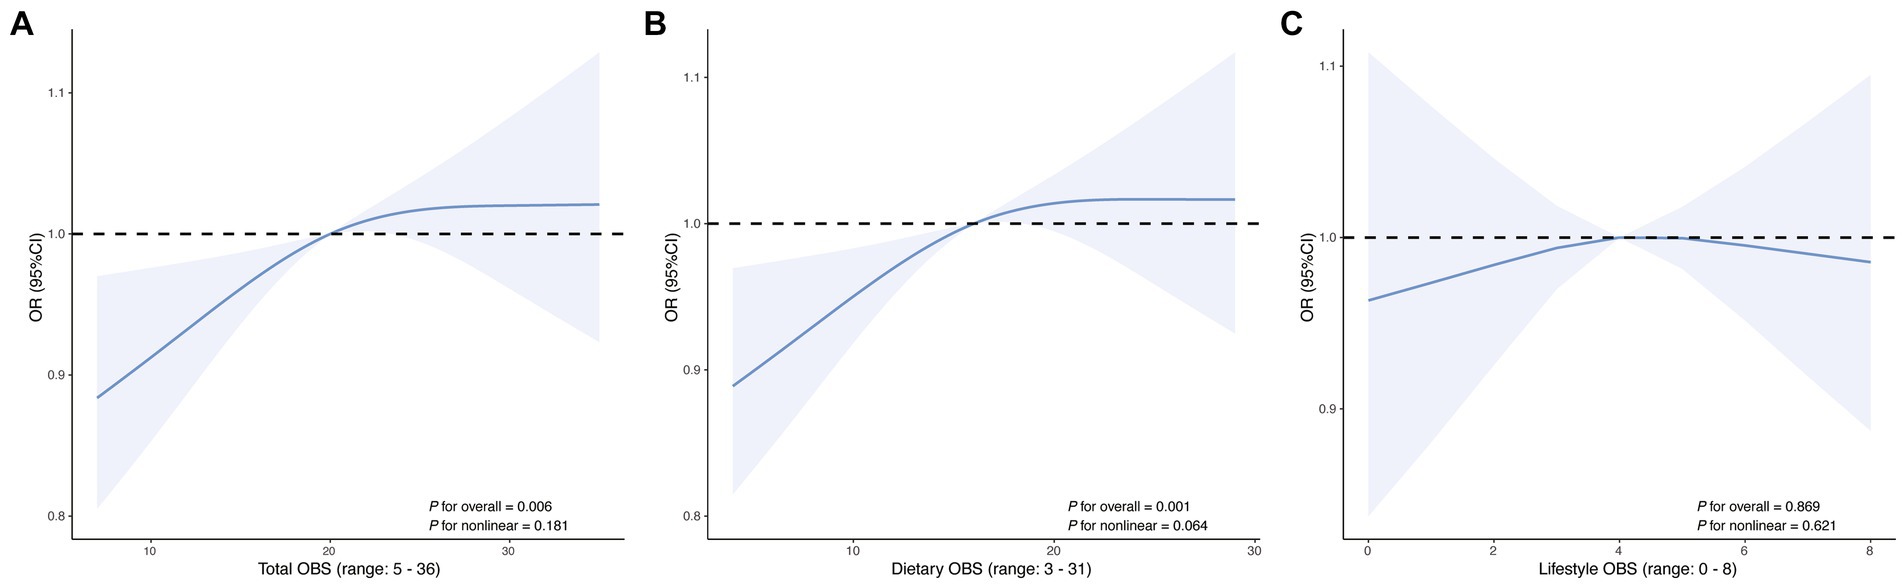
Figure 3. Restricted cubic spline curves showing the association of (A) total OBS, (B) dietary OBS, and (C) lifestyle OBS with AR. The solid line represents the estimated OR, and the shaded area indicates the 95% CI. The x-axis displays the observed range of each OBS score.
For total OBS, significant positive associations with AR were also observed after applying survey weights. In the fully adjusted Model 3, each unit increase in total OBS was associated with a 2% higher likelihood of AR (OR = 1.02; 95% CI: 1.00, 1.03; p = 0.047). When expressed per SD increase, total OBS was associated with a 12% higher likelihood of AR (OR = 1.12; 95% CI: 1.00, 1.26; p = 0.047). Quartile-based analysis further supported a dose–response relationship, with participants in the highest OBS quartile (Q4) having significantly increased odds of AR compared to the lowest quartile (Q1) (OR = 1.65; 95% CI: 1.08, 2.51; p = 0.029). The trend across quartiles remained statistically significant (p for trend = 0.017). For dietary OBS and lifestyle OBS, no significant associations with AR were observed after applying survey weights. Detailed results are presented in Supplementary Table S4.
Sensitivity analysis
In sensitivity analyses, the results were largely consistent with the primary findings. First, after excluding participants with asthma, total OBS and dietary OBS were still robustly associated with AR, with clear dose–response relationships across quartiles (p for trend <0.001; Supplementary Table S5). Second, after excluding participants who reported dietary supplement use yielded comparable results, reinforcing the robustness of the associations (Supplementary Table S6). Third, dietary components of the OBS were energy-adjusted using the residual method (assignment scheme shown in Supplementary Table S7). After energy adjustment, both total and dietary OBS remained significantly associated with AR with consistent dose–response patterns, whereas lifestyle OBS showed no significant association (Supplementary Table S8). Finally, applying alternative definitions of AR (≥0.35 kU/L or ≥0.7 kU/L for sIgE positivity) did not materially change the results, and positive associations between OBS and AR were consistently observed (Supplementary Table S9).
Subgroup analyses
Exploratory subgroup analyses were performed to assess whether the association between total OBS (per SD) and AR was consistent across demographic and clinical subgroups (Figure 4). After controlling the FDR, the positive association was largely consistent across subgroups. The association appeared stronger in younger participants, males, and those with lower educational attainment. However, none of the interaction terms reached statistical significance (all p for interaction >0.05).

Figure 4. Subgroup analyses of the association between the total OBS (per SD) and AR. q-value: p-values for subgroups were adjusted for multiple comparisons using the Benjamini–Hochberg method to control the false discovery rate.
Discussion
This study, using nationally representative data from NHANES 2005–2006, demonstrated a positive association between the OBS and AR. In unweighted analyses, higher total and dietary OBS were associated with greater odds of AR when modeled as continuous and quartile-based exposures, and these associations persisted after multivariable adjustment for sociodemographic, behavioral, and clinical covariates. A monotonic dose–response pattern across quartiles was evident, and restricted cubic spline analyses supported linear relationships without evidence of nonlinearity. In survey-weighted models, the association remained for total OBS, whereas dietary and lifestyle OBS were not statistically significant. Findings were broadly consistent across prespecified sensitivity analyses (including exclusion of participants with asthma or dietary supplement use, energy adjustment of dietary components, and alternative AR definitions). In exploratory subgroup analyses, after controlling the FDR, the positive association was largely consistent across subgroups.
To our knowledge, only one prior study has examined the association between a composite oxidative balance index and AR in a general population. Hwang et al. (19) reported a positive association between oxidative balance and AR using nationally representative Korean data, providing initial epidemiological evidence linking redox status to allergic conditions. However, their research was presented as a brief research letter with limited methodological elaboration. Unlike their study, our analysis offers a more comprehensive and rigorous evaluation. We incorporated a broader set of covariates and further corroborated our findings through sensitivity strategies, including energy adjustment of dietary components via the residual method, exclusion of participants with asthma, and application of alternative AR definitions. As part of this process, we also evaluated a symptom-only definition; after applying exclusion criteria, the retained sample yielded estimates consistent with the primary analysis. More broadly, the direction of association was preserved across alternative definitions (symptom-only, sIgE-only, and varying sIgE thresholds), although definition-specific differences in sensitivity and specificity should be considered when extrapolating these results to other populations. These methodological enhancements strengthen the robustness and generalizability of our findings and provide deeper insights into the complex relationship between oxidative balance and AR.
Although oxidative stress has long been implicated in the pathophysiology of allergic diseases, prior studies have predominantly relied on individual biomarkers such as malondialdehyde or antioxidant enzymes (e.g., superoxide dismutase, glutathione peroxidase) to infer redox status (11, 20). Observational studies have reported that higher intake of dietary antioxidants such as vitamins C and E, carotenoids, and flavonoids may be inversely associated with allergic symptoms (21), while pro-oxidant exposures such as smoking and obesity are known to exacerbate airway inflammation (22, 23). While existing literature has highlighted the role of oxidative stress in allergic diseases and proposed several mechanistic pathways, most prior evidence has relied on either biochemical markers of oxidative damage or focused on individual dietary or environmental exposures. Although these studies provide important insights, they often assess oxidant or antioxidant factors in isolation, without quantitatively integrating the overall oxidative-antioxidant profile at the population level. The OBS, originally developed by Goodman et al. (24), addresses this gap by combining multiple dietary and lifestyle factors into a single, comprehensive index. Previous studies have demonstrated that higher OBS is associated with a lower risk of CVD, certain cancers, and metabolic disorders (25–28). Our findings extend the application of this composite score to allergic conditions, supporting the relevance of redox balance in immune-mediated diseases such as AR. Moreover, in sensitivity analyses we energy-adjusted the dietary components using the residual method and recalculated an energy-adjusted OBS; re-estimation under this scheme yielded concordant effect estimates and did not materially alter the inference, thereby strengthening the robustness of our main conclusion.
Although a higher OBS generally reflects a favorable oxidative-antioxidative profile, our counterintuitive finding of a positive association with AR may, at least in part, reflect behavioral and measurement factors. We speculate that reverse causation plays a role—individuals with AR may modify diet or begin supplement use after symptom onset or diagnosis, thereby increasing dietary OBS (29). Some antioxidant-rich dietary patterns may also co-occur with allergenic food exposures or other unmeasured confounders. Moreover, diet and supplement intake can change rapidly and are captured by a single 24-h recall, whereas lifestyle components—tobacco-smoke exposure (cotinine), BMI, physical activity, and alcohol—typically evolve more slowly and, across studies, show heterogeneous and often modest associations with AR (30–32); this slower timescale and heterogeneity may attenuate the composite lifestyle signal relative to diet-driven variation. Finally, reliance on a single 24 h recall introduces within-person variability and measurement error in estimating usual intake; energy adjustment can mitigate but not eliminate such error. Taken together, these considerations provide a plausible explanation for why dietary OBS showed a stronger association than lifestyle OBS and help contextualize the overall positive association observed here. Additionally, Table 1 shows higher total and dietary OBS in the AR group; this descriptive difference, directionally consistent with the model-based results, may likewise reflect reverse causation, short-term dietary variability captured by a single 24-h recall, and residual confounding.
This study has several strengths, which also represent our strategies to minimize potential bias. First, by utilizing data from the NHANES 2005–2006 cycle—a nationally representative survey of the U.S. population—and incorporating survey weights, we ensured external validity and generalizability. Second, by adjusting for a wide range of sociodemographic, behavioral, and clinical covariates, including multiple chronic diseases, we improved internal validity and helped isolate the independent association between oxidative balance and allergic rhinitis. Third, to ensure robustness, we conducted four sensitivity analyses (energy adjustment, exclusion of participants with asthma, exclusion of supplement users, and alternative AR definitions), and the consistent findings across these analyses support the stability and reliability of our results. Fourth, in exploratory subgroup analyses, we applied FDR correction for multiple testing, further enhancing robustness. Collectively, these strategies both reduce the risk of bias and highlight the methodological strengths of our study.
However, several limitations warrant attention. First, the cross-sectional design precludes causal inference, and reverse causality cannot be ruled out; individuals with AR may have modified their diet or supplement use, potentially influencing OBS. Second, the OBS does not capture all sources of oxidative stress, such as environmental pollution, aeroallergens, occupational exposures, or genetic variation in antioxidant enzymes, and NHANES lacks information on seasonality, geographic variation, and other environmental covariates that may influence both diet and AR. Third, dietary variables were derived from a single 24-h recall, which may not accurately reflect habitual intake and could introduce measurement error in OBS calculation. Fourth, although we adjusted for dietary supplement use in sensitivity analyses, residual confounding related to supplement intake and other unmeasured behaviors cannot be excluded. Lastly, while we reported associations per unit, SD, and quartiles of OBS to improve interpretability, residual confounding may still exist despite adjustment for extensive covariates.
Conclusion
In a nationally representative sample, higher oxidative balance score (OBS) was associated with greater odds of allergic rhinitis after extensive adjustment, with a monotonic dose–response; signals were stronger for dietary than lifestyle components, and persisted for total OBS in survey-weighted models. Importantly, this study provides one of the first population-based evaluations of OBS in relation to allergic rhinitis, demonstrating the utility of OBS as a composite marker in nutritional immunology. By integrating dietary and lifestyle exposures with rigorous sensitivity analyses, our findings contribute novel evidence to the field and highlight the relevance of redox balance in allergic disease epidemiology. These findings suggest diet-related redox balance is relevant to AR at the population level but may be shaped by behavior change and measurement error; they therefore do not support escalating antioxidant supplementation. Future work should establish causality using longitudinal designs that incorporate season/region and environmental exposures, integrate objective redox biomarkers, and, where feasible, test food-based interventions.
Data availability statement
The datasets generated and analyzed in the current study are available at NHANES website: https://www.cdc.govnchsnhanesindex.html.
Ethics statement
The studies involving humans were approved by the Centers for Disease Control and Prevention. The studies were conducted in accordance with the local legislation and institutional requirements. The participants provided their written informed consent to participate in this study.
Author contributions
YT: Methodology, Writing – original draft, Conceptualization. WS: Project administration, Writing – review & editing, Investigation, Visualization, Supervision. JS: Methodology, Software, Writing – original draft, Data curation.
Funding
The author(s) declare that no financial support was received for the research and/or publication of this article.
Acknowledgments
The authors thank the participants of the NHANES databases.
Conflict of interest
The authors declare that the research was conducted in the absence of any commercial or financial relationships that could be construed as a potential conflict of interest.
Generative AI statement
The authors declare that no Gen AI was used in the creation of this manuscript.
Any alternative text (alt text) provided alongside figures in this article has been generated by Frontiers with the support of artificial intelligence and reasonable efforts have been made to ensure accuracy, including review by the authors wherever possible. If you identify any issues, please contact us.
Publisher’s note
All claims expressed in this article are solely those of the authors and do not necessarily represent those of their affiliated organizations, or those of the publisher, the editors and the reviewers. Any product that may be evaluated in this article, or claim that may be made by its manufacturer, is not guaranteed or endorsed by the publisher.
Supplementary material
The Supplementary material for this article can be found online at: https://www.frontiersin.org/articles/10.3389/fnut.2025.1655316/full#supplementary-material
Abbreviations
AR, Allergic rhinitis; OBS, Oxidative balance score; NHANES, National Health and Nutrition Examination Survey; RCS, Restricted cubic spline; FDR, False discovery rate; ROS, Reactive oxygen species; NIH, National Institutes of Health; CDC, Centers for Disease Control and Prevention; NCHS, National Center for Health Statistics; BMI, Body mass index.
References
1. Wise, SK, Damask, C, Roland, LT, Ebert, C, Levy, JM, Lin, S, et al. International consensus statement on allergy and rhinology: allergic rhinitis—2023. Int Forum Allergy Rhinol. (2023) 13:293–859. doi: 10.1002/alr.23090
2. Pawankar, R. Allergic diseases and asthma: a global public health concern and a call to action. World Allergy Organ J. (2014) 7:12. doi: 10.1186/1939-4551-7-12
3. Ozdoganoglu, T, and Songu, M. The burden of allergic rhinitis and asthma. Ther Adv Respir Dis. (2012) 6:11–23. doi: 10.1177/1753465811431975
4. Brożek, JL, Bousquet, J, Agache, I, Agarwal, A, Bachert, C, Bosnic-Anticevich, S, et al. Allergic rhinitis and its impact on asthma (ARIA) guidelines-2016 revision. J Allergy Clin Immunol. (2017) 140:950–8. doi: 10.1016/j.jaci.2017.03.050
5. Bergmann, RL, Bergmann, KE, Lau-Schadensdorf, S, Luck, W, Dannemann, A, Bauer, CP, et al. Atopic diseases in infancy. The German multicenter atopy study (MAS-90). Pediatr Allergy Immunol. (1994) 5:19–25. doi: 10.1111/j.1399-3038.1994.tb00343.x
6. Borish, L. Allergic rhinitis: systemic inflammation and implications for management. J Allergy Clin Immunol. (2003) 112:1021–31. doi: 10.1016/j.jaci.2003.09.015
7. Okano, M, Fujieda, S, Gotoh, M, Kurono, Y, Matsubara, A, Ohta, N, et al. Executive summary: Japanese guidelines for allergic rhinitis 2020. Allergol Int. (2023) 72:41–53. doi: 10.1016/j.alit.2022.11.003
8. Bowler, RP, and Crapo, JD. Oxidative stress in allergic respiratory diseases. J Allergy Clin Immunol. (2002) 110:349–56. doi: 10.1067/mai.2002.126780
9. Koksal, ZG, Uysal, P, Erdogan, O, and Cevik, O. The association between allergic rhinitis and airway dysfunction and nasal endothelial damage and oxidative stress. Rhinology. (2023) 61:272–82. doi: 10.4193/Rhin22.484
10. Valko, M, Leibfritz, D, Moncol, J, Cronin, MT, Mazur, M, and Telser, J. Free radicals and antioxidants in normal physiological functions and human disease. Int J Biochem Cell Biol. (2007) 39:44–84. doi: 10.1016/j.biocel.2006.07.001
11. Han, M, Lee, D, Lee, SH, and Kim, TH. Oxidative stress and antioxidant pathway in allergic rhinitis. Antioxidants. (2021) 10:1266. doi: 10.3390/antiox10081266
12. Kong, SY, Goodman, M, Judd, S, Bostick, RM, Flanders, WD, and McClellan, W. Oxidative balance score as predictor of all-cause, cancer, and noncancer mortality in a biracial US cohort. Ann Epidemiol. (2015) 25:256–262.e1. doi: 10.1016/j.annepidem.2015.01.004
13. Hernández-Ruiz, Á, García-Villanova, B, Guerra-Hernández, EJ, Carrión-García, CJ, Amiano, P, Sánchez, MJ, et al. Oxidative balance scores (OBSs) integrating nutrient, food and lifestyle dimensions: development of the NutrientL-OBS and FoodL-OBS. Antioxidants. (2022) 11:300. doi: 10.3390/antiox11020300
14. Jin, D, Lv, T, Chen, S, Chen, Y, Zhang, C, Wang, X, et al. Association between oxidative balance score and 10-year atherosclerotic cardiovascular disease risk: results from the NHANES database. Front Nutr. (2024) 11:1422946. doi: 10.3389/fnut.2024.1422946
15. Lu, Y, Wang, M, Bao, J, Chen, D, and Jiang, H. Association between oxidative balance score and metabolic syndrome and its components in US adults: a cross-sectional study from NHANES 2011-2018. Front Nutr. (2024) 11:1375060. doi: 10.3389/fnut.2024.1375060
16. Zhang, W, Peng, SF, Chen, L, Chen, HM, Cheng, XE, and Tang, YH. Association between the oxidative balance score and telomere length from the National Health and Nutrition Examination Survey 1999–2002. Oxid Med Cell Longev. (2022) 2022:1345071. doi: 10.1155/2022/1345071
17. Shen, H, Liao, J, Zhang, L, Li, P, Jiang, L, Guo, T, et al. Association between the dietary inflammatory index and allergic rhinitis results from the National Health and Nutrition Examination Survey (2005–2006). J Health Popul Nutr. (2025) 44:179. doi: 10.1186/s41043-025-00932-0
18. He, Y, Xu, Y, and Lin, Z. Association between alcohol consumption and allergic rhinitis in US adults. Front Nutr. (2025) 12:1544889. doi: 10.3389/fnut.2025.1544889
19. Hwang, IC, and Ahn, HY. Oxidative balance in subjects with allergic rhinitis: a nationwide cross-sectional survey. Clin Exp Allergy. (2022) 52:1347–50. doi: 10.1111/cea.14218
20. Frijhoff, J, Winyard, PG, Zarkovic, N, Davies, SS, Stocker, R, Cheng, D, et al. Clinical relevance of biomarkers of oxidative stress. Antioxid Redox Signal. (2015) 23:1144–70. doi: 10.1089/ars.2015.6317
21. Zhang, P. The role of diet and nutrition in allergic diseases. Nutrients. (2023) 15:3683. doi: 10.3390/nu15173683
22. Albano, GD, Gagliardo, RP, Montalbano, AM, and Profita, M. Overview of the mechanisms of oxidative stress: impact in inflammation of the airway diseases. Antioxidants. (2022) 11:2237. doi: 10.3390/antiox11112237
23. Manna, P, and Jain, SK. Obesity, oxidative stress, adipose tissue dysfunction, and the associated health risks: causes and therapeutic strategies. Metab Syndr Relat Disord. (2015) 13:423–44. doi: 10.1089/met.2015.0095
24. Goodman, M, Bostick, RM, Dash, C, Flanders, WD, and Mandel, JS. Hypothesis: oxidative stress score as a combined measure of pro-oxidant and antioxidant exposures. Ann Epidemiol. (2007) 17:394–9. doi: 10.1016/j.annepidem.2007.01.034
25. Chen, K, Li, S, Xie, Z, Liu, Y, Li, Y, Mai, J, et al. Association between oxidative balance score, systemic inflammatory response index, and cardiovascular disease risk: a cross-sectional analysis based on NHANES 2007–2018 data. Front Nutr. (2024) 11:1374992. doi: 10.3389/fnut.2024.1374992
26. Gao, Q, Zhu, X, Chen, M, Xia, R, and Zhang, Q. Association between oxidative balance score and all-cause and cancer-specific mortality among cancer survivors. Front Immunol. (2025) 16:1541675. doi: 10.3389/fimmu.2025.1541675
27. Xu, Z, Liu, D, Zhai, Y, Tang, Y, Jiang, L, Li, L, et al. Association between the oxidative balance score and all-cause and cardiovascular mortality in patients with diabetes and prediabetes. Redox Biol. (2024) 76:103327. doi: 10.1016/j.redox.2024.103327
28. Li, J, Liu, Y, Li, J, Feng, Z, Bai, L, Feng, Y, et al. Association between the oxidative balance score with metabolic syndrome traits in US adults. Diabetol Metab Syndr. (2024) 16:263. doi: 10.1186/s13098-024-01500-y
29. Pokladnikova, J, Park, AL, Draessler, J, Lukacisinova, A, and Krcmova, I. The use of complementary and alternative medicine by adults with allergies: a Czech national representative survey. BMC Complement Med Ther. (2021) 21:171. doi: 10.1186/s12906-021-03316-z
30. Saulyte, J, Regueira, C, Montes-Martínez, A, Khudyakov, P, and Takkouche, B. Active or passive exposure to tobacco smoking and allergic rhinitis, allergic dermatitis, and food allergy in adults and children: a systematic review and meta-analysis. PLoS Med. (2014) 11:e1001611. doi: 10.1371/journal.pmed.1001611
31. Han, YY, Forno, E, Gogna, M, and Celedón, JC. Obesity and rhinitis in a nationwide study of children and adults in the United States. J Allergy Clin Immunol. (2016) 137:1460–5. doi: 10.1016/j.jaci.2015.12.1307
Keywords: oxidative balance score, allergic rhinitis, NHANES, diet, lifestyle
Citation: Tian Y, Sun W and Song J (2025) Association between oxidative balance score and allergic rhinitis in American adults: a cross-sectional study. Front. Nutr. 12:1655316. doi: 10.3389/fnut.2025.1655316
Edited by:
Kok Yong Chin, National University of Malaysia, MalaysiaReviewed by:
You Hoon Jeon, Hallym University Dongtan Sacred Heart Hospital, Republic of KoreaSandra Mijač, Children’s Hospital Srebrnjak, Croatia
Copyright © 2025 Tian, Sun and Song. This is an open-access article distributed under the terms of the Creative Commons Attribution License (CC BY). The use, distribution or reproduction in other forums is permitted, provided the original author(s) and the copyright owner(s) are credited and that the original publication in this journal is cited, in accordance with accepted academic practice. No use, distribution or reproduction is permitted which does not comply with these terms.
*Correspondence: Jijun Song, c29uZ2ppanVuNjhAMTYzLmNvbQ==