- 1Department of Critical Care Medicine, Seventh People's Hospital, Shanghai University of Traditional Chinese Medicine, Shanghai, China
- 2Department of Traditional Medicine, Seventh People's Hospital, Shanghai University of Traditional Chinese Medicine, Shanghai, China
Objective: The purpose of this study was to analyze changes in the disease burden caused by vitamin A deficiency (VAD) in China from 1990 to 2021, based on the Global Burden of Disease (GBD) Database, and to predict the disease burden trend in 2035 using the Bayesian age-period-cohort (BAPC) model.
Methods: Based on modeled estimates from the GBD 2021 database, this study used Joinpoint regression to calculate annual percentage change (APC) and assess long-term trends (1990–2021) in VAD burden. Disaggregated analysis quantified the contributions of population growth, population aging, and epidemiological changes. The BAPC model was used to predict incidence, prevalence, and DALYs for 2035.
Results: From 1990 to 2021, VAD incidence and prevalence significantly declined across all age groups in China, most notably in children under 5 years (−6.23% average annual change). Disability-adjusted life years (DALYs) improved substantially for children and adolescents. However, DALYs rebounded among those aged 50–74 years. Significant age and sex disparities exist. Children under 5 years bear the heaviest burden. Women have a higher incidence and prevalence than men, while DALY rates are lower in men across all age groups. While overall trends in incidence and prevalence declined, DALYs showed recent increases. Decomposition analysis revealed that favorable epidemiological shifts primarily drove the decline in incidence and prevalence. Conversely, population aging increased the number of cases and DALYs. Projections for 2035 indicate continued declines in incidence, prevalence, and DALYs across all age groups. However, the rate of decrease is projected to be slower in middle-aged and older populations compared to younger groups.
Conclusion: This study reveals the complex dynamics and shifting burden of VAD in China. It affirms past prevention successes while highlighting new challenges, particularly the increasing disease burden driven by population aging. To achieve “Healthy China 2030” goals, future strategies require a more refined, lifecycle approach focusing on vulnerable groups (children, pregnant women, and the elderly), strengthening surveillance and evaluation systems, and promoting research into pathogenesis and technological innovation to meet evolving public health needs.
Introduction
Vitamin A deficiency (VAD) is a major public health problem worldwide and poses a serious threat to human health (1). VAD not only causes stunted growth and vision loss in children but also increases the risk of infection, making it a key risk factor in the Global Burden of Disease (1, 2).
Over the past few decades, with the development of the global economy and the improvement of healthcare, the epidemic trend of vitamin A deficiency has been curbed to some extent in some parts of the world (3). However, the disease burden of vitamin A deficiency continues to show significant regional differences and imbalances globally (4). Vitamin A deficiency remains a serious public health challenge in low- and middle-income countries, particularly in sub-Saharan Africa and South Asia. Poverty, food shortages, limited access to health care, and epidemics of infectious diseases in these areas exacerbate the burden of vitamin A deficiency.
In China, with the rapid development of the economy and the continuous improvement of public health policies, the status of vitamin A deficiency has also been significantly improved. However, due to the vast geographical area, large population, and differences in development levels between regions, the distribution and disease burden of vitamin A deficiency in different regions and populations in China still have certain complexities and particularities. In recent years, although prevention and control measures for vitamin A deficiency have achieved some results, there is still a relative lack of systematic research on changes in its disease burden and future trends.
The purpose of this study was to analyze the changes in disease burden caused by vitamin A deficiency in China from 1990 to 2021, based on the Global Burden of Disease (GBD) database, and to predict the trend of disease burden in 2035 using the Bayesian age-period-cohort (BAPC) model. This study will help fill the gap in the current research on the burden of vitamin A deficiency in China, provide a basis for the development of more scientific and precise public health strategies to further reduce the adverse effects of vitamin A deficiency on population health, and inform targeted interventions to achieve the Healthy China 2030 goal.
Methods
Data sources
This study is based on the GBD 2021 database, which provides detailed epidemiological data on 371 diseases and injuries in 204 countries and territories between 1990 and 2021. The GBD 2021 database aggregates data from numerous sources, including but not limited to health surveys, medical records, and epidemiological studies conducted in each country. However, due to differences in data availability and quality in different regions, the exact estimated sample size or number of sources for each region may vary. We use standardized epidemiological analysis methods to ensure the global comparability of data. These data are freely available through the Global Health Data Exchange website (5), and detailed methods and models have been described in previous reports (6). Specifically, we extracted data on vitamin A deficiency, including incidence, prevalence, and disability-adjusted life years (DALYs). Data are accessed and downloaded through the Global Health Data Exchange (GHDx) platform.1
Important definitions
In this study, three core indicators—incidence, prevalence, and DALYs—were used to assess the disease burden of vitamin A deficiency (1). The incidence rate reflects the number of new cases of vitamin A deficiency per 100,000 population per year; prevalence indicates the proportion of existing cases in a population at a given point in time; and DALYs comprehensively quantify the years of life lost due to premature death and the years lived with disability caused by vitamin A deficiency, using the GBD standard disability weights for calculation. All indicators reported 95% uncertainty intervals (UIs) (7). This interval is an important statistical tool calculated by GBD through multiple sampling and correlation matrices when processing international data, taking into account differences in methods and missing data. It reflects global differences in data collection and processing methods, as well as the reality that data quality is affected by a variety of factors and is essential for assessing the reliability of data and comparing the results of studies. Confidence intervals are statistically determined (8) and are used to estimate the possible range of population parameters, calculated from the sample data. In the present study, we obtained incidence and prevalence data from the GBD database and used the UIs to identify uncertainties in these data to more accurately reflect the reliability of the findings.
Joinpoint regression analysis
In this study, the joinpoint regression model was used to calculate the annual average percent change (AAPC) (9) to evaluate the long-term trend of vitamin A deficiency disease burden in China from 1990 to 2021. The model identifies trend turning points through piecewise linear regression and calculates the average rate of change over time, which has the advantage of being able to objectively reflect the non-linear change characteristics of disease burden (10). Specifically, a piecewise regression model was established after natural logarithmic transformation of incidence, prevalence, and DALYs rate, and the optimal number of turning points was determined by the Monte Carlo permutation test (significance level α = 0.05), and the Bayesian information criterion was used for model selection. After identifying the annual percentage change in each period, the overall AAPC and its 95% confidence interval were calculated by weighting over the time span (11). All analyses were performed using Joinpoint Software 4.9.0.0, developed by the National Cancer Institute (12), and to ensure the robustness of the results, we performed 1,000 bootstrap sampling trials of the uncertainty intervals of the GBD data and confirmed the stability of the turning points by sensitivity analysis, excluding 5% of the data. This method has been widely used in Global Burden of Disease studies, and its effectiveness has been validated in trend analyses of similar nutritional diseases (13).
Decomposition analysis
Disaggregation analysis is the analysis of data using a robust decomposition method (14) attributing differences in incidence, deaths, and DALYs between two time points to changes in three independent factors: (a) changes in the age structure of the aging population, i.e., a shift to a larger group of older people, commonly referred to as population ageing; (b) changes in population size; and (c) changes in age-specific rates of epidemiological changes, reflecting the combined effect of all factors except age structure and population size (6). The decomposition method breaks down the changes in disease-related deaths and DALYs into factors caused by population aging (A), population growth (P), and age-specific rate changes (M). The disaggregation results include the absolute and relative contribution of each factor to disease-related deaths or changes in DALYs (15). Absolute contribution represents the number of deaths or DALYs attributable to disease, while relative contribution (i.e., “attributable ratio”) is calculated by dividing the number of attributed deaths or DALYs by the total number of deaths or DALYs in 1990 and multiplying by 100%. If the number of attributed deaths exceeds the total number of deaths in 1990, the proportion may exceed 100%.
Bayesian age-period-cohort (BAPC) analysis
In this study, a Bayesian age-period-cohort (BAPC) model was used to predict the disease burden trend of vitamin A deficiency in China in 2035 (16). The model uses a hierarchical Poisson regression framework to simultaneously estimate age, period, and birth cohort effects. In the construction of the model, we applied a second-order random walk prior to the age and cohort effects to ensure smoothness, and the period effect uses a first-order autoregressive prior to deal with the time dependence. Based on the historical data from 1990 to 2021, the posterior distribution of parameters was generated by the Markov chain Monte Carlo algorithm, and the predicted incidence rate in 2035 and its 95% confidence interval were finally output.
Results
Changes in the disease burden caused by vitamin A deficiency in China from 1990 to 2021
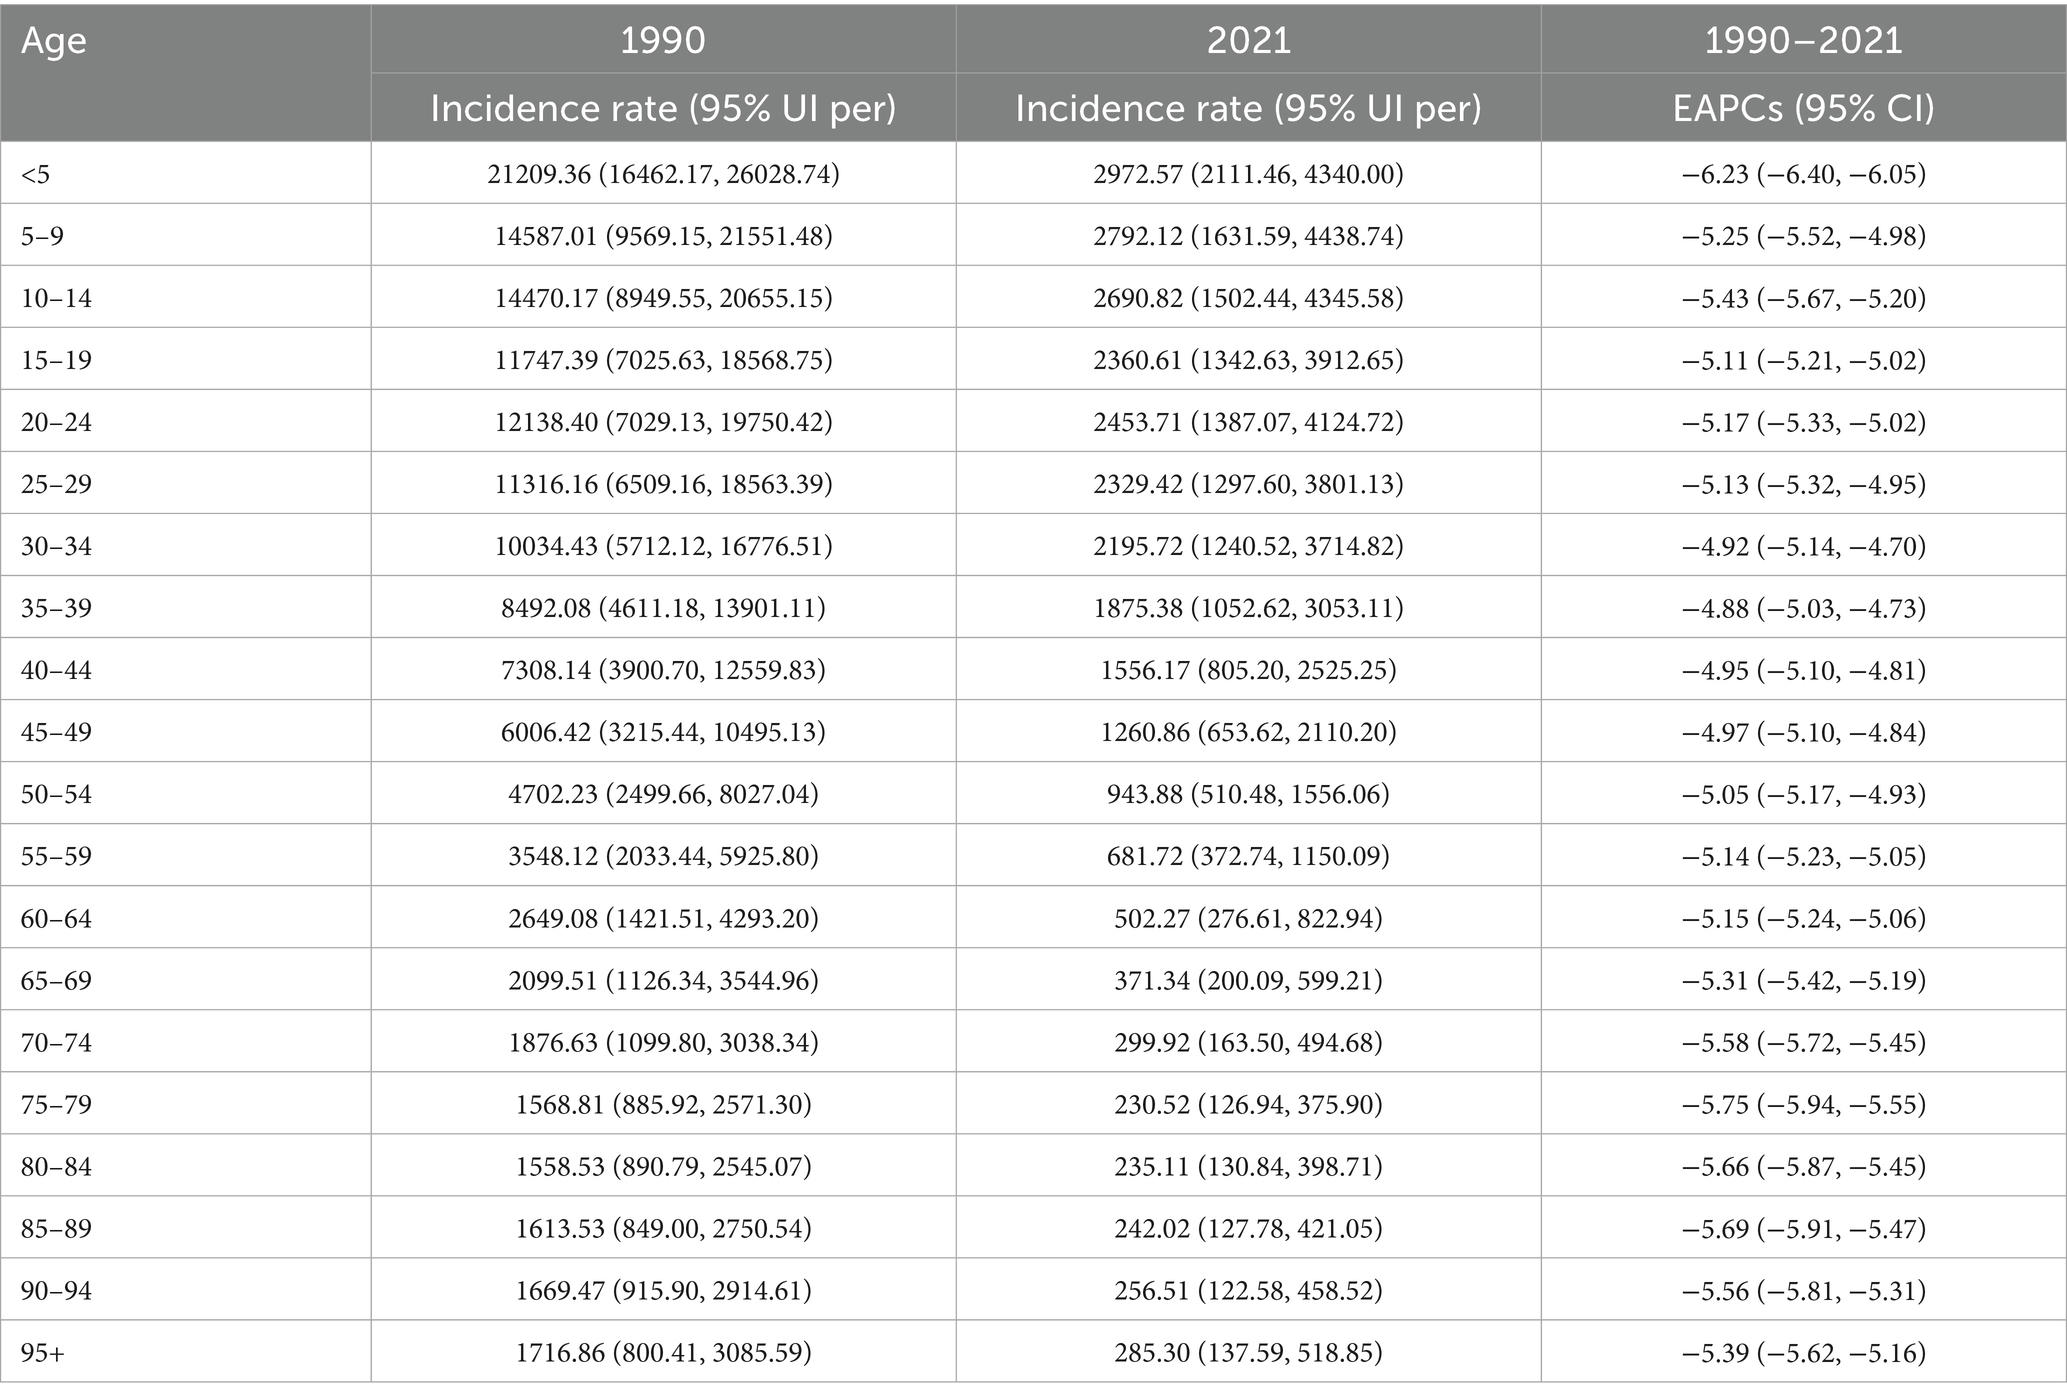
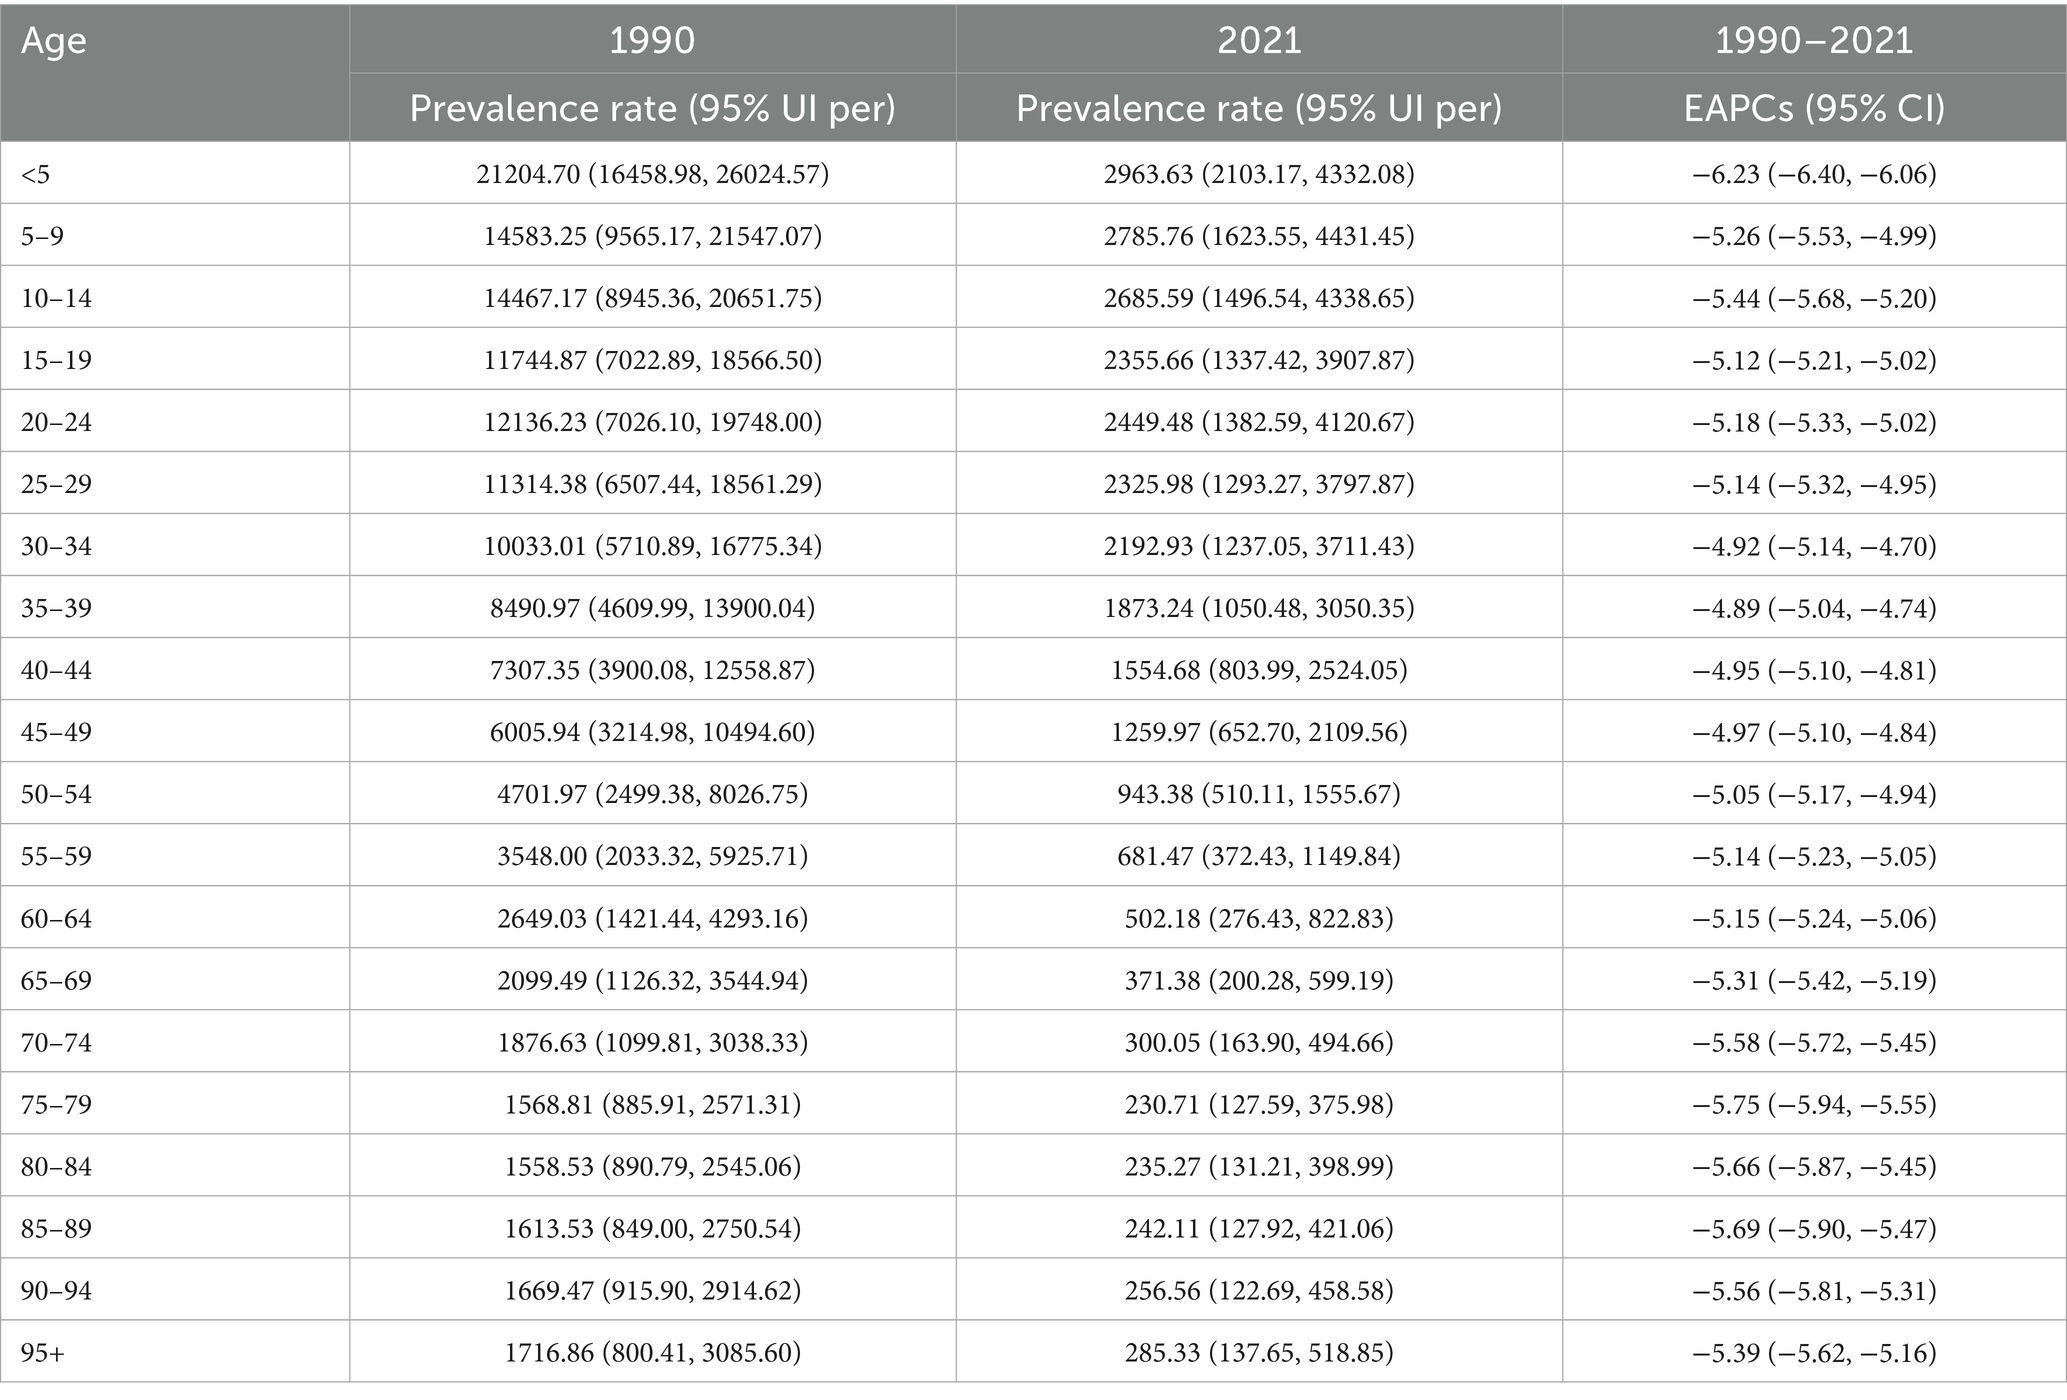
From 1990 to 2021, the incidence and prevalence of vitamin A deficiency in all age groups in China showed a significant downward trend (Tables 1, 2), with the most significant decrease in children under 5 years of age. The incidence in this population decreased from 21,209.36 cases per 100,000 people in 1990 (95% UI: 16,462.17–26,028.74) to 2,972.57 cases per 100,000 people in 2021 (95% UI: 2,111.46–4,340.00), with an EAPC of −6.23% (95% CI: −6.40 to −6.05) and a simultaneous decrease in prevalence (EAPC: −6.23%). A similar trend was observed in other age groups, such as the ≥95-year-old age group, with an incidence of EAPC of −5.39%. Despite this trend, the disease burden in the young childhood group was still significantly higher in 2021 than in the other populations (e.g., the incidence was 10.4 times higher in the <5-year-old group than in the 95 + year-old group).
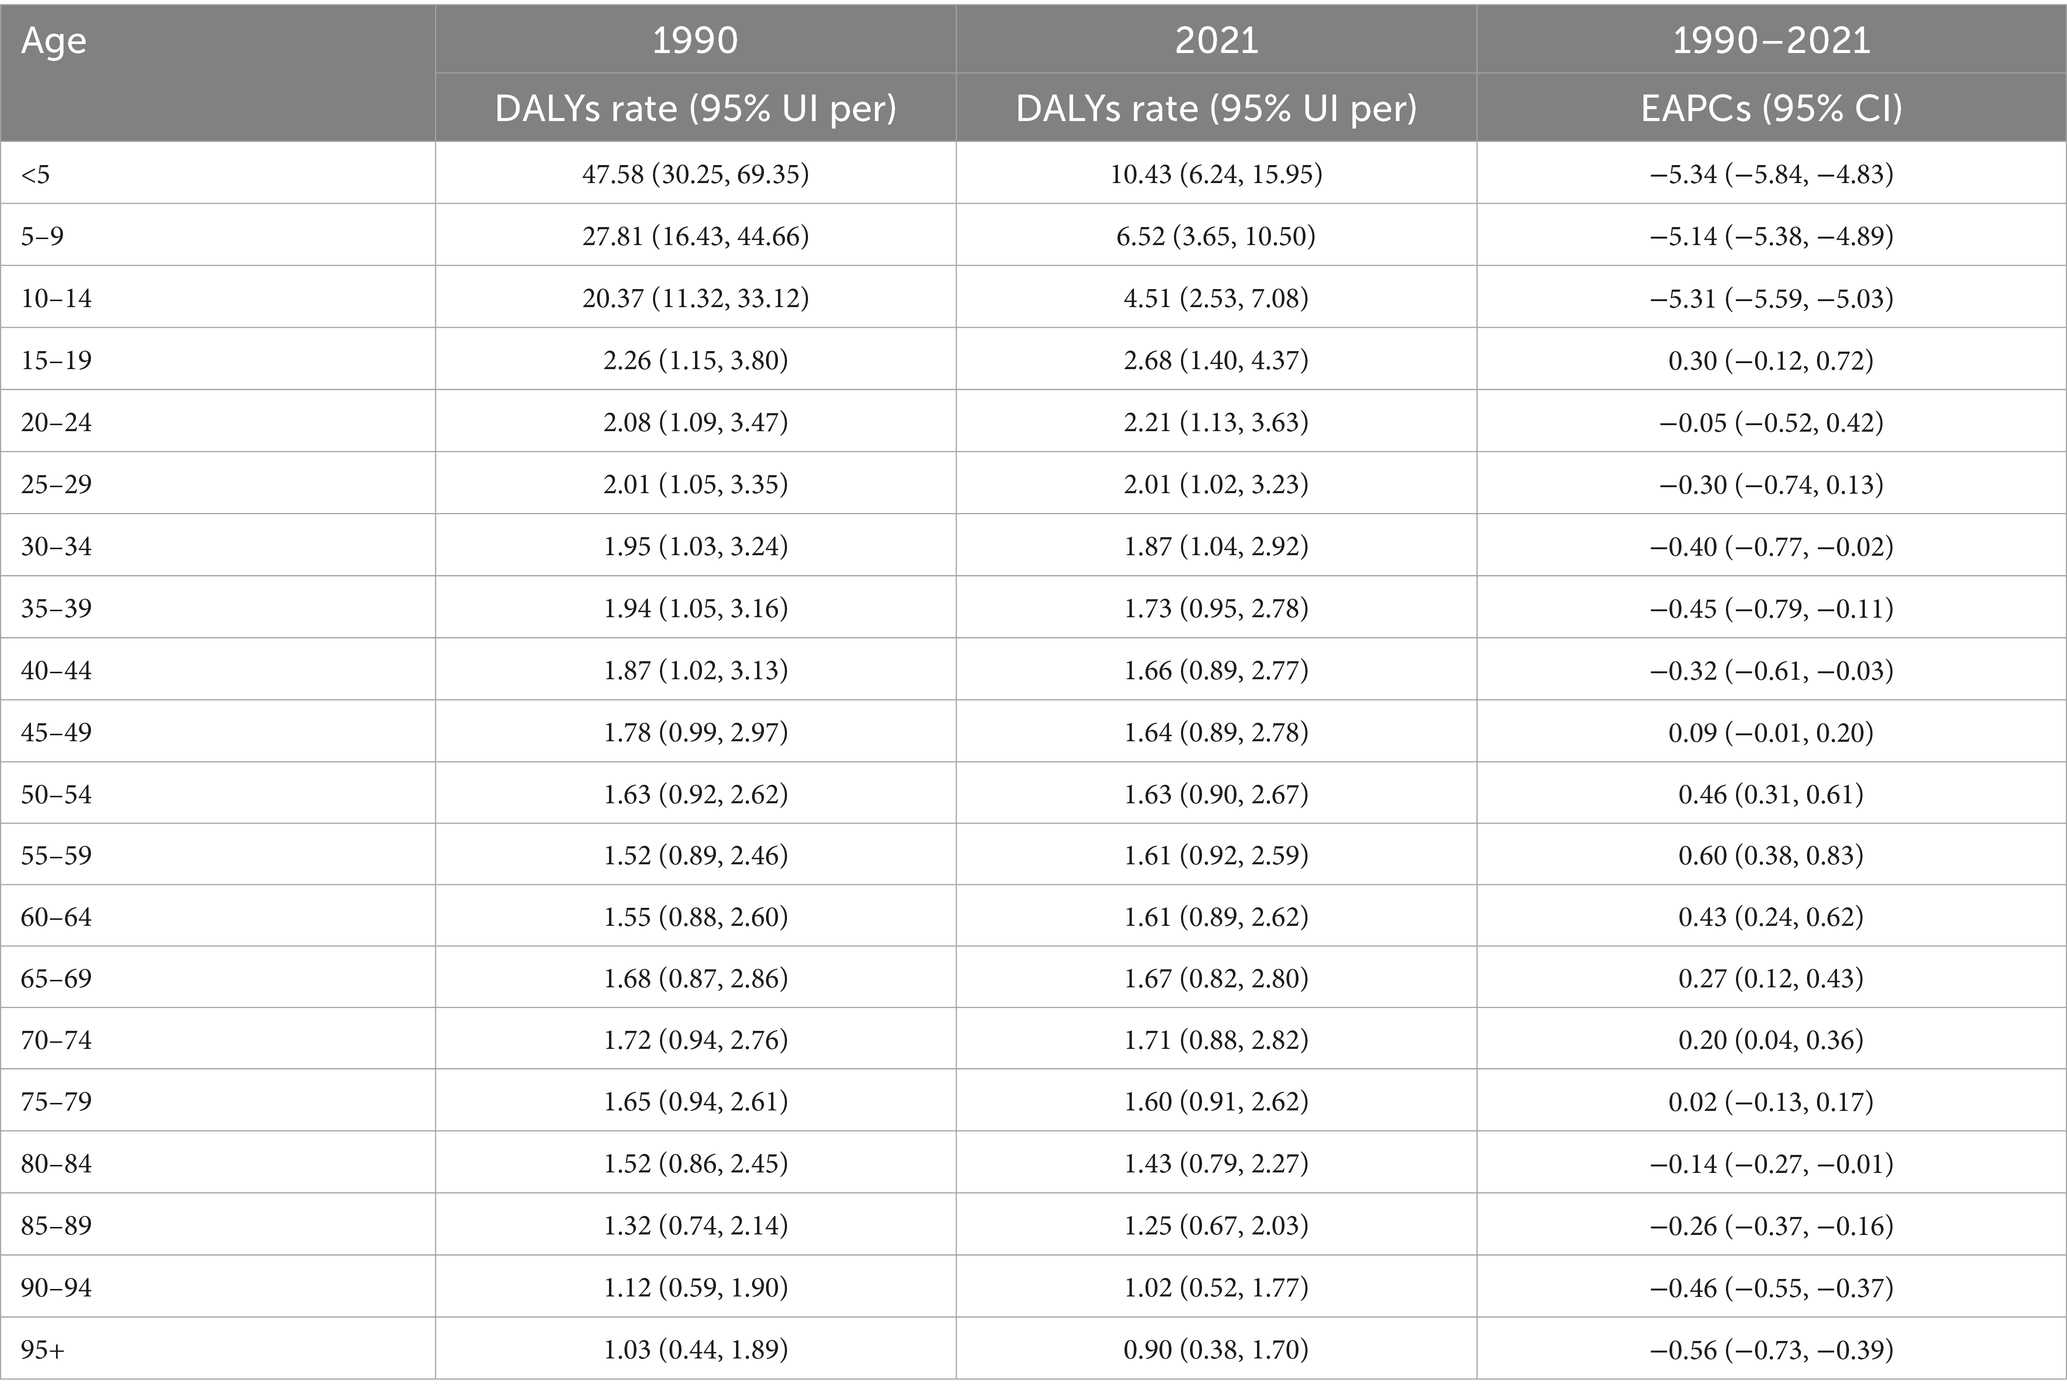
DALYs with vitamin A deficiency in China showed a clear age-specific trend (Table 3). Significant improvements were observed in the group of children and adolescents: DALYs for children under 5 years of age decreased significantly from 47.58 per 100,000 in 1990 to 10.43 per 100,000 in 2021 (EAPC: −5.34%), and the 5–19 age group showed a similar downward trend. However, in contrast, the burden of DALYs in the 50–74 age group rebounded, with the average annual growth rate in the 55–59 age group reaching 0.60% (95% CI: 0.38–0.83).
Age and gender differences in vitamin A deficiency in China, 1990–2021
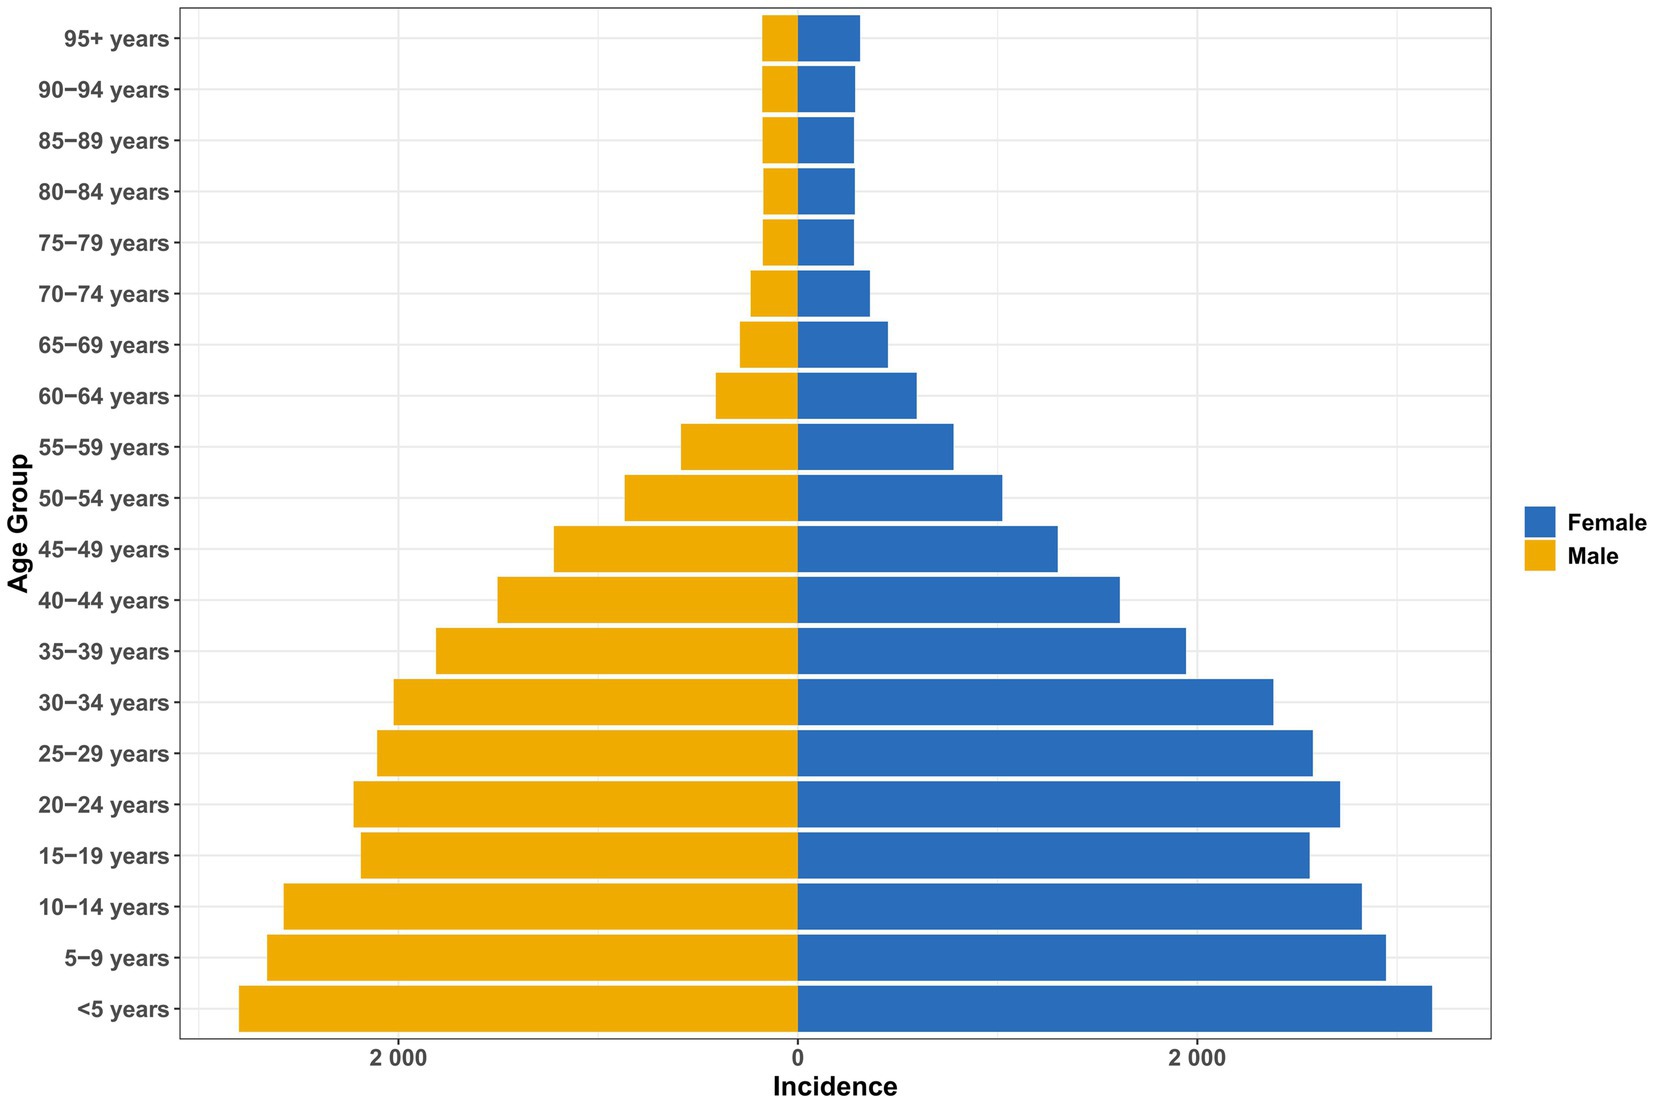
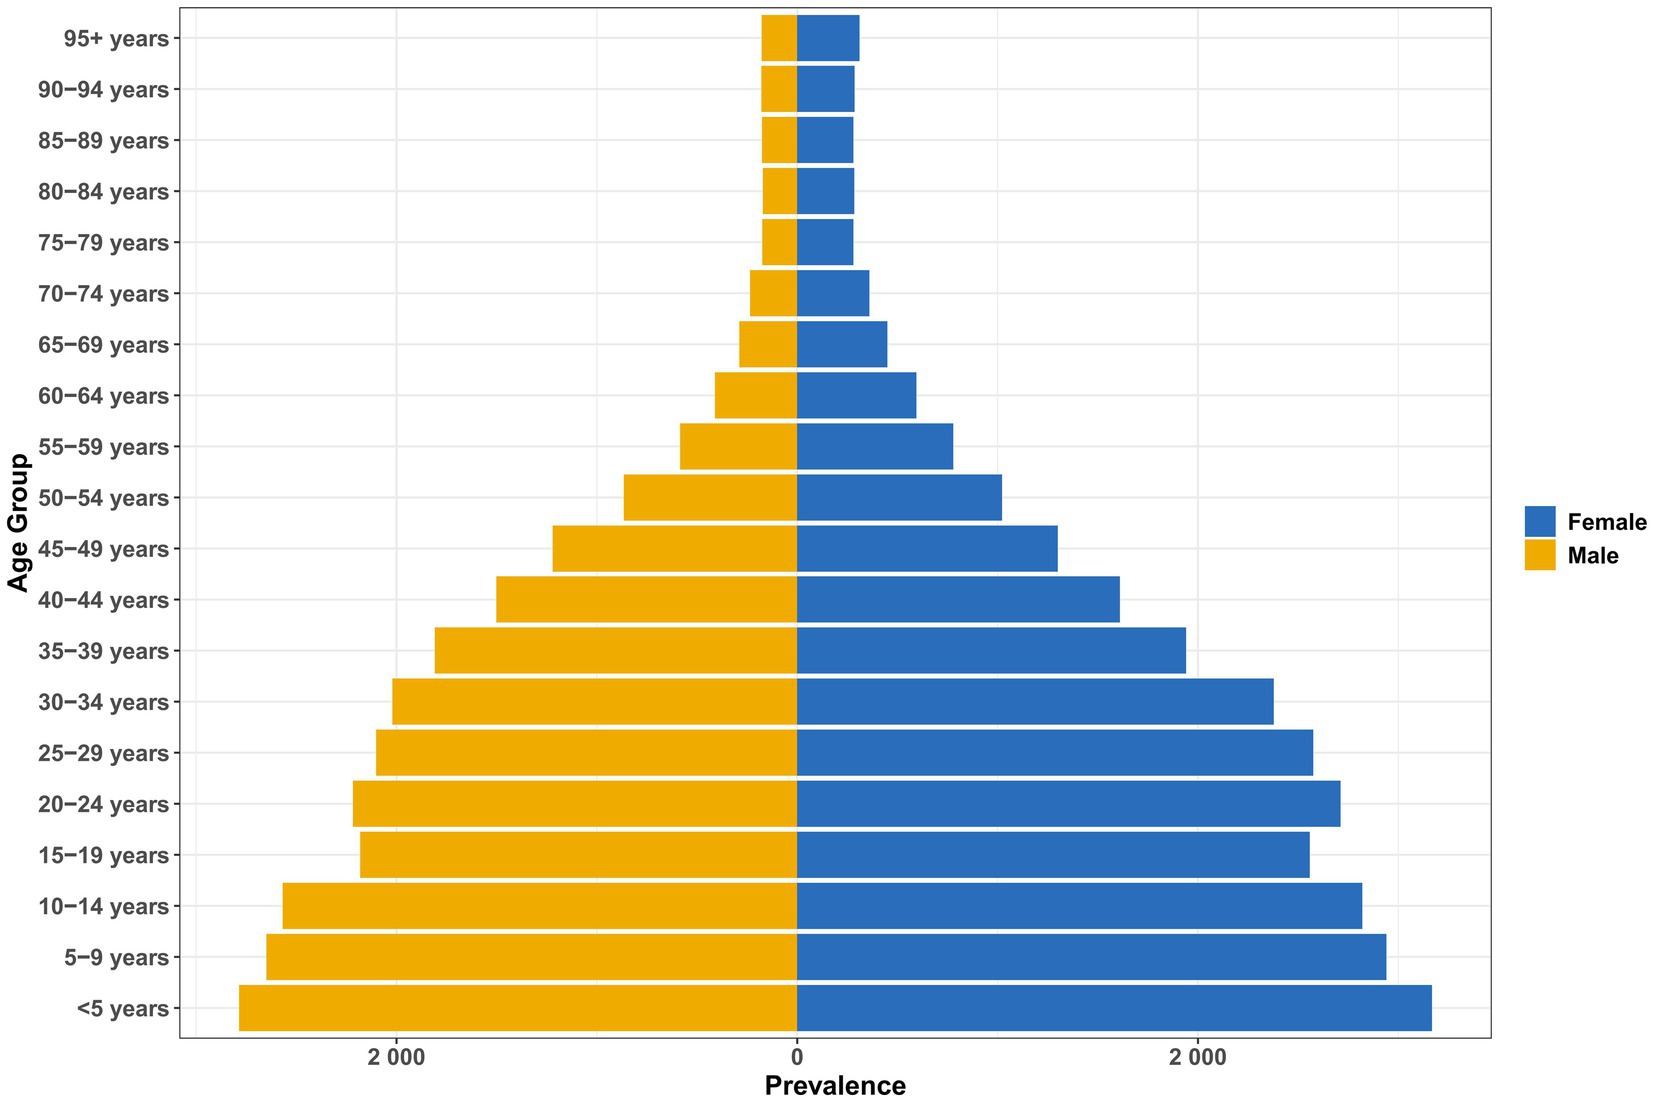
From 1990 to 2021, there were significant age and sex differences in the incidence and prevalence of vitamin A deficiency in China (Figures 1, 2). Children under 5 years of age had the heaviest burden, and the incidence rate of female children (3174.76 cases/100,000; 95% UI: 1920.37–4999.91) and prevalence (3168.64/100,000) were significantly higher than those in male children (incidence: 2797.54/100,000; prevalence: 2786.16/100,000; Supplementary Table 1). This gender difference persisted into older age (e.g., prevalence was 310.50 per 100,000 women at 95 years versus 177.49 per 100,000 men; Supplementary Table 2), but it gradually decreased with age.
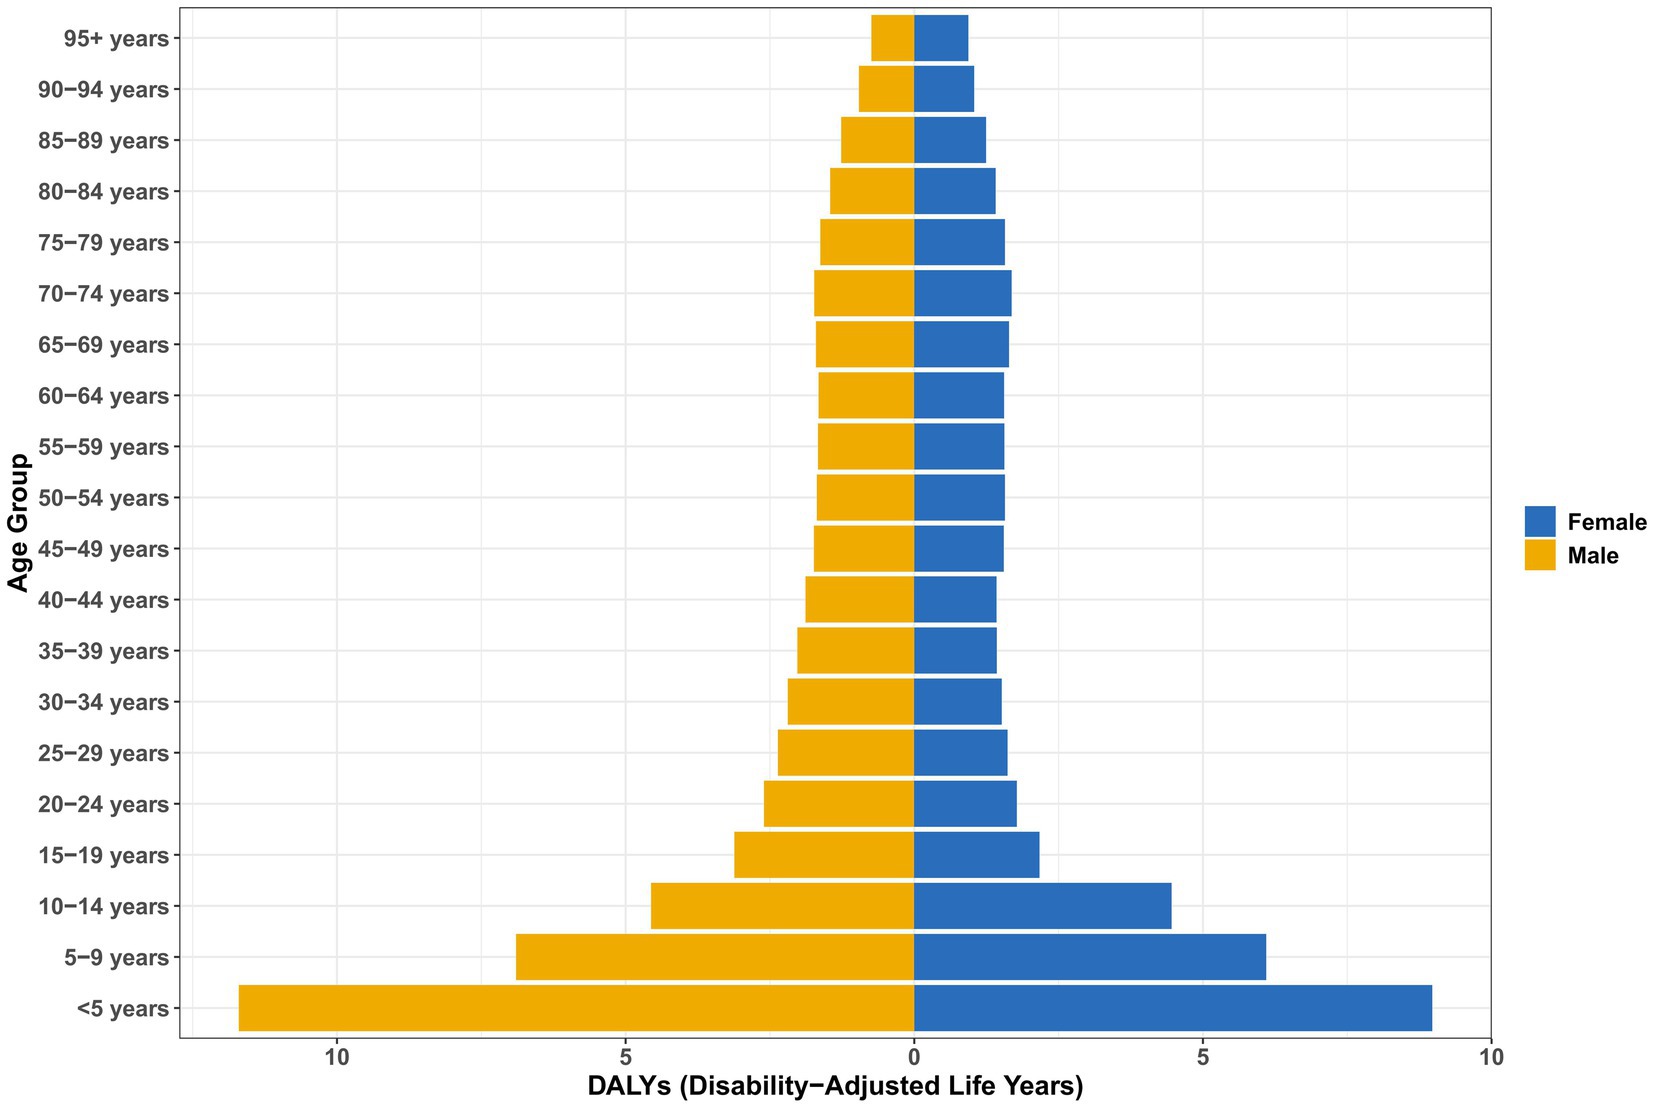
Notably, the burden of DALYs showed gender reversal (Figure 3): although the incidence was higher in women, DALYs in men exceeded those in women across all age groups, especially in children under 5 years of age (11.70 per 100,000 men versus 8.97 per 100,000 women, a difference of 30.4%; Supplementary Table 3). The disease burden peaked in early childhood and then decreased sharply with age (e.g., 3.11 per 100,000 men aged 15–19 years), reaching its lowest level in old age (1.45 per 100,000 men aged 80–84 years).
Analysis of annual percentage changes in vitamin A deficiency in China from 1990 to 2021
The annual percentage change (AAPC) in the incidence, prevalence, and disability-adjusted life years (DALYs) of vitamin A deficiency in China from 1990 to 2021 showed an overall downward trend in the disease burden of vitamin A deficiency. In terms of incidence, there was a continuous downward trend during the study period (Figure 4), with the most significant decrease from 2004 to 2008 (AAPC = −7.82, 95%CI: −8.86 to −6.77; Supplementary Table 4); although the rate of decline slowed down after 2008 (AAPC = −6.04%), it remained at a high level. The trend of prevalence was basically the same as that of incidence but showed more obvious fluctuation characteristics (Figure 5) and decreased rapidly from 2002 to 2010 (AAPC = −7.41%; Supplementary Table 5), which showed a slight slowdown from 2010 to 2016 (AAPC = −5.23%) and then accelerated after 2016 (AAPC = −7.32%).
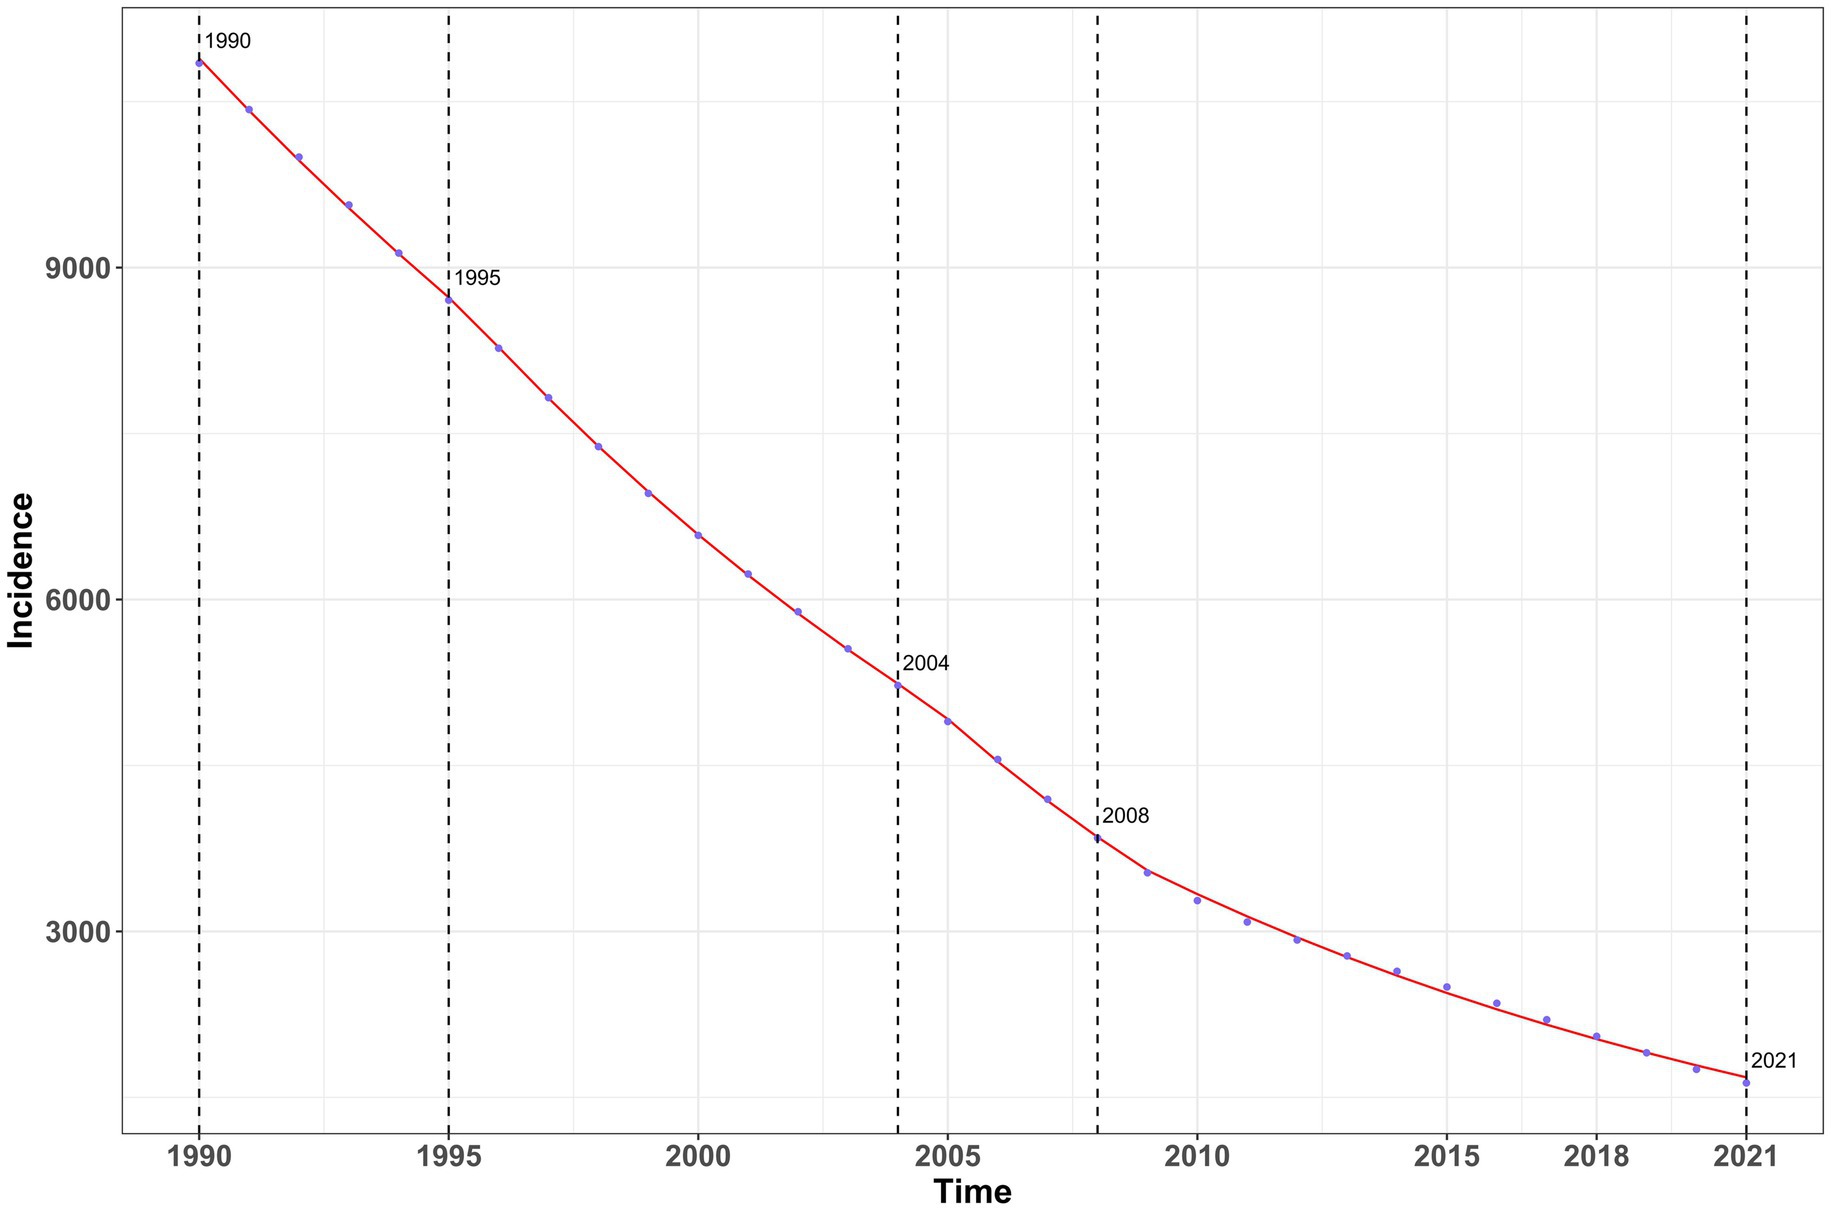
Figure 4. Analysis of annual percentage changes in incidence of vitamin A deficiency in China from 1990 to 2021.
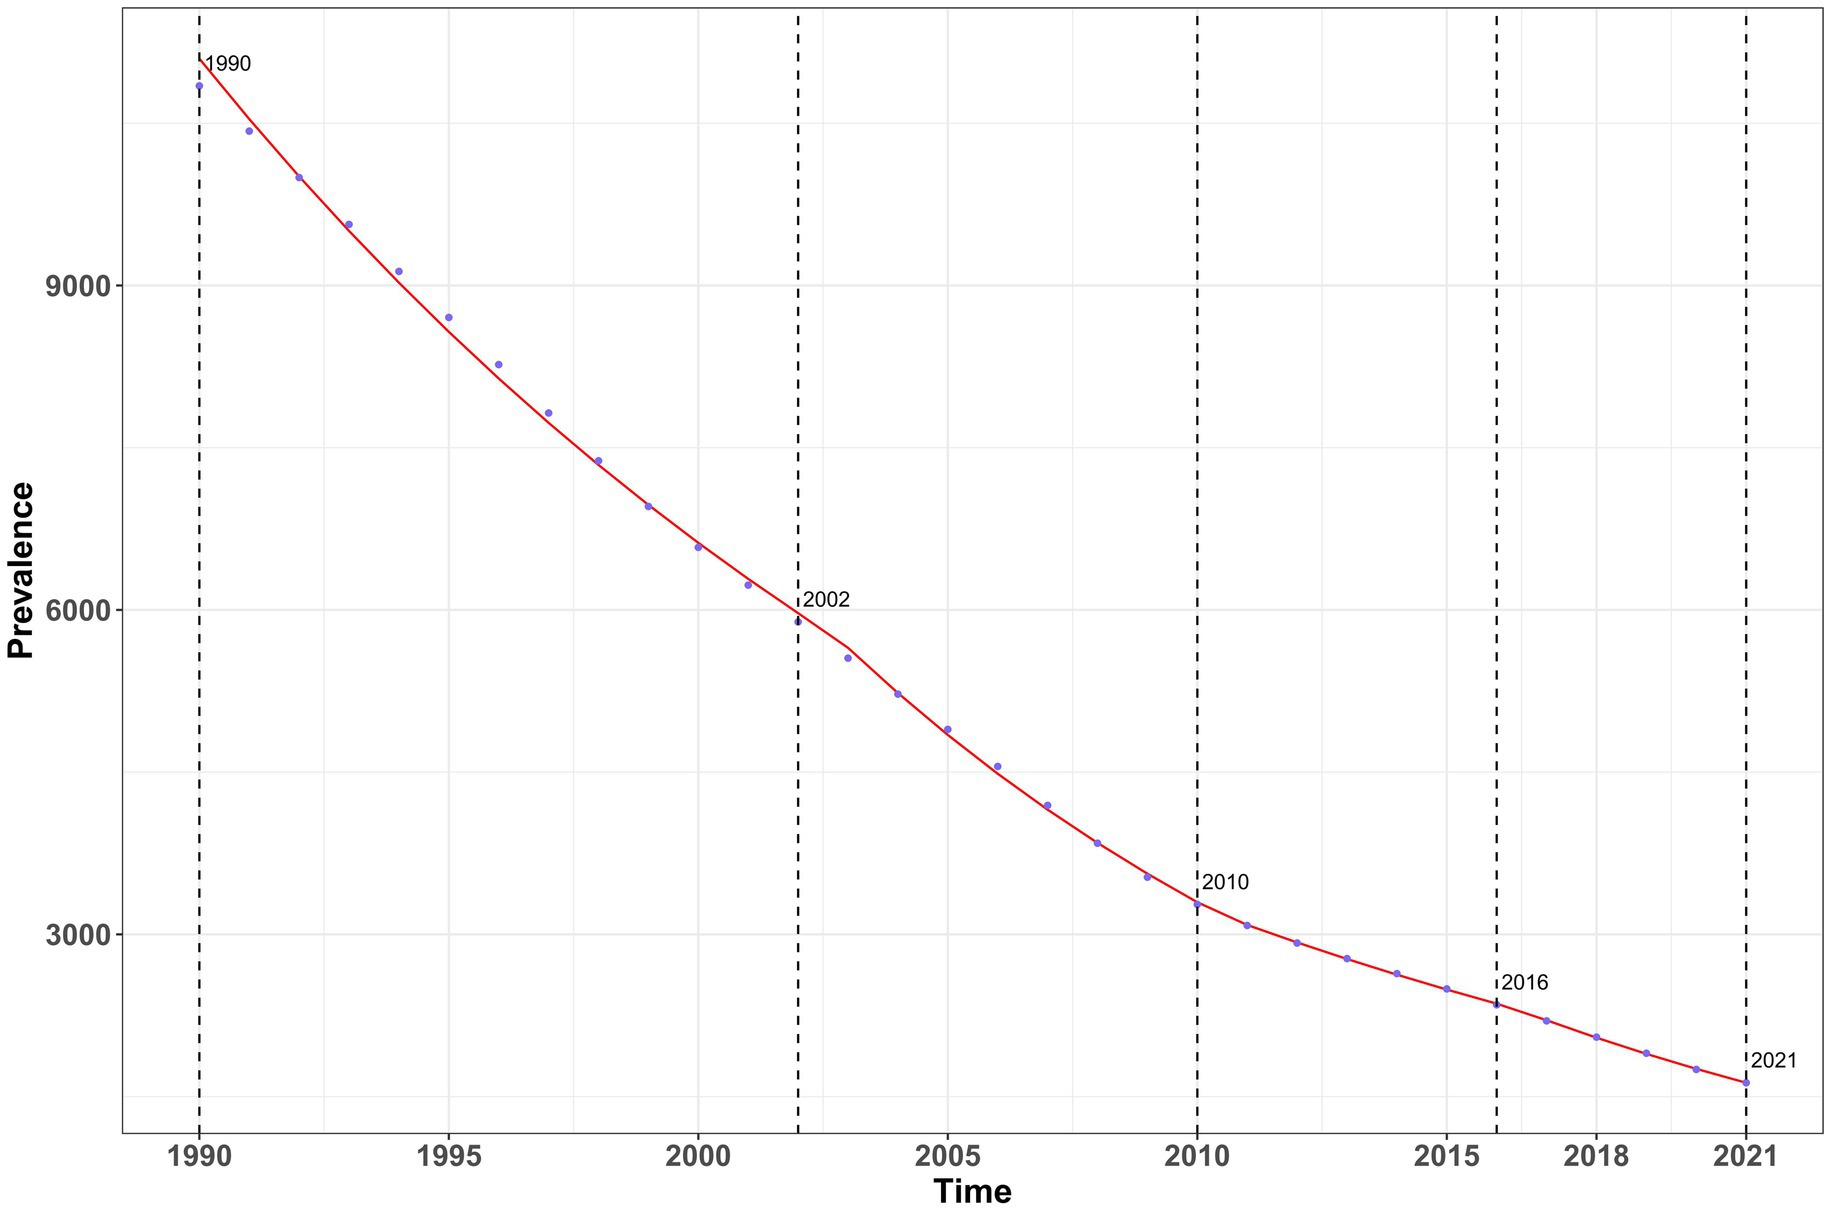
Figure 5. Analysis of annual percentage changes in Prevalence of vitamin A deficiency in China from 1990 to 2021.
The analysis results of DALYs showed a more complex trend (Figure 6), with an overall decline from 1990 to 2012 and the most significant decline occurring from 1992 to 2005 (AAPC = −7.27%; Supplementary Table 6). However, after 2012, there was a trend reversal to an increase (AAPC = 0.51%). The annual percentage changes in all indicators were statistically significant (p < 0.001), and the incidence and prevalence continued to decrease, while DALYs showed an upward trend in recent years.
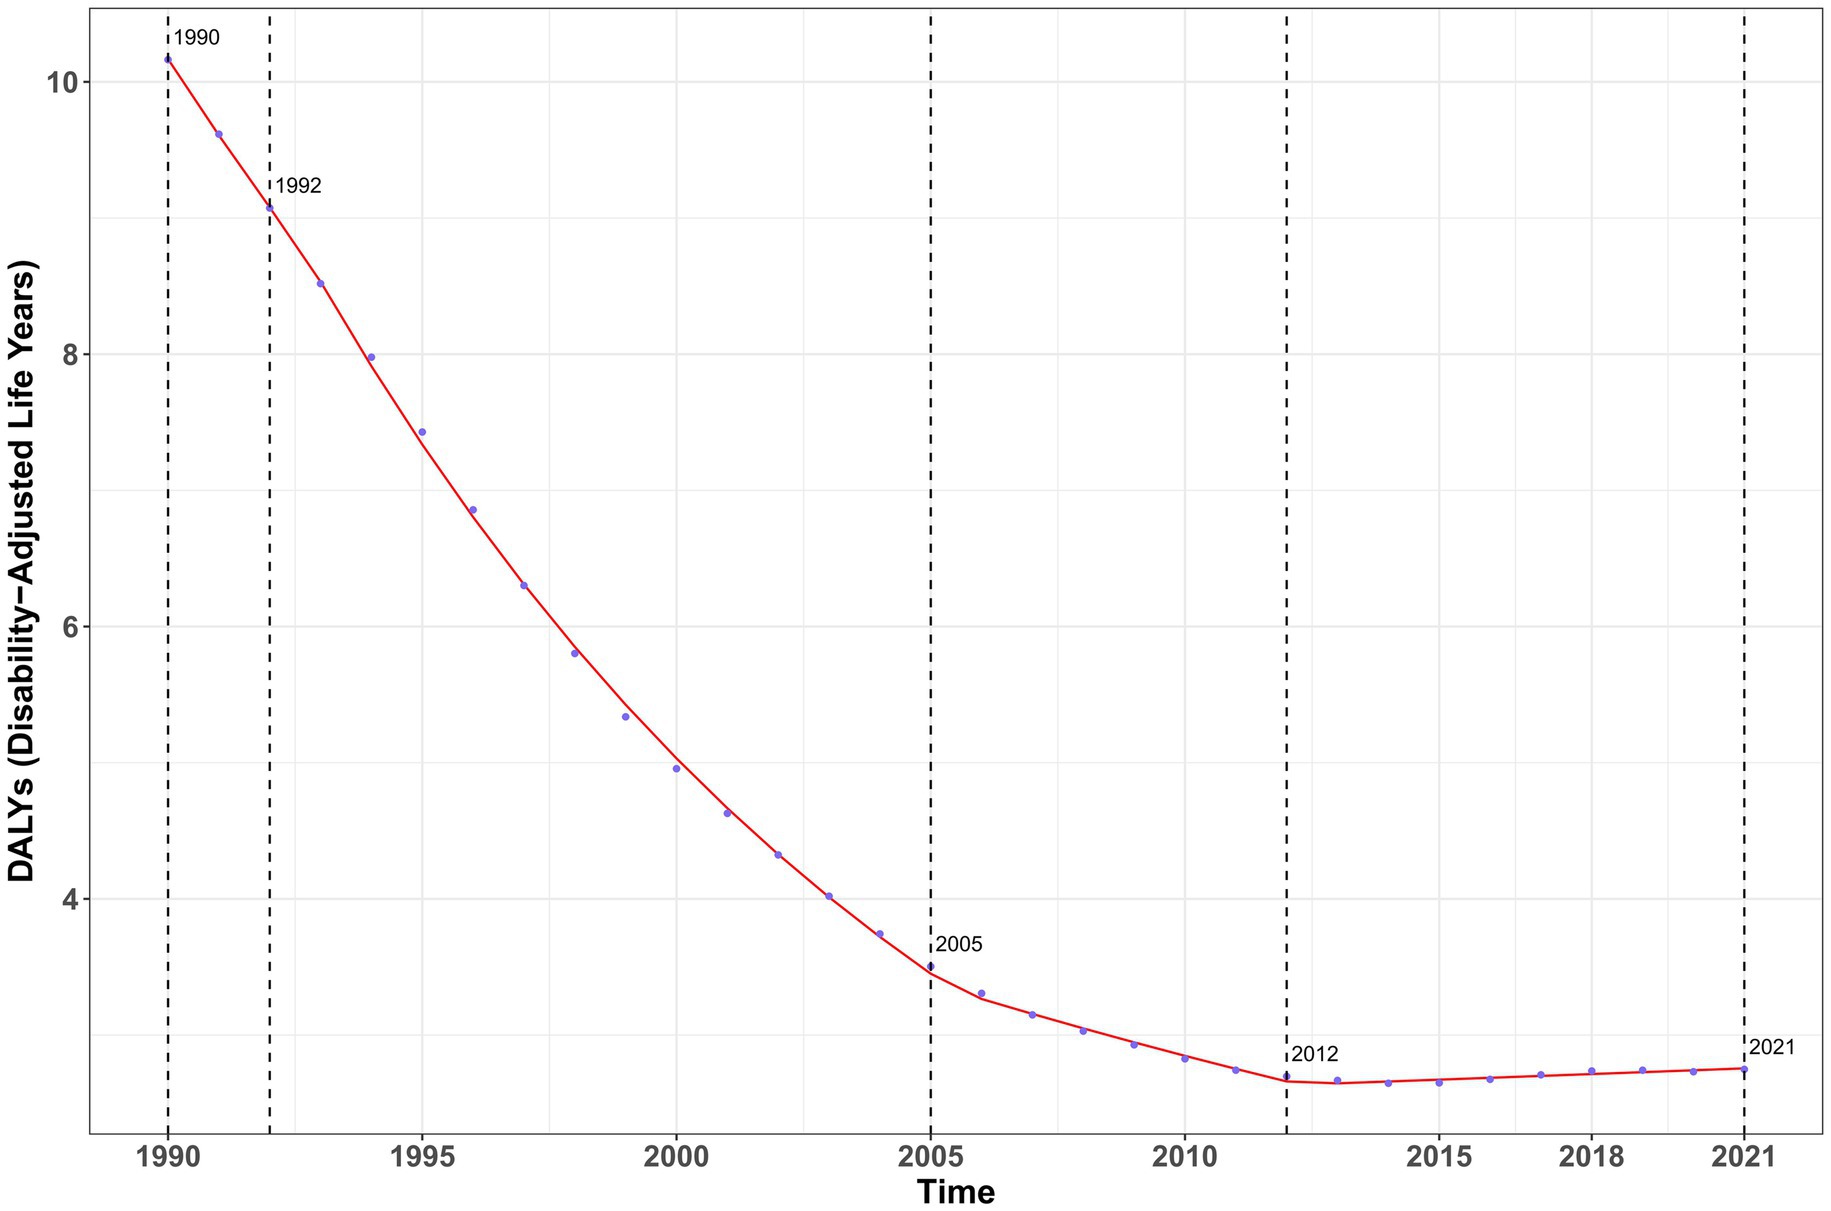
Figure 6. Analysis of annual percentage changes in DALYs of vitamin A deficiency in China from 1990 to 2021.
A decomposition analysis of vitamin A deficiency in China from 1990 to 2021
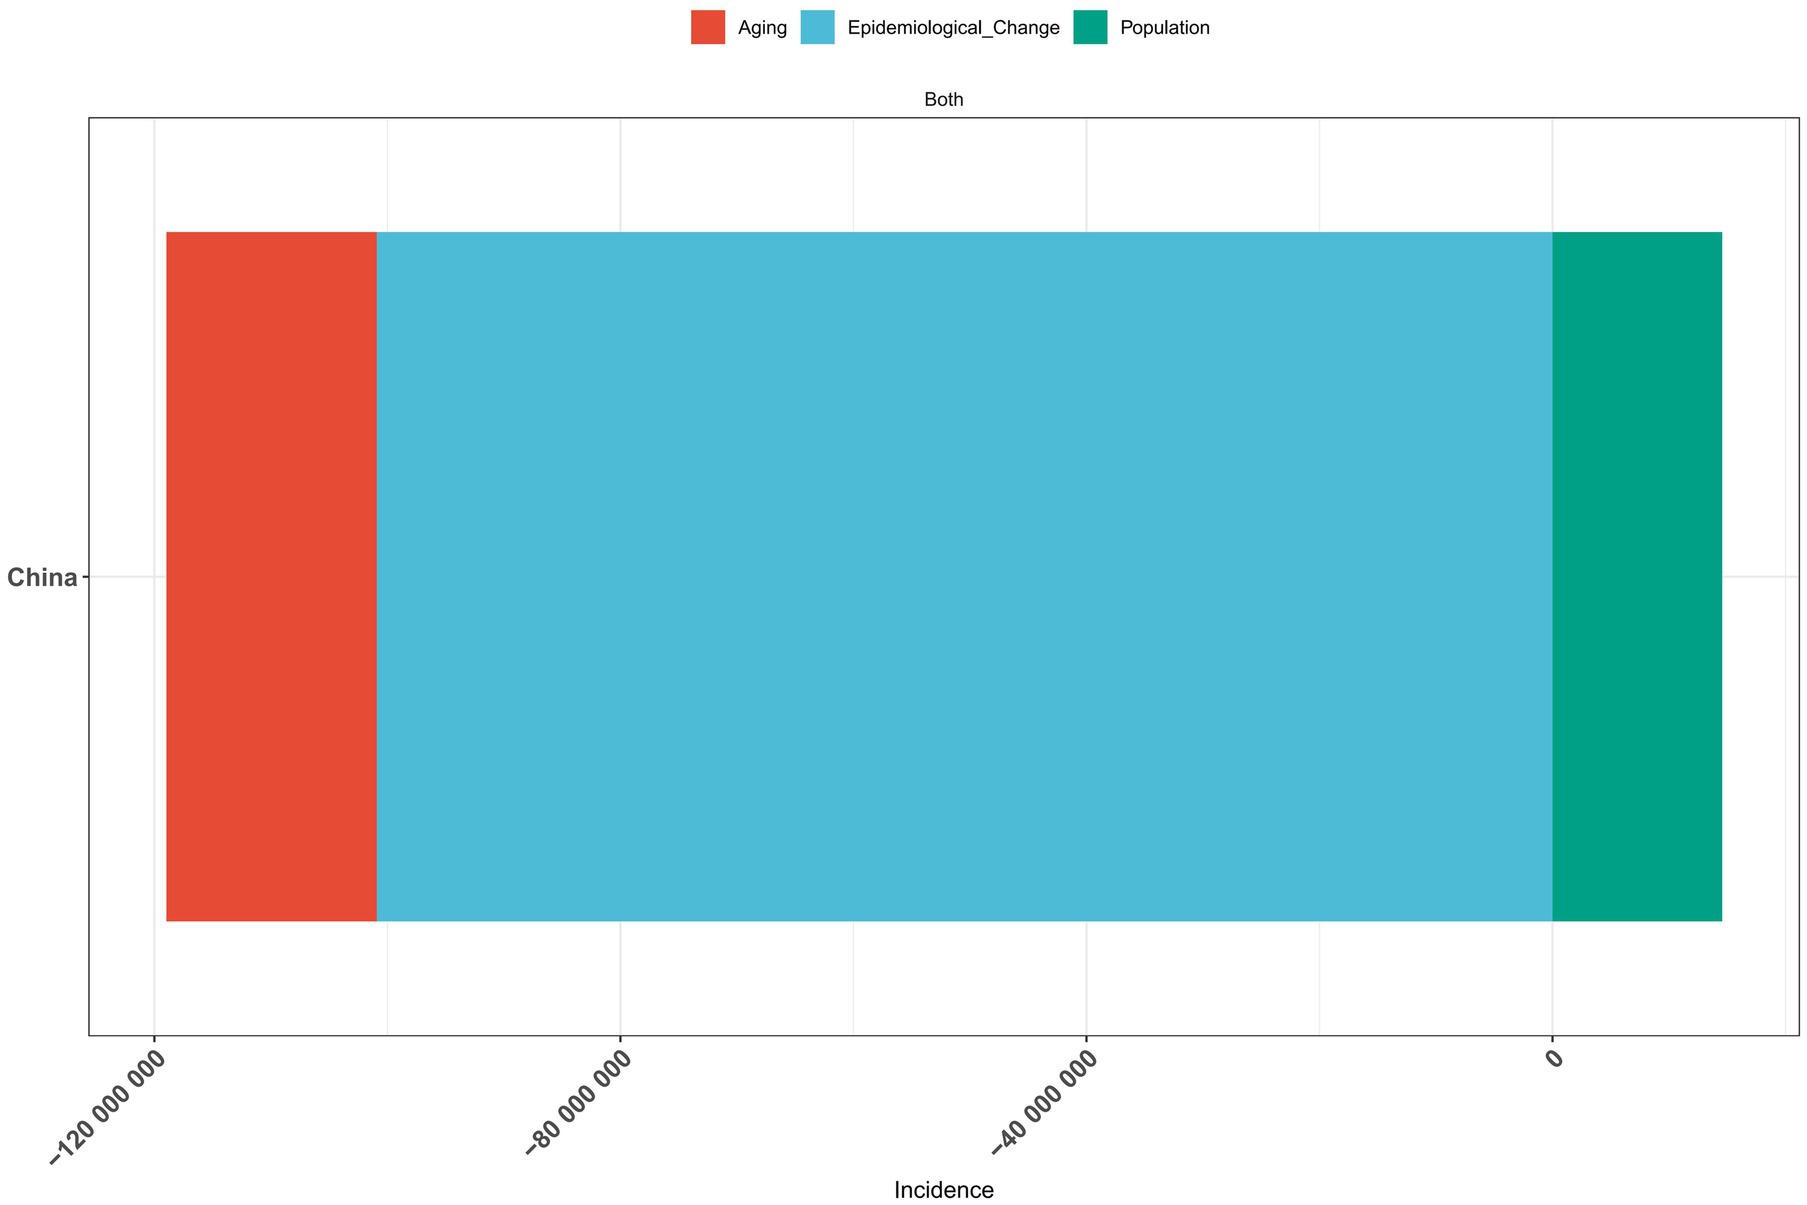
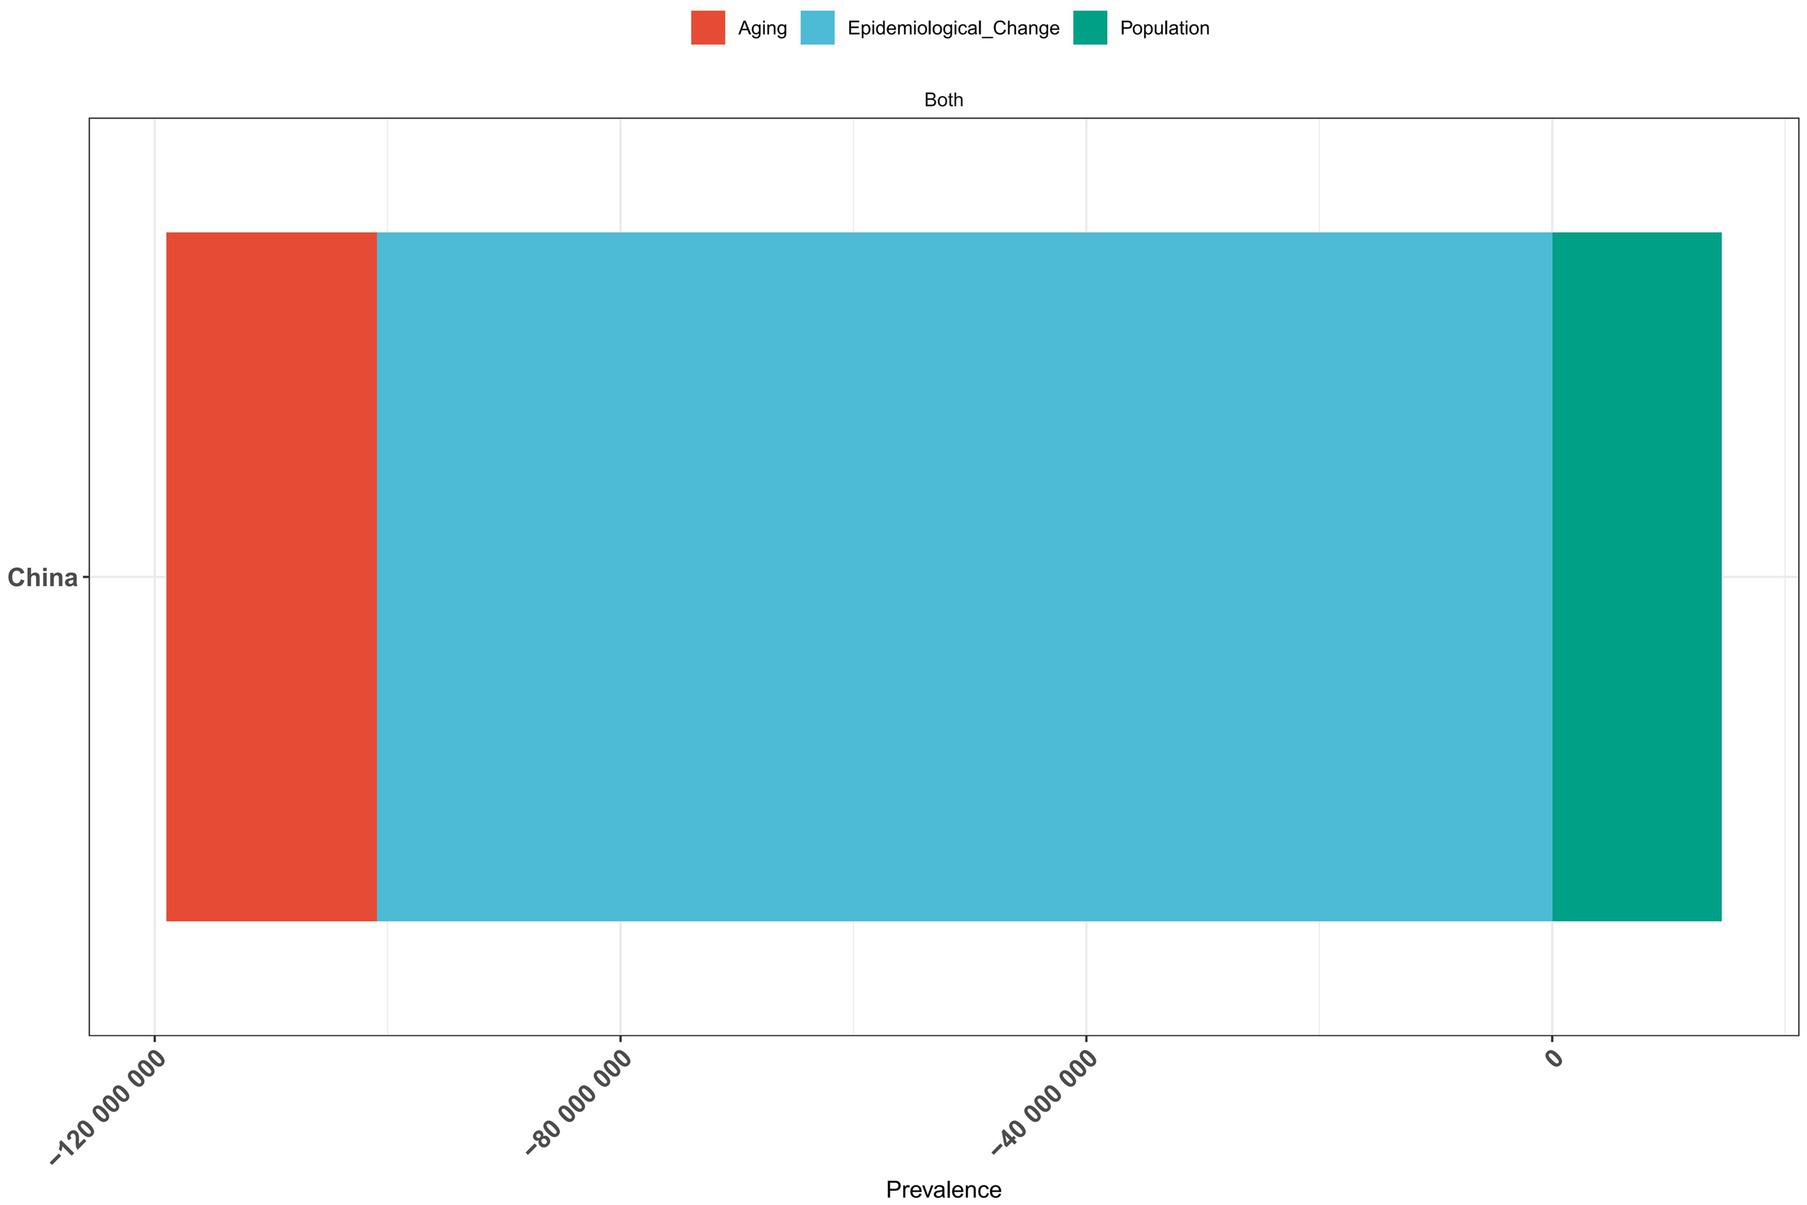
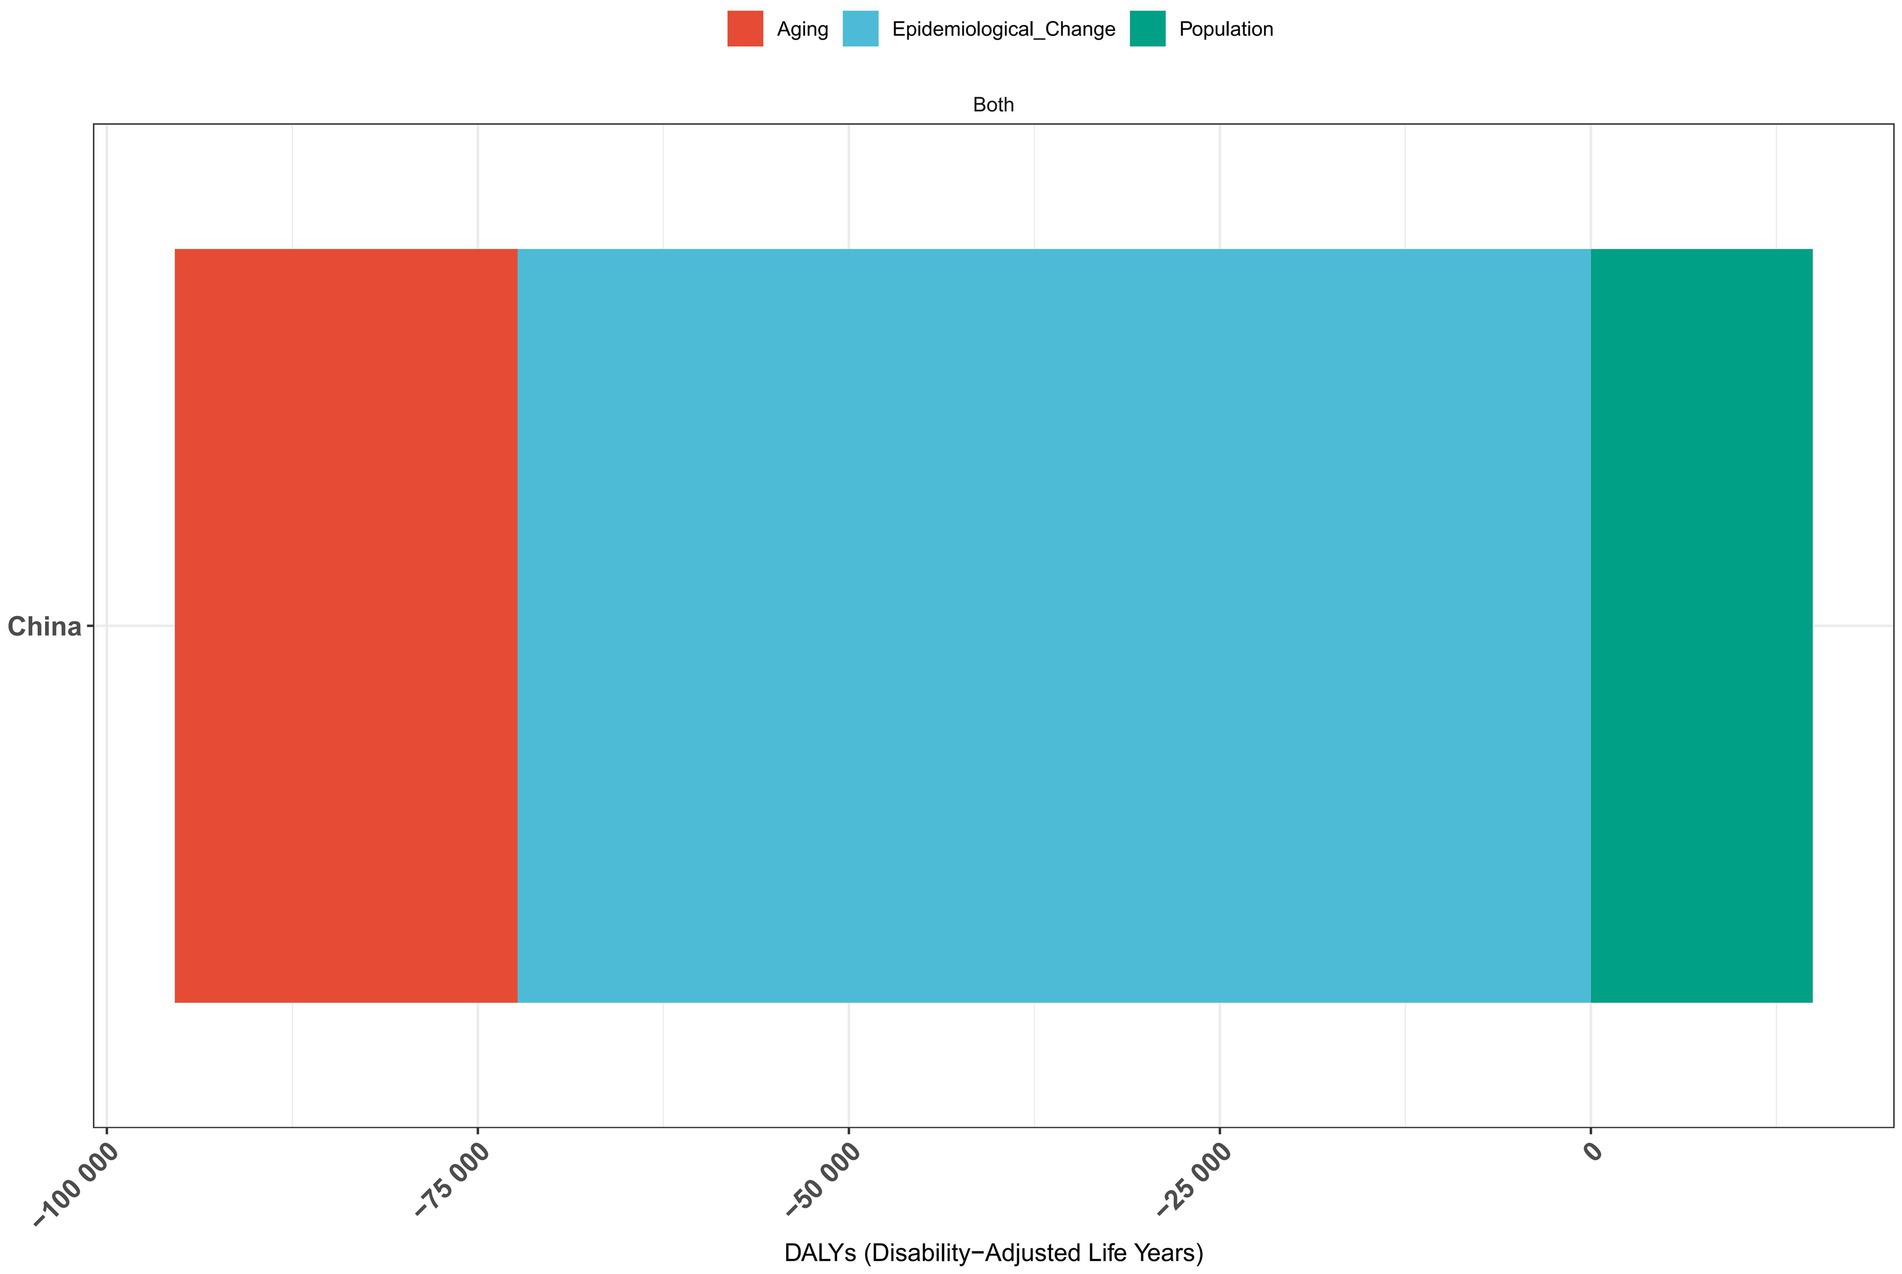
The results of the decomposition analysis of vitamin A deficiency disease burden in China from 1990 to 2021 showed that there were significant differences in the effects of different influencing factors on disease indicators (Figures 7–9). In terms of incidence, epidemiological transition factors—reflecting the effectiveness of prevention and control measures—contributed the most significant decrease (−100.9 million cases, accounting for 96.63%; Supplementary Table 7), while population aging led to an increase of 18.07 million cases (−17.31%) and population growth contributed to an increase of 14.55 million cases (−13.94%). The combined effect of these three factors reduced the total incidence rate by 104.4 million cases. The pattern of change in prevalence was highly similar to that of the incidence rate. Among the total decrease of 104.4 million cases, epidemiological transition factors contributed 96.63% (−100.9 million cases; Supplementary Table 8). The proportions of aging (17.30%) and population growth (−13.93%) were consistent with the incidence rate. In terms of disability-adjusted life years (DALYs), epidemiological transition factors were still the main improvement factors (−72,300 DALYs, accounting for 89.88%; Supplementary Table 9), while the burden caused by aging increased more significantly (23,100 DALYs, accounting for 28.69%). Overall, total DALYs decreased by 80,500.
Projection of the disease burden of vitamin A deficiency in China, 1990–2035
The disease burden projection of vitamin A deficiency in China from 1990 to 2035 shows that the incidence of vitamin A deficiency in China has shown a continuous downward trend in all age groups, but there are significant differences in the decline rate among different age groups (Figure 10; Supplementary Table 10). The incidence rate in the group of children under 5 years of age decreased significantly from 21,209.29 per 100,000 in 1990 to 2,972.56 per 100,000 in 2021 and is projected to further decrease to 1,330.69 per 100,000 in 2035, with an average annual decline rate (EAPC) of −5.34% (1990–2021). The downward trend in the adolescent group (5–19 years) was similar to that in the toddler group, where the incidence rate in the 10–14-year age group decreased from 14,470.23 per 100,000 people in 1990 to 2,690.83 per 100,000 people in 2021 and is expected to fall to 1,207.71 per 100,000 people in 2035. It is worth noting that, although the absolute incidence rate of the middle-aged and elderly group (≥50 years old) is low, the rate of decline is relatively slow, for example, the 55–59-year-old group has decreased from 3,548.14 per 100,000 people in 1990 to 681.74 per 100,000 people in 2021 and is predicted to be 351.80 per 100,000 people in 2035. The incidence rate in the elderly group (≥80 years) decreased most modestly, from 1,707.48 per 100,000 people in 1990 to 285.33 per 100,000 people in 2021 and is expected to be 114.17 per 100,000 people in 2035.
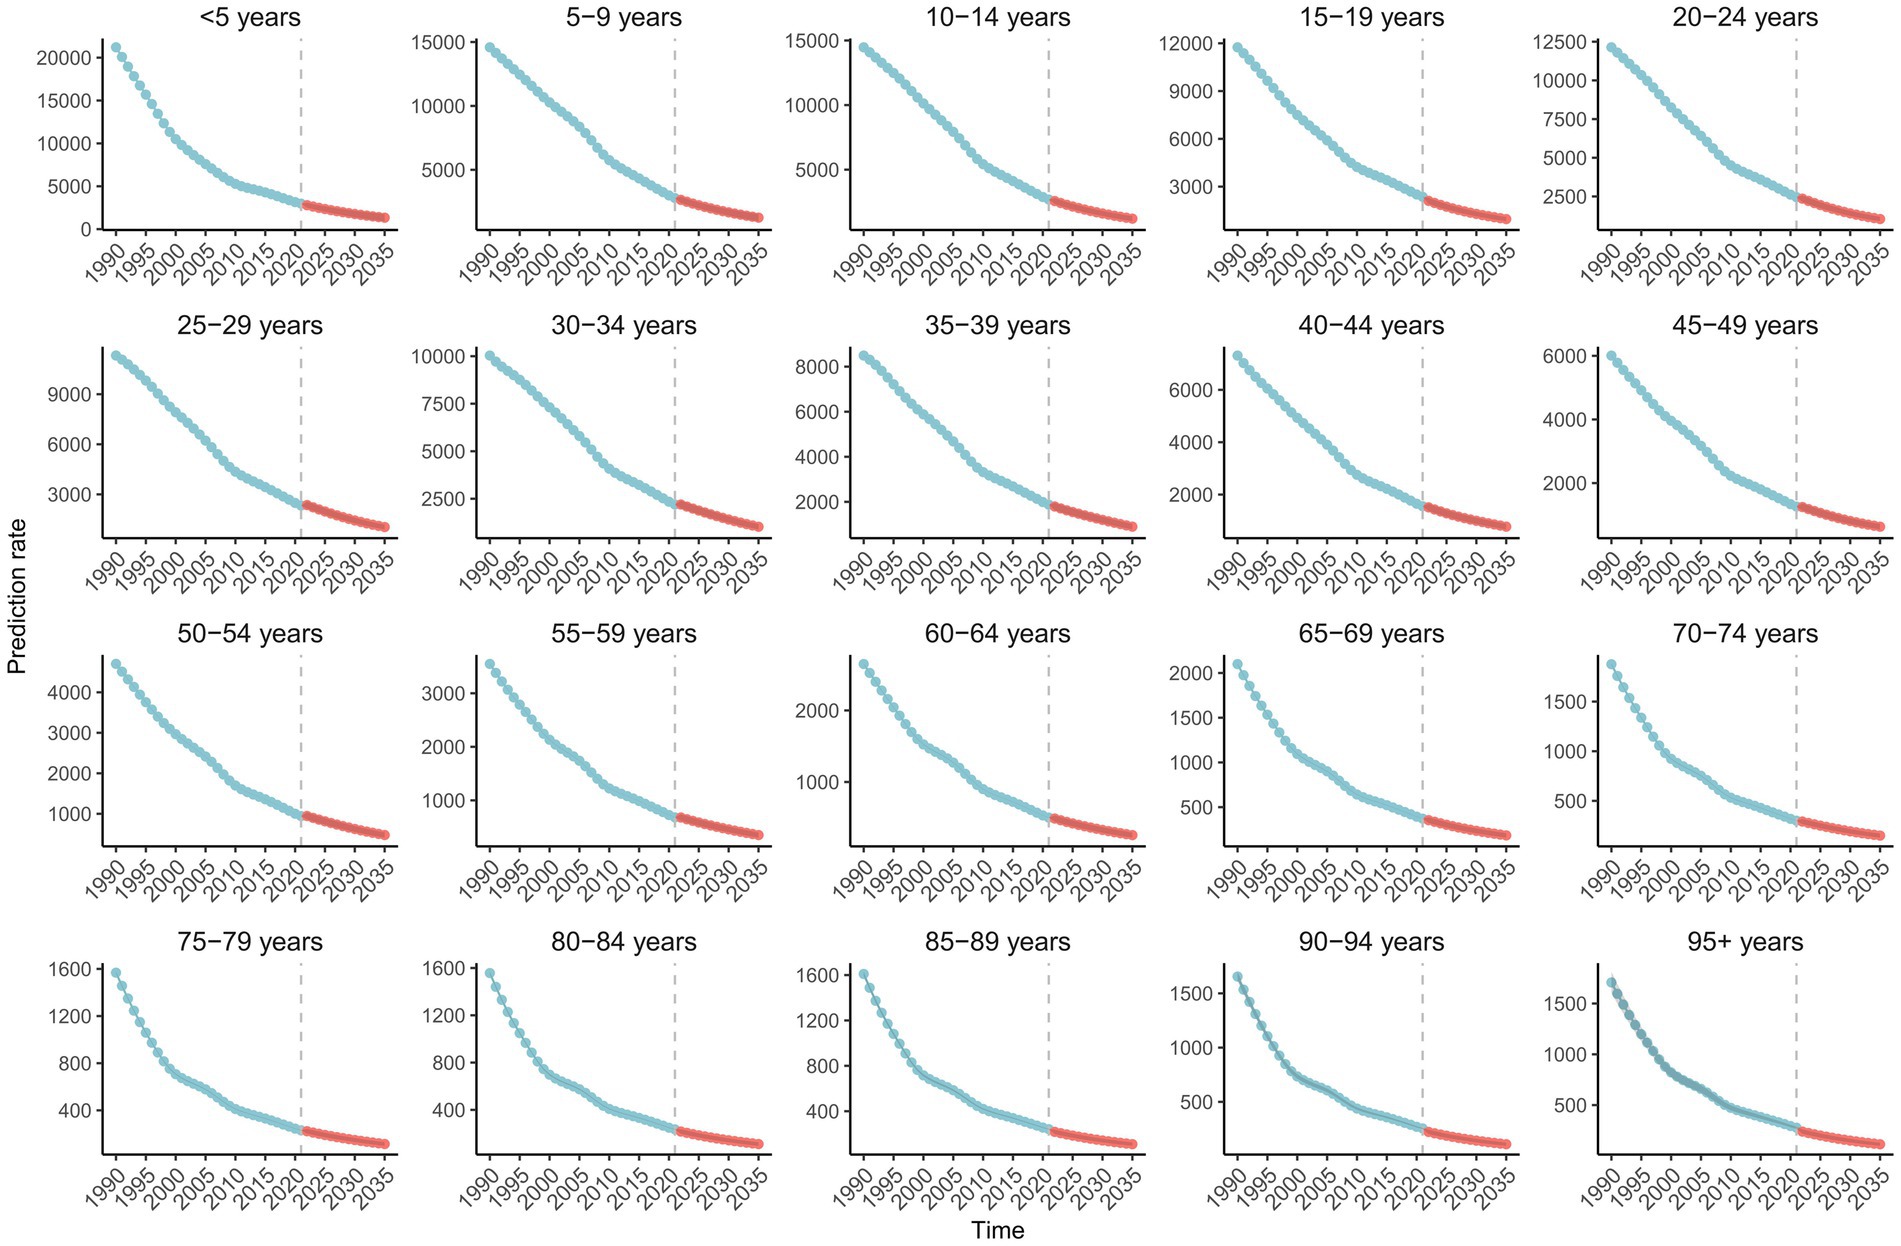
Figure 10. Projection of vitamin A deficiency incidence rate in China, 1990–2021 and forecast to 2035.
Discussion
Based on the Global Burden of Disease database, this study comprehensively analyzed the epidemiological characteristics and changes in disease burden of vitamin A deficiency in China from 1990 to 2021, and predicted the disease trend in 2035. The results revealed the complex distribution pattern and dynamic trend of vitamin A deficiency in the Chinese population, which provided an important basis for public health intervention.
This study found that the incidence and prevalence of VAD in China showed a significant decreasing trend from 1990 to 2021, especially in children under 5 years of age, with an average annual decline rate of 6.23%. This positive change reflects not only the effectiveness of public health interventions in China but also the synergistic impact of key socioeconomic drivers, including national income growth (17), education popularization (18), and targeted poverty alleviation projects (19). It is worth noting that the downward trend showed obvious phased characteristics in different periods: the most significant decline was from 2004 to 2008 (AAPC = −7.82%), which coincided with the full implementation of the policy of equalization of basic public health services during the 11th Five-Year Plan (20). Access to child health services and the expansion of vitamin A supplementation programs may be key factors contributing to this rapid decline (21). However, we have also observed significant differences in the degree of improvement across age groups. Although the absolute incidence in children has decreased significantly, in 2021, the incidence in children under 5 years of age was still 10.4 times higher than in people over 95 years of age. This difference may be due to two factors: on the one hand, children have a relatively higher need for vitamin A and are more susceptible to infectious diseases that accelerate vitamin A consumption (22). On the other hand, the metabolism and utilization efficiency of vitamin A in the elderly population may have been adaptively altered (23). These findings suggest that we need to develop differentiated intervention strategies for different age groups.
The pattern of gender disparities in VAD revealed in this study is profound. The study found that women consistently had a higher incidence and prevalence than men but that men had a higher burden of DALYs, especially in the group of children under 5 years of age (30.4% higher in men than women). This seemingly paradoxical phenomenon can be explained from several perspectives: biologically, changes in estrogen levels in women may have an impact on vitamin A metabolism. Studies have shown (24) that estrogen may affect the balance of vitamin A in the body by regulating the absorption, storage, and utilization of vitamin A. For example, estradiol is predominantly metabolized by 2-hydroxylation in female rats (25), while in male rats, it is predominantly metabolized by 2- and 16α-hydroxylation (26). In addition, women’s vitamin A needs increase significantly during puberty, pregnancy, and lactation (27, 28). Studies have shown (29) that mothers need to deliver large amounts of vitamin A to the fetus during pregnancy, which can lead to a constant depletion of the mother’s vitamin A stores. The higher burden of DALYs in men (especially young boys) may stem from their inherent susceptibility to severe infections and immune response dysregulation due to vitamin A deficiency (30). Studies have shown (30, 31) that vitamin A deficiency in men may lead to excessive and poorly controlled inflammation, along with impaired tissue repair mechanisms, leading to more serious complications and exacerbating the health effects of vitamin A deficiency.
The results showed that the DALYs associated with vitamin A deficiency in China showed an upward trend after 2012 (AAPC = 0.51%), especially among the 50–74-year-old population. An in-depth analysis shows that this trend reversal is the result of multiple interacting factors, primarily including the following: (1) the significant impact of population aging: decomposition analysis quantitatively shows that aging contributed to 28.69% of the increase in DALYs. These data are in good agreement with physiological studies: vitamin A absorption is less efficient in older adults than in younger adults (32), and chronic inflammatory states accelerate vitamin A metabolic depletion (33). (2) Compounding effects of lifestyle changes: Rapid urbanization brings dual nutritional challenges. On the one hand, the increased consumption of refined foods has led to reduced dietary fiber intake, which may affect the bioavailability of β-carotene. On the other hand, the reduction in outdoor activity time leads to insufficient UV exposure, which affects the activation and metabolism of vitamin A (34). Studies have shown (35) that the average daily time spent outdoors by urban residents has decreased significantly. (3) Limitations of prevention and control strategies are as follows: Although epidemiological transformation factors—reflecting the effectiveness of prevention and control measures—contributed to 96.63% of the reduction in incidence, the current prevention and control system has obvious shortcomings: (1) uneven coverage of the target population: Existing interventions are mainly focused on children, and the vitamin A screening rate of adults is insufficient; (2) lag in response to dietary transformation: The proportion of animal retinol in a source of vitamin A in urban populations increased, while the proportion of plant-basedβ-carotene has correspondingly decreased; (3) lack of intervention for the elderly: Predictions showed that the rate of improvement in the ≥80-year-old group (EAPC = −2.1%) is significantly slower than that in children (EAPC = −5.3%). These findings suggest that the prevention and control of vitamin A deficiency in China should adopt a “whole life cycle” management strategy, focusing on (1) early screening of middle-aged and elderly populations and (2) precise dietary guidance (vitamin A supplementation regimen for urban and rural areas and age).
Projections for 2035 provide an important basis for policymaking. First, the incidence rate in children under 5 years of age is expected to continue to decline, but the absolute burden is still high (1330.69 per 100,000), suggesting that the current intervention needs to be maintained. Second, the improvement trend in the adolescent group (5–19 years old) indicates that the school’s feeding program has been effective, but there is still room for improvement. Third, the slow improvement trend in the middle-aged and older population, especially in the 55–59 age group (forecast 351.80 per 100,000 in 2035), calls for the development of targeted intervention strategies. Based on these findings, we suggest the following recommendations: (1) incorporate vitamin A deficiency prevention and control into the aging health strategy, (2) develop intervention programs for different age groups, and (3) strengthen the nutrition monitoring system throughout the life cycle.
There are the following limitations to this study: first, data from rural and remote areas may be insufficient, and the national aggregate data based on GBD do not cover provincial and municipal subdivision data or related individual’s socioeconomic status indicators. Therefore, the impact of socioeconomic gradients or regional differences on the burden of vitamin A deficiency cannot be quantitatively assessed. Second, the impact of dietary pattern changes was not fully considered. Finally, the adaptability of predictive models to public health emergencies is limited. Future research should (1) quantitatively assess the impact of regional differences and socioeconomic gradients on the burden of vitamin A deficiency using regionally stratified populations integrated with socioeconomic status variables, (2) explore the application of novel biomarkers, and (3) develop dynamic forecasting models.
Conclusion
This study systematically depicts the 30-year (1990–2021) changes in vitamin A deficiency disease burden in China, revealing differences across three dimensions: age, gender, and period. The findings not only affirm the historic achievements in vitamin A deficiency prevention and control in China but also identify the new challenges facing the country, especially the shift in the disease burden caused by population aging. To achieve the strategic goal of “Healthy China 2030,” it is necessary to build a more refined, life-cycle vitamin A deficiency prevention and control system in the future. First, we should focus on vulnerable groups such as children, pregnant women, and the elderly. Second, it is necessary to strengthen the construction of disease surveillance and effect evaluation system. At the same time, it is necessary to carry out in-depth research on relevant pathogenesis and technological innovation to respond to the changing public health needs.
Data availability statement
The original contributions presented in the study are included in the article/Supplementary material, further inquiries can be directed to the corresponding authors.
Ethics statement
Ethics approval was exempted by the Ethics Committee of Seventh People’s Hospital Affiliated to Shanghai University of Traditional Chinese Medicine because the GBD 2021 study is a publicly available database and all data were anonymous.
Author contributions
ZY: Formal analysis, Methodology, Writing – original draft, Software. JL: Formal analysis, Writing – original draft, Methodology, Software. LY: Writing – original draft, Data curation. YH: Writing – original draft, Conceptualization. XZ: Writing – review & editing, Writing – original draft. ML: Writing – review & editing, Writing – original draft.
Funding
The author(s) declare that financial support was received for the research and/or publication of this article. This study was supported by the National Traditional Chinese Medicine Advantageous Specialty Construction Project (PWZxq2022-09), the National Natural Science Foundation of China Project (82304920), and the 2025 Pudong New Area Famous Traditional Chinese Medicine Studio Construction Project (PDZY-2-25-0713).
Acknowledgments
We would also like to thank the countless individuals who have contributed to the Global Burden of Disease Study 2021 in various capacities.
Conflict of interest
The authors declare that the research was conducted in the absence of any commercial or financial relationships that could be construed as a potential conflict of interest.
Generative AI statement
The authors declare that no Gen AI was used in the creation of this manuscript.
Any alternative text (alt text) provided alongside figures in this article has been generated by Frontiers with the support of artificial intelligence and reasonable efforts have been made to ensure accuracy, including review by the authors wherever possible. If you identify any issues, please contact us.
Publisher’s note
All claims expressed in this article are solely those of the authors and do not necessarily represent those of their affiliated organizations, or those of the publisher, the editors and the reviewers. Any product that may be evaluated in this article, or claim that may be made by its manufacturer, is not guaranteed or endorsed by the publisher.
Supplementary material
The Supplementary material for this article can be found online at: https://www.frontiersin.org/articles/10.3389/fnut.2025.1658507/full#supplementary-material
Footnotes
References
1. Zhao, T, Liu, S, Zhang, R, Zhao, Z, Yu, H, Pu, L, et al. Global burden of vitamin a deficiency in 204 countries and territories from 1990-2019. Nutrients. (2022) 14:950. doi: 10.3390/nu14050950
2. Kumar, M, Has, C, Lam-Kamath, K, Ayciriex, S, Dewett, D, Bashir, M, et al. Vitamin a deficiency alters the Phototransduction machinery and distinct non-vision-specific pathways in the Drosophila eye proteome. Biomolecules. (2022) 12:1083. doi: 10.3390/biom12081083
3. Gurr, A, Kumaratilake, J, Brook, AH, Ioannou, S, Pate, FD, and Henneberg, M. Health effects of European colonization: An investigation of skeletal remains from 19th to early 20th century migrant settlers in South Australia. PLoS One. (2022) 17:e0265878. doi: 10.1371/journal.pone.0265878
4. Ji, S, Zhou, Y, Zhao, Q, Chen, R, and Su, Z. Trends in three malnutrition factors in the global burden of disease: iodine deficiency, vitamin a deficiency, and protein-energy malnutrition (1990-2019). Front Nutr. (2024) 11:1426790. doi: 10.3389/fnut.2024.1426790
5. Cen, J, Wang, Q, Cheng, L, Gao, Q, Wang, H, and Sun, F. Global, regional, and national burden and trends of migraine among women of childbearing age from 1990 to 2021: insights from the global burden of disease study 2021. J Headache Pain. (2024) 25:96. doi: 10.1186/s10194-024-01798-z
6. GBD 2021 Causes of Death Collaborators. Global burden of 288 causes of death and life expectancy decomposition in 204 countries and territories and 811 subnational locations, 1990-2021: a systematic analysis for the global burden of disease study 2021. Lancet. (2024) 403:2100–32. doi: 10.1016/S0140-6736(24)00367-2
7. GBD 2019 Stroke Collaborators. Global, regional, and national burden of stroke and its risk factors, 1990-2019: a systematic analysis for the global burden of disease study 2019. Lancet Neurol. (2021) 20:795–820. doi: 10.1016/S1474-4422(21)00252-0
8. Hall, HI, Song, R, Rhodes, P, Prejean, J, An, Q, Lee, LM, et al. Estimation of HIV incidence in the United States. JAMA. (2008) 300:520–9. doi: 10.1001/jama.300.5.520
9. Zhang, Y, Liu, J, Han, X, Jiang, H, Zhang, L, Hu, J, et al. Long-term trends in the burden of inflammatory bowel disease in China over three decades: a joinpoint regression and age-period-cohort analysis based on GBD 2019. Front Public Health. (2022) 10:994619. doi: 10.3389/fpubh.2022.994619
10. Kim, HJ, Chen, HS, Byrne, J, Wheeler, B, and Feuer, EJ. Twenty years since Joinpoint 1.0: two major enhancements, their justification, and impact. Stat Med. (2022) 41:3102–30. doi: 10.1002/sim.9407
11. Megwalu, UC, and Moon, PK. Thyroid Cancer incidence and mortality trends in the United States: 2000-2018. Thyroid. (2022) 32:560–70. doi: 10.1089/thy.2021.0662
12. Schafer, EJ, Jemal, A, Wiese, D, Sung, H, Kratzer, TB, Islami, F, et al. Disparities and trends in genitourinary cancer incidence and mortality in the USA. Eur Urol. (2023) 84:117–26. doi: 10.1016/j.eururo.2022.11.023
13. Wu, J, Zhang, Z, Chen, J, Yu, S, Liu, D, Jiang, J, et al. Low dietary calcium intake leads to a higher colorectal cancer burden in countries with low social development: findings from the global burden of disease study 2021. Front Nutr. (2025) 12:1545085. doi: 10.3389/fnut.2025.1545085
14. Lu, T, and Chen, Q. Simple, efficient, and universal energy decomposition analysis method based on dispersion-corrected density functional theory. J Phys Chem A. (2023) 127:7023–35. doi: 10.1021/acs.jpca.3c04374
15. Abrams, LR, Myrskylä, M, and Mehta, NK. The growing rural-urban divide in US life expectancy: contribution of cardiovascular disease and other major causes of death. Int J Epidemiol. (2022) 50:1970–8. doi: 10.1093/ije/dyab158
16. Li, X, Qu, P, Yan, P, Kou, Y, Song, J, Wu, D, et al. Trends in burden and mortality of congenital birth defects in G20 countries (1990-2021) and predictions for 2022-2040. BMC Pregnancy Childbirth. (2025) 25:494. doi: 10.1186/s12884-025-07617-w
17. Santamaria-Garcia, H, Sainz-Ballesteros, A, Hernandez, H, Moguilner, S, Maito, M, Ochoa-Rosales, C, et al. Factors associated with healthy aging in Latin American populations. Nat Med. (2023) 29:2248–58. doi: 10.1038/s41591-023-02495-1
18. Abubakar, I, Dalglish, SL, Angell, B, Sanuade, O, Abimbola, S, Adamu, AL, et al. The lancet Nigeria commission: investing in health and the future of the nation. Lancet. (2022) 399:1155–200. doi: 10.1016/S0140-6736(21)02488-0
19. O'Donnell, O. Health and health system effects on poverty: a narrative review of global evidence. Health Policy. (2024) 142:105018. doi: 10.1016/j.healthpol.2024.105018
20. Yang, L, Sun, L, Wen, L, Zhang, H, Li, C, Hanson, K, et al. Financing strategies to improve essential public health equalization and its effects in China. Int J Equity Health. (2016) 15:194. doi: 10.1186/s12939-016-0482-x
21. Lin, J, Song, F, Yao, P, Yang, X, Li, N, Sun, S, et al. Effect of vitamin a supplementation on immune function of well-nourished children suffering from vitamin a deficiency in China. Eur J Clin Nutr. (2008) 62:1412–8. doi: 10.1038/sj.ejcn.1602881
22. Lai, X, Zhang, Q, Zhu, J, Yang, T, Guo, M, Li, Q, et al. A weekly vitamin a supplementary program alleviates social impairment in Chinese children with autism spectrum disorders and vitamin a deficiency. Eur J Clin Nutr. (2021) 75:1118–25. doi: 10.1038/s41430-020-00827-9
23. West, JBAmerican College of PhysiciansAmerican Physiological Society. The physiologic basis of high-altitude diseases. Ann Intern Med. (2004) 141:789–800. doi: 10.7326/0003-4819-141-10-200411160-00010
24. Daftary, GS, and Taylor, HS. Endocrine regulation of HOX genes. Endocr Rev. (2006) 27:331–55. doi: 10.1210/er.2005-0018
25. Badawi, AF, Cavalieri, EL, and Rogan, EG. Effect of chlorinated hydrocarbons on expression of cytochrome P450 1A1, 1A2 and 1B1 and 2- and 4-hydroxylation of 17beta-estradiol in female Sprague-Dawley rats. Carcinogenesis. (2000) 21:1593–9. doi: 10.1093/carcin/21.8.1593
26. Ryan, DE, Iida, S, Wood, AW, Thomas, PE, Lieber, CS, and Levin, W. Characterization of three highly purified cytochromes P-450 from hepatic microsomes of adult male rats. J Biol Chem. (1984) 259:1239–50. doi: 10.1016/S0021-9258(17)43594-0
27. Oteng-Ntim, E, Pavord, S, Howard, R, Robinson, S, Oakley, L, Mackillop, L, et al. Management of sickle cell disease in pregnancy. A British Society for Haematology guideline. Br J Haematol. (2021) 194:980–95. doi: 10.1111/bjh.17671
28. Carretero-Krug, A, Montero-Bravo, A, Morais-Moreno, C, Puga, AM, Samaniego-Vaesken, ML, Partearroyo, T, et al. Nutritional status of breastfeeding mothers and impact of diet and dietary supplementation: a narrative review. Nutrients. (2024) 16:301. doi: 10.3390/nu16020301
29. Schulze, KJ, Gernand, AD, Khan, AZ, Wu, LS, Mehra, S, Shaikh, S, et al. Newborn micronutrient status biomarkers in a cluster-randomized trial of antenatal multiple micronutrient compared with iron folic acid supplementation in rural Bangladesh. Am J Clin Nutr. (2020) 112:1328–37. doi: 10.1093/ajcn/nqaa223
30. Amimo, JO, Michael, H, Chepngeno, J, Raev, SA, Saif, LJ, and Vlasova, AN. Immune impairment associated with vitamin a deficiency: insights from clinical studies and animal model research. Nutrients. (2022) 14:5038. doi: 10.3390/nu14235038
31. Semba, RD. Vitamin a, immunity, and infection. Clin Infect Dis. (1994) 19:489–99. doi: 10.1093/clinids/19.3.489
32. Lai, JC, Tandon, P, Bernal, W, Tapper, EB, Ekong, U, Dasarathy, S, et al. Malnutrition, frailty, and sarcopenia in patients with cirrhosis: 2021 practice guidance by the American Association for the Study of Liver Diseases. Hepatology. (2021) 74:1611–44. doi: 10.1002/hep.32049
33. Szymczak-Pajor, I, Drzewoski, J, and Śliwińska, A. The molecular mechanisms by which vitamin D prevents insulin resistance and associated disorders. Int J Mol Sci. (2020) 21:6644. doi: 10.3390/ijms21186644
34. Quan, QL, Yoon, KN, Lee, JS, Kim, EJ, and Lee, DH. Impact of ultraviolet radiation on cardiovascular and metabolic disorders: the role of nitric oxide and vitamin D. Photodermatol Photoimmunol Photomed. (2023) 39:573–81. doi: 10.1111/phpp.12914
Keywords: Global Burden of Disease, vitamin A deficiency, China, incidence, forecast
Citation: Ye Z, Liu J, You L, Han Y, Zhang X and Lei M (2025) Trends and forecasts of vitamin A deficiency burden in China, 1990–2035. Front. Nutr. 12:1658507. doi: 10.3389/fnut.2025.1658507
Edited by:
Hasanain A. J. Gharban, Wasit University, IraqReviewed by:
Isra’a M. Essa, University of Basrah, IraqHaider H. G. Al-Saadi, University of Wasit, Iraq
Hayder Saleem, University of Manara, Iraq
Copyright © 2025 Ye, Liu, You, Han, Zhang and Lei. This is an open-access article distributed under the terms of the Creative Commons Attribution License (CC BY). The use, distribution or reproduction in other forums is permitted, provided the original author(s) and the copyright owner(s) are credited and that the original publication in this journal is cited, in accordance with accepted academic practice. No use, distribution or reproduction is permitted which does not comply with these terms.
*Correspondence: Ming Lei, MTgyMzUyOTE5NTZAMTM5LmNvbQ==; Xiaodan Zhang, MTgyMzUyOTE5NTZAMTYzLmNvbQ==
†These authors have contributed equally to this work
 Zhongming Ye1†
 Lijiao You
 Ming Lei