 Ana Carolina Costa Campos Mota1Maria Clara da Cruz Carvalho2
 Mariana Duarte Bona3Daniele de Souza Marinho do Nascimento2Ingrid Naihara França de Sousa4
 Priscila Gomes de Oliveira4Eva Débora de Oliveira Andrade2
 Karla Danielly da Silva Ribeiro1,4
 Bruna Leal Lima Maciel1,2,4*
- 1Graduate Program in Nutrition, Center for Health Sciences, Federal University of Rio Grande do Norte, Natal, Brazil
- 2Graduate Program in Health Sciences, Center for Health Sciences, Federal University of Rio Grande do Norte, Natal, Brazil
- 3Department of Medicine, Institute of Biomedicine, Federal University of Ceará, Fortaleza, Brazil
- 4Department of Nutrition, Center for Health Sciences, Federal University of Rio Grande do Norte, Natal, Brazil
Background: Alpha-tocopherol is a fat-soluble vitamin with antioxidant properties, capable of reducing oxidative stress and protecting cell membranes from oxidative damage. This vitamin also acts in the prevention of cardiovascular diseases, however research into this relationship is currently limited. This study aimed to assess the relationship between alpha-tocopherol concentrations and anthropometric, biochemical, usual dietary intake, and cardiovascular risk parameters.
Methods: A cross-sectional study was conducted to collect sociodemographic, anthropometric, biochemical parameters of 92 adult individuals. Usual dietary intake was estimated with two 24-h recalls (24hR), using the Multiple Source Method. Cardiovascular risk was calculated using the Framingham global risk score (GRS). Alpha-tocopherol was examined by high performance liquid chromatography (HPLC). Multiple linear regression was used to evaluate the relationship between anthropometric, biochemical, usual dietary intake, and cardiovascular risk variables associated with alpha-tocopherol/total cholesterol concentrations.
Results: The studied population presented a mean alpha-tocopherol of 17.80 μmol/L. Total cholesterol, non-HDL-c and LDL-c were significantly higher in individuals with higher serum concentrations of alpha-tocopherol. High-sensitivity C-reactive protein (hs-CRP) was significantly lower in subjects with higher concentrations of alpha-tocopherol. The GRS percentage was 10% for the total population. The multiple linear regression model showed that GRS was positively associated (β = 0.328; 95% CI 0.015, 0.100; p = 0.009) and the conicity index negatively associated (β = −0.290; 95% CI −8.196, −0.728; p = 0.020) with alpha-tocopherol/total cholesterol.
Conclusion: Alpha-tocopherol was positively associated with biochemical and cardiovascular risk parameters, suggesting metabolic alterations that are related to low-grade inflammation resulting from excess weight and increased cardiovascular risk.
1 Introduction
Vitamin E is a fat-soluble group of eight compounds found in nature, divided into four tocopherols and four tocotrienols called alpha, beta, gamma, and delta, and alpha-tocopherol is the main form available in human plasma (1, 2). Vitamin E, due to its high concentration among the insoluble vitamin groups, regulates the redox balance and is present throughout the body, including cell membranes and lipoproteins, presenting antioxidant properties (3, 4). Vitamin E is also recognized for its anti-proliferative, pro-apoptotic, anti-angiogenic and anti-inflammatory effects (1).
In the diet, the main food sources of vitamin E are polyunsaturated vegetable oils (soybean, sunflower, and corn), nuts, seeds, eggs, liver, green vegetables, and dairy products (5, 6). Studies have shown that the intake of vitamin E seems to bring beneficial effects for cardiovascular health, being an important micronutrient in the prevention of cardiovascular diseases (7). On the other hand, high intake of alpha-tocopherol may be associated with impaired blood clotting, increased risk of bleeding and cardiovascular disease (8). Regarding vitamin E deficiency, neurological dysfunctions, muscle deterioration and a compromised immune system were observed (6, 9). As for alpha-tocopherol serum concentrations, values lower than 12 μmol/L indicate deficiency, while values higher than or equal to 30 μmol/L have been associated with a possible protective effect against cardiovascular diseases (10, 11).
The availability of this micronutrient seems correlated with nutritional status, especially obesity (1, 12). The chronic low-grade inflammation induced by excess weight increases oxidative stress, demanding antioxidants like vitamin E, and may lead to greater use and, consequently, a reduction in serum concentrations (13). Despite this assumption, the relationship between obesity and alpha-tocopherol status has not yet been fully elucidated due to the different results published, as some studies have found increased serum concentrations (14, 15) of this vitamin and others decreased in obesity (16, 17).
Obesity is also a risk factor for cardiovascular diseases (CVD), which are the leading causes of death and disability among overweight or obesity (18). Risk factors for cardiovascular events and deaths include hypertension, dyslipidemia, diabetes, obesity, diet, physical inactivity, and smoking (19). These components are associated with increased oxidation of low-density lipoprotein (LDL) cholesterol and the release of inflammatory cytokines (7).
Vitamin E is one of the most promising micronutrients for preventing CVD because of its antioxidant and anti-inflammatory properties (20). Low alpha-tocopherol concentrations have been associated with an increased incidence of CVD, while higher concentrations of this vitamin offer cardiovascular protection (21, 22). However, the studies that have evaluated this relationship present divergent results, reinforcing the need for further research (23, 24).
Thus, the aim of this study was to evaluate the relationship between alpha-tocopherol concentrations and anthropometric, biochemical, usual dietary intake, and cardiovascular risk indicators. Considering the evidence, the hypothesis under study is that lower serum concentrations of alpha-tocopherol are related to worse anthropometric, biochemical, usual dietary intake, and cardiovascular risk indicators.
2 Materials and methods
2.1 Ethical aspects
This study is part of a larger project, approved by the Research Ethics Committee (CEP) of the Onofre Lopes University Hospital of the Federal University of Rio Grande do Norte (HUOL/UFRN), CAAE n° 18923719.0.0000.5292, number 3.623.997. All eligible participants were informed of the study’s aims, risks, and benefits, and only those who agreed and signed the informed consent form participated. This study was conducted following all the ethical principles established in the Declaration of Helsinki (25).
2.2 Study design, participants and data collection
This is a cross-sectional study with data collection in two periods: October 2019 to March 2020 (first period interrupted due to the COVID-19 pandemic) and November 2021 to March 2023, in Natal, Rio Grande do Norte, Brazil. Convenience sampling was carried out, including volunteers over the age of 18 of both sexes, who agreed to participate in the study. Exclusion criteria were pregnant and/or breastfeeding women or individuals with cognitive impairment who were unable to answer the questionnaires, people using antimicrobials, antivirals or using vitamin E supplements, undergoing chemotherapy and/or radiotherapy or who had infection symptoms, such as diarrhea, vomiting or fever.
In total, 94 individuals were recruited to take part in the study through social media and/or telephone contact. Of these, 1 was excluded due to a low BMI and 1 due to the impossibility of collecting blood. In the end, 92 individuals took part in the study.
Sociodemographic data (age, gender, race, family income), anthropometric data (weight, height, waist, and hip circumference), lifestyle data (alcohol consumption, smoking, sedentary lifestyle), and self-reported diagnosis of chronic non-communicable diseases were collected using a revised standardized questionnaire based on the protocols of the National Health Survey (26). Duly trained nutrition students and nutritionists collected data. The participants underwent a peripheral vein puncture in the morning, after a 8-h fast, to assess the biochemical parameters, carried out by a trained nursing technician. 10 mL of blood were driven for biochemical (5 mL) and vitamin E status (5 mL) evaluation.
2.3 Anthropometric assessment
Weight, height, waist, hip circumference and blood pressure were measured. All measurements were performed on the same day, and the participants were barefoot, wearing light clothing and free of any adornments. For weight and height measurements, the volunteers were instructed to stand facing the assessor, with their heads aligned with the Frankfurt plane. BMI was calculated using the formula BMI = weight (Kg)/height (m)2. For BMI classification, the reference values proposed by the WHO were used (27). Waist circumference was measured with the individual in an orthostatic position and around the midpoint between the last rib and the iliac crest. Hip circumference was measured by circling the largest gluteal protuberance with the individual in the same position as mentioned above. Waist and hip circumferences were used to calculate the waist-to-hip ratio. The conicity index was determined using weight, height and waist circumference measurements, according to the mathematical equation proposed by Valdez (28). The visceral adiposity index was calculated with waist circumference, BMI, HDL-c, and triglycerides (29).
Body weight was measured using an electronic anthropometric scale (Líder® model P200M) with a capacity of 150 kg and precision of 0.1 kg. Height was measured using a portable stadiometer (Avanutri®) with a range of 20–210 cm and a graduation of 0.1 cm, fixed to a base, with a stabilizer to lean against the wall. A 200 cm ergonomic tape measure (Cescorf®) was used to measure waist and hip circumference. Blood pressure was measured using an automatic upper arm blood pressure device (Comfort - HEM 7122 - BR2 Omron® Healthcare, São Paulo, Brazil). The instruments were certified by the National Institute of Metrology, Standardization and Industrial Quality (INMETRO).
2.4 Evaluation of biochemical parameters
A total volume of 5 mL of blood was collected and stored in a tube without anticoagulant and with a separating gel, and then sent for analysis of total cholesterol and fractions, triglycerides, fasting glucose, fasting insulin and high-sensitivity C-reactive protein (hs-CRP), carried out by a reference laboratory.
Fasting blood glucose, total cholesterol and triglyceride levels were analyzed using enzymatic methods. High-density lipoprotein cholesterol (HDL-c) levels were measured using a homogeneous enzymatic colorimetric assay. Low-density lipoprotein cholesterol (LDL-c) values were calculated using the Friedewald formula [LDL-c = Total cholesterol - HDL-c + (Triglycerides/5)] (30). Non-HDL cholesterol (non-HDL-c) was determined using the difference between total cholesterol and HDL-c, as recommended by the Brazilian Society of Cardiology (31). Insulin was determined by sandwich immunoassay and hs-CRP by immunoturbidimetric assay. All these analyses were carried out using automated methods (COBAS 6000 - Roche® Professional Diagnostics, Risch-Rotkreuz, Switzerland).
The homeostasis model assessment of insulin resistance (HOMA-IR) was calculated from the product of glycemia and insulinemia divided by a normalization factor [HOMA-IR = glucose (mg/dL) × 0.0555 × insulin (mUI/L)/22.5]. The cut-off of >2.71 was adopted, which is indicative of insulin resistance, according to Genoleze et al. (32). To calculate the Homeostasis Model Assessment of beta cell function (HOMA-B), the following equation was used: 20 × fasting insulin (μU/mL)/fasting glucose (mmol/L) − 3.5 (%) (33).
2.5 Determination of alpha-tocopherol serum concentrations
Blood was collected (5 mL) by peripheral venipuncture for the determination of serum alpha-tocopherol in tubes protected from light. The blood was collected in the morning after an 8-h fast by a trained nursing technician. The blood was then centrifuged at room temperature for 10 min (500 × g) to separate and remove the serum. After this, two aliquots from each participant were stored in an ultra-freezer at −80 °C until biochemical analysis. The serum was analyzed according to Ortega et al. (34), adapted by Ribeiro et al. (35). For 1.0 mL of serum, the same amount of 95% Ethanol (Vetec, Rio Daniele Ingrid Naihara França Priscila Gomes Eva Débora de Oliveira Andrade Oliveira Sousa Souza Marinho do Nascimento Janeiro, Brazil) and 2 mL of Hexane PA (Vetec, Rio de Janeiro, Brazil) were used. The samples were homogenized for 1 min in a vortex and centrifuged for 10 min at 4000 rpm to separate the supernatant layer, which was then removed to another tube. These steps of adding hexane and removing the supernatant were carried out three times to extract the alpha-tocopherol in the serum. Finally, 4 mL of the pooled layer of supernatant was evaporated in a water bath at 37 °C and the dry extract was dissolved in 250 μL of absolute ethanol (Vetec, Rio de Janeiro, Brazil) for analysis using High Performance Liquid Chromatography (HPLC). The concentrations of alpha-tocopherol in the samples were determined by HPLC on a Shimadzu chromatograph (Shimadzu, Kyoto, Japan), consisting of a 20 μL injector loop, CBM 20A communicator, LC-20 AT pump, SPD-20A UV-VIS detector, C18 LIChrospher® 100 RP-18 column (5 μm) (Merck, Darmstadt, Germany) and a computer with LC Solution software (Shimadzu, Kyoto, Japan) for data processing. The chromatogram evolved in isocratic elution with a mobile phase of methanol in purity grade for HPLC and a flow rate of 1.0 mL per minute at a wavelength of 292 nm. The concentrations of alpha-tocopherol were identified and determined by comparison with the area of their respective standards (SigmaAldrich, São Paulo, Brazil), at a retention time of 10.3 min. The values in the samples were expressed in μmol/L and vitamin E deficiency was confirmed when serum alpha-tocopherol values below 12 μmol/L (<517 μg/dL) were found (36).
2.6 Usual dietary intake assessment
The usual dietary intake was estimated using two 24-h recalls (24hR). The 24hR were carried out on non-consecutive days, one face-to-face and the other by telephone survey, which made it possible to identify and quantify all the food, supplements and drinks consumed in the 24 h preceding the interview. The second 24hR was administered with an interval of 30–45 days between the application of the first recall, on different days of the week and at different times of the month, to avoid possible influences from the purchasing power of food and seasonality. For the present analysis, 79 participants presented two 24hR. Photographic records of home measurements and food portions were used during the individual interview to facilitate recording the amount of food consumed. This allowed the interviewees to point out which utensils were used in their daily lives and quantify the portions of food and drink consumed in small, medium, or large portions. A team of trained nutritionists collected the 24hR.
The preparations and their respective homemade measurements for each 24hR were organized in a Microsoft Excel® spreadsheet (Microsoft Office, 2010) according to the meals eaten: breakfast, morning snack, lunch, afternoon snack, dinner and supper, as reported by the participants. The homemade measures of each preparation were converted into grams, milliliters and/or liters, according to the IBGE tables (37) and Pinheiro et al. (38) in that order. Recipes were standardized according to Maciel et al. (39). The standardized recipes contained the raw ingredients, cooking factors and the final amount of cooked ingredients, according to the weight of the cooked preparation eaten.
Then, foods were chemically analyzed using the Brazilian food composition tables: TBCA (2023) (40), TACO (2011) (41), IBGE (2011) (42) and Philippi (2002) (43), following that order. Nutritional information obtained directly from food labels was also considered when there was no information in the aforementioned tables and/or in the case of ultra-processed foods. The nutrients analyzed were: energy, fiber, protein, carbohydrates, total fat, saturated fat, monounsaturated fat, polyunsaturated fat and vitamin E.
Regarding the estimation of usual dietary intake, once the chemical analysis was completed, habitual consumption was assessed and intrapersonal variability was adjusted using the Multiple Source Method (MSM) (Department of Epidemiology, German Institute of Human Nutrition, Potsdam-Rehbrücke, version 1.0.1)1. Initially, the nutrients were tested for normality and those with a parametric distribution were energy, fiber, protein, carbohydrates, total fat, saturated fat, monounsaturated fat, polyunsaturated fat and vitamin E. These nutrients were then corrected for energy intake using the Statistical Package for the Social Sciences software (IBM SPSS Statistics 26). After adjusting for energy, the nutrients were tested again for normality, with fiber, protein, total fat, saturated fat, monounsaturated fat, polyunsaturated fat and vitamin E presenting non-parametric distribution and carbohydrates presenting parametric distribution.
2.7 Cardiovascular risk estimation
Cardiovascular risk was estimated using the Framingham global risk score (GRS), which assesses cardiovascular risk considering the following variables: gender, age, smoking, HDL-c, total cholesterol and systolic blood pressure. Individuals were classified according to the likelihood of having cardiovascular events in 10 years, as follows: (1) low risk: those with GRS < 5%; (2) intermediate risk: men with GRS between 5% and 20% and women with GRS between 5% and 10%; (3) high risk: men with GRS > 20% and women with GRS > 10% and (4) very high risk: individuals with atherosclerotic disease with or without clinical events (44).
2.8 Statistical analysis
The database was built using Microsoft Excel® (Microsoft Office, 2010) and Statistical Package for Social Sciences version 23.0 (SPSS Inv. Chicago, IL). All quantitative variables were tested for normality using the Kolmogorov-Sminorv test. Variables with a normal distribution were represented as means (standard deviation) and those without a normal distribution were presented as medians (Q1; Q3). The Student’s T-test was used for variables with a normal distribution and the Mann-Whitney test for variables without a normal distribution to test whether there was a difference between the quantitative variables. The Chi-Square test was used to analyze categorical variables. The results were considered significant when they showed a significance level of less than 5% (p < 0.05).
Pearson’s coefficient (r) was used for variables with a normal distribution and Spearman’s coefficient (ρ) for variables without a normal distribution to determine the correlations between alpha-tocopherol serum concentrations and anthropometric, biochemical, dietary, and cardiovascular risk parameters variables. A multiple linear regression model was built considering alpha-tocopherol/total cholesterol serum concentrations as the dependent variable, considering the positive expected associations between alpha-tocopherol and total cholesterol (45–47). The independent variables in the final models were selected considering multicollinearity and those with r > 0.7 were excluded. Tolerance values above 0.10 and variance inflation factors below 10 were also considered when selecting the independent variables for the final model. Residual scatter plots were used to assess outliers, normality, linearity, homoscedasticity and independence of residuals. GRS, conicity index and usual total fat intake were the independent variables selected in the final model. The multiple linear regression model was presented with the β standardized regression coefficients, 95% confidence intervals (CI) and p-values. Power analysis was conducted a posteriori for the linear multiple regression, considering an effect size of 0.15, alpha at 0.05, number of predictors = 3, and total sample size = 92, using GPower software, and the achieved power was of 95.7%. The post hoc power analysis indicated that the sample size was sufficient to detect medium effect sizes with a power exceeding 80%, lending confidence to the statistical findings.
3 Results
Mean alpha-tocopherol serum concentrations in the study population was of 17.80 (8.43) μmol/L. The studied population was then stratified into two groups using alpha-tocopherol serum concentrations <P50 or ≥P50, and the socioeconomic, anthropometric, biochemical, dietary usual intake, and clinical characteristics of the 92 participants are shown accordingly in Table 1. There was a predominance of females in the studied population, but alpha-tocopherol serum concentrations were not associated with sex. Total cholesterol, non-HDL-c and LDL-c were significantly higher in individuals with higher serum alpha-tocopherol concentrations. The hs-CRP was significantly lower in individuals with higher concentrations of alpha-tocopherol. The GRS percentage was not different between the studied groups and was 10% for the total population. Usual dietary intake was also not different between the studied groups (Table 1).
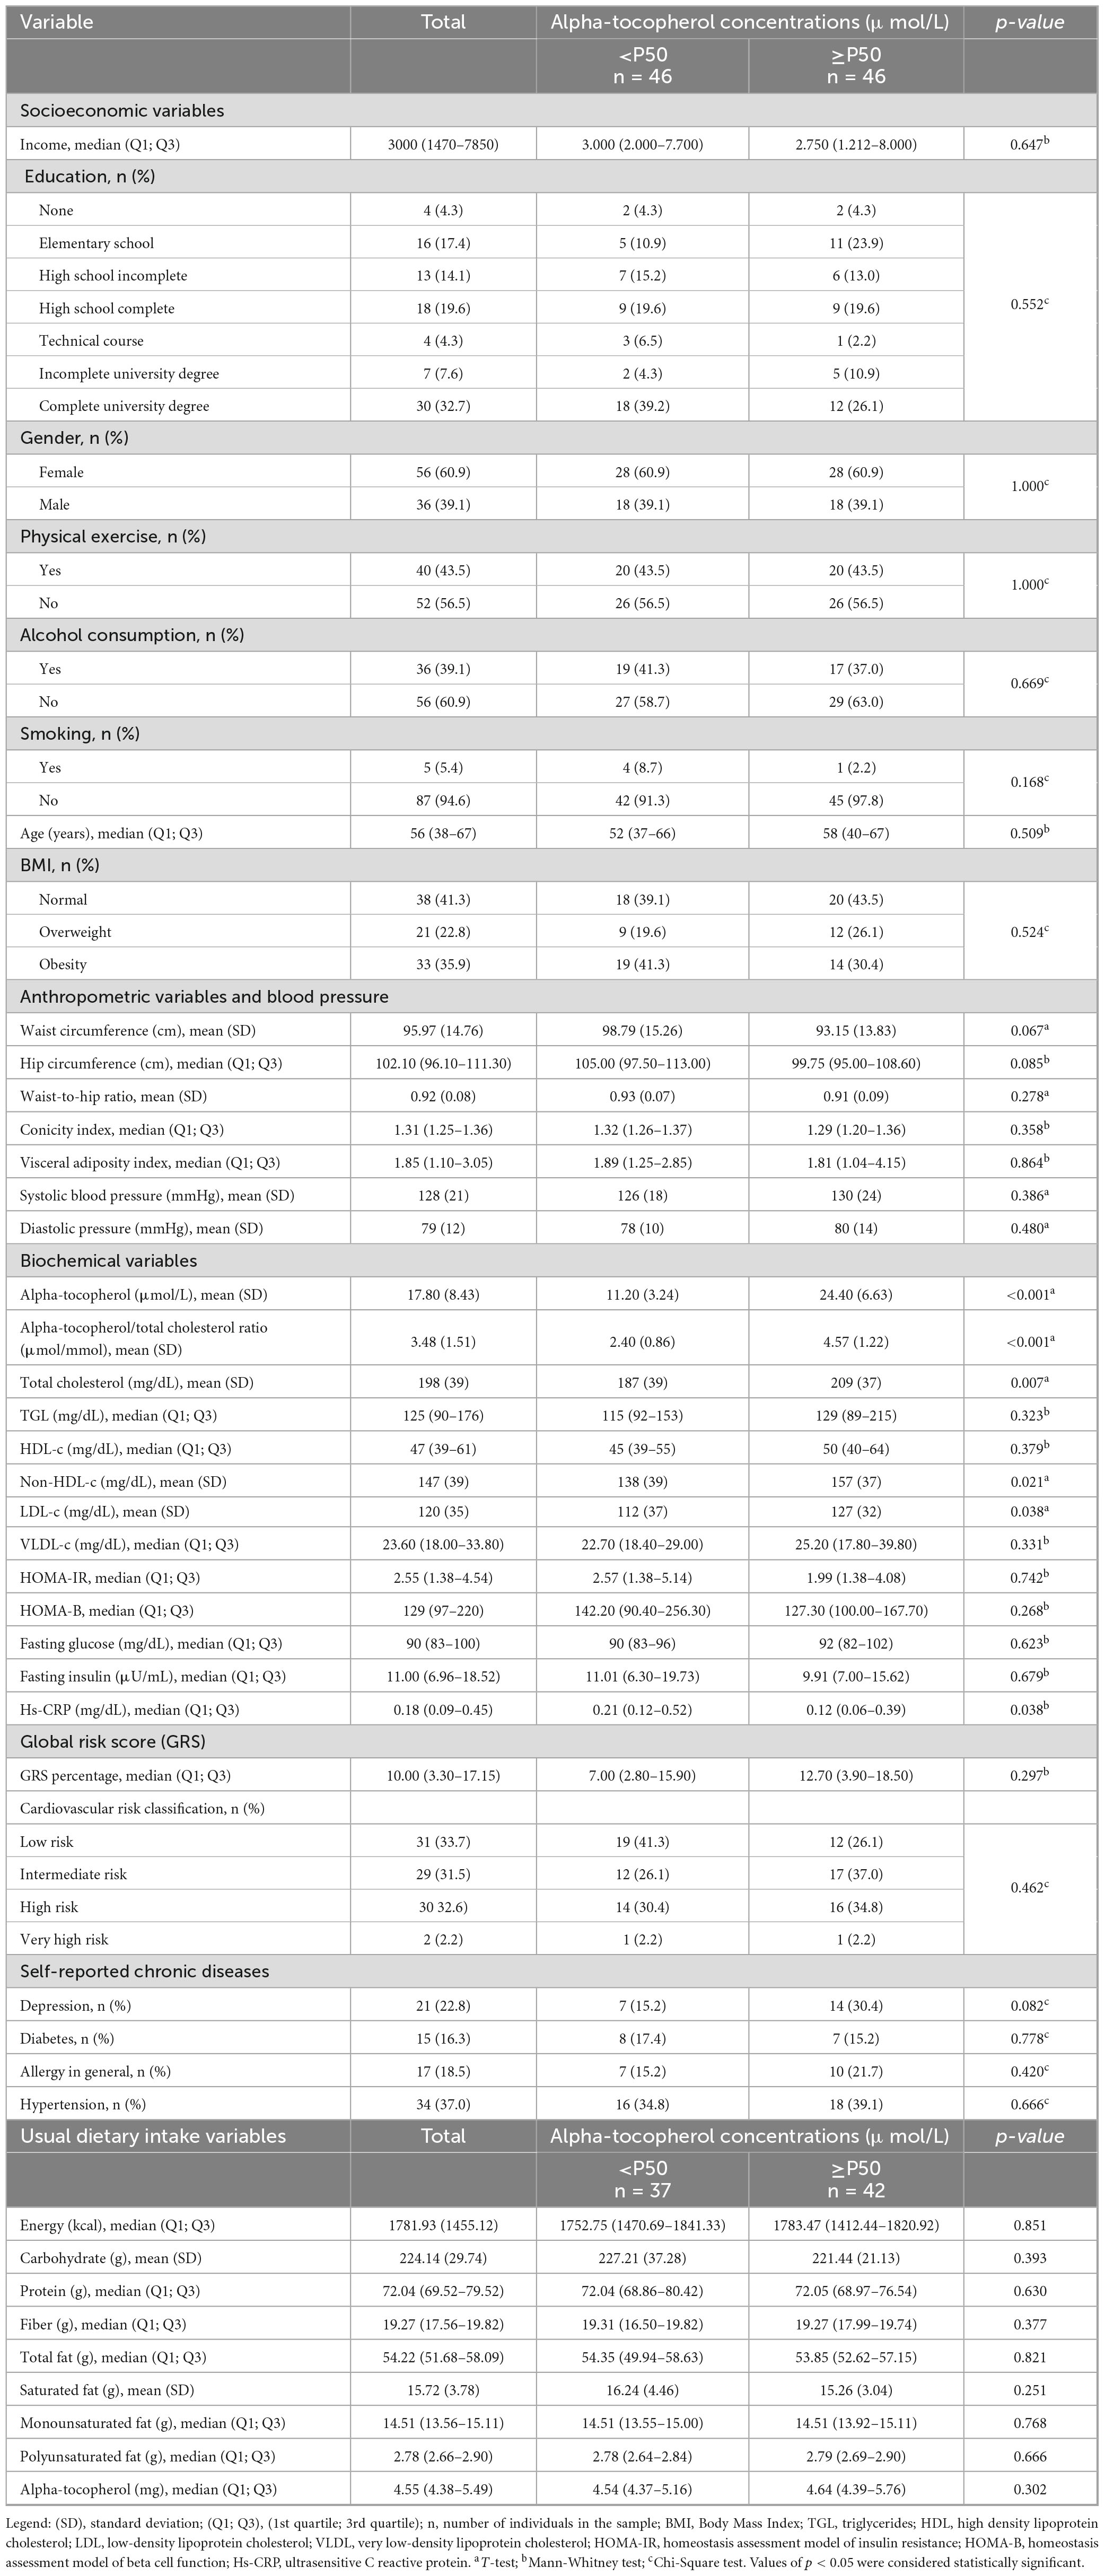
Table 1. Socioeconomic, anthropometric, biochemical, clinical characteristics, and dietary usual intake of the study population according to alpha-tocopherol concentrations.
We further considered the alpha-tocopherol/total cholesterol ratio, and no significant correlations with anthropometric, biochemical, habitual dietary intake and cardiovascular risk variables were observed in the study population (Table 2).
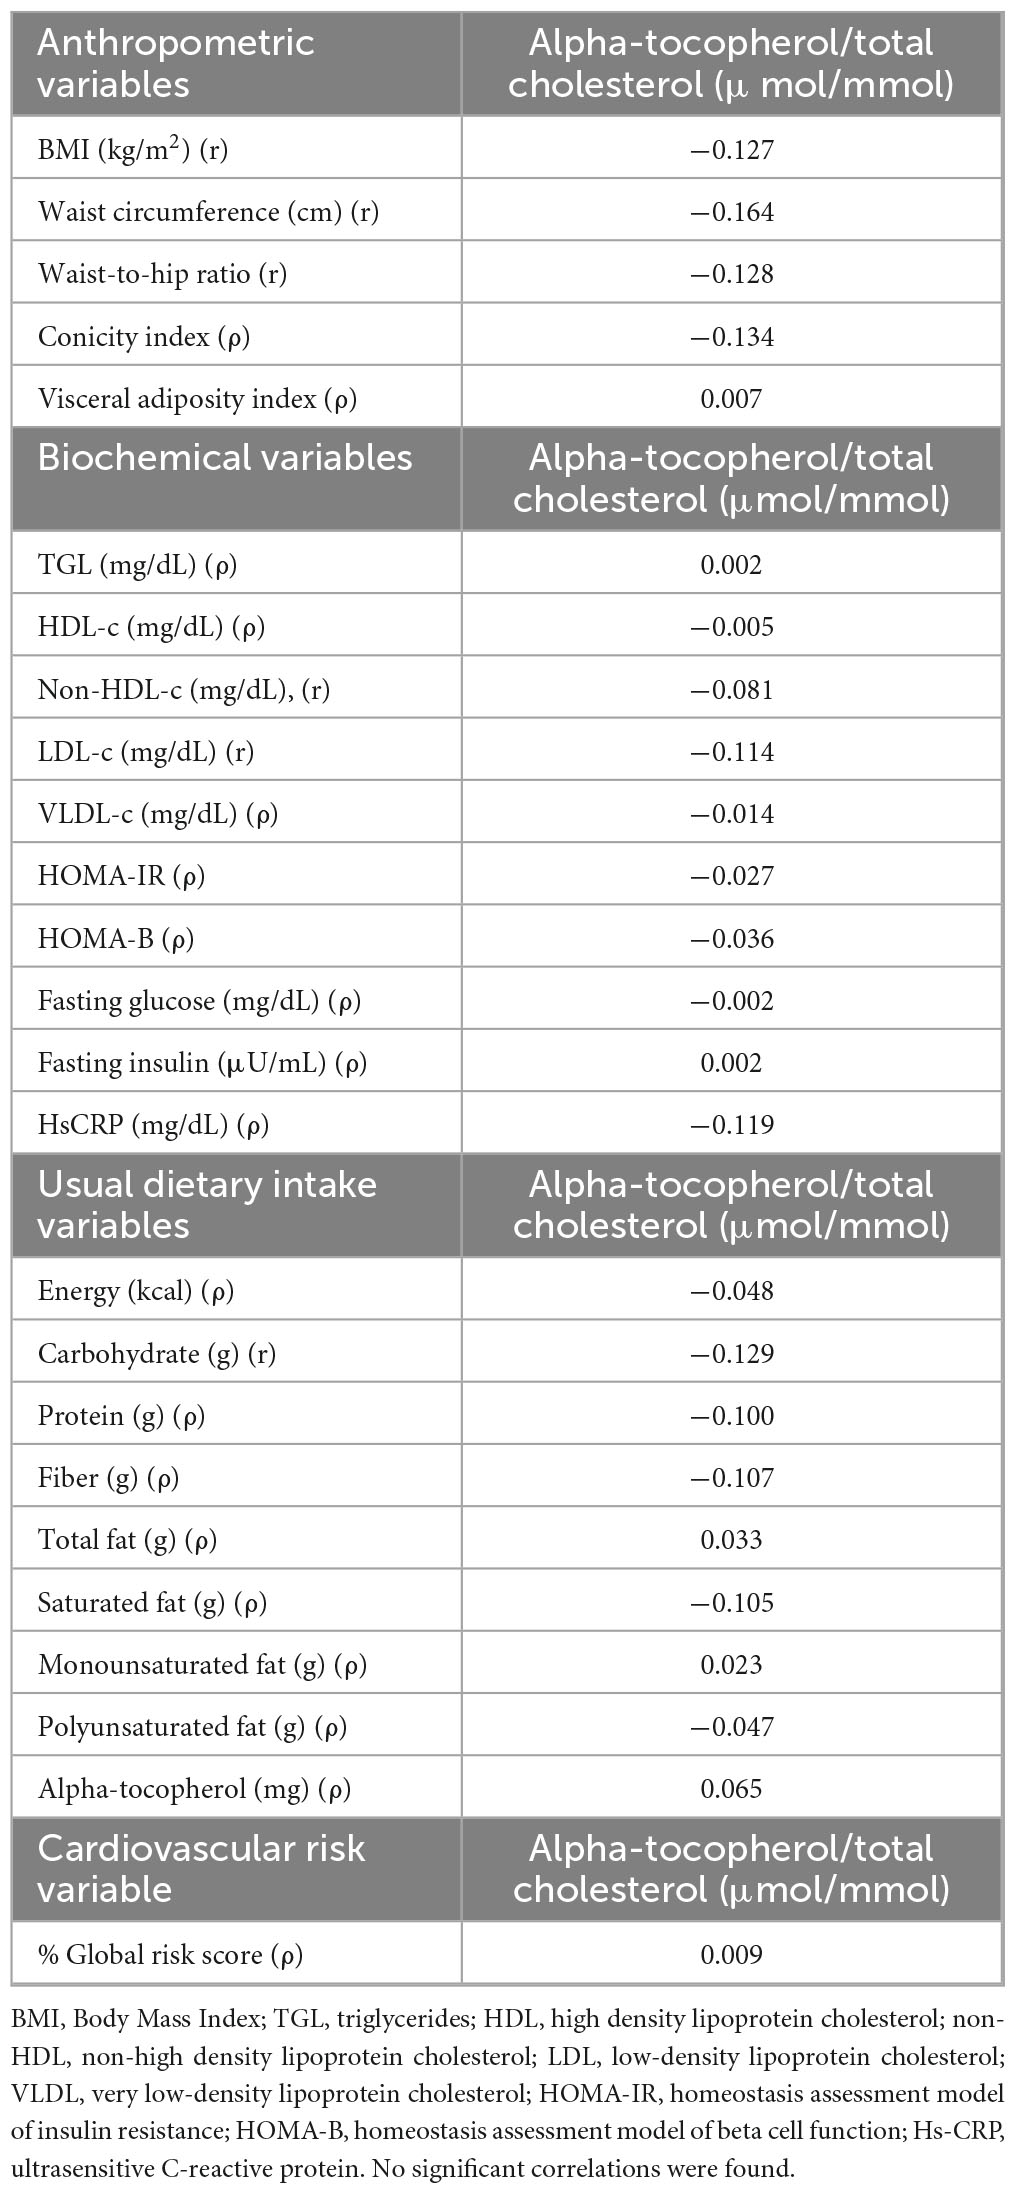
Table 2. Pearson (r) and Spearman (ρ) correlations between alpha-tocopherol/total cholesterol ratio and anthropometric, biochemical, dietary usual intake, and cardiovascular risk variables in the studied population.
The multiple linear regression model showed that GRS was positively associated (β = 0.328; 95% CI 0.015, 0.100; p = 0.009) and the conicity index was negatively associated (β = −0.290; 95% CI −8.196, −0.728; p = 0.020) with the concentrations of the alpha-tocopherol/total cholesterol (Table 3).
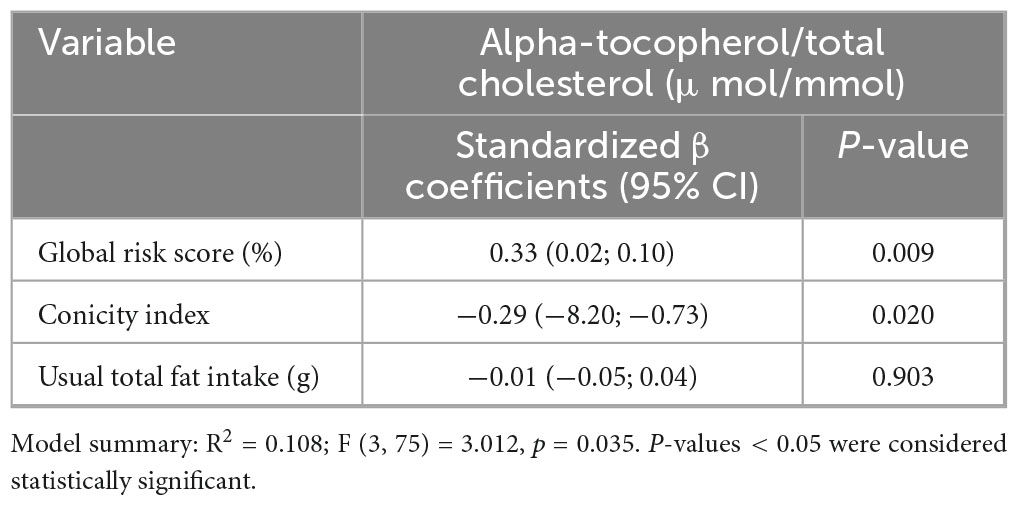
Table 3. Multiple linear regression model between alpha-tocopherol/total cholesterol (μmol/L), global risk score (GRS), conicity index, and total fat.
4 Discussion
The present study evaluated alpha-tocopherol serum concentrations and its relationship with anthropometric, biochemical, usual dietary intake, and cardiovascular risk parameters. As expected (45–47), alpha-tocopherol was positively associated with lipid fractions, such as total cholesterol, non-HDL-c and LDL-c. Participants with higher serum alpha-tocopherol exhibited significantly lower hs-CRP levels. In the multiple regression, GRS was positively associated and the conicity index negatively associated with alpha-tocopherol/total cholesterol concentrations. These results reinforce that alpha-tocopherol concentrations are associated with cholesterol and lipoproteins, adding to the existing literature that alpha-tocopherol serum concentrations may be correlated with inflammation and cardiovascular risk measured by the GRS.
As expected, our results showed that individuals with higher serum concentrations of alpha-tocopherol presented higher values of total cholesterol, non-HDL-c, and LDL-c. Vitamin E’s metabolism is associated with lipoproteins, and it is transported by lipophilic molecules that subsequently distribute alpha-tocopherol to the liver, organs, and tissues (45). Thus, the action of LDL-c can be highlighted as one of the main transporters of alpha-tocopherol, which may justify our findings (46).
Our findings showed that participants with higher serum alpha-tocopherol exhibited significantly lower hs-CRP concentrations. hs-CRP stands out as an important biomarker for detecting inflammation, infections and the risk of developing cardiovascular diseases (48). In this sense, the action of alpha-tocopherol may suppress the production of the inflammatory cytokine IL-6, which binds to receptors on liver cells and stimulates the synthesis of CRP (49). Another associated mechanism, which has not been fully elucidated, is the dephosphorylation of protein kinase C (PKC), since alpha-tocopherol can activate activation protein 1 (AP-1) which will dephosphorylate PKC and inhibit the proliferation of smooth muscle cells, reducing the production of reactive oxygen species by monocytes (50–52). Thus, alpha-tocopherol, due to its ability to modulate inflammatory and oxidative responses, acts by reducing pro-inflammatory signaling and, consequently, hepatic CRP synthesis (1, 49).
Regarding the relationship between vitamin E and cardiovascular risk parameters, the role of alpha-tocopherol in the prevention of CVD is widely discussed due to its antioxidant capacity and anti-inflammatory properties (21). In addition to their antioxidant action, tocopherols are also inhibitors of platelet aggregation and can act to inhibit thrombi (53). Observational studies have suggested that serum concentrations of alpha-tocopherol ≥ 30 μmol/L are associated with a possible protective effect against cardiovascular diseases (11). In the present study, the evaluated individuals presented a mean alpha-tocopherol serum concentration of 17.80 μmol/L. Considering that serum concentrations of α-tocopherol ≥ 30 μmol/L are indicative cardioprotective effect, the individuals evaluated in this study may be at increased risk of developing cardiovascular diseases.
Although we identified significant hs-CRP and other biochemical differences in the groups evaluated, no differences were observed in vitamin E usual dietary intake. This result can be attributed to factors that modify the bioavailability, metabolism and transport of this vitamin in the body. For example, the intestinal absorption of alpha-tocopherol is influenced by individual characteristics and the composition of the diet (54). Thus, the food matrix in which vitamin E is found represents an essential factor in its absorption. It is important to note that the amount of fat provided in the diet aims to facilitate the extraction of vitamin E from its food matrix, thereby stimulating bile secretion and promoting the formation of micelles (55). In the liver, the alpha-tocopherol transfer protein (alpha-TTP) directs alpha-tocopherol to plasma lipoproteins, allowing it to be distributed systemically (56). In addition, genetic polymorphisms, such as in the TTPA gene, which encodes alpha-TTP, can compromise the distribution of alpha-tocopherol, regardless of dietary intake (57).
In the present study, the linear regression showed that the percentage of GRS was positively associated with the alpha-tocopherol/total cholesterol serum concentrations. The GRS is a widely used tool for predicting the risk of cardiovascular events over a 10-years period and considers variables such as age, total cholesterol and its fractions, blood pressure, smoking and diabetes (44). The positive association found in our study can be explained by the fact that alpha-tocopherol circulates in the plasma by binding to lipoproteins, especially LDL and HDL – variables that are included in the GRS calculation. Therefore, individuals with dyslipidemia or hypercholesterolemia, conditions that increase the concentrations of these lipoproteins, may present higher serum concentrations of alpha-tocopherol. However, this increase may reflect greater action and availability of lipid transporters in the blood and not necessarily a protective effect of vitamin E on cardiovascular risk (58). In this sense, this association may reflect an increase in the transport of lipoprotein-bound alpha-tocopherol, particularly in individuals with high LDL cholesterol levels, rather than a causal cardioprotective effect. In addition, it is worth noting that individuals at higher cardiovascular risk may have greater oxidative stress and inflammation. In these conditions, there is a greater demand for vitamin E by the body due to its antioxidant action which protects cell membranes from lipid peroxidation and oxidative damage, which may result in an increase in serum vitamin E serum concentrations (59).
Some studies have found inverse associations between alpha-tocopherol serum concentrations and CVD mortality (60, 61). Huang et al. (23) followed men for a period of 30 years and observed that higher alpha-tocopherol serum concentrations correlated with a lower risk of general and specific mortality, including CVD causes. However, the literature also reports studies that did not observe this possible protective action of vitamin E, demonstrating that the comprehension of the relationship between vitamin E and CVD is still evolving (53, 62, 63). CVD diseases are multifactorial and complex, as is vitamin E metabolism, which is why more studies are needed to better elucidate these associations (7).
The multiple linear regression also showed that the conicity index was negatively associated with the alpha-tocopherol/total cholesterol ratio. The conicity index is a useful anthropometric indicator for assessing central adiposity and predicting the risk of cardiometabolic diseases using waist circumference, height, and weight measurements (28). The conicity index calculation implies that the accumulation of fat in the abdominal region alters body geometry, promoting the transition from a cylindrical shape to a shape like a double cone (64). When evaluating the associations between adiposity and serum concentrations of alpha-tocopherol, Szewczyk et al. (58) found that individuals with higher anthropometric measurements of waist circumference, hip circumference, and waist-to-hip ratio had lower alpha-tocopherol serum concentrations. Other studies have also reinforced this association between higher anthropometric measurements and lower alpha-tocopherol serum concentrations, which agrees with our findings (65, 66). These associations observed in individuals with obesity can be explained by different reasons, including increased oxidative stress, low dietary intake of foods that are sources of vitamin E, and the possible sequestration of alpha-tocopherol by adipose tissue (67, 68).
Limitations of this research include the cross-sectional nature of the study, which makes it impossible to establish cause-and-effect relationships. Therefore, the directionality of the associations cannot be assumed. For example, although an association between higher alpha-tocopherol and LDL serum concentrations was observed, it is not possible to infer whether high LDL levels lead to increased transport of alpha-tocopherol or whether alpha-tocopherol can influence LDL concentrations. Furthermore, it is important to emphasize that the linear regression model, despite revealing statistically significant associations, showed a modest effect size, reflecting that alfa-tocopherol should not be considered in isolation as a reliable predictor of cardiovascular risk. Other limitations of this study are the small sample size, which may have interfered with the identification of other statistically significant relationships, and convenience sampling, which may induce selection bias and compromise the representativeness of the sample. Women predominated among participants, and metabolic and hormonal characteristics differ between the sexes. However, alpha-tocopherol concentrations were not associated with sex in our analysis. Finally, although dietary intake and serum alpha-tocopherol were not correlated, it is important to note that all participants who used vitamin E supplements were excluded, minimizing the confusion caused by exogenous intake.
As strengths, few studies have investigated serum alpha-tocopherol concentrations and their relationship with anthropometric, biochemical, usual dietary intake, and cardiovascular risk parameters. In the literature, there are no studies that directly explored the associations between GRS and conicity index with alpha-tocopherol/total cholesterol serum concentrations. The available studies have observed associations between vitamin E and other variables related to cardiovascular disease and cardiovascular risk (69, 70). Thus, to date, this is the first study to find positive associations between GRS and alpha-tocopherol/total cholesterol serum concentrations, and negative associations between conicity index and alpha-tocopherol/total cholesterol. Moreover, recent data from Brazilian national surveys have shown percentages of individuals with overweight (approximately 60%) and obesity (approximately 25%), comparable to the sample in this study (71, 72). Therefore, our study’s results can contribute to the planning of strategies and public policies aimed at preventing and treating overweight/obesity and cardiovascular diseases, ultimately leading to lower costs for healthcare systems.
5 Conclusion
Our data demonstrated that serum alpha-tocopherol concentrations were positively associated with total cholesterol, non-HDL cholesterol, LDL cholesterol, and GRS, and were inversely related to hs-CRP levels. Additionally, the conicity index showed a negative association with the alpha-tocopherol/total cholesterol ratio. These findings suggest that alpha-tocopherol status is linked to both lipid profile and cardiovascular risk indicators in the study population. The results showed that the population studied may be more vulnerable to metabolic alterations associated with low-grade inflammation and greater cardiovascular risk. Further studies should assess the possible influence of other variables, such as age and hormone profile, on alpha-tocopherol serum concentrations and their relationship with overweight/obesity and cardiovascular risk parameters.
Data availability statement
The original contributions presented in this study are included in this article/supplementary material, further inquiries can be directed to the corresponding author.
Ethics statement
The studies involving humans were approved by Research Ethics Committee (CEP) of the Onofre Lopes University Hospital of the Federal University of Rio Grande do Norte (HUOL/UFRN), CAAE n° 18923719.0.0000.5292, number 3.623.997. The studies were conducted in accordance with the local legislation and institutional requirements. The participants provided their written informed consent to participate in this study.
Author contributions
AM: Data curation, Formal analysis, Investigation, Methodology, Writing – original draft, Writing – review & editing. MC: Data curation, Formal analysis, Investigation, Methodology, Writing – review & editing. MB: Data curation, Investigation, Methodology, Writing – review & editing. DS: Data curation, Formal analysis, Investigation, Methodology, Writing – review & editing. IS: Investigation, Methodology, Writing – review & editing. PO: Data curation, Formal analysis, Investigation, Methodology, Writing – review & editing. EO: Investigation, Visualization, Writing – review & editing. KS: Resources, Supervision, Validation, Visualization, Writing – review & editing. BM: Conceptualization, Data curation, Formal analysis, Funding acquisition, Investigation, Methodology, Project administration, Resources, Supervision, Validation, Writing – original draft, Writing – review & editing.
Funding
The author(s) declare that financial support was received for the research and/or publication of this article. This work received financial support from the National Council for Scientific and Technological Development (CNPq) (process number: 406353/2018-2) and the Coordination for the Improvement of Higher Education Personnel (CAPES) - Financial Code 001.
Acknowledgments
We would like to thank the volunteers who gave their valuable time to take part in the study.
Conflict of interest
The authors declare that the research was conducted in the absence of any commercial or financial relationships that could be construed as a potential conflict of interest.
The author(s) declared that they were an editorial board member of Frontiers, at the time of submission. This had no impact on the peer review process and the final decision.
Generative AI statement
The author(s) declare that no Generative AI was used in the creation of this manuscript.
Any alternative text (alt text) provided alongside figures in this article has been generated by Frontiers with the support of artificial intelligence and reasonable efforts have been made to ensure accuracy, including review by the authors wherever possible. If you identify any issues, please contact us.
Publisher’s note
All claims expressed in this article are solely those of the authors and do not necessarily represent those of their affiliated organizations, or those of the publisher, the editors and the reviewers. Any product that may be evaluated in this article, or claim that may be made by its manufacturer, is not guaranteed or endorsed by the publisher.
Footnotes
References
1. Szewczyk K, Chojnacka A, Górnicka M. Tocopherols and tocotrienols—bioactive dietary compounds; what is certain, what is doubt? Int J Mol Sci. (2021) 22:1–17. doi: 10.3390/ijms22126222
2. Galli F, Azzi A, Birringer M, Cook-Mills J, Eggersdorfer M, Frank J, et al. Vitamin E: emerging aspects and new directions. Free Radic Biol Med. (2017) 102:16–36. doi: 10.1016/j.freeradbiomed.2016.09.017
3. Peter S, Moser U, Pilz S, Eggersdorfer M, Weber P. The challenge of setting appropriate intake recommendations for vitamin E: considerations on status and functionality to defi ne nutrient requirements. Int J Vitamin Nutr Res. (2014) 83:129–36. doi: 10.1024/0300-9831/a000153
4. Miyazawa T, Burdeos G, Itaya M, Nakagawa K, Miyazawa T. Vitamin E: regulatory redox interactions. IUBMB Life. (2019) 71:430–41. doi: 10.1002/iub.2008
5. Lee G, Han S. The role of vitamin E in immunity. Nutrients. (2018) 10:1–18. doi: 10.3390/nu10111614
6. Traber M. Vitamin E inadequacy in humans: causes and consequences. Adv Nutr. (2014) 5:503–14. doi: 10.3945/an.114.006254
7. Costa Lemos da Silva AG, da Silva Ribeiro KD, Alwves de Araújo GE, da Silva Oliveira L, de Oliveira Lyra C. Vitamin E and cardiovascular diseases: an interest to public health? Nutr Res Rev. (2023) 37:131–40. doi: 10.1017/S0954422423000112
8. EFSA Panel on Nutrition, Novel Foods and Food Allergens (NDA). Scientific opinion on the tolerable upper intake level for vitamin E. EFSA J. (2024) 22:8352. doi: 10.2903/j.efsa.2024.8352
9. Meydani S, Han S, Wu D. Vitamin E and immune response in the aged: molecular mechanisms and clinical implications. Immunol Rev. (2005) 205:269–84. doi: 10.1111/j.0105-2896.2005.00274.x
10. Institute of Medicine (IOM). Food nutrition board. dietary reference Intakes for energy, carbohydrate, fiber, fat, fatty acids, cholesterol, protein, and amino acids (macronutrients). Institute Med. (2002) 102:1621–30. doi: 10.1016/s0002-8223(02)90346-9
11. Péter S, Friedel A, Roos F, Wyss A, Eggersdorfer M, Hoffmann K, et al. A systematic review of global alpha-tocopherol status as assessed by Nutritional intake levels and blood serum concentrations. Int J Vitamin Nutr Res. (2015) 85:261–81. doi: 10.1024/0300-9831/a000102
12. Niki E, Traber MG. A history of vitamin E. Ann Nutr Metab. (2012) 61:207–12. doi: 10.1159/000343106
13. Hamułka J, Górnicka M, Sulich A, Frąckiewicz J. Weight loss program is associated with decrease α-tocopherol status in obese adults. Clin Nutr. (2019) 38:1861–70. doi: 10.1016/j.clnu.2018.07.011
14. Paes-Silva R, Gadelha P, Lemos M, Castro CMMB, Arruda IKG, Diniz A. Adiposity, inflammation and fat-soluble vitamins in adolescents. J Pediatr. (2019) 95:575–83. doi: 10.1016/j.jped.2018.05.008
15. Wallström P, Wirfält E, Lahmann P, Gullberg B, Janzon L, Berglund G. Serum concentrations of β-carotene and α-tocopherol are associated with diet, smoking, and general and central adiposity. Am J Clin Nutr. (2001) 73:777–85. doi: 10.1093/ajcn/73.4.777
16. Neuhouser M, Rock C, Eldridge A, Kristal A, Patterson R, Cooper D, et al. Serum Concentrations of retinol, alpha-tocopherol and the carotenoids are influenced by diet, race and obesity in a sample of healthy adolescents. J Nutr. (2001) 131:2184–91. doi: 10.1093/jn/131.8.2184
17. Öhrvall M, Tengblad S, Vessby B. Lower tocopherol serum levels in subjects with abdominal adiposity. J Intern Med. (1993) 234:53–60. doi: 10.1111/j.1365-2796.1993.tb00704.x
18. Lopez-Jimenez F, Almahmeed W, Bays H, Cuevas A, Di Angelantonio E, le Roux CW, et al. Obesity and cardiovascular disease: mechanistic insights and management strategies. A joint position paper by the world heart federation and world obesity federation. Eur J Prev Cardiol. (2022) 29:2218–37. doi: 10.1093/eurjpc/zwac187
19. Kabat G, Heo M, Ochs-Balcom H, Leboff M, Mossavar-Rahmani Y, Adams-Campbell L, et al. Longitudinal association of measures of adiposity with serum antioxidant concentrations in postmenopausal women. Eur J Clin Nutr. (2016) 70:47–53. doi: 10.1038/ejcn.2015.74
20. Mathur P, Ding Z, Saldeen T, Mehta J. Tocopherols in the prevention and treatment of atherosclerosis and related cardiovascular disease. Clin Cardiol. (2015) 38:570–6. doi: 10.1002/clc.22422
21. Ziegler M, Wallert M, Lorkowski S, Peter K. Cardiovascular and metabolic protection by vitamin E: a matter of treatment strategy? Antioxidants. (2020) 9:1–37. doi: 10.3390/antiox9100935
22. Sozen E, Demirel T, Ozer N. Vitamin E: regulatory role in the cardiovascular system. IUBMB Life. (2019) 71:507–15. doi: 10.1002/iub.2020
23. Huang J, Weinstein S, Yu K, Männistö S, Albanes D. Relationship between serum alpha-tocopherol and overall and cause-specific mortality. Circ Res. (2019) 125:29–40. doi: 10.1161/CIRCRESAHA.119.314944
24. Hak A, Stampfer M, Campos H, Sesso H, Gaziano J, Willett W, et al. Plasma carotenoids and tocopherols and risk of myocardial infarction in a low-risk population of US male physicians. Circulation. (2003) 108:802–7. doi: 10.1161/01.CIR.0000084546.82738.89
25. World Medical Association. World medical association declaration of Helsinki: ethical principles for medical research involving human subjects. JAMA. (2025) 333:71–4. doi: 10.1001/jama.2024.21972
26. Instituto Brasileiro de Geografia e Estatiìstica. Coordenaçaϸo de Trabalho e Rendimento, Brasil. Percepção do Estado de Saúde Estilos de Vida e Doenças Crônicas. M da S. Pesquisa Nacional de Sauìde 2013 [Coordination of Labor and Income, Brazil. Perception of Health Status, Lifestyles, and Chronic Diseases. M of S. National Health Survey 2013]. (2013). Portuguese. Available online at: https://sidra.ibge.gov.br/pesquisa/pns/pns-2013 (accessed March 5, 2024).
27. World Health Organization. Physical Status: the Use of and Interpretation of Anthropometry, Report of a WHO Expert Committee. Genebra: World Health Organization (1995). 463 p.
28. Valdez R, Valdez DR. A simple model-based index adiposity. J Clio Epidemiol. (1991) 44:55–6. doi: 10.1016/0895-4356(91)90059-i
29. Amato M, Giordano C. Visceral adiposity index: an indicator of adipose tissue dysfunction. Int J Endocrinol. (2014) 2014:1–7. doi: 10.1155/2014/73082
30. Friedewald W, Levy R, Fredrickson D. Estimation of the concentration of low-density lipoprotein cholesterol in plasma, without use of the preparative ultracentrifuge. Clin Chem. (1972) 18:409–502.
31. Faludi A. Atualização da diretriz Brasileira de dislipidemias e prevenção da aterosclerose [Update of the Brazilian guideline on dyslipidemia and atherosclerosis prevention]. Arq Bras Cardiol. (2017) 109:1–76. Portuguese. doi: 10.5935/abc.20170121
32. Geloneze B, Vasques A, Stabe C, Pareja J, Rosado L, Queiroz EC, et al. HOMA1-IR and HOMA2-IR indexes in identifying insulin resistance and metabolic syndrome: Brazilian metabolic syndrome study (BRAMS). Arq Bras Endocrinol Metab. (2009) 53:281–7. doi: 10.1590/S0004-27302009000200020
33. Levy J, Matthews D, Hermans M. Correct Homeostasis model assessment (HOMA) evaluation uses the computer program. Diabetes Care. (1998) 21:2191–2. doi: 10.2337/diacare.21.12.2191
34. Ortega R, López-Sobaler A, Elena Quintas M, Martínez R, Andrés P. The influence of smoking on vitamin C status during the third trimester of pregnancy and on vitamin C levels in maternal milk. J Am Coll Nutr. (1998) 17:379–84. doi: 10.1080/07315724.1998.10718779
35. Da Silva Ribeiro KD, Lima MSR, Medeiros JFP, de Sousa Rebouças A, Dantas RCS, Bezerra DS, et al. Association between maternal vitamin E status and alpha-tocopherol levels in the newborn and colostrum. Matern Child Nutr. (2016) 12:801–7. doi: 10.1111/mcn.12232
37. Instituto Brasileiro de Geografia e Estatística - IBGE. Tabela de Medidas Referidas para os Alimentos Consumidos no Brasil [Table of Reference Measures for Food Consumed in Brazil [Table of Reference Measures for Food Consumed in Brazil [Table of Reference Measures for Food Consumed in Brazil]. Rio de Janeiro: IBGE (2011). 545 p. Portuguese.
38. Vieira Pinheiro A, de Aquino Lacerda E, Haim E, da Silva Gomes MC, da Costa VM. Tabela Para Avaliação de Consumo Alimentar em Medidas Caseiras [Table for Assessing Food Consumption in Household Measures]. Atheneu. Atheneu, editor. São Paulo: Atheneu (2002). Portuguese.
39. Maciel B, Freitas E, Passos T. Manual para Elaboração de Fichas Técnicas de Preparação e Oficinas Culinárias [Manual for preparing Technical Preparation Sheets and culinary workshops]. Edufrn: Brazil (2021). 223 p. Portuguese.
40. Universidade de São Paulo (USP). Food Research Center (FoRC). Versão 7.2. Tabela Brasileira de Composição de Alimentos – TBCA [Version 7.2. Brazilian Food Composition Table – TBCA]. São Paulo: USP (2023). Portuguese.
41. Núcleo de Estudos e Pesquisas em alimentação (NEPA), Universidade Estadual de Campinas (UNICAMP). Tabela Brasileira de Composição de Alimentos – TACO. 4th ed [Brazilian Food Composition Table – TACO. 4th ed]. Campinas: Faculdade de Engenharia de Alimentos (2011). 161 p. Portuguese.
42. Instituto Brasileiro de Geografia e Estatística (IBGE). Pesquisa de Orçamentos Familiares 2008 - 2009 - Tabela de Composição Nutricional dos Alimentos do Brasil [Household Budget Survey 2008-2009 - Nutritional Composition Table of Foods in Brazil]. Rio de Janeiro: IBGE (2011). p. 1–351. Portuguese.
44. Précoma D, Oliveira G, de Simão AF, Dutra OP, Coelho-Filho OR, Izar MCO, et al. Updated Cardiovascular Prevention Guideline of the Brazilian Society of Cardiology – 2019. Arq Bras Cardiol. (2019) 113:787–891. doi: 10.5935/abc.20190204
45. Kono N, Arai H. Intracellular transport of fat-soluble Vitamins A and E. Traffic. (2015) 16:19–34. doi: 10.1111/tra.12231
46. Schmölz L. Complexity of vitamin E metabolism. World J Biol Chem. (2016) 7:14–43. doi: 10.4331/wjbc.v7.i1.14
47. Zerbinati C, Galli F, Regolanti R, Poli G, Iuliano L. Gas chromatography-mass spectrometry microanalysis of alpha- and gamma-tocopherol in plasma and whole blood. Clin Chim Acta. (2015) 446:156–62. doi: 10.1016/j.cca.2015.04.026
48. Devaraj S, Singh U, Jialal I. The evolving role of C-reactive protein in atherothrombosis. Clin Chem. (2009) 55:229–38. doi: 10.1373/clinchem.2008.108886
49. Saboori S, Shab-Bidar S, Speakman J, Yousefi Rad E, Djafarian K. Effect of vitamin E supplementation on serum C-reactive protein level: a meta-analysis of randomized controlled trials. Eur J Clin Nutr. (2015) 69:867–73. doi: 10.1038/ejcn.2015.6
50. Freedman J, Keaney J. Vitamin E inhibition of platelet aggregation is independent of antioxidant activity. J Nutr. (2001) 131:374S–7S. doi: 10.1093/jn/131.2.374S
51. Ricciarelli R, Tasinato A, Clément S, Özer N, Boscoboinik D, Azzi A. Alpha-Tocopherol specifically inactivates cellular protein kinase C α by changing its phosphorylation state. Biochem J. (1998) 334:243–9. doi: 10.1042/bj3340243
52. Venugopal S, Devaraj S, Yang T, Jialal I. Alpha-tocopherol decreases superoxide anion release in human monocytes under hyperglycemic conditions via inhibition of protein kinase C-α. Diabetes. (2002) 51:3049–54. doi: 10.2337/diabetes.51.10.3049
53. Nagao M, Moriyama Y, Yamagishi K, Iso H, Tamakoshi A. Relation of serum alpha and gamma-tocopherol levels to cardiovascular disease-related mortality among japanese men and women. J Epidemiol. (2012) 22:402–10. doi: 10.2188/jea.je20120002
54. Traber M, Leonard S, Ebenuwa I. Absorption of vitamin E in humans: an update. Am J Clin Nutr. (2019) 110:1153–64. doi: 10.1093/ajcn/nqz172
55. Reboul E. Vitamin E bioavailability: mechanisms of intestinal absorption in the spotlight. Antioxidants. (2017) 22:95. doi: 10.3390/antiox6040095
56. Arai H, Kono N. α-Tocopherol transfer protein (α-TTP). Free Radic Biol Med. (2021) 176:162–75. doi: 10.1016/j.freeradbiomed.2021.09.021
57. Ulatowski L, Dreussi C, Noy N, Barnholtz-Sloan J. Expression of the α-tocopherol transfer protein gene is regulated by oxidative stress and common single-nucleotide polymorphisms. Free Radic Biol Med. (2012) 53:2318–26. doi: 10.1016/j.freeradbiomed.2012.10.528
58. Szewczyk K, Bryś J, Górnicka M. Nutritional status of Vitamin E and its association with metabolic health in adults. Nutrients. (2025) 17:408. doi: 10.3390/nu17030408
59. Berardesca E, Cameli N. Vitamin E supplementation in inflammatory skin diseases. Dermatol Ther. (2021) 34:e15160. doi: 10.1111/dth.15160
60. Gey K, Puska P, Jordan P, Moser U. Inverse correlation between plasma vitamin E and mortality from ischemic heart disease in cross-cultural epidemiology. Am J Clin Nutr. (1991) 53:326S–34S. doi: 10.1093/ajcn/53.1.326S
61. Riemersma R, Wood D, Oliver M, Elton R, Macintyre C, Gey K. Risk of angina pectoris and plasma concentrations of vitamins A, C, and E and carotene. Lancet. (1991) 337:1–5. doi: 10.1016/0140-6736(91)93327-6
62. Buijsse B, Feskens E, Schlettwein-Gsell D, Ferry M, Kok F, Kromhout D, et al. Plasma carotene and α-tocopherol in relation to 10-y all-cause and cause-specific mortality in European elderly: the Survey in Europe on nutrition and the elderly, a concerted action (SENECA). Am J Clin Nutr. (2005) 82:879–86. doi: 10.1093/ajcn/82.4.879
63. Evans R, Shaten B, Day B, Kuller L. Prospective association between lipid soluble antioxidants and coronary heart disease in men: the multiple risk factor intervention trial. Am J Epidemiol. (1998) 147:180–6. doi: 10.1093/oxfordjournals.aje.a009435
64. Silva Y, Martins C, Cattafesta M, et al. Cut-off values of the conicity index for cardiovascular risk assessment and abdominal obesity in the Brazilian population. Nutrition. (2025) 139:112853. doi: 10.1016/j.nut.2025.112853
65. Silva I, Mello A, Sanches L. Is plasma alpha-tocopherol associated with electronegative LDL in obese adolescents? J Nutr Sci Vitaminol. (2013) 59:100–7. doi: 10.3177/jnsv.59.100
66. Botella-Carretero J, Balsa J, Vázquez C, Peromingo R. Retinol and alpha-tocopherol in morbid obesity and nonalcoholic fatty liver disease. Obes Surg. (2010) 20:69–76. doi: 10.1007/s11695-008-9686-5
67. Gunanti I, Marks G, Al-Mamun A, Long K. Low serum concentrations of carotenoids and vitamin E are associated with high adiposity in Mexican-American children. J Nutr. (2014) 144:489–95. doi: 10.3945/jn.113.183137
68. Landrier J, Marcotorchino J, Tourniaire F. Lipophilic micronutrients and adipose tissue biology. Nutrients. (2012) 4:1622–49. doi: 10.3390/nu4111622
69. Mirmiran P, Hosseini-Esfahani F, Esfandiar Z, Hosseinpour-Niazi S, Azizi F. Associations between dietary antioxidant intakes and cardiovascular disease. Sci Rep. (2022) 12:1504. doi: 10.1038/s41598-022-05632-x
70. Dietrich M, Jacques P, Pencina M, Lanier K, Keyes M, Kaur G, et al. Vitamin E supplement use and the incidence of cardiovascular disease and all-cause mortality in the Framingham heart study: does the underlying health status play a role? Atherosclerosis. (2009) 205:549–53. doi: 10.1016/j.atherosclerosis.2009.01.002
71. Instituto Brasileiro de Geografia e Estatística (IBGE). Pesquisa Nacional de Saúde: 2019: Atenção Primária à Saúde e Informações Antropométricas: Brasil [National Health Survey: 2019: Primary Health Care and anthropometric information: Brazil]. Rio de Janeiro: IBGE (2020). p. 1–66. Portuguese.
72. Brasil, Ministério da Saúde. Vigitel Brasil 2023: vigilância de fatores de Risco e Proteção Para Doenças Crônicas Por Inquérito Telefônico: estimativas Sobre Frequência e Distribuição Sociodemográfica de Fatores de risco e Proteção Para Doenças crônicas nas capitais dos 26 Estados Brasileiros e no Distrito Federal em 2023 [Vigitel Brasil 2023: Surveillance of Risk and Protective factors for Chronic Diseases by Telephone Survey: Estimates on the Frequency and Sociodemographic Distribution of Risk and Protective Factors for Chronic Diseases in the Capitals of the 26 Brazilian States and the Federal District in 2023]. (2023). Portuguese. Available online at: http://www.saude.gov.br/svs (accessed March 15, 2024).
Keywords: diet, vitamin E, obesity, inflammation, heart disease risk factors
Citation: Mota ACCC, da Cruz Carvalho MC, Bona MD, de Souza Marinho do Nascimento D, de Sousa INF, de Oliveira PG, de Oliveira Andrade ED, da Silva Ribeiro KD and Maciel BLL (2025) Alpha-tocopherol serum concentrations and its relationship with anthropometric, biochemical, dietary and cardiovascular risk parameters. Front. Nutr. 12:1659286. doi: 10.3389/fnut.2025.1659286
Received: 03 July 2025; Accepted: 22 September 2025;
Published: 10 October 2025.
Edited by:
Shi-Nan Wu, Xiamen University, ChinaReviewed by:
Wei-Zhe Liang, Kaohsiung Veterans General Hospital, TaiwanMilos Milosavljevic, University of Kragujevac, Serbia
Wenyuan Liu, The Affiliated Women and Children’s Hospital of Ningbo University, China
Kacper Szewczyk, Warsaw University of Life Sciences, Poland
Copyright © 2025 Mota, da Cruz Carvalho, Bona, de Souza Marinho do Nascimento, de Sousa, de Oliveira, de Oliveira Andrade, da Silva Ribeiro and Maciel. This is an open-access article distributed under the terms of the Creative Commons Attribution License (CC BY). The use, distribution or reproduction in other forums is permitted, provided the original author(s) and the copyright owner(s) are credited and that the original publication in this journal is cited, in accordance with accepted academic practice. No use, distribution or reproduction is permitted which does not comply with these terms.
*Correspondence: Bruna Leal Lima Maciel, YnJ1bmEubWFjaWVsQHVmcm4uYnI=